Symposium Talk on Origin of Magnetic and Strong Force in Relativistic Kinematics, David C Lush

THE ASTROPHYSICAL JOURNAL SUPPLEMENT SERIES, 229:8 (8pp), 2017PREPRINT TYPESET USING LATEX STYLE EMULATEAPJ
Kinematics of Magnetic Bright Features in the Solar Photosphere
S. Jafarzadeh1, S. K. Solanki2,3, R. H. Cameron2, P. Barthol2, J. Blanco Rodríguez4, J. C. del Toro Iniesta5, A. Gandorfer2,L. Gizon2,6, J. Hirzberger2, M. Knölker7,10, V. Martínez Pillet8, D. Orozco Suárez5, T. L. Riethmüller2, W. Schmidt9, and
M. van Noort21 Institute of Theoretical Astrophysics, University of Oslo, P.O. Box 1029 Blindern, N-0315 Oslo, Norway; [email protected]
2 Max Planck Institute for Solar System Research, Justus-von-Liebig-Weg 3, 37077 Göttingen, Germany3 School of Space Research, Kyung Hee University, Yongin, Gyeonggi 446-701, Republic of Korea
4 Grupo de Astronomía y Ciencias del Espacio, Universidad de Valencia, 46980 Paterna, Valencia, Spain5 Instituto de Astrofísica de Andalucía (CSIC), Apartado de Correos 3004, E-18080 Granada, Spain
6 Institut für Astrophysik, Georg-August-Universität Göttingen, Friedrich-Hund-Platz 1, 37077 Göttingen, Germany7 High Altitude Observatory, National Center for Atmospheric Research, P.O. Box 3000, Boulder, CO 80307-3000, USA
8 National Solar Observatory, 3665 Discovery Drive, Boulder, CO 80303, USA9 Kiepenheuer-Institut für Sonnenphysik, Schöneckstr. 6, D-79104 Freiburg, Germany
Received 2016 July 20; revised 2016 September 15; accepted 2016 October 24; published 2017 March 22
AbstractConvective flows are known as the prime means of transporting magnetic fields on the solar surface. Thus,small magnetic structures are good tracers of the turbulent flows. We study the migration and dispersal of mag-netic bright features (MBFs) in intergranular areas observed at high spatial resolution with SUNRISE/IMaX.We describe the flux dispersal of individual MBFs as a diffusion process whose parameters are computed forvarious areas in the quiet Sun and the vicinity of active regions from seeing-free data. We find that magneticconcentrations are best described as random walkers close to network areas (diffusion index, γ = 1.0), travelerswith constant speeds over a supergranule (γ = 1.9 − 2.0), and decelerating movers in the vicinity of flux emer-gence and/or within active regions (γ = 1.4 − 1.5). The three types of regions host MBFs with mean diffusioncoefficients of 130 km2 s−1, 80 − 90 km2 s−1, and 25 − 70 km2 s−1, respectively. The MBFs in these three typesof regions are found to display a distinct kinematic behavior at a confidence level in excess of 95%.
Key words: methods: observational – Sun: magnetic fields – Sun: photosphere
1. IntroductionThe kinematics of magnetic structures play an essential
role in heating the upper solar atmosphere, e.g., by generat-ing magnetohydrodynamic (MHD) waves (Jafarzadeh et al.2013, 2017), or by braiding the field lines through the non-oscillatory motions of their footpoints (Parker 1972, 1983,1988). Both of these processes are produced by interactionsbetween magnetic flux tubes with their surrounding plasmaand their characteristics vary in different solar regions. Inaddition, various magnetic environments have been shownto strongly influence the embedded flows depending on theirlevel of magnetic flux (Ji et al. 2016). In the quiet-Sun in-ternetwork, advection of flux concentrations is described asa superposition of a random component, caused by inter-granular turbulence and granular evolution, on a systematicdrift due to the large-scale motions of granules, mesogran-ules, and supergranules (e.g., Manso Sainz et al. 2011; Ja-farzadeh et al. 2014a). In network areas, the oppositely di-rected inflows from neighboring supergranules appear to trapmagnetic elements in sinks, so that they are expected not tomove freely (Orozco Suárez et al. 2012).
The motion of magnetic features is often described by dif-fusion processes whose “index” and “coefficient” (see belowfor definitions) provide information on how fast a structuremoves from its initial position and on the rate of increase inarea that a feature sweeps in time, respectively. Hence, thelarger a diffusion index (γ) is, the faster the magnetic elementmoves away, so that the magnetic flux is spread to a largerextent by the turbulent flows. Del Moro et al. (2015), how-
10 The National Center for Atmospheric Research is sponsored by theNational Science Foundation.
ever, claimed that the diffusion parameters, determined fromthe displacement of magnetic elements, may not necessarilycorrespond to a turbulent regime.
Magnitudes of diffusion parameters describe various diffu-sivity regimes (e.g., Abramenko et al. 2011; Jafarzadeh et al.2014a) such as (1) γ = 1, the so-called normal diffusion, wheremagnetic elements are randomly advected around (randomwalkers) and the diffusion coefficient (D) is independent oftemporal and spatial scales; (2) γ < 1, the sub-diffusive pro-cess, where features are trapped at so-called stagnation points(sinks of flow field) and D is anti-correlated with both timeand length scales; and (3) γ > 1, the super-diffusive case, in-dicating regions where small structures quickly move awayfrom their first location (D grows with scales both in timeand in length). Magnetic elements in the latter regime aretransported with a negative acceleration when γ < 2, with aconstant average speed for γ = 2 (known as “ballistic” diffu-sion), and with a positive acceleration when γ > 2 (the super-ballistic branch). We note that these characteristics describethe flow field displacing the magnetic features horizontallyrather than the structure of magnetic elements.
Moreover, diffusion coefficients in the solar atmospherehave been shown to be inversely related to the size and fieldstrength of magnetic concentrations (Schrijver 1989; Schri-jver et al. 1996). Thus, different magnetic environments onthe solar surface, hosting a variety of magnetic features witha variety of properties (Borrero et al. 2015), may representdifferent diffusivity behavior.
Most of the previous measurements of diffusion parame-ters are either focused on magnetic elements in the quiet-Sun or are based on relatively low spatial/temporal resolutionobservations. It is only recently that meter-class telescopes
arX
iv:1
610.
0763
4v2
[as
tro-
ph.S
R]
29
Mar
201
7
2 JAFARZADEH ET AL.
(such as NST at the Big Bear Solar Observatory (Goode et al.2010), the Swedish Solar Telescope (Scharmer et al. 2003),the broad-band imager on GREGOR (Schmidt et al. 2012),and the SUNRISE balloon-borne solar observatory (Solankiet al. 2010)) have provided us such information at high spa-tial resolution. However, only values from the last mentionedobservatory are not affected by differential seeing-induced de-formations that consequently introduce artificial turbulence ina time series of solar images. Jafarzadeh et al. (2014a) studieddiffusivity of magnetic bright points observed in the Ca II Hpassband of the SUNRISE telescope. Their study was, how-ever, limited to the quiet-Sun and to observations samplingheights corresponding to the temperature minimum and/orlow chromosphere. For a review of diffusion parameters ofsmall magnetic elements in the literature, we refer the readerto Jafarzadeh et al. (2014a) (hereafter Paper I), who also sum-marized some of those values in Table 3 of their paper.
In the present study, we aim to characterize the statisticalproperties of the proper motion of individual trajectories ofmagnetic bright features (MBFs), which is necessary in orderto determine whether the action of the flow on the magneticstructures can be interpreted as a turbulent diffusivity and howthe action of the flow depends on the amounts of magnetic fluxharbored in different regions. To this end, we borrow some ofthe language of turbulent diffusivity in order to characterizethe individual trajectories. Thus, we determine diffusion pa-rameters for individual MBFs in various solar regions withdifferent levels of magnetic activity. We use seeing-free ob-servations with high spatial and temporal resolution obtainedwith the SUNRISE balloon-borne observatory (Section 2). Weanalyze trajectories of MBFs in areas with different amountsof magnetic flux and different types of features (Section 3)and discuss their diffusion parameters to describe their vari-ous plasma environments (Section 4).
2. Observational DataOur analysis is based on two data sets recorded with the
Imaging Magnetograph eXperiment (IMaX; Martínez Pilletet al. 2011) on board the SUNRISE balloon-borne solar obser-vatory (Barthol et al. 2011; Berkefeld et al. 2011; Gandorferet al. 2011), from its first and second flights in 2009 and 2013(hereafter, SUNRISE-I and SUNRISE-II, respectively Solankiet al. 2010, 2017).
The SUNRISE/IMaX, which is a Fabry–Pérot based instru-ment, recorded the full Stokes vector (I, Q, U , and V ) ofthe magnetically sensitive line Fe I 5250.2 Å (with a single-wavelength noise level of ≈ 3×10⁻³ in the unit of the StokesI continuum, after phase-diversity reconstruction during the2009 flight). The images obtained during the 2009 flight, onaverage, cover a field-of-view (FOV) of (45× 45) arcsec2 onthe solar surface with a scale of ≈ 0.0545 arcsec/pixel, while2013 images have a useful FOV of (51×51) arcsec2.
The data acquired on 2009 June 9 (between 01:32 and 01:58UT) samples a quiet-Sun area close to disk center, includingboth network and internetwork regions. The time series of im-ages were obtained with a rate of 33 s and the Stokes param-eters were recorded in five wavelength positions at±40,±80,and +227 mÅ from the line center, of which the latter repre-sents a continuum image (see Jafarzadeh et al. 2014b for theformation heights).
The second dataset, from SUNRISE-II (obtained on 2013June 12; 23:39-23:55 UT) provided us with high-resolution
observations of an active region close to the solar disk cen-ter (AR 11768 at a heliocentric angle µ=0.93) that includes asmall quiet area, a flux-emergence region, diverse pores, andplage areas. This image sequence has a cadence of 36.5 s andsamples the Fe I 5250.2 Å line at seven wavelength positionsinside the line (at 0,±40,±80,±120 mÅ from the line center)and one at +227 mÅ in the continuum.
The Stokes I continuum images are the primary data sets forthe present study, in which the motion of small MBFs near thebase of the photosphere is investigated. In addition, we usethe “line-core” images and circular polarization (CP) maps tofacilitate identification of MBFs and to inspect their magneticnature, respectively. Since we have no observations at the linecenter of Fe I 5250.2 Å from the 2009 flight, we form theline core by averaging the two closest wavelength positionsaround the line center (which is a combination of the line coreand the line’s inner flanks). These line-core images (with arelatively large contrast) are used to ease detection of MBF inStokes I continuum images. Maps of circular polarization, orCP, are formed as an unsigned average of four inline positionsin Stokes V (the closest two positions at each side of the linecenter; at ±80 and ±40 mÅ from the center of Fe I 5250.2 Åline), essentially as described in Jafarzadeh et al. (2014b). Thelatter integration increases the signal-to-noise ratio (S/N) byapproximately a factor of two.
Our intention is to investigate the dispersal of MBFs in var-ious solar regions with different levels and types of magneticactivity, that are provided by the two flights of the SUNRISEobservatory.
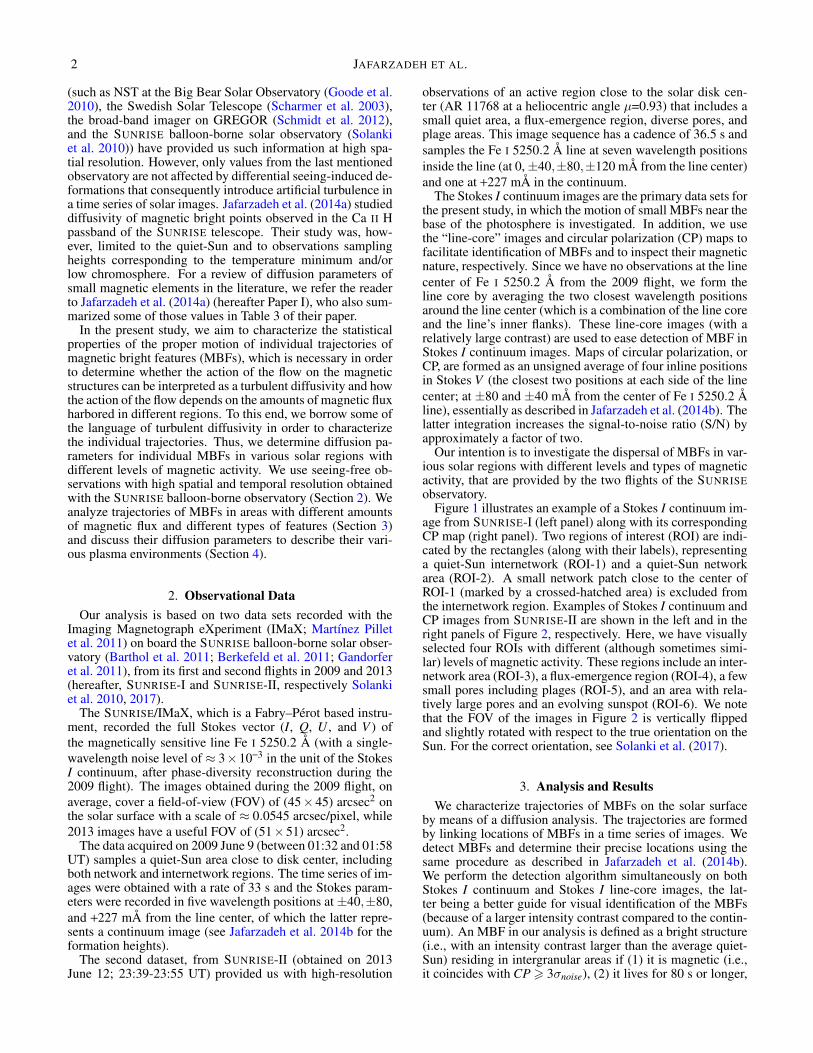
Figure 1 illustrates an example of a Stokes I continuum im-age from SUNRISE-I (left panel) along with its correspondingCP map (right panel). Two regions of interest (ROI) are indi-cated by the rectangles (along with their labels), representinga quiet-Sun internetwork (ROI-1) and a quiet-Sun networkarea (ROI-2). A small network patch close to the center ofROI-1 (marked by a crossed-hatched area) is excluded fromthe internetwork region. Examples of Stokes I continuum andCP images from SUNRISE-II are shown in the left and in theright panels of Figure 2, respectively. Here, we have visuallyselected four ROIs with different (although sometimes simi-lar) levels of magnetic activity. These regions include an inter-network area (ROI-3), a flux-emergence region (ROI-4), a fewsmall pores including plages (ROI-5), and an area with rela-tively large pores and an evolving sunspot (ROI-6). We notethat the FOV of the images in Figure 2 is vertically flippedand slightly rotated with respect to the true orientation on theSun. For the correct orientation, see Solanki et al. (2017).
3. Analysis and ResultsWe characterize trajectories of MBFs on the solar surface
by means of a diffusion analysis. The trajectories are formedby linking locations of MBFs in a time series of images. Wedetect MBFs and determine their precise locations using thesame procedure as described in Jafarzadeh et al. (2014b).We perform the detection algorithm simultaneously on bothStokes I continuum and Stokes I line-core images, the lat-ter being a better guide for visual identification of the MBFs(because of a larger intensity contrast compared to the contin-uum). An MBF in our analysis is defined as a bright structure(i.e., with an intensity contrast larger than the average quiet-Sun) residing in intergranular areas if (1) it is magnetic (i.e.,it coincides with CP > 3σnoise), (2) it lives for 80 s or longer,

KINEMATICS OF MAGNETIC BRIGHT FEATURES IN THE SOLAR PHOTOSPHERE 3
700 800 900 1000 1100 1200
Stokes I continuum [arb. unit]
0 10 20 30 40
[arcsec]
0
10
20
30
40
[arc
sec]
2
1
−6 −4 −2 0 2 4
CP [%]
0 10 20 30 40
[arcsec]
2
1
Figure 1. : Examples of SUNRISE/IMaX Stokes I continuum (left) and averaged Stokes V /Ic (CP; right) images from observationsin 2009. The rectangles outline the two regions of interest (ROI) in this time series: an internetwork (ROI-1) and a network(ROI-2) area. The cross-hatched rectangle indicates a network patch excluded from ROI-1.
and (3) it has a roughly circular shape (to avoid apparentlyconnected or merged magnetic elements), and does not showinteractions with other magnetic features (including mergingand/or splitting) during the course of its lifetime. Unlike inPaper I, we are not setting a size threshold on MBFs. How-ever, features with a strongly non-uniform brightness struc-tures are excluded during our visual identification. The latterstructures have been shown to increase uncertainty in measur-ing the locations of features.
The location of MBFs is determined with an accuracy of0.05 pixel, i.e., 2 km. In accordance with a discussion byJafarzadeh et al. (2014b), we, however, consider a more con-servative uncertainty of 0.5 pixel (19 km), which takes theeffects of temporal size and intensity variation of the featuresinto account. The detected features are then tracked in imagesequences using the approach introduced by Jafarzadeh et al.(2013).
3.1. Diffusion AnalysisMagnetic features in the solar photosphere, and in particular
our detected MBFs, can be considered as “fluid particles” ina Lagrangian approach, transported by turbulent flows. In theLagrangian method, the particles’ velocities are determinedby tracking and together form a velocity field. Analysis ofthe velocity field provides statistical properties of the flow inwhich the particles are embedded (Monin & Iaglom 1975).According to this approach, the Lagrangian form of the dif-fusion process is described as 〈sd〉 ∝ τγ , where the exponentγ represents the diffusion index and 〈sd〉 is the mean squaredisplacement of all features from their initial locations at timeτ .
The mean square displacement cannot, however, providefull information about the dynamics of a system that poten-tially accommodates more than one type of motion, hence, itdoes not identify them clearly as separate processes (see, e.g.,Dybiec & Gudowska-Nowak 2009). From a simple simula-tion in Paper I, it was shown that an MBF in an internetworkarea may have motions with positive, zero, or negative ac-celeration, depending on its location on a supergranule withrespect to the supergranular boundaries. Hence, it is essentialto separately perform the diffusion analysis on individual tra-jectories, which can provide proper insight into their motioncharacteristics. For recent papers based on the latter approach(i.e., diffusion index of individual MBFs) see, e.g., Jafarzadehet al. (2014a), Keys et al. (2014), and Yang et al. (2015a). Fol-lowing Yang et al. (2015a), we call this method distribution ofdiffusion indices (DDI) henceforth.
Since the present work is aimed at characterizing the statis-tical properties of the individual trajectories, we use the DDIapproach, which borrows some of the language of turbulentdiffusivity. Thus, the diffusion process of individual tracers inthe present study is simply described by
sd(τ ) = C τγ , (1)
where C is the constant of proportionality from which the dif-fusion coefficient (D) is calculated
D(τ ) =γ
4τC τγ . (2)
In practice, we measure γ and C from the slope and y-intercept of the least-squares fit to the log-log plot of the sd(τ )
4 JAFARZADEH ET AL.
2000 2500 3000 3500 4000 4500 5000
Stokes I continuum [arb. unit]
0 10 20 30 40 50
[arcsec]
0
10
20
30
40
50
[arc
sec]
3
4
5
6
−20 −10 0 10 20
CP [%]
0 10 20 30 40 50
[arcsec]
3
4
5
6
Figure 2. : Same as Figure 1, but made from observations in 2013. The rectangles mark four ROIs, including a quiet-Sun internet-work (ROI-3), an area with flux emergence and plages (ROI-4), small pores and plage (ROI-5), and a region with large pores anda high magnetic flux density (ROI-6).
of individual MBFs, respectively. Thus the lifetime of eachMBF is considered as the timescale τ . For further details ofour diffusion analysis as well as examples of various diffusionregimes, we refer the reader to Section 3.2 of Paper I.
We note that the difference between diffusion parameterscalculated using the Lagrangian method (i.e., with γ deter-mined from the average of displacements of individual MBFs)and the DDI method (which is based on the mean of diffu-sion indices of individual MBFs) has been extensively com-pared and discussed by Yang et al. (2015a), who have shownthat the diffusion parameters resulting from the two methodsare similar, although slightly different. Yang et al. (2015a)showed that the Lagrangian approach results in a smaller γ,but a larger D compared to those calculated from the DDImethod. They found that the differences of the γ and D valuesfrom the two approaches were smaller than 20% and 30%, re-spectively. A comparison between diffusion indices of severalG-band bright points (GBPs) with different characteristics hasbeen provided by Yang et al. (2015b) by over-plotting sd(τ )of the GBPs as well as their mean square displacement versusτ in the same figure.
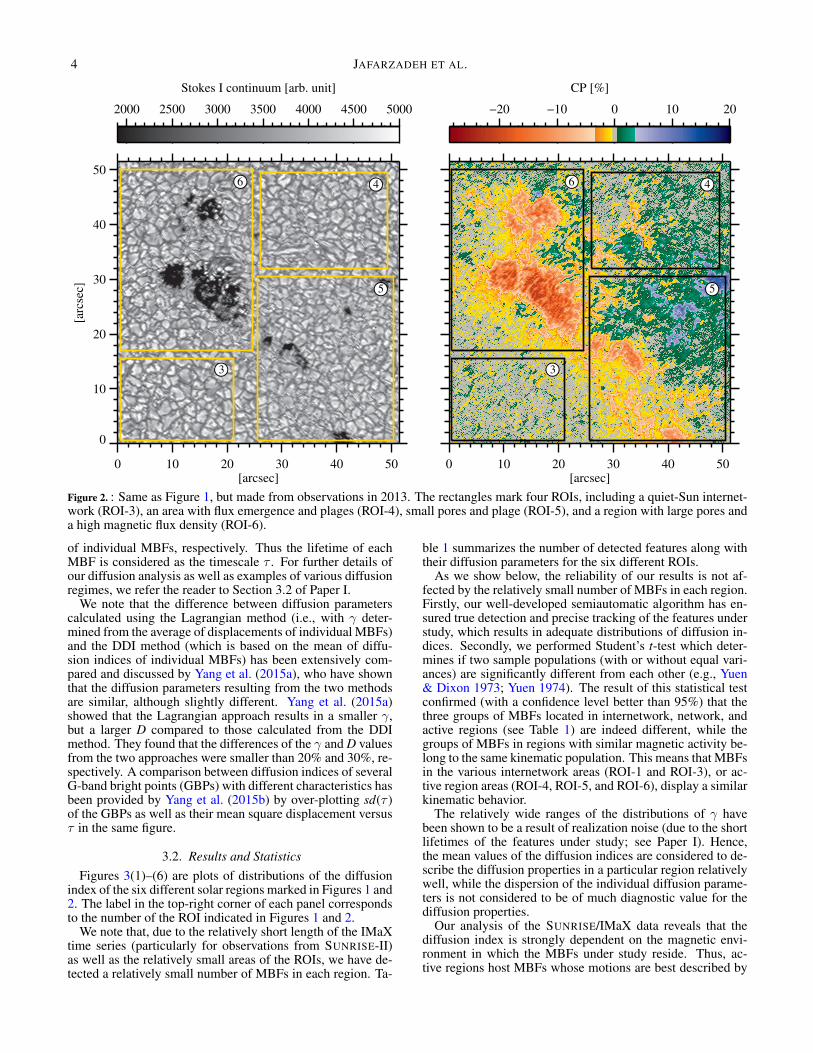
3.2. Results and StatisticsFigures 3(1)–(6) are plots of distributions of the diffusion
index of the six different solar regions marked in Figures 1 and2. The label in the top-right corner of each panel correspondsto the number of the ROI indicated in Figures 1 and 2.
We note that, due to the relatively short length of the IMaXtime series (particularly for observations from SUNRISE-II)as well as the relatively small areas of the ROIs, we have de-tected a relatively small number of MBFs in each region. Ta-
ble 1 summarizes the number of detected features along withtheir diffusion parameters for the six different ROIs.
As we show below, the reliability of our results is not af-fected by the relatively small number of MBFs in each region.Firstly, our well-developed semiautomatic algorithm has en-sured true detection and precise tracking of the features understudy, which results in adequate distributions of diffusion in-dices. Secondly, we performed Student’s t-test which deter-mines if two sample populations (with or without equal vari-ances) are significantly different from each other (e.g., Yuen& Dixon 1973; Yuen 1974). The result of this statistical testconfirmed (with a confidence level better than 95%) that thethree groups of MBFs located in internetwork, network, andactive regions (see Table 1) are indeed different, while thegroups of MBFs in regions with similar magnetic activity be-long to the same kinematic population. This means that MBFsin the various internetwork areas (ROI-1 and ROI-3), or ac-tive region areas (ROI-4, ROI-5, and ROI-6), display a similarkinematic behavior.
The relatively wide ranges of the distributions of γ havebeen shown to be a result of realization noise (due to the shortlifetimes of the features under study; see Paper I). Hence,the mean values of the diffusion indices are considered to de-scribe the diffusion properties in a particular region relativelywell, while the dispersion of the individual diffusion parame-ters is not considered to be of much diagnostic value for thediffusion properties.
Our analysis of the SUNRISE/IMaX data reveals that thediffusion index is strongly dependent on the magnetic envi-ronment in which the MBFs under study reside. Thus, ac-tive regions host MBFs whose motions are best described by
KINEMATICS OF MAGNETIC BRIGHT FEATURES IN THE SOLAR PHOTOSPHERE 5
0.2
0.4
0.6
0.8
1.0N
orm
aliz
ed fr
eque
ncy
1 2 3
Diffusion Index (γ)0 1 2 3 4 5
Diffusion Index (γ)
0.2
0.4
0.6
0.8
1.0
Nor
mal
ized
freq
uenc
y
4
Diffusion Index (γ)0 1 2 3 4 5
Diffusion Index (γ)
5
Diffusion Index (γ)0 1 2 3 4 5
Diffusion Index (γ)
6
Figure 3. : Distributions of diffusion index of magnetic bright features observed in the six regions of interest from SUNRISE/IMaX,here labeled 1–6 in accordance with the labeling given to them in Figures 1 and 2. The vertical lines indicate mean values of thehistograms. The histograms are normalized to their maximum values.
a super-diffusive, but sub-ballistic, regime (γ ≈ 1.4 − −1.5).The latter correspond to a decelerating motion, according tothe sd(τ )∝ τγ relationship. The MBFs within supergranules(i.e., in internetwork areas) are found to have a diffusion indexon the order of 2, meaning motions with roughly constant ve-locities. Finally, features detected around the network patchin ROI-2 (in Figure 1) are best described as random walkers(i.e., normal diffusion; γ ≈ 1).
The diffusion coefficients, as summarized in Table 1, havethe smallest values for MBFs detected in the active re-gion (D ≈ 25 − 70 km2 s−1). Interestingly, these values de-crease with the level of activity, having the smallest valueof 25 km2 s−1 in ROI-6 around the big pore (see Figure 2),a mean value of 40 km2 s−1 around the small pores in ROI-5, and the largest values compared to the other two ROIs inthe active region in ROI-4 (D ≈ 70 km2 s−1; including plageand flux-emergence events). The internetwork features havea diffusion coefficient of 80-90 km2 s−1. The MBFs aroundthe network patch in ROI-2 have a value of 130 km2 s−1, thelargest among the regions studied here. The latter implies thatthe random walkers sweep the largest area per unit time, com-pared to those moving in a preferred direction.
The diffusion coefficients have rather wide distributionswith relatively large standard deviations (see Tabel 1). Thisis, however, not surprising, since D has been shown to be de-pendent on spatial and temporal scales (e.g., Abramenko et al.2011; Giannattasio et al. 2013; Jafarzadeh et al. 2014a). Thus,with a wide range of lifetimes of the MBFs under study, awide range of D values are obtained. The rather small FOVof the ROIs under study excludes the effect of large spatialscales on D.
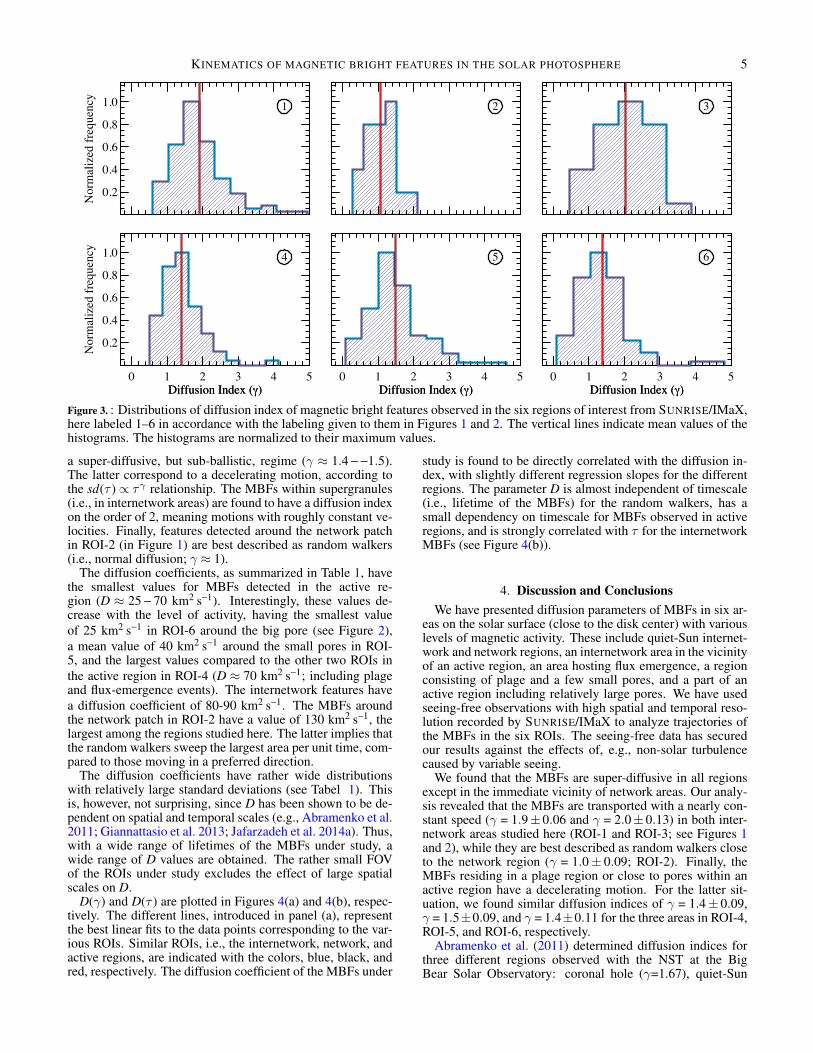
D(γ) and D(τ ) are plotted in Figures 4(a) and 4(b), respec-tively. The different lines, introduced in panel (a), representthe best linear fits to the data points corresponding to the var-ious ROIs. Similar ROIs, i.e., the internetwork, network, andactive regions, are indicated with the colors, blue, black, andred, respectively. The diffusion coefficient of the MBFs under
study is found to be directly correlated with the diffusion in-dex, with slightly different regression slopes for the differentregions. The parameter D is almost independent of timescale(i.e., lifetime of the MBFs) for the random walkers, has asmall dependency on timescale for MBFs observed in activeregions, and is strongly correlated with τ for the internetworkMBFs (see Figure 4(b)).
4. Discussion and ConclusionsWe have presented diffusion parameters of MBFs in six ar-
eas on the solar surface (close to the disk center) with variouslevels of magnetic activity. These include quiet-Sun internet-work and network regions, an internetwork area in the vicinityof an active region, an area hosting flux emergence, a regionconsisting of plage and a few small pores, and a part of anactive region including relatively large pores. We have usedseeing-free observations with high spatial and temporal reso-lution recorded by SUNRISE/IMaX to analyze trajectories ofthe MBFs in the six ROIs. The seeing-free data has securedour results against the effects of, e.g., non-solar turbulencecaused by variable seeing.
We found that the MBFs are super-diffusive in all regionsexcept in the immediate vicinity of network areas. Our analy-sis revealed that the MBFs are transported with a nearly con-stant speed (γ = 1.9± 0.06 and γ = 2.0± 0.13) in both inter-network areas studied here (ROI-1 and ROI-3; see Figures 1and 2), while they are best described as random walkers closeto the network region (γ = 1.0± 0.09; ROI-2). Finally, theMBFs residing in a plage region or close to pores within anactive region have a decelerating motion. For the latter sit-uation, we found similar diffusion indices of γ = 1.4± 0.09,γ = 1.5±0.09, and γ = 1.4±0.11 for the three areas in ROI-4,ROI-5, and ROI-6, respectively.
Abramenko et al. (2011) determined diffusion indices forthree different regions observed with the NST at the BigBear Solar Observatory: coronal hole (γ=1.67), quiet-Sun

6 JAFARZADEH ET AL.
Table 1: Diffusion Parameters of Magnetic Bright Features Observed in Various Solar Regions by SUNRISE/IMaX.
ROI a Number of Diffusion Index, γ Diffusion Coefficient, D [km2 s−1]
Description No. Features (n) Mean σ d σMe Mean (km2 s−1) σ d (km2 s−1) σM
e (km2 s−1)
Internetwork1 121 1.9 0.7 0.06 79 170 15
3 31 2.0 0.7 0.13 92 211 38
Network 2 21 1.0 0.4 0.09 127 238 52
ActiveRegions
4 33 1.4 0.5 0.09 67 118 21
5 57 1.5 0.7 0.09 40 121 16
6 42 1.4 0.7 0.11 24 81 12
Notes.a Region of interest, with numbers labeled in Figures 1 and 2.d Standard deviation of distributions.e Uncertainty in the mean values (i.e., σ/
√n).
101
102
103
104
Diff
usio
n co
effic
ient
, D [k
m2 /s]
Diffusion index, γ1 2 3 4
ROI−1ROI−2ROI−3
ROI−1ROI−2ROI−3
ROI−4ROI−5ROI−6
ROI−4ROI−5ROI−6
(a)
101
102
Diff
usio
n co
effic
ient
, D [k
m2 /s]
Timescale, τ [sec]100 1000
(b)
Figure 4. : Log-log plots of diffusion coefficient, D, as a func-tion of diffusion index, γ (a), and as a function of timescale,τ (b) for the six regions of interest (ROI) identified by thenumbers labeled in Figures 1 and 2. The linear fits to thedata points for the various ROIs are shown with different linestyles and colors introduced in panel (a).
(γ=1.53), and plage (γ=1.48). They provided snapshots ofcoronal hole and quiet-Sun areas that clearly represent an in-ternetwork and a network region, respectively. In fact, most ofthe trajectories they have depicted on their “quiet-Sun” imageoverlap with network field concentrations. Thus, in a generalagreement with our findings, they also found that the diffu-sion index decreases from the internetwork (their most quiet-Sun region) toward the more active plage areas. The valuefor their network magnetic elements is, however, relativelylarge and does not describe random walkers (or features inthe sub-diffusive regime), which are expected for areas withstagnation points.
Keys et al. (2014) reported an average diffusion index of 1.2for both quiet-Sun internetwork and active regions, which issmaller than those we obtained for regions with similar levelsof magnetic flux. Yang et al. (2015a) found γ values of 1.53and 1.79 for migration of GBPs observed with Hinode/BFI inan active region and a quiet area, respectively. Their active-region value agrees with that determined in this study.
The mean γ value of our network MBFs is comparable withthose found by, e.g., Cadavid et al. (1999) (γ=0.76–1.10, de-pending on timescales), Lawrence et al. (2001) (γ=1.13), andGiannattasio et al. (2014) (γ=1.08-1.27 for different scales)in network areas. Larger diffusion indices have also beenreported for network regions by, e.g., Berger et al. (1998)(γ=1.34). Our internetwork γ value is larger than those re-ported in the literature. In addition to those mentioned above,examples of diffusion indices of internetwork magnetic fea-tures are γ=1 (Utz et al. 2010), γ=0.96 (Manso Sainz et al.2011), γ=1.59 (Chitta et al. 2012), γ=1.20–1.34 (for differ-ent length scales; Giannattasio et al. 2013), γ=1.69 (Paper I),and γ=1.44 (Giannattasio et al. 2014). We note that the γvalue in Paper I was determined from migration of magneticbright points in both internetwork and vicinity of network ar-eas. The mixed contributions of both internetwork and net-work regions led to the intermediate γ value of 1.69, that iscloser to the internetwork one in the present study, as the in-ternetwork covered a larger fraction of the area in the imagesequences employed in Paper I.
We also found a significant scatter of γ values obtainedfrom individual MBFs within a single type of region. We in-terpret the wide spread in parameters we obtained as the effectof realization noise (i.e., short lifetimes of the features and/orof the image sequences; based on a discussion in Paper I).
The coefficients of turbulent diffusion are found to dependon the level of magnetic activity in the ROI under study. Thus

KINEMATICS OF MAGNETIC BRIGHT FEATURES IN THE SOLAR PHOTOSPHERE 7
we obtained the smallest value (D = 25 km2 s−1) for ROI-6,which includes large pores. The values of D = 40 km2 s−1 andD = 70 km2 s−1 are obtained for the two other parts of activeregions with pores/plages and plages/flux emergence in ROI-5and ROI-4, respectively. The internetwork areas found to hostMBFs with D = 80 km2 s−1 and D = 90 km2 s−1 in ROI-1 andROI-3, respectively. The diffusion coefficient in the networkregion (ROI-2) was, however, found to be the largest value(D = 130 km2 s−1) among all regions considered in this work.This indicates that the random walkers sweep larger areas intime by randomly moving around compared to super-diffusivefeatures that migrate with a preferred direction.
A wide range of diffusion coefficients have been reported inthe literature. For recent reviews of some of these values werefer the reader to Paper I and Yang et al. (2015a). Our study,in particular, agrees with that of found by Yang et al. (2015a)who also obtained an anti-correlation between D and the levelof magnetic flux. They reported D = 78±29 for active regionsand D = 130±54 for a quiet-Sun area. Most of their quiet-Sunfeatures are located at, or close to, network regions.
We found that D is nearly independent of timescale forMBFs observed in the vicinity of network area (i.e., randomwalkers; ROI-2), whereas D has a direct correlation with τ forall the other (super-diffusive) MBFs under study. The increaseof D with timescale is faster for internetwork MBFs (seen inROI-1 and ROI-3) compared to those observed in active re-gions (i.e., in ROI-4, ROI-5, and ROI-6). Due to relativelysmall ROIs in our study, we did not inspect the correlationsbetween values of D and length scales. We also found a directrelationship between D and γ for all the six ROIs.
All the diffusion coefficients we obtained here, and in par-ticular those for the quiet-Sun internetwork, are smaller thanthat found in Paper I for internetwork Ca II H magnetic brightpoints (270 km2 s−1). The latter measurement was basedon observations in the Ca II H filter from SUNRISE/SuFI(Gandorfer et al. 2011), sampling a higher atmospheric layer(roughly corresponding to the temperature minimum) than thedata we employed in this study. Because of a decrease inmass density with height, we expect that magnetic elements(as cross sections of flux tubes) sweep larger areas in time atthe heights sampled by the SuFI Ca II H channels than those inthe lower photosphere. This is also suggested by the 2D MHDsimulations of Steiner et al. (1998), who show that the up-per parts of flux sheets swing back and forth much more thantheir lower layers when plied by the surrounding convection.Alternatively, the difference between the diffusion coefficientobtained for the Ca II H magnetic bright points in Paper Iand those found here can be the result of the anti-correlationbetween D and size of magnetic features, as was previouslyshown by Schrijver et al. (1996). In Paper I, only magneticfeatures smaller than 0.3 arcsec were analyzed, whereas nosize threshold was applied to the MBFs in this study.
The difference between the various values of the diffusionparameters, and in particular D, reported in the literature (in-cluding those we obtained in the present study) can be dueto a number of factors. These include properties of differ-ent datasets with various spatial and/or temporal resolutions,the method with which mean values are calculated, time andlength scales, the atmospheric height at which the magneticelements are sampled, size and magnetic strength of features,and the level of magnetic flux of the region hosting magneticelements. Diffusion analysis of synthesized images from 3Dradiative MHD simulations of regions with different amounts
of magnetic flux, different resolution, and sampling variousatmospheric layers can provide us with a better understandingof such variations.
The German contribution to SUNRISE and its reflight wasfunded by the Max Planck Foundation, the Strategic Inno-vations Fund of the President of the Max Planck Society(MPG), DLR, and private donations by supporting membersof the Max Planck Society, which is gratefully acknowl-edged. The Spanish contribution was funded by the Ministe-rio de Economía y Competitividad under Projects ESP2013-47349-C6 and ESP2014-56169-C6, partially using EuropeanFEDER funds. The HAO contribution was partly fundedthrough NASA grant number NNX13AE95G. This work waspartly supported by the BK21 plus program through the Na-tional Research Foundation (NRF) funded by the Ministry ofEducation of Korea. S.J. receives support from the ResearchCouncil of Norway. The National Solar Observatory (NSO)is operated by the Association of Universities for Research inAstronomy (AURA) Inc. under a cooperative agreement withthe National Science Foundation.
References
Abramenko, V. I., Carbone, V., Yurchyshyn, V., et al. 2011, ApJ, 743, 133Barthol, P., Gandorfer, A., Solanki, S. K., et al. 2011, Sol. Phys., 268, 1Berger, T. E., Loefdahl, M. G., Shine, R. S., & Title, A. M. 1998, ApJ, 495,
973Berkefeld, T., Schmidt, W., Soltau, D., et al. 2011, Sol. Phys., 268, 103Borrero, J. M., Jafarzadeh, S., Schüssler, M., & Solanki, S. K. 2015,
Space Sci. Rev., doi:10.1007/s11214Cadavid, A. C., Lawrence, J. K., & Ruzmaikin, A. A. 1999, ApJ, 521, 844Chitta, L. P., van Ballegooijen, A. A., Rouppe van der Voort, L., DeLuca,
E. E., & Kariyappa, R. 2012, ApJ, 752, 48Del Moro, D., Giannattasio, F., Berrilli, F., et al. 2015, A&A, 576, A47Dybiec, B. & Gudowska-Nowak, E. 2009, Phys. Rev. E, 80, 061122Gandorfer, A., Grauf, B., Barthol, P., et al. 2011, Sol. Phys., 268, 35Giannattasio, F., Del Moro, D., Berrilli, F., et al. 2013, ApJ, 770, L36Giannattasio, F., Stangalini, M., Berrilli, F., Del Moro, D., & Bellot Rubio,
L. 2014, ApJ, 788, 137Goode, P. R., Yurchyshyn, V., Cao, W., et al. 2010, ApJ, 714, L31Jafarzadeh, S., Cameron, R. H., Solanki, S. K., et al. 2014a, A&A, 563,
A101 (Paper I)Jafarzadeh, S., Solanki, S. K., Feller, A., et al. 2013, A&A, 549, A116Jafarzadeh, S., Solanki, S. K., Lagg, A., et al. 2014b, A&A, 569, A105Jafarzadeh, S., Solanki, S. K., Stangalini, M., et al. 2017, ApJS, 229, 10Ji, K.-F., Xiong, J.-P., Xiang, Y.-Y., et al. 2016, Research in Astronomy and
Astrophysics, 16, 009Keys, P. H., Mathioudakis, M., Jess, D. B., Mackay, D. H., & Keenan, F. P.
2014, A&A, 566, A99Lawrence, J. K., Cadavid, A. C., Ruzmaikin, A., & Berger, T. E. 2001, Phys.
Rev. Lett., 86, 5894Manso Sainz, R., Martínez González, M. J., & Asensio Ramos, A. 2011,
A&A, 531, L9Martínez Pillet, V., Del Toro Iniesta, J. C., Álvarez-Herrero, A., et al. 2011,
Sol. Phys., 268, 57Monin, A. S. & Iaglom, A. M. 1975, Statistical fluid mechanics: Mechanics
of turbulence (Cambridge, MA: MIT Press), Vol. 2Orozco Suárez, D., Katsukawa, Y., & Bellot Rubio, L. R. 2012, ApJ, 758,
L38Parker, E. N. 1972, ApJ, 174, 499Parker, E. N. 1983, ApJ, 264, 642Parker, E. N. 1988, ApJ, 330, 474Scharmer, G. B., Bjelksjo, K., Korhonen, T. K., Lindberg, B., & Petterson,
B. 2003, in SPIE Conf. Ser., Vol. 4853, Society of Photo-OpticalInstrumentation Engineers (SPIE) Conference Series, ed. S. L. Keil &S. V. Avakyan, 341
Schmidt, W., von der Lühe, O., Volkmer, R., et al. 2012, AstronomischeNachrichten, 333, 796
Schrijver, C. J. 1989, Sol. Phys., 122, 193

8 JAFARZADEH ET AL.
Schrijver, C. J., Shine, R. A., Hagenaar, H. J., et al. 1996, ApJ, 468, 921Solanki, S. K., Barthol, P., Danilovic, S., et al. 2010, ApJ, 723, L127Solanki, S. K., Riethmüller, T. L., Barthol, P., et al. 2017, ApJS, 229, 2Steiner, O., Grossmann-Doerth, U., Knölker, M., & Schüssler, M. 1998,
ApJ, 495, 468
Utz, D., Hanslmeier, A., Muller, R., et al. 2010, A&A, 511, A39Yang, Y., Ji, K., Feng, S., et al. 2015a, ApJ, 810, 88Yang, Y.-F., Qu, H.-X., Ji, K.-F., et al. 2015b, RAA, 15, 569Yuen, K. K. 1974, Biometrika, 61, 165Yuen, K. K. & Dixon, W. J. 1973, Biometrika, 60, 369