
Kinematics in Two Dimensions Chapter 3. 3.1 Displacement, Velocity, and Acceleration.
)delling cycle
-oblem
ons
)roblem
Report I
Learning objectives After studying this chapter you should be able to:
define displacement, velocity and acceleration • understand and interpret displacement—time graphs and velocity—time graphs II solve problems involving motion under constant acceleration using standard formulae • solve problems involving vertical motion under gravity.
CHAPTER 2
Kinematics in one
dimension
2.1 Introducing kinematics Kinematics is the study of motion and in this chapter we will study objects which move in one dimension only, this means that they move in a straight line. Examples are:
• cars, buses, or bikes, etc. on a straight road, • objects dropped from the top of a cliff or tower so that they
fall vertically, • an athlete running in a 100 m race.
We will not, at this stage, consider what makes the objects move!
We shall also model most of the objects as particles so that we can ignore their size and shape and concentrate on their movement.
2.2 Displacement, velocity and acceleration
First, we have to define some words and symbols that we will use. In everyday language we use the terms speed and distance when talking about motion. Distance is how far we travel (miles, metres, etc.) and speed is how fast we go (miles per hour, metres per second, etc.). In the study of kinematics we need to be more precise and so we introduce displacement and velocity.
Displacement is based on the distance from a specific origin or reference point, but it also takes account of the direction in which the particle has moved.
The displacement may be 5 km north from a reference point or origin; or it may be given using positive or negative values relative to an origin, as shown in the diagram.

+ve (positive displacement) -...--10.
Q 0 P
I I I 4 *4 >
2 cm 3 cm
+ve (positive velocity)
5 m s-1
Then The b direct point point
While is mo, veloci
In an shows track,
Time,
Displa
These graph with a
Veloc
If we I velocit
8 Kinematics in one dimension
We decide that, relative to the point 0, displacements to the right are positive and those to the left negative. Thus the displacement of P is +3 cm, and of Q -2 cm.
In mechanics the symbol used for displacement is s.
Velocity is defined similarly using the speed of an object together with the direction of the motion.
The velocity could be 6 mph going south-west from a reference point, or positive and negative values can be used.
In the diagram two particles are moving vertically. A is going upwards at 4 m s-1 and B is falling at 5 m s-'. If we choose upwards as the positive direction, then the velocity of A is +4 m s-i and B is -5 m s-1.
The symbol used for velocity is v.
We often speak of average speed meaning the constant speed we could have travelled at in order to cover a journey in the same time. For example, if you travel a journey of 100 miles in 2 hours, your average speed is 50 mph; it is very unlikely that you could have driven at a constant 50 mph!
Distance travelled Average speed =
Time taken Change in displacement
Average velocity = Time taken
For example, if a particle moves 5 m from the origin to a point and then back to the origin in a time of 4 s:
10 Average speed = —
4 = 2.5 m s-i
but
0 Average velocity = -
4 = 0 m s-1.
For any motion that starts and finishes in the same place, the average velocity will be zero.
(Quantities that have size (magnitude) but no specific direction, such as speed and distance, are called scalars, but those with direction, like velocity and displacement, are called vectors. Vectors are studied in more detail in Chapter 3.) s (
6
Displacement—time graphs 4
As a body moves the displacement changes so that s is a function of 2
time, t. A graph plotting s against t is called a displacement-time o graph. As an example the graph shows the displacement-time -2 graph for the motion of a ball thrown in the air and falling back to the floor.
-
This v( displa( into ti as the directi floor, s ball hi
Here i!
Motion of ball
/

:ement)
CM
*ve ,positive 7elocity)
The motion of the ball can be described by looking at the graph. The ball starts at the origin and begins to move in the positive s direction (upwards) to a maximum height of 5 m above the point of release. It then falls to the floor which is 2 m below the point of release. It takes just over 2 seconds to hit the floor.
While the ball is moving upwards its velocity is positive. While it is moving downwards its velocity is negative. Note that the velocity is given by the gradient of the displacement—time graph.
In another example of a displacement—time graph, the table shows the displacement (s) of a boy, who is running on a straight track, measured at 2-second intervals.
Time, t 0 2 4 6 8 10 12
Displacement, s 0 4 8 12 16 20 24
These values have been plotted on the graph. You notice that this graph is a straight line which tells us that the boy is running with a constant velocity.
Velocity, v (m
15
10
Train accelerates
<— Train decelerates
10 time, t (min)
Velocity, v (m
10
3 time, t (s)
—10
Kinematics in one dimension 9
Displacement, s
24
20
16
12
8
4 ,
2 4 6 8 10 12 time, t
His velocity is calculated from the gradient of the graph
PQ 24 gradient = = = 2
OQ 12
So the boy runs at 2 m
Velocity—time graphs
If we know the velocity, v, at time t, then we can draw a graph of velocity against time.
This velocity—time graph is for the motion of the ball whose displacement—time graph we saw above. The ball is thrown up into the air with a velocity of 10 m and this decreases to zero as the ball reaches the highest point, in about 1 second. The direction of motion is then reversed as the ball falls back to the floor, so for this part of the motion the velocity is negative. The ball hits the floor with a velocity of about —12 m
Here is another example of a velocity—time graph:
of ball
3 4 t (s)

i0 Kinematics in one dimension
The velocity-time graph here is for the motion of a train which starts from rest at a station. Its velocity increases uniformly to 15 m s-1 in 2 minutes. Then it travels at that speed for 5 minutes before slowing down uniformly over a 3-minute period to stop at the next station.
Acceleration
Another familiar word used to describe the motion of cars, trains, bikes, and so on, in everyday language is acceleration. In the last two graphs above the velocity changes and the rate of change is called the acceleration.
Acceleration is defined as the rate at which the velocity is changing. Its units are 'metres per second per second' or m s-2. So an acceleration of 5 m S-2 means that the velocity is increasing by 5 m s-1 every second.
We can calculate the acceleration from the gradient of a velocity-time graph. Look at the v-t graph of the train above.
During the first part of the motion:
acceleration = gradient of OP
15 120 1
= —8
or 0.125 m 5-2
Note that the time has been converted from minutes to seconds.
During the middle section the acceleration is zero.
In the third section of the train's journey it is slowing down; this is 'decelerating' or 'retarding' and the acceleration will have a negative value.
acceleration = gradient of QR
-15 180
1 = -
372 or -0.0833 m S-2 (to three significant
figures)
Note that the symbol used for acceleration is a.
Displacement and the velocity-time graph
If a lorry moves at a constant speed of 15 m s-1 for 10 seconds, how far does it travel? The distance that the lorry travels is simply given by
15 X 10 = 150m
Kinematics in one dimension
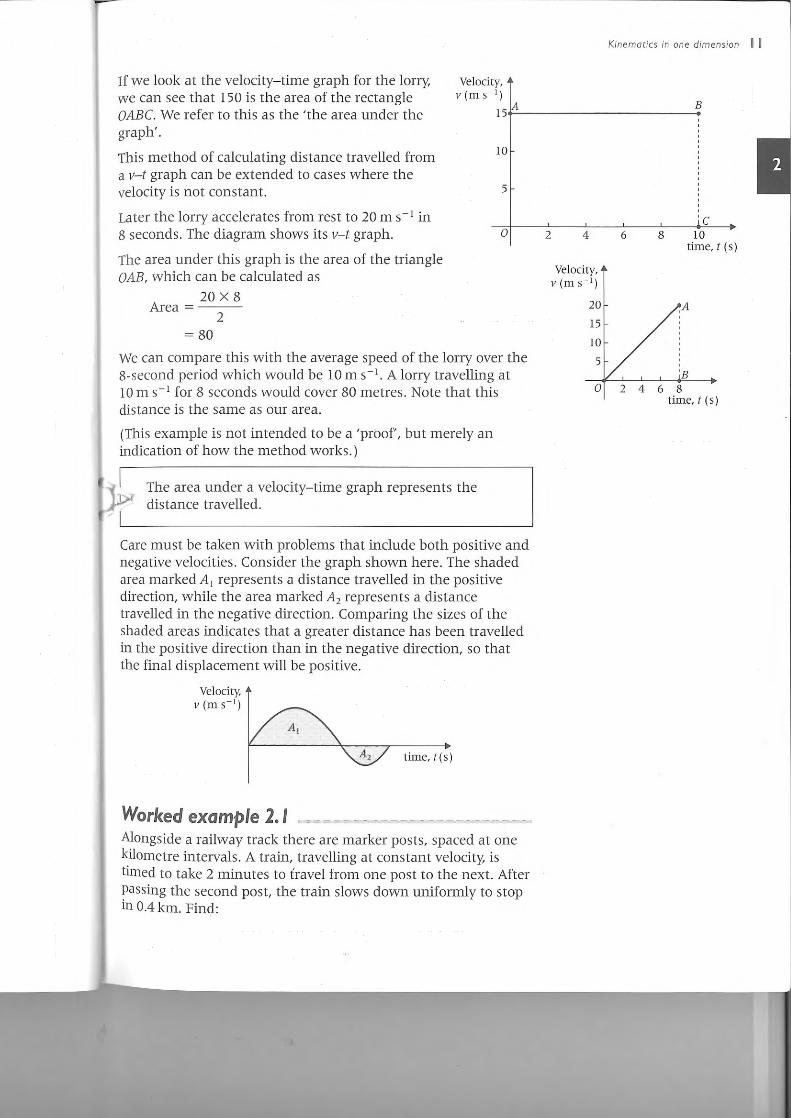
If we look at the velocity-time graph for the lorry, we can see that 150 is the area of the rectangle OABC. We refer to this as the 'the area under the graph'.
This method of calculating distance travelled from a v-t graph can be extended to cases where the velocity is not constant.
Later the lorry accelerates from rest to 20 m in 8 seconds. The diagram shows its v-t graph.
The area under this graph is the area of the triangle OAB, which can be calculated as
20 X 8 Area =
2 =80
We can compare this with the average speed of the lorry over the 8-second period which would be 10 m s-1. A lorry travelling at 10 m s for 8 seconds would cover 80 metres. Note that this distance is the same as our area.
(This example is not intended to be a 'proof', but merely an indication of how the method works.)
1 1, The area under a velocity-time graph represents the 1)4 distance travelled.
f
Care must be taken with problems that include both positive and negative velocities. Consider the graph shown here. The shaded area marked A1 represents a distance travelled in the positive direction, while the area marked A2 represents a distance travelled in the negative direction. Comparing the sizes of the shaded areas indicates that a greater distance has been travelled in the positive direction than in the negative direction, so that the final displacement will be positive.
Velocity, A V OM S-1)
8 10 time, t (s)
Velocity, A v (m s-1)
20
15
10
5
0 2468 time, t (s)
15A
10
5
0 2
Velocity, v (m
Worked example 2.1 Alongside a railway track there are marker posts, spaced at one kilometre intervals. A train, travelling at constant velocity, is timed to take 2 minutes to fravel from one post to the next. After Passing the second post, the train slows down uniformly to stop in 0.4 km. Find:

SOIL The v
Velocity, v (m )
4 (a)
(b) 120 time, t(s)
Solution (There is a mixture of units in this question so we will use seconds for the time and metres for distance.)
First we make a sketch of the v-t graph, as shown. Note that BC is a straight line as the train slows down uniformly.
(a) The train travels 1000 m in 120 seconds, with a constant velocity, v.
Since the area under graph is equal to the distance travelled.
1000 = 120v
v = 1000 5 = = 8.33 m s-1 (to three significant figures).
120 3
(b) During the retardation, the train travels 400 m so the area of the triangle BDC must be 400 units, hence
BD x DC = 400 2
800 3 DC= = 800 X — = 96
BD 25
12 Kinematics in one dimension
(a) the constant velocity of the train,
(b) the time it takes to stop,
(c) the acceleration of the train.
(c) T
(c)
Thus the train slows down for 96 seconds.
The acceleration of the train is the gradient of BC.
-8.33
EXERC
1 Thc she by
v (n
a = 96
= -0.0868 m S-2 (to three significant figures)
Worked example 2.2 A cyclist rides along a straight road from X to Y. He starts from rest at X and accelerates uniformly to reach a speed of 10 m s-1 in 8 seconds. He travels at this speed for 20 seconds and then decelerates uniformly to stop at Y. If the whole journey takes 40 seconds, sketch a velocity-time graph for the journey.
Use the graph to find:
(a) the acceleration during the first 8 seconds,
(b) the acceleration on the final stage,
(c) the total distance travelled.
2 Thi5 shoi the
10
5 10 15 20 25 30 35 40
8
12 18 t (s)
Kinematics in one dimension I 3
,
time, t(s)
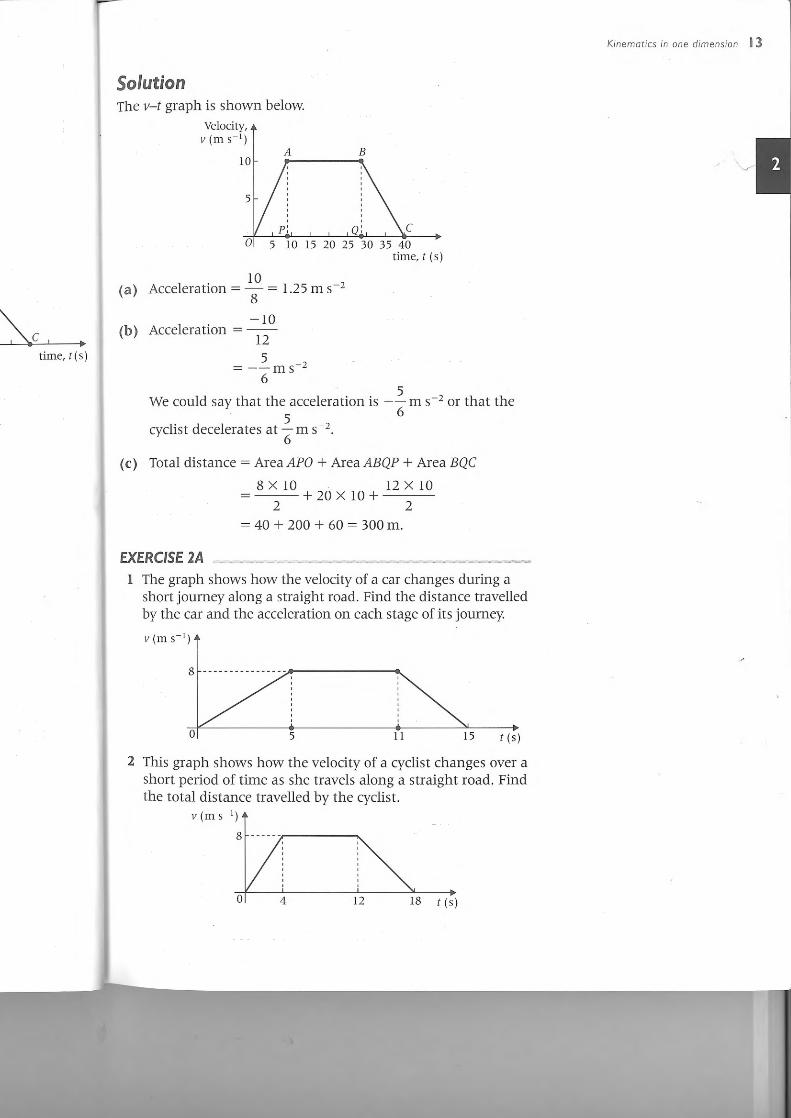
Solution The v-t graph is shown below.
Velocity, v (m s-1)
time, t (s)
10 (a) Acceleration = —
8 = 1.25 m S-2
— 10 (b) Acceleration =
12
= --5 m s-2 6
5 We could say that the acceleration is -- m S-2 or that the
6 5 cyclist decelerates at — m s-2.
6
(c) Total distance = Area APO + Area ABQP + Area BQC
8 X 10 12 X 10 + 20 X 10 +
2 2 = 40 + 200 + 60 = 300m.
EXERCISE 2A
1 The graph shows how the velocity of a car changes during a short journey along a straight road. Find the distance travelled by the car and the acceleration on each stage of its journey.
v (m s-1) A
8
11 15 t (s)
2 This graph shows how the velocity of a cyclist changes over a short period of time as she travels along a straight road. Find the total distance travelled by the cyclist.
v (m
0

(a) SA
(c) SA (d)
14 Kinematics in one dimension
3 Discuss the motion represented by each of the displacement-time graphs shown here.
4 Sketch displacement-time and velocity-time graphs for the following.
(a) A car that starts from rest and increases its velocity steadily to 10 m s-1 in 5 seconds. The car holds this velocity for another 10 seconds and then slows steadily to rest in a further 10 seconds. Assume that the car travels along a straight line.
(b) A ball that is dropped on to a horizontal floor from a height of 3 m. The ball bounces several times before coming to rest.
(c) A person who jumps out of a balloon and falls until the parachute opens. The person then glides steadily to the ground. All the motion takes place along a vertical
v (m s-1)
25
20
15
10
5
5 10 15 20 25 30 t (s)
This velocity-time graph illustrates the motion of an object travelling along a straight line. Calculate the acceleration for each of the following intervals:
(a) 0 < t < 10,
(b) 10 < t < 15,
(c) 15 < t < 30.
(d) Calculate the distance travelled by the object in the 30 seconds.

Kinematics in one dimension S
6 A car moves along a straight road. It accelerates at 2 m S-2 from rest until it reaches a speed of 16 m s-1. It then travels at this speed for 30 seconds, before slowing down and stopping in a further 5 seconds.
(a) Sketch a velocity—time graph for the car.
(b) Find the total distance travelled by the car.
The diagram shows the velocity—time graph for a train which travels from rest in one station along a straight track to rest at the next station. For each of the time intervals OA, AB and BC, state the value of the train's acceleration.
Calculate the distance between the stations. [A]
8 The velocity—time graph shows the motion of a car and a bicycle as they travel along a straight horizontal road. When t = 0, the car and bicycle pass a traffic light on the road. At the traffic light, the bicycle is travelling at a constant velocity of 5 m but the car is travelling at 3 m s-1 and accelerating.
v (m s-1.) •
5
t (s)
(a) (i) Explain how the graph indicates that the acceleration of the car is constant.
(ii) Find the acceleration of the car.
(b) When t = T, the car has travelled twice as far from the traffic light as the bicycle. Find the value of T. [A]

s ( )
40 t (s)
I 6 Kinematics in one dimension
9 The velocity—time graph is for a train moving on a set of tracks over a 30-second period.
v (m s—
(a) Find the total distance travelled by the train. (b) Calculate the average speed of the train.
(c) Calculate the average velocity of the train.
10 The displacement—time graph is for a lift.
(a) Calculate the average speed of the lift during the 40-second period.
(b) Calculate the average velocity of the lift during the 40-second period.
11 A student attempts to model the motion of a bungee jumper. He draws the velocity—time graph shown:
v (m s—')
25
0 2 4 4.8 6 t (s(
—10

Kinematics in one dimension I 7
(a) State the two non-zero times at which the velocity of the bunjee jumper is zero.
(b) Find the distance that the bunjee jumper falls during the first 4 seconds.
(c) Find the total distance travelled by the bunjee jumper during the 5.6 seconds illustrated on the graph. [A]
12 Two sprinters compete in a 100 m race, crossing the finishing line together after 12 seconds. The two models, A and B, as described below, are models for the motions of the two sprinters.
Model A. The sprinter accelerates from rest at a constant rate for 4 seconds and then travels at a constant speed for the rest of the race.
Model B. The sprinter accelerates from rest at a constant rate until reaching a speed of 9 m s-1 and then travels at this speed for the rest of the race.
(a) Sketch velocity-time graphs for each model.
(b) For model A, find the maximum speed and the initial acceleration of the sprinter.
(c) For model B, find the time taken to reach the maximum speed and the initial acceleration of the sprinter. [A]
13 The velocity-time graph shows the motion of a particle P moving with constant acceleration.
v (In s-1) A
5U
3U
o 5 t (s)
At times t = 2 and t = 5, P has velocities 3U and 5U, respectively.
(a) (1) Find, in terms of U, the acceleration of P. (ii) Find, in terms of U, the distance travelled by P
between the times t = 2 and t = 5.
(b) When t = 5, the motion of P changes and subsequently P moves with constant retardation. The particle P comes to rest after travelling a further 20 metres in the next 4 seconds. Find the value of U. [A]

f
I 8 Kinematics in one dimension
2.3 Motion under constant acceleration
There are several simple formulae which can be used to solve problems that involve motion under constant (or uniform) acceleration.
velocity A
0 time The diagram shows a velocity-time graph for the motion of an object with initial velocity u and final velocity v after t seconds has elapsed.
The gradient of the line is equal to the acceleration and is given by V - U
Hence v - u
a=
which can be rewritten as
V = u + at.
The area under the velocity-time graph is equal to the displacement of the object. Using the rule for the area of a trapezium gives
1 s = —
2(u + v)t
Worked example 2.3 A motorbike accelerates at a constant rate of 3 m5-2. Calculate:
(a) the time taken to accelerate from 18 km h-' to 45 km h-',
(b) the distance, in metres, covered in this time.
Solution We can use the equation v = u + at to find the time and then the
equation s = +(u + v)t to find the distance travelled. But first
the units for speed must be converted to m s-1. 18 X 1000
18 km h-1 = = 5 m s' 3600
And similarly 45 x 1000
45 km h-i = = 12.5 m s-1. 3600
(a) Using v = u + at, with u = 5, v = 12.5 and a = 3 gives
v = u + at
12.5 = 5 + 3t 7.5
t= = 2.5 s 3


![PHYSICS HOMEWORK #1 KINEMATICS DISPLACEMENT & … Review.pdf13. At what times t [other than at t= 0] was the displacement of the car again exactly zero? PHYSICS HOMEWORK #6 KINEMATICS](https://static.fdocuments.us/doc/165x107/60124bc6796a736b14103b7a/physics-homework-1-kinematics-displacement-reviewpdf-13-at-what-times-t.jpg)


![KINEMATICS - new.excellencia.co.innew.excellencia.co.in/college/web/pdf/Kinematics-merged.pdf · KINEMATICS KINEMATICS WORKSHEET 1 1) Displacement is a _____ [ ] 1) Vector quantity](https://static.fdocuments.us/doc/165x107/5f356d4687229051801abace/kinematics-new-kinematics-kinematics-worksheet-1-1-displacement-is-a-.jpg)
