KINEMATICAL SUSPENSION OPTIMIZATION USING DESIGN …jurnalmekanikal.fkm.utm.my/UserFiles/file/issue...
10
Jurnal Mekanikal June 2014, No 37, 16-25 *Corresponding author: [email protected] 16 KINEMATICAL SUSPENSION OPTIMIZATION USING DESIGN OF EXPERIMENT METHOD Mohd Awaluddin A Rahman and Afandi Dzakaria Faculty of Mechanical Engineering, Universiti Teknologi Malaysia, 81210 Skudai, Johor Bahru ABSTRACT This paper presents optimization of two suspension quarter car model using Design of Experiment Method. The aim is to determine suspension parameters to achieve the best comfort for human. Two models are used, which are 2 degree of freedom (2 DOF) and 3 degree of freedom (3 DOF). Sprung mass acceleration and also kinematic criteria chamber angle and toe angle had been used to validate both models. The optimization results are compared using step excitation base on the conditions from literature of optimal suspension system. In the case of 2 DOF suspension model at initial condition with optimized value from the literature, sprung mass acceleration did reduce by 32.36%, but suspension working space did increase by 18.71%. Dynamic tyre load did not show significant change which reduces by 0.02%. For 3 DOF suspension model at initial condition with optimize value from the literature, sprung mass acceleration did reduce by 32.28%, but suspension working space only increase by 0.09% and dynamic tyre load reduce only by 0.05% which did not shown significant change. Keywords : Optimization, Response Surface Method 1.0 INTRODUCTION Suspension is a road wheel guiding mechanism that can be considered as a multi-body system composed of rigid bodies and highly compliant links that interacting through some kinematic and compliant joints. Its primary functions are to determine the geometry of the wheel motion during jounce and rebound and to isolate the sprung mass from the road-induced vibration which improve car handling and can effectively attenuate the vehicle vibration resulting from various road conditions. Ideally, the suspension should allow the wheels to move with respect to the body of the vehicle in a direction perpendicular to the road, maintaining the plane of the wheel parallel to itself and constraining all motions in all directions. This vertical motion must be managed through the suspension linkages in order to guarantee the tire’s correct position with reference to the ground [1]. In theory, tires alone could isolate the vehicle body from forces coming from the road, but their elastic and damping properties are not sufficient to achieve suitable handling and comfort targets, unless at very low speed and on smooth roads. Suspensions are therefore essential for achieving adequate road holding behaviour (handling) and comfort [1]. Suspension parameter had been studied by comparing experimental data and simulations model [2]. In this study, it focussed on McPherson suspension hard point and optimization is carried out to get best kinematic characteristic. Studies on passengers comfort by optimizing suspension stiffness and damping is carried out by Abbas et al. [3]. Their study focussed on frequency transfer to passenger body and optimization ofsuspension stiffness and damping. From optimization study by Fallah et al [4], new nonlinear model of the McPherson strut suspension are developed to improve the ride quality and facilitate the evaluation of the suspension kinematic parameters. Procedure for optimal synthesis of three-dimensional
Transcript of KINEMATICAL SUSPENSION OPTIMIZATION USING DESIGN …jurnalmekanikal.fkm.utm.my/UserFiles/file/issue...

Jurnal Mekanikal
June 2014, No 37, 16-25
*Corresponding author: [email protected] 16
KINEMATICAL SUSPENSION OPTIMIZATION USING DESIGN
OF EXPERIMENT METHOD
Mohd Awaluddin A Rahman
and Afandi Dzakaria
Faculty of Mechanical Engineering,
Universiti Teknologi Malaysia,
81210 Skudai, Johor Bahru
ABSTRACT
This paper presents optimization of two suspension quarter car model using Design of
Experiment Method. The aim is to determine suspension parameters to achieve the best
comfort for human. Two models are used, which are 2 degree of freedom (2 DOF) and 3
degree of freedom (3 DOF). Sprung mass acceleration and also kinematic criteria chamber
angle and toe angle had been used to validate both models. The optimization results are
compared using step excitation base on the conditions from literature of optimal suspension
system. In the case of 2 DOF suspension model at initial condition with optimized value from
the literature, sprung mass acceleration did reduce by 32.36%, but suspension working space
did increase by 18.71%. Dynamic tyre load did not show significant change which reduces by
0.02%. For 3 DOF suspension model at initial condition with optimize value from the
literature, sprung mass acceleration did reduce by 32.28%, but suspension working space
only increase by 0.09% and dynamic tyre load reduce only by 0.05% which did not shown
significant change.
Keywords : Optimization, Response Surface Method
1.0 INTRODUCTION
Suspension is a road wheel guiding mechanism that can be considered as a multi-body system
composed of rigid bodies and highly compliant links that interacting through some kinematic
and compliant joints. Its primary functions are to determine the geometry of the wheel motion
during jounce and rebound and to isolate the sprung mass from the road-induced vibration
which improve car handling and can effectively attenuate the vehicle vibration resulting from
various road conditions. Ideally, the suspension should allow the wheels to move with respect
to the body of the vehicle in a direction perpendicular to the road, maintaining the plane of the
wheel parallel to itself and constraining all motions in all directions.
This vertical motion must be managed through the suspension linkages in order to
guarantee the tire’s correct position with reference to the ground [1]. In theory, tires alone
could isolate the vehicle body from forces coming from the road, but their elastic and
damping properties are not sufficient to achieve suitable handling and comfort targets, unless
at very low speed and on smooth roads. Suspensions are therefore essential for achieving
adequate road holding behaviour (handling) and comfort [1].
Suspension parameter had been studied by comparing experimental data and
simulations model [2]. In this study, it focussed on McPherson suspension hard point and
optimization is carried out to get best kinematic characteristic. Studies on passengers comfort
by optimizing suspension stiffness and damping is carried out by Abbas et al. [3]. Their study
focussed on frequency transfer to passenger body and optimization ofsuspension stiffness and
damping. From optimization study by Fallah et al [4], new nonlinear model of the McPherson
strut suspension are developed to improve the ride quality and facilitate the evaluation of the
suspension kinematic parameters. Procedure for optimal synthesis of three-dimensional

Jurnal Mekanikal June 2014
17
mechanisms and its application to the McPherson strut considering toe, caster and camber
angle requirements are proposed by Kovacs [5]. Others studies using same parameters and
using an axiomatic approach to the kinematic design of McPherson strut type are carried out
by Bae et al. [6]. Even though a number of studies had been reported on suspension
kinematics and passenger comfort, very little work has been reported on using optimize
kinematic model to optimize passenger comfort. Gap that is recognized here is to find the
relationship between suspension variable in optimize hard point model. The objective of this
paper is to study the effect of suspension variable which are stiffness and damping on the
suspension performance using optimized kinematic model. Design of Experiment response
surface methods are used to examine the relationship between two suspension variables.
Response surface methods are used to find best variable setting that will meet objective
functions during optimization.
2.0 SIMULATION WORK
This study is structured as in Figure 1 which can be grouped into three main tasks. First is to
develop model, second is to check model behaviour, and lastly is to optimize variable.
Figure 1: Studies flowchart.
In this study, two quarter suspension models as in Figure 2 will be used. The first one is using
simple suspension model with 2 degree of freedoms (2 DOF) and the other model is complex
suspension model with 3 degree of freedoms (3 DOF). These two suspension models are built
using MSC ADAMS VIEW platform. Parameter requires in building model taken from the
studies done by Tey et al. [2] and Abbas et al. [3].
It is important to make sure 2 DOF and 3 DOF suspension models are constrained
correctly. Using published literature experimental and simulations result as benchmark, 2
DOF and 3 DOF suspension models can be verified. 2 DOF and 3 DOF suspension models
should produce similar result as benchmark to put it as valid models for next task. Benchmark
that had been used to validate both models are sprung mass vertical acceleration, chamber
angle and toe angle.
Start Define Model
Parameter Validate model
Define Performance
Criteria
Define Performance
Sensitivity
Optimization Compare Optimize
Value
Optimal
Solution
FIRST
STAGE
SECOND
STAGE
THIRD
STAGE
N
Y
Jurnal Mekanikal June 2014
18
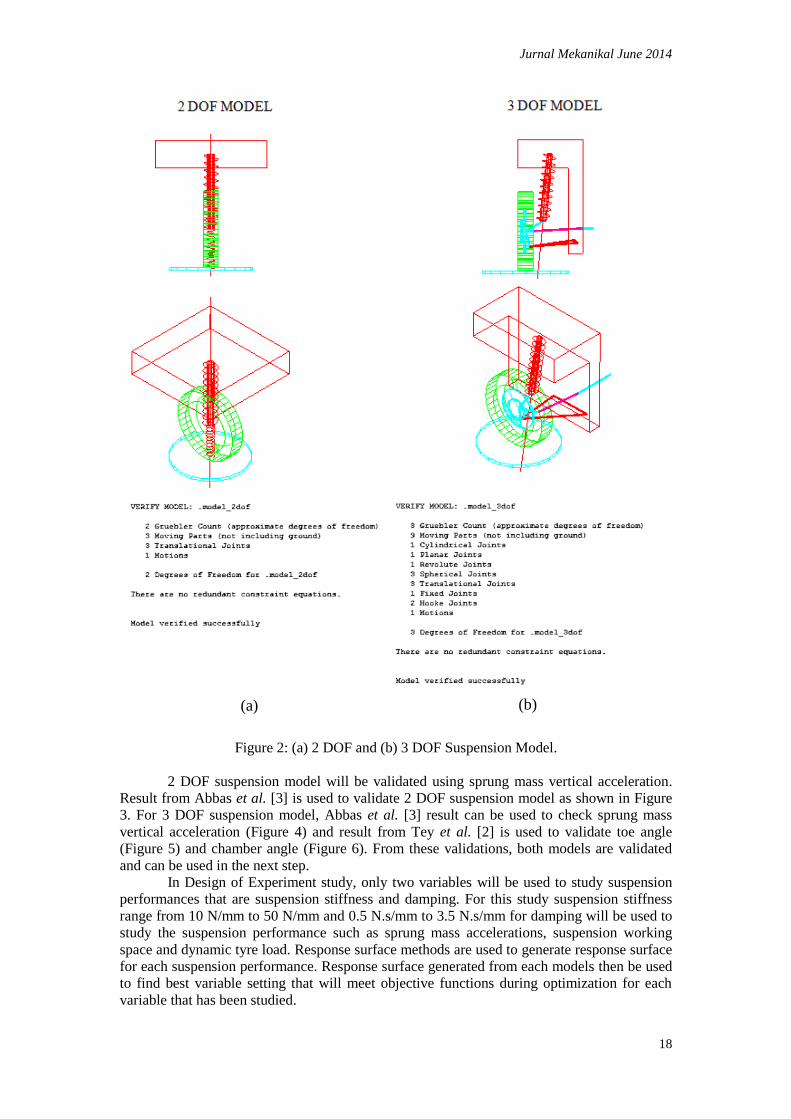
Figure 2: (a) 2 DOF and (b) 3 DOF Suspension Model.
2 DOF suspension model will be validated using sprung mass vertical acceleration.
Result from Abbas et al. [3] is used to validate 2 DOF suspension model as shown in Figure
3. For 3 DOF suspension model, Abbas et al. [3] result can be used to check sprung mass
vertical acceleration (Figure 4) and result from Tey et al. [2] is used to validate toe angle
(Figure 5) and chamber angle (Figure 6). From these validations, both models are validated
and can be used in the next step.
In Design of Experiment study, only two variables will be used to study suspension
performances that are suspension stiffness and damping. For this study suspension stiffness
range from 10 N/mm to 50 N/mm and 0.5 N.s/mm to 3.5 N.s/mm for damping will be used to
study the suspension performance such as sprung mass accelerations, suspension working
space and dynamic tyre load. Response surface methods are used to generate response surface
for each suspension performance. Response surface generated from each models then be used
to find best variable setting that will meet objective functions during optimization for each
variable that has been studied.
(a) (b)

Jurnal Mekanikal June 2014
19
Figure 3: Verification: sprung mass accelerations of (a) abbas et al. [3], (b) 2 dof suspension
model.
Figure 4: Verification: Sprung Mass Accelerations of (a) Abbas et al. [3], (b) 3 DOF
Suspension Model.
Figure 5: Verification: toe angle of (a) tey et al. [2]. (b) 3 dof suspension model.
(a) (b)
(a) (b)
(a) (b)
Jurnal Mekanikal June 2014
20
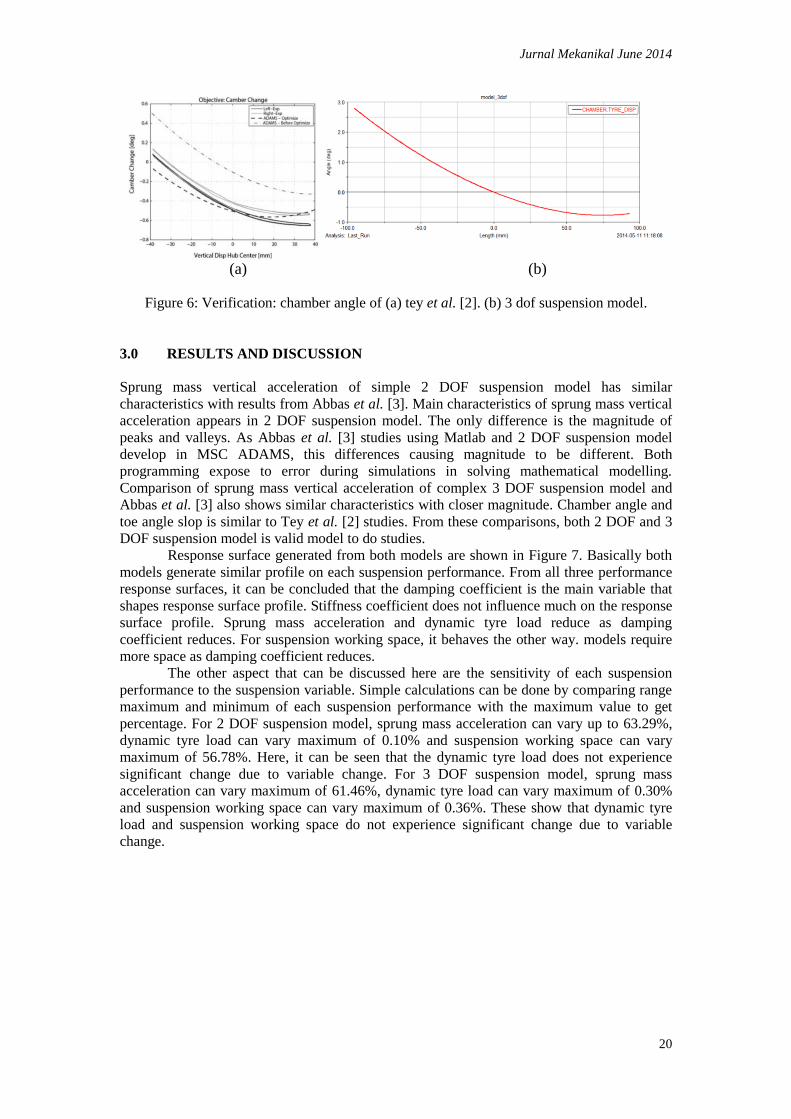
Figure 6: Verification: chamber angle of (a) tey et al. [2]. (b) 3 dof suspension model.
3.0 RESULTS AND DISCUSSION
Sprung mass vertical acceleration of simple 2 DOF suspension model has similar
characteristics with results from Abbas et al. [3]. Main characteristics of sprung mass vertical
acceleration appears in 2 DOF suspension model. The only difference is the magnitude of
peaks and valleys. As Abbas et al. [3] studies using Matlab and 2 DOF suspension model
develop in MSC ADAMS, this differences causing magnitude to be different. Both
programming expose to error during simulations in solving mathematical modelling.
Comparison of sprung mass vertical acceleration of complex 3 DOF suspension model and
Abbas et al. [3] also shows similar characteristics with closer magnitude. Chamber angle and
toe angle slop is similar to Tey et al. [2] studies. From these comparisons, both 2 DOF and 3
DOF suspension model is valid model to do studies.
Response surface generated from both models are shown in Figure 7. Basically both
models generate similar profile on each suspension performance. From all three performance
response surfaces, it can be concluded that the damping coefficient is the main variable that
shapes response surface profile. Stiffness coefficient does not influence much on the response
surface profile. Sprung mass acceleration and dynamic tyre load reduce as damping
coefficient reduces. For suspension working space, it behaves the other way. models require
more space as damping coefficient reduces.
The other aspect that can be discussed here are the sensitivity of each suspension
performance to the suspension variable. Simple calculations can be done by comparing range
maximum and minimum of each suspension performance with the maximum value to get
percentage. For 2 DOF suspension model, sprung mass acceleration can vary up to 63.29%,
dynamic tyre load can vary maximum of 0.10% and suspension working space can vary
maximum of 56.78%. Here, it can be seen that the dynamic tyre load does not experience
significant change due to variable change. For 3 DOF suspension model, sprung mass
acceleration can vary maximum of 61.46%, dynamic tyre load can vary maximum of 0.30%
and suspension working space can vary maximum of 0.36%. These show that dynamic tyre
load and suspension working space do not experience significant change due to variable
change.
(a) (b)
Jurnal Mekanikal June 2014
21
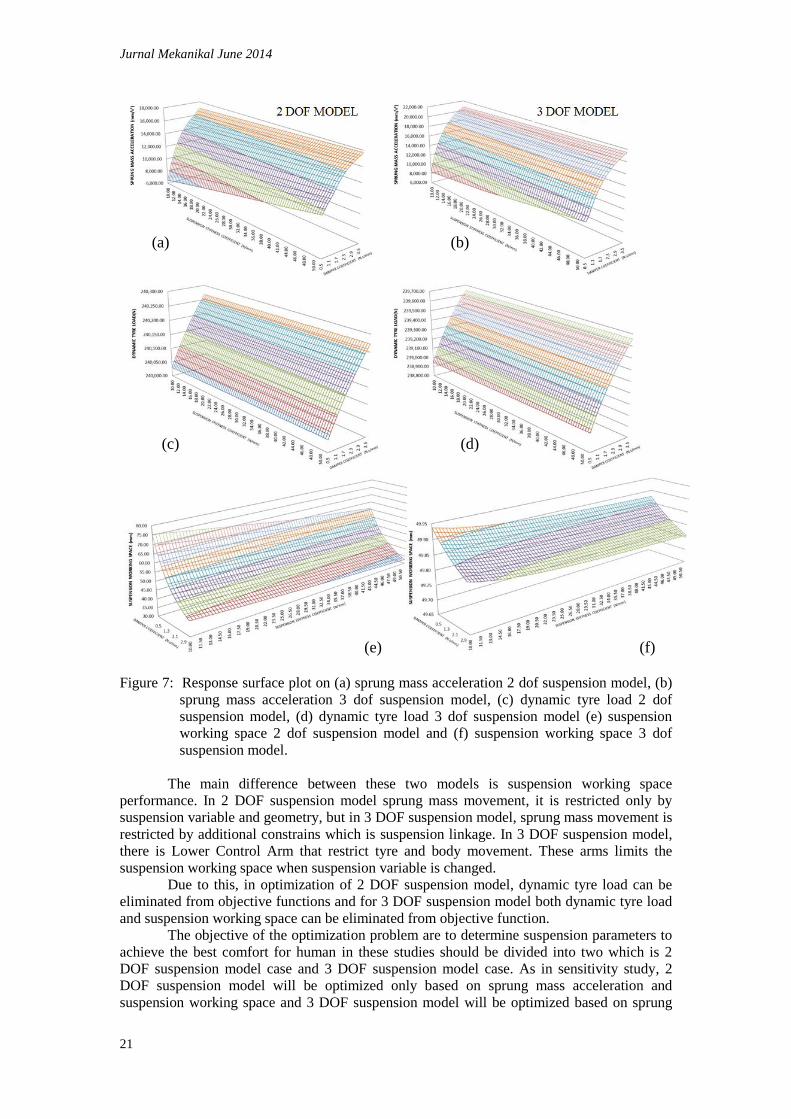
Figure 7: Response surface plot on (a) sprung mass acceleration 2 dof suspension model, (b)
sprung mass acceleration 3 dof suspension model, (c) dynamic tyre load 2 dof
suspension model, (d) dynamic tyre load 3 dof suspension model (e) suspension
working space 2 dof suspension model and (f) suspension working space 3 dof
suspension model.
The main difference between these two models is suspension working space
performance. In 2 DOF suspension model sprung mass movement, it is restricted only by
suspension variable and geometry, but in 3 DOF suspension model, sprung mass movement is
restricted by additional constrains which is suspension linkage. In 3 DOF suspension model,
there is Lower Control Arm that restrict tyre and body movement. These arms limits the
suspension working space when suspension variable is changed.
Due to this, in optimization of 2 DOF suspension model, dynamic tyre load can be
eliminated from objective functions and for 3 DOF suspension model both dynamic tyre load
and suspension working space can be eliminated from objective function.
The objective of the optimization problem are to determine suspension parameters to
achieve the best comfort for human in these studies should be divided into two which is 2
DOF suspension model case and 3 DOF suspension model case. As in sensitivity study, 2
DOF suspension model will be optimized only based on sprung mass acceleration and
suspension working space and 3 DOF suspension model will be optimized based on sprung
(a) (b)
(c) (d)
(e) (f)

Jurnal Mekanikal June 2014
22
mass acceleration. Mathematically, the general optimization problem is formulated as
minimization of the cost function subject to variable, which can be expressed as:
2 DOF suspension model minimize
(1)
3 DOF suspension model minimize
(2)
and both objective functions
(3)
With MSC ADAMS INSIGHT capability to run optimization, the final result
proposed by ADAMS are 10 N/mm for suspension stiffness coefficient and 0.5 N.s/mm for
suspension damping coefficient.
In Figure 8, sprung mass acceleration for 2 DOF suspension model reduces by
32.36% after optimized. In Figure 9, optimized suspension working space for 2 DOF
suspension model increases by 18.71%. Dynamic tyre load do not show any significant
changes which reduce only by 0.02% in Figure 10.
Figure 8: Sprung mass acceleration 2 dof suspension model plot initial condition and after
optimize.
Figure 9: Dynamic tyre load 2 dof suspension model plot initial condition and after optimize.

Jurnal Mekanikal June 2014
23
Figure 10: Suspension working space 2 dof suspension model plot initial condition and after
optimize.
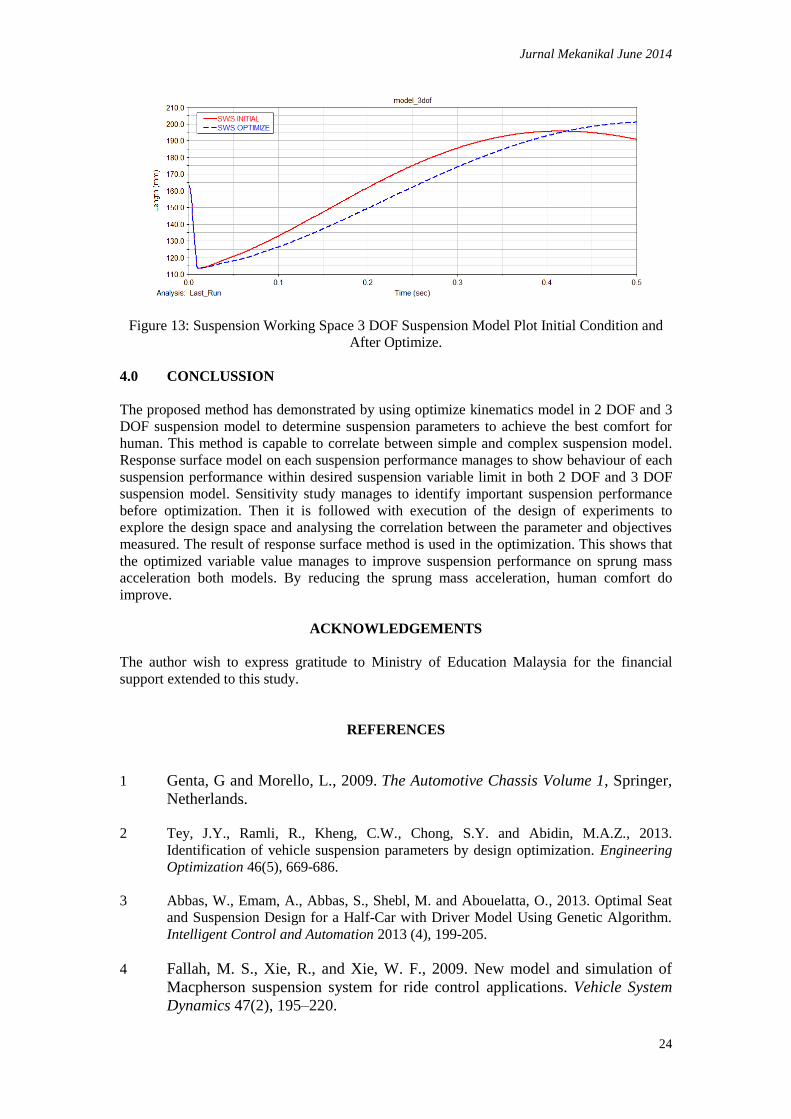
In Figure 11, sprung mass acceleration for 3 DOF suspension model did reduce by
32.28% after optimized. In Figure 12, optimized suspension working space only increase by
0.09%. Dynamic tyre load only reduce by 0.05% which did not shown significant change in
Figure 13.
Figure 11: Sprung Mass Acceleration 3 DOF Suspension Model Plot Initial Condition and
After Optimize.
Figure 12: Dynamic Tyre Load 3 DOF Suspension Model Plot Initial Condition and After
Optimize.
Jurnal Mekanikal June 2014
24
Figure 13: Suspension Working Space 3 DOF Suspension Model Plot Initial Condition and
After Optimize.
4.0 CONCLUSSION
The proposed method has demonstrated by using optimize kinematics model in 2 DOF and 3
DOF suspension model to determine suspension parameters to achieve the best comfort for
human. This method is capable to correlate between simple and complex suspension model.
Response surface model on each suspension performance manages to show behaviour of each
suspension performance within desired suspension variable limit in both 2 DOF and 3 DOF
suspension model. Sensitivity study manages to identify important suspension performance
before optimization. Then it is followed with execution of the design of experiments to
explore the design space and analysing the correlation between the parameter and objectives
measured. The result of response surface method is used in the optimization. This shows that
the optimized variable value manages to improve suspension performance on sprung mass
acceleration both models. By reducing the sprung mass acceleration, human comfort do
improve.
ACKNOWLEDGEMENTS
The author wish to express gratitude to Ministry of Education Malaysia for the financial
support extended to this study.
REFERENCES
1 Genta, G and Morello, L., 2009. The Automotive Chassis Volume 1, Springer,
Netherlands.
2 Tey, J.Y., Ramli, R., Kheng, C.W., Chong, S.Y. and Abidin, M.A.Z., 2013.
Identification of vehicle suspension parameters by design optimization. Engineering
Optimization 46(5), 669-686.
3 Abbas, W., Emam, A., Abbas, S., Shebl, M. and Abouelatta, O., 2013. Optimal Seat
and Suspension Design for a Half-Car with Driver Model Using Genetic Algorithm.
Intelligent Control and Automation 2013 (4), 199-205.
4 Fallah, M. S., Xie, R., and Xie, W. F., 2009. New model and simulation of
Macpherson suspension system for ride control applications. Vehicle System
Dynamics 47(2), 195–220.

Jurnal Mekanikal June 2014
25
5 Kovacs, A.P., 2002. Geometric event constraints: Design synthesis by multibody
Lagrangian type I formalism. Journal Vehicle Design 29, 160-177.
6 Bae, S., Lee, J. M., Choi, W. J., Jun, J. R., and Tak, T. O., 2003. Axiomatic approach
to the kinematic design of an automotive suspension system with the McPherson strut
type. Journal Vehicle Design 31, 58-71.