Killiam Garvey Shaw.an Audit of Irish Debt
48
/////////////// /////////////// //////////////// /////////////// / /////////////// /////////////// //////////////// /////////////// / An Audit of Irish Debt Dr Sheila Killian, Dr John Garvey, Frances Shaw University of Limerick, September 2011
Transcript of Killiam Garvey Shaw.an Audit of Irish Debt

8/4/2019 Killiam Garvey Shaw.an Audit of Irish Debt
http://slidepdf.com/reader/full/killiam-garvey-shawan-audit-of-irish-debt 1/48
//////////////////////////////////////////////////////////////
//////////////////////////////////////////////////////////////
An Audit of Irish DebtDr Sheila Killian, Dr John Garvey, Frances Shaw
University of Limerick, September 2011

8/4/2019 Killiam Garvey Shaw.an Audit of Irish Debt
http://slidepdf.com/reader/full/killiam-garvey-shawan-audit-of-irish-debt 2/48

8/4/2019 Killiam Garvey Shaw.an Audit of Irish Debt
http://slidepdf.com/reader/full/killiam-garvey-shawan-audit-of-irish-debt 3/48
A note on scope
This audit sets out to quantify the scale of the Irish national debt in the first half of 2011. In doing so, it examines all
debt for which theIrishstatehas direct or indirect liability. This extendsthescope beyond what is normally understood
as Sovereign Debt to include debt issued by private banks, butunderpinned by a state guarantee. It also examines some
other marketactivity which impacts on the value or perception of bonds issuedor guaranteedby the Irish government.
Specifically in this context, some time is spent on Credit Default Swaps and on short selling.
By definition, the scope of an audit is limited to a particular time period, in this case the first half of 2011. Since all
sources of data arenot available for all dates, we have clearly indicated thedate andsource of allfigures included here.
Every effort hasbeen made to independently verify material amounts, and to account in a consistent way for currency
translations. Despite this, because of variances in currency translations and some date differences, some
inconsistencies remain. Nevertheless, we are happy that this audit presents a thorough examination of the debt
question atthis time, and adds to the public store of knowledge on the issue. We hopethatthisworkcan be extended
andbuiltupon by others. To facilitate this, we have detailed oursources of information, andincluded URLs where there
is an online link. More detail on the terms of reference is included in the body of the report.
i
8/4/2019 Killiam Garvey Shaw.an Audit of Irish Debt
http://slidepdf.com/reader/full/killiam-garvey-shawan-audit-of-irish-debt 4/48
Acknowledgements
The authors acknowledge the support of the Debt and Development Coalition, Afri and UNITE, and the assistance of
the many people who made useful comments on earlier versions of the report. Opinions expressed in this report
cannot be construed as opinions of the University of Limerick or any of its partners.
© Sheila Killian, John Garvey and Frances Shaw
This document may be copied freely with attribution for the purposes of education and non-commercial research
ii

8/4/2019 Killiam Garvey Shaw.an Audit of Irish Debt
http://slidepdf.com/reader/full/killiam-garvey-shawan-audit-of-irish-debt 5/48
iii
//////////////////////////////////////////////////////////////
//////////////////////////////////////////////////////////////
Table of Contents
Table of Figures iv
Executive Summary v
1. Introduction 01
1.1 Terms of Reference 01
1.2 Introducing Bonds, Prices and Yields 01
2. Government Bonds 03
3. NAMA 08
4. Bank Guarantees 09
4.1 The ELG Scheme 09
4.2 ELG Scheme Extension 10
4.3 ELA operations 11
5. Information on ownership 13
5.1 Debt instruments of covered Institutions 13
5.2 Covered Institutions’ Own Use Bonds 15
5.3 Covered Institutions cross holdings of Debt Securities 16
5.4 Ownership of Government Securities by covered institutions 17
5.5 ECB Ownership of Irish Bonds 18
5.6 Ownership of Irish Bonds by European Banks 18
6. Total Debt 19
7. Other Market Activity 22
7.1 Credit Default Swaps 22
7.2 Short-Selling 23
8. Summary and conclusions 24
9. References 28
Appendix 1: Glossary of Acronyms 31
Appendix 2: ELG Certificates to mid-August, 2011 32
Endnotes 34
8/4/2019 Killiam Garvey Shaw.an Audit of Irish Debt
http://slidepdf.com/reader/full/killiam-garvey-shawan-audit-of-irish-debt 6/48
//////////////////////////////////////////////////////////////
//////////////////////////////////////////////////////////////
iv
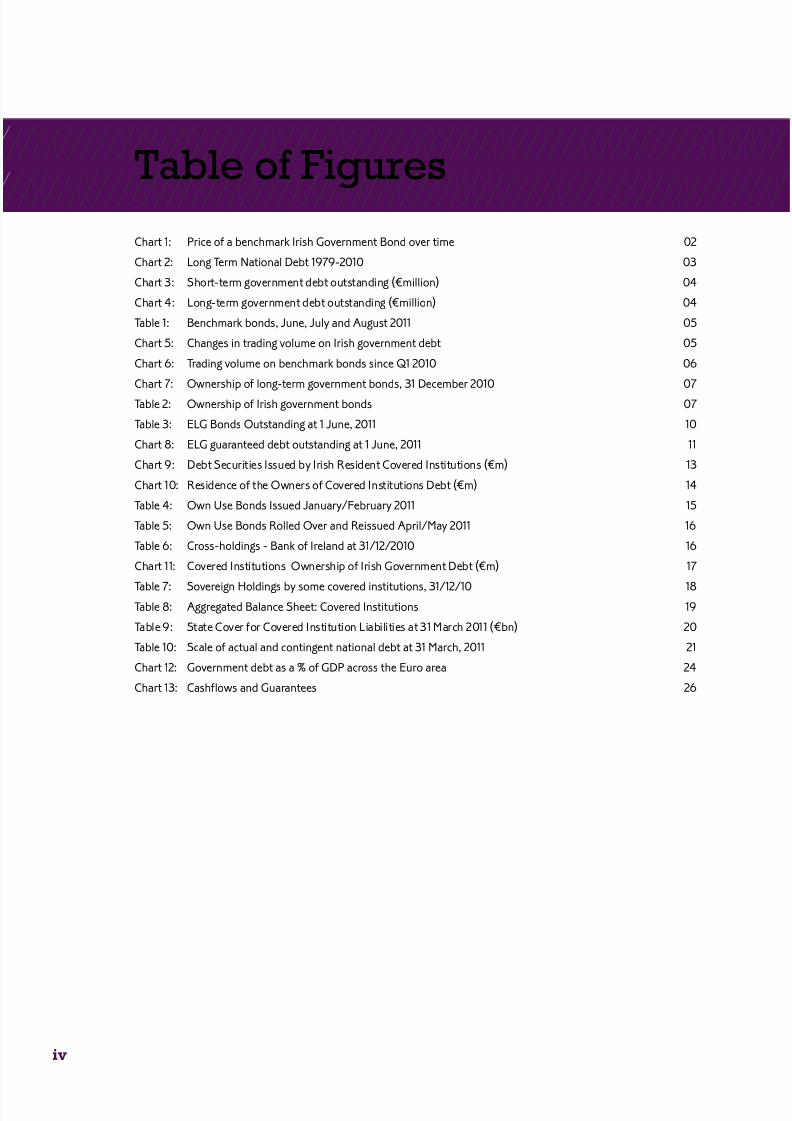
Table of Figures
Chart 1: Price of a benchmark Irish Government Bond over time 02
Chart 2: Long Term National Debt 1979-2010 03
Chart 3: Short-term government debt outstanding (€million) 04
Chart 4: Long-term government debt outstanding (€million) 04
Table 1: Benchmark bonds, June, July and August 2011 05
Chart 5: Changes in trading volume on Irish government debt 05
Chart 6: Trading volume on benchmark bonds since Q1 2010 06
Chart 7: Ownership of long-term government bonds, 31 December 2010 07
Table 2: Ownership of Irish government bonds 07
Table 3: ELG Bonds Outstanding at 1 June, 2011 10
Chart 8: ELG guaranteed debt outstanding at 1 June, 2011 11
Chart 9: Debt Securities Issued by Irish Resident Covered Institutions (€m) 13
Chart 10: Residence of the Owners of Covered Institutions Debt (€m) 14
Table 4: Own Use Bonds Issued January/February 2011 15
Table 5: Own Use Bonds Rolled Over and Reissued April/May 2011 16
Table 6: Cross-holdings - Bank of Ireland at 31/12/2010 16
Chart 11: Covered Institutions Ownership of Irish Government Debt (€m) 17
Table 7: Sovereign Holdings by some covered institutions, 31/12/10 18Table 8: Aggregated Balance Sheet: Covered Institutions 19
Table 9: State Cover for Covered Institution Liabilities at 31 March 2011 (€bn) 20
Table 10: Scale of actual and contingent national debt at 31 March, 2011 21
Chart 12: Government debt as a % of GDP across the Euro area 24
Chart 13: Cashflows and Guarantees 26

8/4/2019 Killiam Garvey Shaw.an Audit of Irish Debt
http://slidepdf.com/reader/full/killiam-garvey-shawan-audit-of-irish-debt 7/48
//////////////////////////////////////////////////////////////
//////////////////////////////////////////////////////////////
v
Executive Summary
This is an audit of Irish sovereign debt, and as such seeks to quantify and explain the debts, both real and contingent,
for which the Irish people have become responsible. As such, our main focus is bonds issued directly by the Irish
government and long-term liabilities of the banks which are guaranteed by the Irish government. In addition to this
we examine some market activity including short selling and credit default swaps, in order to explain how they impact
on the market for sovereign debt. We have three aims. As an audit, we aim to collate and verify data to produce as
comprehensive and accurate a picture of Irish debt as possible, including the origin and scale of the debts. There is a
public education role, in which we seek to createan accessible, comprehensible descriptionof Irish debt to help people
to understand a very complex situation. Finally, through the provision of detailed references to source material, we
hope this provides a useful foundation to others for future work in the area.
Irish government debt, the total of bonds issued directly by government, has increased sharply in recent years, as the
domestic banks were recapitalised. The Irish state has not borrowed on the markets since September 2010, but the
bonds continue to be traded among investors on the secondary market. Because of the way in which this is done,
through a clearing house, the identity of the bondholders at a given time is not known. This anonymity is discussed in
the conclusion to this audit, andcontrastedwith thepositionof shareholders. The limited information available on the
identity of the holders of Irish government bonds, as discussed in Section 2 of the report, indicates that most are not
Irish resident.
Apart from directly issuing bonds, the Irish government has contingent liabilities for other debt, including deposits in
Irish banks, bonds issued by NAMA, and the bank guarantees of 2008 and 2009. This latter guarantee, known as the
ELG scheme, guarantees some of the bonds issued by the covered banks. These are dealt with in Section 4 of the
report. It is worth noting at this point that there are other bonds issued by Irish banks, commonly referred to as theunguaranteed bonds, which are not specifically covered by the government guarantee. These may be further divided
between senior and subordinatedbonds, the latterbeing higher-risk instruments, which reduced rights to repayment.
To date, the state-owned banks have continued to make repayments to the senior bonds.
As well as guaranteeing bonds under the ELG scheme, the Irish state has provided support to the covered banks
through the issue of promissory notes throughout 2010 to Anglo Irish Banks, Irish Nationwide and to a lesser extent
the EBS. These promissory notes are treated as an asset on the books of the bank, enabling them to use them as
collateral to borrow. From the perspective of the Irish government, they are a liability, similar to an IOU, and so need
to be repaid to the bank over a period of time.
In addition, the Irish government provides Emergency Liquidity Assistance (ELA) to the covered banks. This is a very
short-term lending facility, providing liquidity to the banks for periods from 1 day to a week or two. ELA lendingeffectively transfers risk away from the banks to the Irish state.
There are several potentially confusing circular relationships in the ownership of bank and government debt. For
example, the Irish banks covered by the government guarantee (the “covered institutions”) themselves hold Irish
government bonds, making them lenders to the government as well as borrowers. It seems likely that the promissory
notes issued to the banks by the government are also used by the banks as collateral to borrow more under the ELA
scheme. The ECB has been buying Irish bank bonds under their Securities Markets Programme. The covered institutions
also hold each other’s bonds, and also issue bonds to themselves. These “own use bonds” are both a liability and an
asset, and in the latter capacity are used as collateral to borrow money overseas.

8/4/2019 Killiam Garvey Shaw.an Audit of Irish Debt
http://slidepdf.com/reader/full/killiam-garvey-shawan-audit-of-irish-debt 8/48
Section 6 of the report attempts to disentangle these relationships and to make a conservative estimate of the overall
scale of the debts for which the Irish people have direct or indirect responsibility. We are conservative in that we seek
to avoid double-counting, and where assumptions must be made, we assume that assets held by the banks are used
as collateral for further borrowing. Using figures from the end of the first quarter of 2011 – the most recent date for
which full information is available– we calculate the amount of the banks’ liabilities for which the government has taken
on responsibility, netting off where feasible, to arrive at an overall figure for real and contingent government debt at
this date.
Section 7 discusses short selling and the use of credit default swaps (CDS), and their impact on the market for
government debt. Section 8 concludes, with a discussion of the profile of Irish investors in government debt, the pan-
European nature of the issue, the anonymous nature of bonds, and the culture of confidentiality and secrecy which
surrounds them. Figure 13 is a graphic representation of the overall debt picture, showing in a simplified form the
main actors and their relationship to each other.
Overall, it is clear that the bulk of Irish government debt has arisen directly from the banking crisis, the decision in
September 2008 to rescue all of the Irish banks, and the subsequent ELG and ELAoperations.The importance of the
holders of this debt in determining policy suggests that their relationship to the Irish state is more controlling than is
usual for bondholders, and strengthens the case against their anonymity.
vi

8/4/2019 Killiam Garvey Shaw.an Audit of Irish Debt
http://slidepdf.com/reader/full/killiam-garvey-shawan-audit-of-irish-debt 9/48
//////////////////////////////////////////////////////////////
//////////////////////////////////////////////////////////////
1. Introduction
1.1 Terms of Reference
This is an audit of Irish Debt, meaning debt for which the Irish people are held responsible. As such, it examines the
credit liabilities that reside directly or by default with the Irish sovereign. The credit instruments that are being used
to fund theIrish State as well as those institutions that are guaranteed by the Irish State are described andthe associate
terminology is defined. The origin of the various debts for which the Irish people have taken responsibility is examined,
and an exploration of the available information on ownership of those debt instruments is undertaken. The audit
extends to cover some market activities that influence thepricing andownership of those liabilities, specifically looking
at activities and instruments linked to the debt markets that affect the behaviour of participants in the bond markets.
As such, the audit encompasses:
• Irish sovereign debt, i.e. long-term bonds and debt instruments issued directly by the Irish state.
• Long-term debt instruments issued by Irish banks that fall within the government guarantee scheme. Because
these debtsare guaranteed by theCentral Bank of Ireland (CBI), their associated risk passes to the sovereign. This
area encompasses two guarantee schemes, as well as Emergency Liquidity Assistance (ELA) provided by the
CBI to Irish banks. While this is technically non-sovereigndebt,it impactson the credit risk of Irish sovereign debt.
• Market activity that is contingent on expectations about Irish sovereign debt and other debt instruments
guaranteed by the Irish government. Specifically we look at activity in the Credit Default Swap (CDS) market as
well as ‘naked’ short selling of Irish debt.
1.2 Introducing Bonds, Prices and Yields
A bond is essentially an interest-bearing IOU, a piece of paper which entitles the holder to a regular interest payment
and a repayment of the par value of the bond at the end of its term. They are traded in much the same way as shares
on the secondary market, and the prices vary day by day. Sometimes they trade at a discount, meaning that the price
paid drops below the par value. They can also trade at a premium, meaning the reverse: that the price paid is higher
than the par value which will eventually be redeemed at the end of the term of the bond. It is important to note that
this daily fluctuation in the price of the bond does not directly affect the amount received by the original issuer. For
example, although Ireland has not issued any new government bonds this year, the outstanding bonds continue to be
traded on the stock market between investors.
The interest payment, commonly called the coupon, is generally fixed at the time the bond is issued. This makes thestream of income to the holder (coupon and par value at redemption) very predictable. For example, among the Irish
government bonds in issueis a 4% Treasury Bond 2014. This was issued in January 2009, and will pay a coupon of€4
each year until January 2014 when it will be redeemed by the holder for its par value of €100. When the bond was
trading at its par of€100, the yield, or return on investment, was 4%, as represented by the annual coupon payment
of €4 and the future repayment in January 2014 of€100.
The only things that really affect the price of bonds in the market then are changes in the credit rating of the issuer or
in theinterest rates availablein the market. If thecredit rating of theIrish governmentdrops, then theprice of the bonds
already in circulation from that issuer will fall. The graph belowi shows how the price of a benchmark 10-year Irish
Government Bond has varied in the year from August 2010 to August 2011.
01

8/4/2019 Killiam Garvey Shaw.an Audit of Irish Debt
http://slidepdf.com/reader/full/killiam-garvey-shawan-audit-of-irish-debt 10/48
At July 18, 2011 the bond price had fallen to just under €55, and was trading at a significant discount, well below the
par value, and less than 60% of the price a year earlier. Since the coupon is fixed, a fall in the price paid for the bond
meant that a buyer on that date would receive a high interest payment relative to the price paid. In this example, the
coupon payment of €4 per year is equivalent to an earned interest rate of 4/80, or 5%. The discount price paid for
the bond by investors in the market on that date also means that the par amount to be repaid at the end of the term
of the bond will be above the price they paid. Combining the higher coupon rate with the fact that the bond will repay
a full€100 when it is redeemed in January 2014, the overall redemption yield on this bond if purchased in June 2011
would be close to 13%. If purchased on July 18, the yield would have risen to almost 14%. By August 18, as the price
rose to just over€73, the yield fell to close to 10%.
This bond was issued on 14 January 2010 at a very slight discount, carrying a yield of 5.091%. At the time the CEO of
NTMA said:
The successful issue of today’s €5 billion bond reflects the ability of Ireland to place
long term debt with stable investors for longer periods and at narrowing spreads over
Germany.Today’s issue accounts for 25% of this year’s funding programme of €20 billion
and leaves theNTMA in a very comfortableposition as it commences its series of eleven
monthly bond auctions on Tuesday next, 19 January
NTMA Information Package (2010) ii
This shows how rising yields on Irish government bonds generally reflect falling prices in the secondary market, and
in turn reflect a loss of confidence in the credit rating of Ireland, while falling yields represent the reverse of thisprocess.
Ireland’s national debt derives from two main sources: direct government borrowing which includes both government
bonds and borrowing from the EU/IMF, and the borrowings of banks now under state control which areunderwritten
by the Irish state. Each of these and their subcategories are further explained below.
02
Chart 1: Price of a benchmark Irish Government Bond over time
“”

8/4/2019 Killiam Garvey Shaw.an Audit of Irish Debt
http://slidepdf.com/reader/full/killiam-garvey-shawan-audit-of-irish-debt 11/48
03
“”
0
20
40
60
80
100
1 9 7 9
1 9 8 2
1 9 8 5
1 9 8 8
1 9 9 1
1 9 9 4
1 9 9 7
2 0 0 0
2 0 0 3
2 0 0 6
2 0 0 9
Source: NTMA
The medium to long-term portion of the debt comprises bonds, most of which are traded on the Irish Stock Exchange
(ISE), and borrowings from the EU/IMF. The short-term portion of government debt is far smaller, as shown in Chart
3, below, sourced from ICB securities issues statisticsv.
//////////////////////////////////////////////////////////////
//////////////////////////////////////////////////////////////
2. Government Bonds
Irish government debt is administered by the National Treasury Management Agency (NTMA). The term “government
debt” as used by NTMA includes debts of local and national bodies as well as bonds issued by government. The term
“national debt” simply includes the nominal value of all the debt incurred directly by the government, both long-term
and short-term. In answer to Dáil questions in May 2011, Minister for Finance Michael Noonan said:
The significant difference between the end-2010 National Debt and [government] Debt
is largely explained by the €31 billion in Promissory Notes committed to financial
institutions in 2010. Due to the fact that the GG Debt operates on an accruals basis, this
amount was added in full to the GG Debt in 2010 but the cash borrowing to fund these
payments will only take place on a phased basis, beginning in 2011, and so only addsto the National Debt on a phased basis alsoiii.
The Promissory Notes were issued as capital injections to banks such as Anglo Irish bank during 2010, redeemable in
tranches over the following yearsiv. The bank’s 2010 Annual Report (Anglo, 2011) confirmed that most of their revenue
is made up of interest payments from the government to the bank on these notes. Given the poor past levels of
governance in Anglo Irish Bank described by O’Sullivan and Kinsella (2011), this is politically difficult for the
government, prompting a move on the part of the Minister for Finance to seek to restructure the deal. (Noonan 2011b)
For the last eight years, all long-term debt has been denominated in Euro. As can be seen in Chart 2, long-term national
debt has increased noticeably since 2007. This follows a period since the late-1990s where the level of long-term
national debt was marked by stability.
Chart 2: Long Term National Debt 1979-2010

8/4/2019 Killiam Garvey Shaw.an Audit of Irish Debt
http://slidepdf.com/reader/full/killiam-garvey-shawan-audit-of-irish-debt 12/48
Chart 3: Short-term government debt outstanding ( €million)
04
Since September 2010, the Irish Government has not issued any new bonds on the international markets. In additionthere is some retail government debt, mainly prize bonds, savings bonds and certificates and Post Office deposits.
These totalled €13.4 billion at 31 March, 2011, and are considered to be outside the scope of this audit.
At present there are 13 Irish government bonds trading on the Irish Stock exchange, 11 of which are benchmark bondsvii.
The amount outstanding at 18 July 2011 on non-benchmark bonds was just under €26 million. Table 1 presents data
amalgamated from the Irish Stock Exchange and the NTMA website, and lists the outstanding benchmark bonds,
together with their price and yield in mid-June, mid-July and mid-August, 2011.
02,0004,0006,0008,000
10,00012,00014,000
D e c - 0 9
F e b -
1 0
A p r
- 1 0
J u n - 1 0
A u g - 1 0
O c t - 1 0
D e c - 1 0
F e b -
1 1
A p r
- 1 1
J u n - 1 1
60,000
65,000
70,000
75,000
80,00085,000
90,000
95,000
D e c - 0 9
F e b -
1 0
A p r - 1 0
J u n - 1 0
A u g - 1 0
O c t
- 1 0
D e c - 1 0
F e b -
1 1
A p r - 1 1
J u n - 1 1
There is a clear pattern of decline, although more recent press reportsvi suggest that NTMA borrowed more short-
term in August 2011. By contrast, Chart 4, also compiled from CBI data, shows the balance outstanding in long-term
government bonds over the same period.
Chart 4: Long-term government debt outstanding ( €million)

8/4/2019 Killiam Garvey Shaw.an Audit of Irish Debt
http://slidepdf.com/reader/full/killiam-garvey-shawan-audit-of-irish-debt 13/48
Table 1: Benchmark bonds, June, July and August 2011
Price Yield to maturity Outstanding
Instrument 13/6/11 18/7/11 23/7/11 13/6/11 18/7/11 23/8/11 23/8/11 ( €m)
4.00% 2011 99.83 98.21 100.56 4.254% 9.70% 1.30% 4, 390.00
3.90% 2012 98.40 94.75 98.45 6.095% 12.81% 6.83% 5,545.00
5.00% 2013 89.65 76.89 95.55 11.375% 22.35% 7.97% 6,027.51
4.00% 2014 81.40 69.18 89.52 12.987% 21.12% 9.05% 11,857.26
4.60% 2016 74.64 62.62 85.21 11.581% 16.56% 8.58% 10,168.45
4.50% 2018 68.79 55.17 79.01 11.072% 15.07% 8.54% 9,255.58
4.40% 2019 66.41 54.44 77.83 10.798% 14.42% 8.38% 7,700.06
5.90% 2019 69.50 57.90 82.07 11.762% 15.17% 9.11% 6,766.58
4.50% 2020 65.05 54.43 74.76 10.725% 13.77% 8.78% 11,852.45
5.00% 2020 65.50 55.55 75.32 11.009% 13.78% 9.08% 7,707.965.40% 2025 64.75 55.15 74.69 10.281% 12.35% 8.63% 8,284.05
Total 89,554.90
05
0
2
4
6
8
10
12
14
Q 3 2 0
0 8
Q 4 2 0
0 8
Q 1 2 0
0 9
Q 2 2 0
0 9
Q 3 2 0
0 9
Q 4 2 0
0 9
Q 1 2 0
1 0
Q 2 2 0
1 0
Q 3 2 0
1 0
Q 4 2 0
1 0
Q 1 2 0
1 1
Q 2 2 0
1 1
4.00% 2011
3.90% 2012
5.00% 2013
4.00% 2014
4.60% 2016
4.50% 2018
4.40% 2019
5.90% 2019
4.50% 2020
5.00% 2020
5.40% 2025
As bonds approach their redemption date, the risk of default becomes less significant. So it can be seen in the table
above that the yield in bonds close to their redemption date tends towards the original coupon rate. In all of the bond
issues summarised in Table 2, there is an observable rise in the yield from June to July 2011. The average fall in price
over this five week period was 13%. In the following five-week period to 23 August, the average rise in price was 27%.
These figures illustrate the volatility in Irish bond prices over the period.
Chart 5viii shows the change in the volume of trading on each of the Irish government bonds since before the financialcrisis began in the third quarter of 2008. There is a marked decline in the volume traded over that period.
Chart 5: Changes in trading volume on Irish government debt
For clarity, Chart 6ix
shows the volume data for the last six quarters when all current bonds were in issue. The trendof declining volume begins to reverse in the second quarter of 2011.

8/4/2019 Killiam Garvey Shaw.an Audit of Irish Debt
http://slidepdf.com/reader/full/killiam-garvey-shawan-audit-of-irish-debt 14/48
Chart 6: Trading volume on benchmark bonds since Q1 2010
06
0.00
0.20
0.40
0.60
0.80
1.00
1.20
1.40
1.60
1.80
Q1 2010 Q2 2010 Q3 2010 Q4 2010 Q1 2011 Q2 2011
4.00% 2011
3.90% 2012
5.00% 2013
4.00% 2014
4.60% 2016
4.50% 2018
4.40% 2019
5.90% 2019
4.50% 2020
5.00% 20205.40% 2025
Increased volumes in trading of financial instruments, particularly in stocks and options, usually indicate uncertainty
or new information arriving on the market. Throughout 2010, a great deal of new information on agreements, economic
data and credit rating changes in Irish and other pieces of European sovereign debt became available. As confirmed
by Table 2 above, uncertainty and volatility increased. However, the volume of trades in Irish sovereign debt declined.
This may be due to greater proportions of issued debt being purchased and held by the ECB as part of the ECB
Securities Market Programme (SMP). This is the term given to all interventions in the debt markets by the ECB, with
the aim of ensuring price stability while minimising the impact on monetary policy.
According to the ECB Financial Stability Review in June 2011
The purchases under the SMP were larger in November 2010, December 2010 and
January 2011 than in September and October 2010, yet still relatively small compared
with the purchases in May and June 2010.
One implication of these low volumes of trading (also called thin trading) is that small trades or individual large trades
will have a bigger impact than they would have under normal market conditions. This makes the market more
vulnerable to manipulation by large players.
While it is straightforward to see the bonds traded, information on the holders of the bonds is not so readily available.This is in part due to the mechanisms used by the NTMA to market bonds. When Ireland is borrowing on the
international markets, which it has not done since late 2010, the NTMA undertakes bond auctions on Irish government
debt in minimum lots of €1,000 to a group of pre-defined primary dealers, generally on a second Tuesday of a month.
Bonds can also be issued directly to some primary dealers, who go on to sell the bonds to investors. The following
primary dealers, all members of the ISE, are recognised by the NTMA: Barclays Capital, BNP Paribas, Citigroup, Credit
Agricole CIB, Danske Bank, Davy, Deutsche Bank, Goldman Sachs, HSBC CCF, ING Bank NV, JP Morgan, Bank Of
America, Merrill Lynch, Nomura International plc, Royal Bank of Scotland, Société Générale and UBS Limited.
Although there is no obligation on primary dealers to provide the NTMA with details on their clients undertaking
trades in Irish bonds, each primary dealer is required by the Irish Stock Exchange to provide daily reports on their
trades in Irish bonds as well as reports on their own positions at close of business. In December 2000, Ireland became
the first European country to transfer the daily settlement of its bonds from its own Central Bank to an international
clearing house, the Euroclear Operations Centre in Brussels (Euroclear).
“”

8/4/2019 Killiam Garvey Shaw.an Audit of Irish Debt
http://slidepdf.com/reader/full/killiam-garvey-shawan-audit-of-irish-debt 15/48
While the CBI maintains a register of bondholders, the Minister for Finance clarified in response to a Dáil question in
Aprilx that 99.74% of the register is occupied by Euroclear. In turn, Euroclear maintains a register of nominee accounts
that does not reveal the identity of investors holding Irish government bonds. The identity of the holders of the
balancing .26% of government bonds not held through Euroclear is, Minister Noonan said, “treated as confidential”.
This means, in effect, that from day to day, neither the CBI nor NTMA can reveal the identity of the holders of Irish
government debt. The CBI does, however, gather basic information on the residence of government bondholders from
indirect sources, some of which is released, as shown Chart 7, below
Chart 7: Ownership of long-term government bonds, 31 December 2010
07
“”
IrishNon-Irish
At the end of 2010, non-Irish residents held 82% of the long-term government bonds in issue. Table 2 below, sourced
from CBI Quarterly Reports, shows how this breakdown has changed over time
Table 2: Ownership of Irish government bonds
€ million 31/12/09 30/6/10 30/8/10 31/12/10 31/3/11
Irish resident:
Banks and CBI 8,297 9,778 11,019 12,697 12,345
Government 314 416 741 842 539
Financial intermediaries 2,921 2,135 2,216 2,169 1,781
Non-financial corporations 128 32 38 31 32
Households 205 222 249 252 219
Total Irish 11,865 12,583 14,263 15,991 14,916
Rest of world 58,993 72,164 75,346 74,111 74,891
Total 70,858 84,747 89,609 90,102 89,807
The table shows that over time since December 2008, more and more of the government bonds are held by banks and
government bodies, while the holdings of non-Irish residents have increased. As recently as 1 September, 2011, the
Minister for Finance said:
There is a lot of foreign real money buying Irish bonds in the secondary market. … That
is what is forcing the price down at the moment.(Crimmins, 2011)
This is supported by the August 2011 ISE monthly statistical report, which shows the average daily turnover in
government bonds as €432m in August, an increase of 95% on the daily average in the year to date.

8/4/2019 Killiam Garvey Shaw.an Audit of Irish Debt
http://slidepdf.com/reader/full/killiam-garvey-shawan-audit-of-irish-debt 16/48
//////////////////////////////////////////////////////////////
//////////////////////////////////////////////////////////////
3. NAMA
The National Asset Management Agency (NAMA) was established by legislative act in 2009. NAMA is tasked with the
acquisition of bank assets and is required to protect and enhance the value of those assets in the interest of the State.
The 2010 NAMA Annual Report shows that by the end of 2010, NAMA had acquired €71.2 billion in eligible assets from
participating financial institutions for €30.2 billion. The €30.2 billion is used as collateral by the banks in order to
raise cash from the ECB.
Although NAMA bonds are government guaranteed, they are strictly not part of General Government Debt. In
accordance with European guidelines, NAMA established a number of companies of temporary duration known as
Special Purpose Vehicles (SPVs). Under the holding company SPV (Master SPV), NAMA bonds were issued and those
funds are used to purchase bank assets and administer the management of those bank assets. The Irish State maintainsa minority shareholding in the Master SPV (49%) used by NAMA to issue bonds. Private companies hold the major
stake (51%) in the Master SPV.
The state’s minority shareholding in the Master SPV creates sufficient independence for the agency for Eurostat, the
agency responsible for measuring member state national debt, not to regard NAMA bonds as part of the national
debt. There remains some ambiguity between this very technical separation and the reality of the state’s potential
liability should NAMA be unable to repay the almost €29 billion principal in NAMA bonds that remain outstanding.
For their part, the rating agency Standard and Poor’s (2010) are very clear about how NAMA bonds should be
categorised.
we…have treated similar off-balance-sheet arrangements to support national financialsystems in other countries as direct obligations of the government
(Standard & Poor’s, 2010)
The inclusion of NAMA bonds as part of the overall national debt is supported by the other major credit rating agencies
(Moody’s and Fitch, 2010) and also by mainstream financial media (The Economist, 2010).
NAMA’s unaudited quarterly accounts for the first three months of 2011 also show that NAMA held €49.6m in Irish
government bonds at 31 March, 2011 (NAMA, 2011).
08
“”

8/4/2019 Killiam Garvey Shaw.an Audit of Irish Debt
http://slidepdf.com/reader/full/killiam-garvey-shawan-audit-of-irish-debt 17/48
//////////////////////////////////////////////////////////////
//////////////////////////////////////////////////////////////
4. Bank Guarantees
The second category of debt included in the scope of this audit includes those debts of Irish banks for which the Irish
people have assumed ultimate responsibility under the bank guarantee scheme. This bank guarantee is in fact two
separate guarantees.
The first, dating from September 2008 is the Credit Institutions (Financial Support) Scheme 2008, or CIFS scheme,
governed by S.I. No. 411 of 2008 under section 6(4) of the Credit Institutions (Financial Support) Act, 2008. The CIFS
scheme covered retail and interbank deposits, senior unsecured debt, covered bonds (including asset covered
securities) and dated subordinated debt (Lower Tier 2) without any cap on the amount covered. It expired on 29
September 2010.
The second guarantee is the Credit Institutions (Eligible Liabilities Guarantee) Scheme 2009, or the ELG Scheme,
which is considered in more detail below.
4.1 The ELG Scheme
The Credit Institutions (Eligible Liabilities Guarantee) Scheme 2009, or the ELG Scheme is governed by S.I. No. 490
of 2009, under S.6(4) of the Credit Institutions (Financial Support) Act 2008, as amended and extended on 29
September 2010. Like its predecessor, the CIFS scheme, it is operated by the NTMA. Initially, there were seven
institutions covered by the scheme. These were: AIB, Anglo Irish Bank, Bank of Ireland, EBS Building Society, Irish Life
and Permanent plc, Postbank Ireland and Irish Nationwide Building Society. On July 1st, 2011, all of the assets and
liabilities of Irish Nationwide were transferred to Anglo Irish Bank, and the combined institution is due to be renamed
as Irish Bank Resolution Company. Similarly, EBS has been merged with AIB. Postbank Ireland ceased to trade in
December, 2010. This leaves four institutions now covered by the scheme.
Some of the liabilities of CIFS rolled into the ELG scheme, as clarified in the Dáil by then Minister for Finance, Brian
Lenihan, in June 2010:
I would expect further amounts of the eligible liabilities currently covered under CIFS
to rollover into ELG as they mature however as the Deputy is aware, asset-covered
securities and dated subordinated debt, which together amounts to€11.8 billion at end
March, are not covered under the ELG.xi
The Deposit Guarantee scheme guarantees the first €100,000 on deposit with any of the covered institutions, as an
aggregate of all accounts in each institution. It also applies to deposits in other institutions, such as credit unions. The
ELG scheme extends the guarantee to the excess over €100,000 in the participating banks, as well as unsecured senior
bonds and other notes or commercial paper issued since they joined the scheme. The Deposit Guarantee Scheme has
wider range, covering all Irish banks, and is clearer in its operation with fixed terms on payout periods etc. The
mechanics of how the ELG guarantee would operate for the excess over the €100,000 cap are less clear.
The SI giving effect to the scheme also gives the Minister for Finance powers to guarantee other liabilities subject to
certain conditions, and to control some aspects of the banks’ borrowing, including the right in some circumstances to
compel the banks to put in place a restructuring of their debt. The amounts guaranteed up to 24 August, 2011 are
covered under 71 separate certificates. Details on the individual certificates are available on the NTMA website, and
are summarised slightly and tabulated in Appendix 2 to this report.
09
“”

8/4/2019 Killiam Garvey Shaw.an Audit of Irish Debt
http://slidepdf.com/reader/full/killiam-garvey-shawan-audit-of-irish-debt 18/48
4.2 ELG Scheme Extension
The ELG Scheme can be extended by the EU Commission for periods of six months at a time. In June 2011 the EU
commission exercised this rightxii, and granted the extension of the ELG Scheme for a further 6 months. According tofigures released by the NTMAxiii in May, the overall total guaranteed under the scheme at 31 March 2011 was €111bn.
Guaranteed deposits accounted for €81bn, from which we can deduce that the total of guaranteed debt securities at
the end of the first quarter of 2011 was €30bn.
Table 3 below, compiled from Reuters data, details the ELG-guaranteed bonds outstanding at the end of the second
quarter of 2011
Table 3: ELG Bonds Outstanding at 1 June, 2011
Original Issue Maturity Amount IssuedIssuer Name Date Date & Outstanding
Allied Irish Banks plc 22/03/2010 17/06/2011 €100,000,000
Bank of Ireland 26/04/2011 29/07/2011 €2,000,000,000
Bank of Ireland 27/04/2011 03/08/2011 €2,200,000,000
Bank of Ireland 28/04/2011 05/08/2011 €2,600,000,000
Bank of Ireland 03/05/2011 10/08/2011 €1,900,000,000
Allied Irish Banks plc 26/04/2011 12/08/2011 €2,870,000,000
EBS Building Society 27/04/2011 12/08/2011 €1,820,000,000
Irish Life & Permanent plc 27/04/2011 12/08/2011 €3,440,000,000
Bank of Ireland 10/05/2011 12/08/2011 €980,000,000
Bank of Ireland 30/12/2010 30/01/2012 €531,599,000
Bank of Ireland 30/12/2010 30/01/2012 €192,322,926
Allied Irish Banks plc 19/03/2010 19/03/2012 €1,000,000,000
Anglo Irish Bank Corp Ltd 15/04/2010 16/04/2012 €1,500,000,000
Allied Irish Banks plc 04/02/2010 04/02/2013 €1,800,000,000
Allied Irish Banks plc 15/03/2010 15/03/2013 €521,289,674
Irish Life & Permanent plc 22/04/2010 22/04/2013 €1,250,000,000
Bank of Ireland 03/11/2010 03/05/2013 €750,000,000
EBS Building Society 25/02/2010 25/02/2015 €1,000,000,000
Irish Life & Permanent plc 10/03/2010 10/03/2015 €2,000,000,000
Allied Irish Banks plc 19/03/2010 19/03/2015 €2,000,000,000
Anglo Irish Bank Corp Ltd 15/04/2010 15/04/2015 €750,000,000
Total €31,205,211,600
Source: Reuters
The total of the guaranteed amounts appears stable at approximately €30bn.
Chart 8 below shows how the ELG guarantees are shared among the covered institutions
10

8/4/2019 Killiam Garvey Shaw.an Audit of Irish Debt
http://slidepdf.com/reader/full/killiam-garvey-shawan-audit-of-irish-debt 19/48
Chart 8: ELG guaranteed debt outstanding at 1 June, 2011
11
Bank of Ireland
AIB
IL&P
EBS
Anglo Irish
Bank of Ireland has approximately 35%, or €11.2bn, followed by AIB with 25% or €8.3bn.
4.3 ELA operations
The CBI’s Emergency Liquidity Assistance (ELA) operations are included in this audit because the liabilities arising from
these operations form part of the credit risk associated with Irish sovereign debt and thus affect related trading activity.
ELA is essentially emergency liquidity provided by the CBI to Irish Banks, under the rules of the EU but independent
of any involvement of the ECB. The ECB does, however, have the power to veto ELA in any member state if it threatens
price stability. The ELA operations are intended as temporary, and loans are to be made at a penalty ratexiv – effectively
bringing the CBI close to the role of lender of last resort for illiquid but solvent banks. All profits or losses made on
ELA operations accrue to the CBI, and as confirmed in the CBI 2010 Annual Report, they are underwritten by thestate. They therefore affect the credit risk of the Irish sovereign.
Since the ELA loans were to be made at a penalty rate, Buiter et al (2011) concludes that Irish banks would not have
availed of the facility had their collateral been good enough to borrow directly from the ECB. Press reports including
Noonan (2011) have indicated that the rate may be as low as 3%. There is considerable concern, nonetheless, about
the quality of collateral for the ELA loans which are held on the books of the CBI, and on the overall exposure of the
CBI to these loans.
Note 20 of the 2010 CBI annual report reveals that ELA made up €49.4bn of the “Other assets” figure on their balance
sheet. Buiter et al (2011:7) who had made an earlier accurate estimate note that this amounted to some 30% of Irish
GDP at that date, and to conclude that the provision of ELA from the ICB has acted to compensate at least in part for
the flight of deposits from at least some Irish banks. In answer to a Dáil question on July 20, 2011, Minister for Finance,Michael Noonan said:
The Central Bank has informed me that in the period from 23 Jan 2009 to 30 June 2011,
customer deposit balances (retail, corporate and non-bank financial institutions) across
the covered institutions fell by €96 billion from €255 billion to €159 billion.xv
CSO statistics suggest that as well as moving deposits to non-Irish banks, Irish residents have been increasing their
investments in foreign equities and debt instruments (CSO, 2011). This data is difficult to interpret, however, as it
includes Irish-resident firms operating, for example, in the IFSC.
However, since the ELA facility is intended to be short-term in nature, and was reported in the pressxvi as being typically
for up to 7 days at a time, the figure in the ICB report, being a snapshot at a single moment in time, is not necessarilya reliable picture of the overall average level of ELAs throughout the year.
“”

8/4/2019 Killiam Garvey Shaw.an Audit of Irish Debt
http://slidepdf.com/reader/full/killiam-garvey-shawan-audit-of-irish-debt 20/48
If the CBI is heavily exposed to bad loans through the ELA, this heightens the risk of sovereign default, and therefore
adds risk to the wider Eurozone. For all of these reasons, ELA schemes are characterised by Buiter et al (2011) as “a
national matter, with some qualifications ”.
ELA lending can take place either through issuing reserves or by issuing non- monetary liabilities, e.g. one-week term
deposits. As outlined by Buiter et al (2011a), the former will be regarded as increasing the “Base money” within the
Eurozone, akin to quantitative easing, or printing money. From their examination of the annual reports of the CBI,
Buiter et al (2011a) conclude:
Thus, it is certainly possible – in fact, plausible, in our view – that ELA granted by the CBI
is funded mainly by increasing Base money, while Base money shown on the CBI balance
sheet does not show a commensurate increase or even a decrease because of deposit
flight from Irish banks to German banks.(Buiter et all, 2011a:2)
ELA lending does more than provide emergency liquidity for banks at a cost to the credit rating of the sovereign and
ultimately of the ECB. It also transfers risk away from the banks to the sovereign, to the extent that the state has
guaranteed the ELA lending. It also worth pointing out, as noted by Buiter et al (2011a), that the collateral offered by
banks such as Anglo Irish Bank for much of the ELA lending appears to be the promissory notes referred to in Section
2 above, issued by the Irish sovereign to provide a capital injection to these banks during 2010. This is a circular
arrangement whereby notes given by the state to the bank are then used by the bank to borrow more from the state.
The result is that the Irish people are guaranteeing loans made to illiquid and possibly insolvent banks on the basis of
previous promissory notes issued by the Irish government to the same banks.
12
“”

8/4/2019 Killiam Garvey Shaw.an Audit of Irish Debt
http://slidepdf.com/reader/full/killiam-garvey-shawan-audit-of-irish-debt 21/48
13
“”
50,000
60,000
70,000
80,000
90,000
100,000
110,000
120,000
130,000
J u l - 0 7
O c t - 0 7
J a n - 0 8
A p r - 0 8
J u l - 0 8
O c t - 0 8
J a n - 0 9
A p r - 0 9
J u l - 0 9
O c t - 0 9
J a n - 1 0
A p r - 1 0
J u l - 1 0
O c t - 1 0
J a n - 1 1
A p r - 1 1
J u l - 1 1
//////////////////////////////////////////////////////////////
//////////////////////////////////////////////////////////////
5. Information on ownership
As discussed above, it is unclear who owns bonds traded on the secondary market. In particular, the mechanisms by
which government bonds are issued and traded make it difficult to determine ownership. This applies not only to
government debt, but also to the bonds issued by the covered institutions. Brian Lenihan, as Minister for Finance,
responded to a Dáil question from Joan Burton in April 2010 as follows:
Credit institutions, including the specific institution referred to in the Deputy’s question
do not have access to comprehensive information on the holders of their senior and
subordinated debt, because such debt is publicly traded and dealt through clearing
house systems. Issuers do not have access to the records of those systems and the issuer
has no means of establishing the underlying ownership of its bonds at any given time.Unlike in the case of shares, the holders of credit institutions’ senior and subordinated
debt instruments are not subject to a disclosure regime.
Such information as a credit institution may have on the holders of its debt, would be
indicative only and based on an institution’s client-specific and general market
information. Such information would be commercially sensitive and subject to the normal
provisions on client confidentiality where applicable.xvii
Nevertheless, there are some sources of data in the public domain, which can be cross-referenced to shed light on
ownership. These are discussed in turn below.
5.1 Debt instruments of covered Institutions
On a monthly basis the CBI issues an aggregate balance sheet for the covered institutions. Chart 9 below, sourced from
Central Bank of Ireland Statisticsxviii shows the debt securities issued by Irish-resident covered institutions over the three
years to July 2011.
Chart 9: Debt Securities Issued by Irish Resident Covered Institutions ( €m)

8/4/2019 Killiam Garvey Shaw.an Audit of Irish Debt
http://slidepdf.com/reader/full/killiam-garvey-shawan-audit-of-irish-debt 22/48
The most marked decline is in September 2010. To understand this better, Chart 10 below shows the residence of the
holders of these debt securities, broken into Irish, non-Irish Eurozone and non-Euro, meaning outside of the Euro area.
Chart 10: Residence of the Owners of Covered Institutions Debt ( €m)
14
-
10,000
20,000
30,000
40,000
50,000
60,000
70,000
80,000
90,000
J u l - 0 7
N o v - 0 7
M a r - 0 8
J u l - 0 8
N o v - 0 8
M a r - 0 9
J u l - 0 9
N o v - 0 9
M a r - 1 0
J u l - 1 0
N o v - 1 0
M a r - 1 1
J u l - 1 1
Irish
Euro
non-Euro
The September 2010 decline is mainly due to a marked reduction in bonds held by non-Euro holders from August to
September 2010. As a wider trend, the bonds held by residents outside the Euro area declined significantly, while the
amount held by Irish residents has risen to the point where most of the bonds of the Irish covered institutions are now
held by Irish residents. This data is difficult to interpret, however, as it is complicated by the high levels of back-office
activity in the IFSC. It remains unclear which Irish residents hold these debt securities overall; they may be hedge
funds, pension funds, nominee companies or the financial institutions themselves.
The Central bank have clarified that an additional €17bn of bonds were issued in January 2011, and are being held by
the banks themselves. These “own use bonds” are used as collateral with the ECB for emergency funding, and are
discussed further below. For technical reasons of comparability across the Eurozone, they are not included in the
aggregated balance sheets.
Information on the ownership of Irish bonds also comes from other, sometimes ad-hoc sources. For example, Carswell
(2011b) reports that the hedge fund Aurelius Capital purchased subordinated bonds in Anglo Irish Bank in November
2010. At the time, it paid 20 cents for the bonds with a nominal value of one euro, the price offered by the bank in a
buy-back at the time. “It followed a similar strategy at AIB, investing in junior bonds in January during a debt buyback .”
Caution must be exercised in the reliance on such secondary sources, particularly when the provenance of the data is
uncertain. For example, while rumours abounded throughout 2009 and early 2010 that Irish Credit Unions owned a
substantial proportion of the bonds issued by Anglo Irish Bank, this was forcefully denied by the Chief Executive,
Kieron Brennan.
The organisation representing credit unions has said that it invested just€99 million in
Anglo Irish Bank bonds, and has called on the government to ‘‘cease referring to these
investments as justification for guarantees and the continuation of Anglo Irish Bank.
(Leahy, 2010)
“”

8/4/2019 Killiam Garvey Shaw.an Audit of Irish Debt
http://slidepdf.com/reader/full/killiam-garvey-shawan-audit-of-irish-debt 23/48
The Irish League of Credit Unions confirmed in September 2011 that their exposure to Anglo Irish Bank bonds has not
increased since 2009.
Similarly, a great deal of analysis is done on figures released on anonymous blogs, which may or may not be accurate.
The Minister for Finance in answer to Dáil questions in June 2010 confirmed that he did not have the breakdown of
the identity of the bondholdersxix.
5.2 Covered Institutions’ Own Use Bonds
“Own use bonds” are bonds issued by the banks guaranteed as part of the ELG Scheme to themselves. They are then
held by these covered institutions as an asset and used as collateral to borrow from the ECB. The CBI Annual Report
2010xx explains the origin of own use bonds as follows:
In January 2011, a number of credit institutions issued bonds which they retain for their
own use. The ECB has authorised the use of these bonds in substitution for collateralthat is no longer eligible in normal Eurosystem operations. Risks from lending to credit
institutions where such bonds are used as collateral, should they materialise, are borne
by the bank (i.e. the loss sharing mechanism in place for other Eurosystem operations
does not apply). Just as with ELA, credit risk to the bank in respect of repo operations on
these bonds is effectively mitigated by government guarantee in so far as these bonds
have been issued under the Eligible Liability Guarantee Scheme.
(CBI Annual Report 2010, 117)
These own use bonds were issued by four of the covered institutions: AIB, Bank of Ireland, Irish Life and Permanent
and EBS. In January these four institutions issued floating rate notes (FRNs) of approximately 3 month maturity,
guaranteed under the ELG Scheme. Bank of Ireland also issued a guaranteed 3 month FRN on 10 th February for
€980m, although it is unclear whether this Note is also an own use bond.xxi Table 4 below, sourced from NTMA data,
details these bonds issued in the first two months of 2011.
Table 4: Own Use Bonds Issued January/February 2011
Issue Date Issuer Description Maturity Date
25/01/2011 Allied Irish Bank plc €2.87bn FRN April 2011
26/01/2011 Bank of Ireland €3bn FRN April 2011
26/01/2011 Bank of Ireland €1.9bn FRN May 2011
26/01/2011 Bank of Ireland €2.6bn FRN May 2011
26/01/2011 Bank of Ireland €2.2bn FRN May 2011
26/01/2011 Irish Life and Permanent plc €3.44bn FRN April 2011
28/01/2011 EBS Building Society €1.82bn FRN April 2011
10/02/2011 Bank of Ireland €980m FRN May 2011
Like ELA itself, the deployment of own used bonds was originally intended as a temporary measure. However, it would
seem that all these notes have been rolled over again at maturity as can be seen in the table below. Table 5 below,
sourced from NTMA data, shows the rollover of Own Use bonds in April and May of 2011.
15
“”

8/4/2019 Killiam Garvey Shaw.an Audit of Irish Debt
http://slidepdf.com/reader/full/killiam-garvey-shawan-audit-of-irish-debt 24/48
Table 5: Own Use Bonds Rolled Over and Reissued April/May 2011
Issue Date Issuer Description Maturity Date
26/04/2011 Allied Irish Bank plc €2.87bn FRN August 2011
26/04/2011 Bank of Ireland €2bn FRN July 2011
03/05/2011 Bank of Ireland €1.9bn FRN August 2011
28/04/2011 Bank of Ireland €2.6bn FRN August 2011
27/04/2011 Bank of Ireland €2.2bn FRN August 2011
27/04/2011 Irish Life and Permanent plc €3.44bn FRN August 2011
27/04/2011 EBS Building Society €1.82bn FRN August 2011
10/05/2011 Bank of Ireland €980m FRN August 2011
The notes are for the same maturity and amounts as previously issued except for one BOI note which is issued for 1bnless. It is unclear at this stage how many times these notes will be rolled over.
These are clearly artificial instruments, whose use has advantages for both the banks themselves, and the CBI. The own
use bonds provide collateral to allow the banks to borrow from the ECB at a low interest rate of around 1%. This is
considerably more favourable than the rate on ELA borrowing, which is reported by Noonan (2011) to be close to 3%.
The advantage for the CBI is that the availability of ECB lending to the banks reduces the need for relatively
unsustainable ELA provisions. This improves the quality of assets on the books of the CBI, and reduces their funding
requirements.
5.3 Covered Institutions cross holdings of Debt Securities
As discussed earlier, it is difficult to determine bond ownership from the data available from the CBI. However, the
annual reports of the banks themselves shed some light on cross-holdings. For example, Bank of Ireland’s 2010 Annual
Report gives a breakdown of its holdings of bonds issued by the other covered institutions. Table 6 below summarises
this data as at 31 December 2010:
Table 6: Cross-holdings - Bank of Ireland at 31/12/2010
Bonds issued by €’m
Allied Irish Bank plc 222
Anglo Irish Bank plc 89
EBS -
Irish Nationwide Building Society 105
Total 416
Bank of Ireland significantly reduced their holdings in Anglo Irish Bank from €329 million of bonds at the end of 2009
to€89 million at 31 December 2010.There is also evidence from the Irish Life and Permanent Plc 2009 Annual Report,
which states:
As at 31 December 2009, debt securities includes€701m (2008:€330m) of securities
issued by Anglo Irish Bank and loans and receivables to bank includes loans amounting
to€
375m (2008:€
262m) issued to Anglo Irish Bank.
xxii
16
“”

8/4/2019 Killiam Garvey Shaw.an Audit of Irish Debt
http://slidepdf.com/reader/full/killiam-garvey-shawan-audit-of-irish-debt 25/48
The June 2010 Interim Report of Irish Life and Permanent Plc shows an increase in holdings of bonds issued by Anglo
Irish Bank:
As at 30 June 2010 debt securities includes€886m (30 June 2009:€328m, 31December
2009: €701m) of securities issued by Anglo Irish Bank, and loans and receivables to
bank includes loans amounting to€282m (30 June 2009:€nil, 31 December 2009:€375)
issued to Anglo Irish Bank. xxiii
The Anglo Irish Bank interim report for the first six months of 2011 reveals that at 31 June, 2011 the bank held:
… a portfolio of securities that are classified as available-for-sale (‘AFS’). This portfolio
comprises sovereign bonds, debt issued by financial institutions and subordinated
NAMA bonds.Anglo (2011:15)
It is likely, although not certain, that these securities include Irish bank and government bonds.
Since this information is not consistently available for all of the covered institutions, it provides an indicator of the
practice of cross-holding debt securities, without quantifying the scale of that practice.
5.4 Ownership of Government Securities by covered institutions
As well as holding bonds issued by each other, or by themselves, the Irish covered institutions also hold Irish
government bonds. As at 13 June 2011 there were a total of €89,580m Irish government bonds in issuexxiv. As previously
discussed, these bonds are cleared through the clearing house Euroclear, so the identity of the bondholders is not
revealed. From CBI statisticsxxv, however, it is possible to identify how much of this debt is held by the covered
institutions. Chart 11 below, sourced from CBI Statisticsxxvi
, shows the covered institutions holdings of Irish Governmentdebt over the last 12 months.
Chart 11: Covered Institutions’ Ownership of Irish Government Debt ( €m)
17
“”
“”
7,000
7,500
8,000
8,500
9,000
9,500
10,000
10,500
11,000
11,500
Apr10 Jun10 Aug10 Oct10 Dec10 Feb11 Apr11

8/4/2019 Killiam Garvey Shaw.an Audit of Irish Debt
http://slidepdf.com/reader/full/killiam-garvey-shawan-audit-of-irish-debt 26/48
The Financial Measures Programme Report released by the Central Bank in March 2011 breaks down details of sovereign
debt held by the four institutionsxxvii which were the subject of stress tests by the European Banking Authority (EBA).
The data is from 31 December, 2010, and is shown in Table 7 below.
Table 7: Sovereign Holdings by some covered institutions, 31/12/10
Short term government Long term government Nama
bonds €’m bonds €’m bonds €’m
AIB 227 5153 8,036
BOI 212 3057 5,075
EBS 308 175 321
Irish Life & Permanent 125 1684 0
This shows that a substantial percentage of Irish government debt is held by the Irish banks which are in turn controlled
by the government. These details were confirmed by Minster Michael Noonan in a written answer to a Dáil questionxxviii
on June 2nd, 2011. It is likely that the situation has changed since 31 December 2010, but it is difficult to establish all
the facts at a later date. As an indication of change, the Anglo Irish Bank Interim Report says that the principal not yet
drawn down on the government promissory note amounted to €23.6bn from 31 March, 2011. They go on to say that
the total exposure to the Irish Government at 30 June, 2011 is €26bn. This leaves a balancing figure of €2.6bn, leaving
scope for some ownership of government bonds by Anglo Irish Bank. However, the amount on hand at year end cannot
exceed the €321m shown in note 21 to the accounts.
5.5 ECB Ownership of Irish Bonds
Since May 2010 when the ECB established the Securities Markets Program (SMP), it has been purchasing Irish debt on the
secondary markets. As discussed earlier, this program was established to allow both national central banks in the Eurozone
and the ECB to operate in the financial markets buying and selling debt securities. The objective of this program is to
“address the malfunctioning of securities markets and restore an appropriate monetary policy transmission mechanism.xxix ”
In a press conference on the 4th August 2011, Jean-Claude Trichet stated that although there had been no use of the
SMP in the past 18 weeks, the program was ongoing rather than dormant. Following this press conference the ECB went
into the secondary market and actively purchased more Irish and Portuguese debt with the aim of increasing liquidity
and driving down rising bond yields. Although it is not reported exactly how much of the SMP debt is Irish, as at
26/08/2011 the total debt held by the ECB under the SMP was €115,595mxxx.
5.6 Ownership of Irish Bonds by European Banks
In July 2010, the Committee of European Banking Supervisors (CEBS) identified investors in Irish sovereign debt
among ninety-one large international and regional banks. The exercise was part of a stress test on the banks, and
CEBS was seeking to establish information on risk. As reported in the Financial Times by Murphy (2010), the banks
were asked to report the government debt in 20 countries. The Financial Times compiled a table showing the top
holders of Irish government debt at that time. The top three holders of Irish government debt at the time among
European banks were Royal Bank of Scotland, AIB and Bank of Ireland. Beyond this, it’s clear that Danish, French and
German banks had big exposures.
Such a table is useful as a snapshot of ownership at a moment in time, but becomes far less relevant over time. Given
the changes in the volume of trade in Irish government bonds shown in Table 5 above, and the increase in hedge fund
activity since mid-2010, this data is largely of historical interest.
18

8/4/2019 Killiam Garvey Shaw.an Audit of Irish Debt
http://slidepdf.com/reader/full/killiam-garvey-shawan-audit-of-irish-debt 27/48
19
//////////////////////////////////////////////////////////////
//////////////////////////////////////////////////////////////
6. Total Debt
This section attempts to integrate what we know of Irish debt in early 2011. As previously discussed, at 31 March,
2011, Irish Government debt totalled€91,785 million euro, made up of €89,892m in long and medium term bonds and
€1,893m in short term debt xxxi. Table 8 below shows the aggregated balance sheets of covered institutions, sourced
from CBI statisticsxxxii.
Table 8: Aggregated Balance Sheet: Covered Institutions
31/03/2011 31/12/2010 30/09/2010
Assets
Loans and receivables (including finance leases) 332,174 342,223 328,611
Available-for-sale financial assets 46,217 47,047 52,511
Cash & cash balances with central banks 5,877 6,673 4,287
Financial assets 7,834 8,098 11,958
Other Assets 38,075 43,458 85,386
Total Assets 430,177 447,500 482,753
Liabilities
Deposits other than from Credit Institutions 155,077 159,217 182,357
Deposits from Credit Institutions and Central Banks 168,348 167,275 146,713
Debt Certificates 51,957 60,393 66,900
Subordinated Liabilities 6,609 9,809 13,147Other liabilities 29,095 31,240 49,213
Total Liabilities 411,086 427,934 458,330
Equity & Minority Interest 19,091 19,566 24,424
Total Liabilities, Minority Interest and Equity 430,177 447,500 482,753
Government Guaranteed Liabilities 110,673 113,132 146,737
The table as released by the CBI also highlights the bank liabilities which have been guaranteed by the Irish
Government, as the ultimate responsibility for these debts falls to the Irish Government. The CBI notes a number of
limitations in respect of this data, most significantly that it does not distinguish between collateralised and un-
collateralised lending, that it does not include all government guarantees, and that it may include recent provisionaldata, which is subject to revision in the future.
Table 8 above shows total bank liabilities at the end of March totalling€411,086m for the covered institutions. In Table
9, below, we attempt to break this amount down to establish exactly how much is actually guaranteed by the Irish
government, and how it increases the national debt.

8/4/2019 Killiam Garvey Shaw.an Audit of Irish Debt
http://slidepdf.com/reader/full/killiam-garvey-shawan-audit-of-irish-debt 28/48
Table 9: State Cover for Covered Institution Liabilities at 31 March 2011 ( €bn)
(1) ELG Scheme:Guaranteed Deposits €81
Bonds Guaranteed €30
Total €111
(2) Deposit Guarantee Scheme
Customer Deposits €155
Less deposits covered by the ELG Scheme (€81)
Deposit Guarantee Scheme Guaranteed €74
(3) Promissory Notes
Anglo Irish Bank €25.3
Irish Nationwide €5.3
EBS €0.3Total €30.9
(4) NAMA
Bonds outstanding at 31/3/11 €28.7
(5) Emergency Liquidity Assistance
“Other Assets” €66.8
Reduced by estimated €1.3bn of non-ELA other assets (€1.3)
Less promissory notes above (conservative assumption) (€30.9)
Net increase in national debt due to ELA €34.6
Total ultimately backed by the state 31/03/11 €279.3
The Eligible Liabilities Guarantee Scheme guarantees just under €111bn in total. Under this scheme, eligible liabilities
for the scheme are either customer deposits or unsecured debtxxxiii. Since we know that€81bn is customer depositsxxxiv,
it follows that the remaining €30bn is bank debt.
Deposits other than from Credit Institutions and Central Banks totalled €155bnxxxv. Since €81m is covered under the
ELG scheme, the remaining €74bn customer deposits would be covered under the deposit guarantee scheme.
There are approximately €30.bnxxxvi promissory notes outstanding issued to Anglo Irish Bank, Irish Nationwide and the
EBS. There are also NAMA bonds in issue with a nominal value of€29bnxxxvii.
Finally, we include Emergency Liquidity Assistance which is ultimately backed by the Irish Government. The ELAs are
listed as ‘Other Assets’ on the CBI’s balance sheet. This totalled €66.79bn on the 25th March 2011. However, following
Buiter (2011) we deduct €1.3bn as a stable estimate of the other components of “other assets”. Also, following Buiter
(2011a)xxxviii, we make the conservative assumption that all of the promissory notes have been offered as collateral for
the ELA lending, and so they are deducted to arrive at a net figure approximating the increase in national debt.
When these additional liabilities are taken into account we can see a clearer picture of the scale of the Irish sovereign
responsibility for the debts of banks. Of the €411.1bn total covered bank liabilities shown in Table 8 above, a very
conservative estimate of approximately€279.3bn is ultimately backed by the state. This is approximately 68%.
To provide a complete snapshot of Irish debt at this date, this liability is added to the government bonds in issue, as
shown in Table 10 below
20

8/4/2019 Killiam Garvey Shaw.an Audit of Irish Debt
http://slidepdf.com/reader/full/killiam-garvey-shawan-audit-of-irish-debt 29/48
Table 10: Scale of actual and contingent national debt at 31 March, 2011
Direct Government Debt Billion € Long Term Debt Securities Government 89.9
Short Term Debt Securities Government 1.9
Total 91.8
Covered debts of Irish banks
ELG Scheme 111
Deposit Guarantee Scheme 74.1
Promissory Notes 30.9
Nama Bonds 28.7
ELA, net of Promissory Notes 34.6
Total 279.3
Scale of Irish national debt at 31 March, 2011 371.1
This figure of €371.1bn carries a number of caveats. Firstly, it is a very conservative estimate of the contingent liabilities,
as it is unclear to what extent assets of covered institutions for which the State has a contingent liability are pledged
as collateral for further liquidity assistance. Secondly, care should be taken in interpreting the breakdown between
“mainstream” government bonds in issue and the covered debts of Irish banks. Given the sharp increase in overall long-
term government bonds outstanding since the start of the financial crisis, it is reasonable to assume that a large part
of the €91.8 billion raised by the sale of government bonds was also due to the banking crisis. Thirdly, while the totals
do not include unguaranteed bonds in the covered institutions, at the time of writing in early September, 2011, the
prospect for avoiding the repayment of these bonds appeared mixed. Finally, our figures are based on data from the
CBI and NTMA, and so are subject to the same caveats as they apply on their own websites.
21
8/4/2019 Killiam Garvey Shaw.an Audit of Irish Debt
http://slidepdf.com/reader/full/killiam-garvey-shawan-audit-of-irish-debt 30/48
//////////////////////////////////////////////////////////////
//////////////////////////////////////////////////////////////
7. Other Market Activity
Aside from borrowing, some other market transactions have been cited as influencing factors on sovereign debt activity
since the crisis began. The effects of these activities have been linked primarily to issues around market transparency
and in particular to the healthy operation of the European sovereign bond market. In June 2010, the German chancellor
Angela Merkel and French president Nicolas Sarkozy wrote a joint letter to European commission president Jose
Manuel Barroso, in which they said:
There is an urgent need for the commission to speed up its work to establish stricter
control of markets in sovereign credit default swaps (CDS) and of short-selling. We
believe it is indispensable to reinforce the transparency of short positions on equities and
bonds, especially sovereign bonds. (Reported in Moya, 2010)
In this section, we look at credit default swap (CDS) market activity and short-selling activity as it relates to Irish
sovereign debt. In doing so, it is worth noting that as well as the more complex CDS activity and short selling, hedge
funds and other speculative investors have also taken straight ownership positions in Irish bonds.
7.1 Credit Default Swaps
Credit Default Swaps or CDS are tradable, over-the-counter derivatives that function like a default insurance contract
for debt. If a borrower defaults on a loan or bond, the holder of a CDS (the protection buyer) is paid compensation.
When the holder of a CDS is protecting an investment that they own, there is a very real sense that it is a form of
insurance, paying out to compensate the holder for loss in the event of a default. However, CDS can also be boughton assets which are not owned by the purchaser. In this case, it is more useful to think of the instrument as a bet that
the borrower will not meet their obligations. So swap buyers may be protecting investments they own or simply making
bearish bets against the possibility of a country or other borrower defaulting. The trigger for the CDS paying out to
the holder rests with a decision made by a committee in the International Swaps and Derivatives Association. This
means that a CDS credit event can occur without a formal default on the debt.
The price of a CDS is quoted in basis points, or one-hundredth parts of one percent. This means that a one basis point
change on a CDS protecting, say,€10m of debt from default for 5-years is equivalent to €1,000 a year.
CDS are categorised as sovereign where the borrower is a government or corporate where the borrower is a
corporation. Trading activity in the market for sovereign CDS is a little over a decade old and is small relative to
corporate CDS. Irish CDS can provide hedges for holders of Irish government bonds as well as for international banksthat lend to Irish corporations and banks. To date, the Bank for International Settlements (BIS) has not published any
research detailing the banking institutions that may hold CDS on European sovereign debt. This lack of transparency
may be having some impact on the policy approach to dealing with the Greek re-structuring. The recent agreement
between the EU-IMF and the Greek government is carefully drawn up so as to avoid those criteria that would trigger
a CDS “credit event.”xxxix
Although CDS have little direct impact on the sovereign bond market, the price investors are willing to pay for CDS is
an indication of credit risk. As an indicator, it has the advantage of coming out almost in real time, which is more useful
than the intermittent credit ratings provided by agencies such as Standard and Poor’s etc. For example, during recent
Greek debt talks and the speculation on their potential impact on Ireland, the price of CDS on Irish sovereign debt rose
by 27 basis points to 740.
22
“”

8/4/2019 Killiam Garvey Shaw.an Audit of Irish Debt
http://slidepdf.com/reader/full/killiam-garvey-shawan-audit-of-irish-debt 31/48
On the 21st of June, 2011 the ISDA announced a credit event had occurred in AIB debt arising from a missed payment
on Lower Tier 2 AIB debt. The CDS sold on these AIB subordinated and senior bonds have been triggered. This means
that those bondholders who also held CDS on their debt were able to recover their losses without a direct cost to the
bankxl.
Overall, CDS activity was seen to be a problem during the ongoing crisis, contributing to a lack of transparency,
increased risk of negative price spirals and higher settlement risk. There has been some official response to this,
reasonably well-coordinated between the EU and the US. This centres on the setting up of a clearinghouse that would
stand between over-the-counter (OTC) derivatives counterparties, protecting them from each other’s default. If this
is successful, it should reduce the overall systemic risk, as the potential domino effect of counterparty default would
be haltedxli.
7.2 Short-Selling
Short selling essentially describes the situation where an investor sells an asset before he or she purchases it. This isprofitable in times of falling prices, as the asset can be sold at a higher price than that at which it is later bought back.
Bonds and shares can both be subject to short-selling. In practice, a short seller in the bond market borrows the bond
from another investor for a fixed period. The borrowed bond is sold on the market immediately, and is bought back
on the open market in time to return it to the original holder. As long as the price of the bond falls between these two
dates, the short seller will make a profit overall.
Short selling is what’s known as a marginable transaction, which means that an investor must open a margin account
with a broker in order to sell short. This essentially means you need to maintain a cash balance with the broker, or offer
some of your investment assets as “margin,” a kind of collateral to enable you to borrow. For this reason, short-selling
requires both a strong view of market dynamics and significant capital. It is high-risk speculation, and is generally
undertaken by hedge funds. Aggressive short-selling can manipulate a market and depress the value of an asset, a sort
of self-fulfilling prophecy.
When we look at the market effects of CDS activity and short-selling of Irish government bonds, it is the latter that is
likely to have much greater effect. For these reasons, in mid-May ‘naked’ short selling of government bonds was
banned by German Government. Short –selling of bank shares has been banned in a piecemeal way by several Euro-
zone countries, and there are moves for an EU-wide ban.
Throughout 2011, government bond price volatility has been aggravated by the market activities described above, and
by credit rating changes. This had immediate implications for the ownership profile of Irish government debt, because
many pension funds and financial institutions are only permitted to hold debt that meets strong ratings criteria. The
lower credit rating also resulted in a higher margin to trade the debt throughout summer 2011.
23

8/4/2019 Killiam Garvey Shaw.an Audit of Irish Debt
http://slidepdf.com/reader/full/killiam-garvey-shawan-audit-of-irish-debt 32/48
//////////////////////////////////////////////////////////////
//////////////////////////////////////////////////////////////
8. Summary and conclusions
The profile of investors in Irish sovereign debt has changed significantly since the Irish banking guarantee was put in
place in 2008. Prior to the crisis, Irish debt was viewed by the market as a low yielding, low risk asset and it usually
found a home on European banking books, insurance companies and pension funds.The crisis has changed the nature
of Irish sovereign debt and has led to the creation of a number of credit instruments that affect the credit risk of the
Irish sovereign. Over the past three years the trading activity in Irish sovereign debt and related instruments has been
unprecedented both in terms of volume and trade-type.
Throughout 2009, there was increased institutional ownership in Irish sovereign debt as deficit reducing action and
‘quantitative easing’ were expected to positively affect the ability of the Irish state to repay. By mid-2010 these
institutions began to reduce their positions in Irish sovereign debt as the ECB increased the purchasing of Irish debtof all maturities.
The second quarter of 2010 was a period when trading activity in relation to Irish sovereign debt changed. There was an
increase in speculative trading by hedge such as Groveland Capital, Matrick Group and Corriente Advisors LLC, as covered
in media reports such as Webb (2010). Many of these trades in CDS were betting that Ireland and other peripheral
countries will default or restructure. The changed view of Irish sovereign debt could be observed in the activity of CDS
sellers who began borrowing Irish sovereign debt as a hedge should they have to payout if a default occurs.
The spike in Irish bond yields in 2011 reflected a nadir in confidence about the sovereign debt, which has since been
mitigated, as earlier discussed, by increased trading by non-Irish investors.
It is also important to note that this is more than an Irish problem. Chart 12 below, sourced from ECB statisticsxlii
,shows government debt as a percentage of GDP all across the Eurozone.
Chart 12: Government debt as a % of GDP across the Euro area
24
8/4/2019 Killiam Garvey Shaw.an Audit of Irish Debt
http://slidepdf.com/reader/full/killiam-garvey-shawan-audit-of-irish-debt 33/48
The term “constructive ambiguity” was introduced into common currency by Henry Kissinger to describe the deliberate
use of unclear language in negotiating on a sensitive issue. It is also used to describe the ECB’s policy on public
information on bank bailouts. Ihle (2010) also reports it as part of the thinking behind the original bank bailout of
2008. The idea is that if banks are not clear on exactly to what extent they will be supported, this will reduce the moral
hazard in the system.
Often criticised as a synonym for fudging, constructive ambiguity is certainly not a concept consistent with
transparency. As recently as 2010, the ECB has reiterated this need for secrecy. In an opinion published in January 2011
on a proposed directive, it says
…. information on central banks’ lending or other liquidity facilities provided to a
particular credit institution, including emergency liquidity assistance, needs to be kept
confidential in order to contribute to the stability of the financial system as a whole and
maintain public confidence in a period of crisisxliii.
Such secrecy may contribute to stability, although this is arguable given recent evidence. In the context of a lender of
last resort such as a central bank, it is generally intended to reduce moral hazard among banks which might in the
future avail of a bailout. Again, this is not unanimously accepted. In an ECB working paper, Freixas et al (2003) take
the view that clarity and transparency actually reduce moral hazard. Advocating clarity in the conditions for emergency
liquidity assistance they write:
This recommendation contrasts with the notion of “constructive ambiguity” often invoked
to reduce the moral hazard allegedly associated with a CB safety net.
(Freixas et al, 2003:27)
More recently, Vinogradov (2010) finds that in times of high volatility, particularly when there is a bailout involved, such
a policy can be unhelpful. It certainly does not serve the needs of Irish people who wish to determine how they havebeen held responsible for this increased national debt.
The anonymity of bondholders is of long standing, and in normal circumstances has some justification. The purchase
of a “bearer bond” is essentially like the possession of a large-denomination banknote, entitling the holder to redeem
a sum of money from the central bank in the future. At any given time, it is not important to know exactly who is
holding these notes.
By contrast, the names of shareholders are maintained on a register by the company which has issued the shares, and
this register is updated to take account of secondary trading between investors. The rationale for identifying
shareholders is clear: these are the people who control the company, who decide on policy via the AGM and who elect
the directors. In these circumstances it is obviously in many people’s interest that they are not anonymous. There is
an argument to be made that in very unusual circumstances where policy is predicated on the needs of bondholders,their anonymity is not helpful.
It is clear that the bulk of the debts for which the Irish sovereign is now responsible are due, in one form or other, to
the bank guarantee of September 2008, and the follow-on ELG scheme and ELA operations. The thinking around the
decision to issue a blanket guarantee is revealed in a confidential cable from the US Embassy in Dublin, released by
Wikileaks two years later. The cable reveals that at the time of the guarantee, the scale of impaired loans was severely
underestimated by government officials. Embassy officials commented:
It may be that government officials are being a bit optimistic in their assessment of the
level of impaired assets. It begs the question: if the level of impaired assets is not a
problem, why the sudden pressure on Irish banksxliv.
25
“”
“”
“”

8/4/2019 Killiam Garvey Shaw.an Audit of Irish Debt
http://slidepdf.com/reader/full/killiam-garvey-shawan-audit-of-irish-debt 34/48
Subsequent cables from 2009xlv express the concern of US Embassy officials at government handling of the situation.
Nevertheless, the situation has evolved to one in which liquidity flows from the government to the six troubled banks,
apparently compensating for the flow of deposits away from these banks, to institutions located in other parts of Europe.
Chart 13 below represents in graphic form the main flows of cash and guarantees between the Irish government and
people, the covered institutions, NAMA, the ECB and the bondholders.
Chart 13: Cashflows and Guarantees
26

8/4/2019 Killiam Garvey Shaw.an Audit of Irish Debt
http://slidepdf.com/reader/full/killiam-garvey-shawan-audit-of-irish-debt 35/48
The chart is a simplified image of the situation, which for clarity omits such details as the flight of deposits from Irish
banks to other banks in the Eurozone, the ownership of Irish sovereign debt by Irish and European banks, etc. It does
show some of the main flows of cash, and lines of guarantee. It also shows how the banks’ borrowing from the ECB
is geared up in three ways, by the use of Nama bonds, own-use bonds and cross-holdings of each other’s bonds as
collateral. There are several such circular flows of cash. Overall, however, it is clear that liabilities, both real and
contingent, flow from Ireland as a country and a people through the covered banks to the holders of bank bonds,
leaving Ireland carrying most of the debts.
In addition to these liabilities, there are unguaranteed bonds owed by the covered institutions but not covered by the
ELG scheme. Table 8 above shows that at 31 March, 2011, total liabilities of the covered institutions excludingdeposits
and minority interests came to €87.6bn.xlvi Excluding the subordinated debt, the total is €81bn. Since the amount of
debt covered under the ELG scheme is stable at roughly€30bn, this leaves a potential of over €50bn in unguaranteed
bank bonds. While there is no formal guarantee in place for these debts, the state-owned banks have to date repaid
these bonds as and when they have fallen due.
Given this situation, we leave the last word to former US President, Rutherford B Hayes, who wrote in 1879:“It is the
debtorthat is ruined by hard times .” xlvii Forthe foreseeable future, times will be hard. Short of some structural change,
the Irish people will bear the bulk of the debt that has arisen from the banking crisis.
27

8/4/2019 Killiam Garvey Shaw.an Audit of Irish Debt
http://slidepdf.com/reader/full/killiam-garvey-shawan-audit-of-irish-debt 36/48
//////////////////////////////////////////////////////////////
//////////////////////////////////////////////////////////////
28
9. References
Anglo (2011). Anglo Irish Bank Interim Report, Six months ended 30 June 2011. Available online at:
http://www.angloirishbank.com/About-Us/Reports/Interim_Report_2011/Interim_Results_2011.pdf
Bank of Ireland (2011). Annual Report 2010. Available online at:
http://www.bankofireland.com/fs/doc/publications/investor-relations/annual-report-for-the-twelve-month-
period-ended-31-december-20102.pdf
Buiter, W., Michels, J. and Rahbari, E. (2011). ELA: An Emperor without Clothes?, Global Economics View, January
2011. Available online at: http://www.nber.org/~wbuiter/ela.pdf
Buiter, W., Michels, J. and Rahbari, E. (2011a). ELA Revisited: A Clarification, Global Economics View, February 2011.
Available online at: http://www.nber.org/~wbuiter/sonofela.pdf
CAG (2010). Report of the Comptroller and Auditor General on the Accounts of the Public Services – 2009,
published September 2010. Available online at http://audgen.gov.ie/viewdoc.asp?DocID=1226
Carswell, S. (2011). Banks using guarantee to access ECB loans, The Irish Times, Feb 17. Available online at:
http://www.irishtimes.com/newspaper/finance/2011/0217/1224290024749.html
Carswell, S. (2011a). EU approves extension of State bank guarantee, The Irish Times, Jun 02. Available online at:
http://www.irishtimes.com/newspaper/finance/2011/0602/1224298258783.html
Carswell, S. (2011b). Philosophy of a vulture fund: hedge fund swoops to pick at carcases of Irish banks, Irish Times,
June 10. Available online at: http://www.irishtimes.com/newspaper/finance/2011/0610/1224298684073.html
Carswell, S. (2011c). AIB move triggers ‘failure to pay’ event, Irish Times, June 22. Available online at:
http://www.irishtimes.com/newspaper/finance/2011/0622/1224299384551.html
CBI (2011). Central Bank of Ireland Statistics. Available online at:
http://www.centralbank.ie/POLSTATS/STATS/Pages/default.aspx
CBI (2011a). Central Bank of Ireland Annual Report 2010. Available online at:
http://www.centralbank.ie/publications/Documents/2010%20Annual%20Report%20-%20FINAL.pdf
CBI (2011b). Central Bank of Ireland Quarterly Financial Accounts for Ireland
Q1 2011. August 2011.
Central Statistics Office (2011). Resident Holdings of Foreign Portfolio Securities, 31 December 2010, CSO, 30
August 2011. Available online at:
http://www.cso.ie/releasespublications/documents/economy/2010/reshold_2010.pdf
Crimmins, C. (2011). Foreign buyers pushing Irish yields down-Fin Min, Forex News, 1 September. Available online
at: http://www.fxmemo.com/forum/thread/3459331/
ECB (2011), Decision of the European Central Bank of 14 May 2010 establishing a securities markets programme.
(ECB/2010/5). Available online at: http://www.ecb.int/ecb/legal/pdf/l_12420100520en00080009.pdf

8/4/2019 Killiam Garvey Shaw.an Audit of Irish Debt
http://slidepdf.com/reader/full/killiam-garvey-shawan-audit-of-irish-debt 37/48
ECB (2011a): ECB Financial Stability Review, June 2011. Available online at:
http://www.ecb.int/pub/fsr/shared/pdf/ii3financialstabilityreview201106en.pdf?b62b29f42970899f41bdaf928d
ba8a81
The Economist (2010). Bank rupture: Ireland’s crippled banks and sluggish economy spell big trouble. 9th
September, 2010
Freixas, X., Parigi, B.M. and Rochet, J-C (2003). The Lender of Last Resort: a 21st Century Approach, ECB Working
Paper 298, December 2003.
ICB (2010). The Irish Banking Crisis Regulatory and Financial Stability Policy 2003-2008: A Report to the Minister
for Finance by the Governor of the Central Bank, May 2010. Available online at: http://www.bankinginquiry.gov.ie/
Ihle, J. (2011). Blanket bank guarantee was to avoid ECB and market scrutiny.
Sunday Tribune, 30 January
ILP (2010). Irish Life & Permanent plc Annual Report and Financial Statements 2009, published March, 2010.
Available online at: http://www.irishlifepermanent.ie/~/media/Files/I/Irish-Life-And-
Permanent/Attachments/pdf/annual-and-interim-reports/2009/annual-report-low-res-irish-life.pdf?
ILP (2011). Irish Life & Permanent plc 2010 Preliminary Announcement:
Year ended 31 December 2010, published March, 2011. Available online at:
http://www.irishlifepermanent.ie/investor-relations/reports-and-presentations/annual-and-interim-
reports/2010.aspx
ISE (2011). August 2011 ISE monthly statistical report, available online at www.ise.ie
Leahy, P. (2010). Credit union body angered at Anglo Irish link, Sunday Business Post, 25 April, 2010.
McDonnell, T. (2011). The Debt and Banking Crisis: Progressive Approaches for Europe and Ireland, Tasc Discussion
Paper, May. Available online at: http://www.tascnet.ie/upload/file/DebtBanking190511.pdf
Moya, E. (2010). Ban naked short-selling of government bonds, say Merkel and Sarkozy, The Guardian, 9 June.
Murphy, M. (2010). Stress test shows RBS exposure to Irish debt, Financial Times, 1 October, 2010. Available online
at: http://www.ft.com/intl/cms/s/0/7db51bd6-cd8b-11df-9c82-00144feab49a.htmlaxzz1X0uRqvAS
Nama (2010). National Asset Management Agency Annual Report and Financial Statements 2010. Available online
at: http://www.nama.ie/Publications/2011/NAMAAnnualReport2010.pdf
Nama (2011). Unaudited Quarterly Accounts of the National Asset Management Agency and its Group Entities for
the Quarter ended 31 March, 2011. Available online at:
http://www.nama.ie/Publications/2011/Section55QuarterlyAccounts31032011.pdf
National Treasury Management Agency (2011). Various NTMA publications, separately footnoted, available at
http://www.ntma.ie
Noonan, L. (2011). Banks pay less than 3pc interest on €51bn of emergency funding, Irish Independent, February 8.
Available online at: http://www.independent.ie/business/irish/banks-pay-less-than-3pc-interest-on-euro51bn-of-
emergency-funding-2529378.html
29
8/4/2019 Killiam Garvey Shaw.an Audit of Irish Debt
http://slidepdf.com/reader/full/killiam-garvey-shawan-audit-of-irish-debt 38/48
Noonan, L. (2011a). Controversial €20bn ‘own-use’ bond operation stays in place, Irish Independent, April 28.
Available online at: http://www.independent.ie/business/irish/controversial-euro20bn-ownuse-bond-operation-
stays-in-place-2631801.html
Noonan, L. (2011b). Noonan bids to restructure€3bn-a-year Anglo handouts, Irish Independent, September 2.
Available online at:
http://www.independent.ie/business/irish/noonan-bids-to-restructure-euro3bnayear-anglo-handouts-
2864799.html
Oireachtas (2010)/(2011). Written answers to questions raised in the Dáil or Seanad. Various answers cited are
separately footnoted from the text. Available online at http://debates.oireachtas.ie
Oliver, E. (2011). NTMA ups activity to raise cash in short term markets, Irish Independent, August 23. Available
online at: http://www.independent.ie/business/irish/ntma-ups-activity-to-raise-cash-in-short-term-markets-
2854780.html
O’Sullivan, V. and Kinsella, S. (2011). An institutional architecture for meta-risk regulation in Irish banking: Lessons
from Anglo Irish Bank’s Minsky moment, Journal of Banking Regulation. Advance online publication 22 June.
Available online at: http://www.palgrave-journals.com/jbr/journal/v12/n4/abs/jbr201113a.html
Portes, R. (2011). Restructure Ireland’s Debt, VOX, 26 April. Available online at:
http://www.voxeu.org/index.php?q=node/6380
Reynolds, A. (2011). Contrary To Keynesians, Cuts Help Default-Prone, Investors’ Business Daily, 9 June, 2011.
Available online at: http://www.investors.com/NewsAndAnalysis/Article/574878/201106091806/Contrary-To-
Keynesians-Cuts-Help-Default-Prone.htm
Sinn, H-W. (2011). The ECB’s Stealth Bailout, VOX, 1 June. Available online at:
http://www.voxeu.org/index.php?q=node/6599
Standard & Poor’s (2010). Explaining Standard & Poor’s Adjustments to Ireland’s Public Debt Data, 24th August.
Available online at: http://www.standardandpoors.com/ratings/articles/en/eu/?assetID=1245228020314
Vinogradov, D. (2010). Destructive Effects of Constructive Ambiguity in Risky Times, presented at the Conference on
“Monetary policy and financial stability - what role for central bank communication?” in Amsterdam, November 2010
Webb, N. (2010). Hedge funds in €3bn gamble on Irish default, Sunday Independent, May 23. Available online at:
http://www.independent.ie/business/hedge-funds-in-83643bn-gamble-on-irish-default-2191320.html
Wikileaks (2008)/(2009). Cables from the Embassy of the United States, Dublin, released by Wikileaks. Various
cables cited are separately footnoted from the text. Available online at: http://wikileaks.org
30
8/4/2019 Killiam Garvey Shaw.an Audit of Irish Debt
http://slidepdf.com/reader/full/killiam-garvey-shawan-audit-of-irish-debt 39/48
//////////////////////////////////////////////////////////////
//////////////////////////////////////////////////////////////
31
Appendix 1
Glossary of Acronyms
For a comprehensive glossary of financial terms relevant to this audit see
http://www.centralbank.ie/Pages/glossary.aspx
CBI Central Bank of Ireland
CDS Credit Default Swap
CIFS The Credit Institutions (Financial Support) Scheme 2008
EBA European Banking Authority
ECB European Central Bank
ELA Irish Central Bank’s Emergency Liquidity Assistance
ELG The Credit Institutions (Eligible Liabilities Guarantee) Scheme 2009
EU European Union
FRN Floating Rate Note
IMF International Monetary Fund
ISE Irish Stock Exchange
LTRO The ECB’s Longer-term refinancing operations
NAMA National Asset Management Agency
NTMA National Treasury Management Agency
SI Statutory Instrument
SMP The ECB’s Securities Markets ProgrammeSPV Special Purpose Vehicle

8/4/2019 Killiam Garvey Shaw.an Audit of Irish Debt
http://slidepdf.com/reader/full/killiam-garvey-shawan-audit-of-irish-debt 40/48
32
//////////////////////////////////////////////////////////////
//////////////////////////////////////////////////////////////
Appendix 2
ELG Certificates to mid-August, 2011
These details are summarised from data on the NTMA website
Date Institution Guaranteed
4/1/2010 Irish Life & Permanent US$ 4bn US Commercial Paper Note Programme
4/1/2010 Irish Life & Permanent UK , Eligible Debt Securities Programme
8/1/2010 Irish Life & Permanent €8bn Euro Commercial Paper Programme
8/1/2010 Irish Life & Permanent €1.5bn French Certificats de Depot Programme
11/1/2010 Bank of Ireland €1bn French Certificats de Depot Programme
11/1/2010 Bank of Ireland US$ 10bn US Commercial Paper Note Programme
11/1/2010 Bank of Ireland US$ Yankee CD’s
11/1/2010 Bank of Ireland London CD’s (CREST eligible)
11/1/2010 Bank of Ireland London CD’s
11/1/2010 Bank of Ireland €5bn Euro Commercial Paper Programme.
14/1/2010 Irish Life & Permanent US$ 1.75 bn. 3.6% Notes due 2013.
13/1/2010 Bank of Ireland €4bn guaranteed Euro Note Programme
21/1/2010 Allied Irish Banks, plc Programme for the issuance of certification of deposits (US CD’s)
21/1/2010 Allied Irish Banks, plc €5bn Euro Commercial Paper Programme
21/1/2010 Allied Irish Banks, plc Programme for the issuance of certification of deposits (London CD’s)21/1/2010 Allied Irish Banks US$ 10bn US Commercial Paper Programme
North America Inc
28/1/2010 Bank of Ireland €2.5bn 4% notes due 2015
28/1/2010 Anglo Irish Bank US$4bn US Commercial Paper Programme.
28/1/2010 Anglo Irish Bank London CDs
28/1/2010 Anglo Irish Bank €2.5bn Euro Medium Term Note Programme
28/1/2010 Anglo Irish Bank €3bn Euro Commercial Paper Programme
23/2/2010 Anglo Irish Bank €2bn French CD Programme
01/2/2010 EBS Building Society London Certificate of Deposit Programme
01/2/2010 EBS Building Society €1.5bn Euro Commercial Paper and Certificate of Deposit Programme
01/2/2010 EBS Building Society €2.5bn Euro Medium Term Note Programme09/2/2010 EBS Building Society €1.5bn French CD Programme
04/2/2010 Allied Irish Banks, plc €1.5bn Notes due 2013
10/2/2010 Bank of Ireland Bank of Ireland SEK Notes due 2011
01/3/2010 Allied Irish Banks, plc €172m Floating Rate Notes due 2013
24/2/2010 Irish Life & Permanent €3bn Euro Note Programme
25/2/2010 EBS Building Society €1bn notes due 2015
01/3/2010 Allied Irish Banks, plc SEK 700m Floating Rate Notes due 2013.
11/3/2010 Irish Life & Permanent €2bn guaranteed notes 2015
15/3/2010 Allied Irish Banks, plc $750m FRN due 2013
12/3/2010 Allied Irish Banks, plc €100m puttable notes due 2011
19/3/2010 Allied Irish Banks, plc $1bn FRN due 2012

8/4/2019 Killiam Garvey Shaw.an Audit of Irish Debt
http://slidepdf.com/reader/full/killiam-garvey-shawan-audit-of-irish-debt 41/48
Date Institution Guaranteed
19/3/2010 Allied Irish Banks, plc €2bn Notes due 2015
23/3/2010 Allied Irish Banks, plc AIB€
100m EMTN due 201124/3/2010 Allied Irish Banks, plc €4 billion Euro Medium Term Note Programme
15/4/2010 Anglo Irish Bank Anglo €1.5bn EMTN due 2012
15/4/2010 Anglo Irish Bank Anglo €750m EMTN due 2015
22/4/2010 Irish Life & Permanent €1.25bn EMTN due 2013
03/9/2010 Irish Nationwide BS€4bn 3% EMTN Note due 2011
03/11/2010 Bank of Ireland €750m 5.875% EMTN Notes due 3 May 2013
30/12/2010 Bank of Ireland £172.9m 6.75% EMTN notes due 30 Jan 2012
30/12/2010 Bank of Ireland €531m 6.75% EMTN notes due Jan 2012
07/01/2011 Bank of Ireland €5bn EMTN programme
25/01/2011 Allied Irish Banks, plc €2.87bn FRN due April 2011
26/01/2011 Bank of Ireland €3bn FRN due April 201126/01/2011 Bank of Ireland €1.9bn FRN due May 2011
26/01/2011 Bank of Ireland €2.6bn FRN due May 2011
26/01/2011 Bank of Ireland €2.2bn FRN due May 2011
26/01/2011 Irish Life & Permanent €3.440m FRN due April 2011
28/01/2011 EBS Building Society €1.82bn FRN due April 2011
10/02/2011 Bank of Ireland €980m FRN due May
17/02/2011 Bank of Ireland CAD FRN due Jan 2012
26/04/2011 Bank of Ireland €2bn FRN due 29 July 2011
26/04/2011 Allied Irish Banks, plc €2.87bn FRN due 12 Aug 2011
27/04/2011 Irish Life & Permanent €3.44bn FRN due 12 Aug 2011
27/04/2011 EBS Building Society €1.82bn FRN due 12 Aug 2011
27/04/2011 Bank of Ireland €2.2bn FRN due 3 Aug 2011
28/04/2011 Bank of Ireland €2.6bn FRN due 5 Aug 2011
03/05/2011 Bank of Ireland €1.9bn FRN due 10 Aug 2011
10/05/2011 Bank of Ireland €980m FRN due 12 Aug 2011
26/07/2011 Bank of Ireland €2bn FRN due 28th Oct 2011
27/07/2011 Bank of Ireland €2.2bn FRN due 1st Nov 2011
02/08/2011 Bank of Ireland €2.6bn FRN due 4th Nov 2011
02/08/2011 Allied Irish Banks, plc €4,700,000,000 Fixed Rate Notes due 10 Nov 2011
05/08/2011 Irish Life & Permanent €3,300,000,000 4% due 27 Oct 2011
04/08/2011 Bank of Ireland€
1,900,000,000 3 month Euribor Notes due 9 Nov 201108/08/2011 Bank of Ireland €1,000,000,000 3 month Euribor Notes due 11 Nov 2011
33

8/4/2019 Killiam Garvey Shaw.an Audit of Irish Debt
http://slidepdf.com/reader/full/killiam-garvey-shawan-audit-of-irish-debt 42/48
//////////////////////////////////////////////////////////////
//////////////////////////////////////////////////////////////
34
Endnotes
i Source: The website of the Irish stock Exchange (ISE), accessed on 13/6/2011http://data.ise.ie/app/bondGenerateGraphTemp.asp?start_day=1&start_month=6&start_year=2011&end_day=1&end_month=6&end_year=2010&bToGraph=72953&bToCompare=
ii Available online at http://www.ntma.ie/Publications/2010/InfoPackageOct2020Bond.pdf
iii Written answer from 17 May, 2011, available online athttp://debates.oireachtas.ie/dail/2011/05/17/00076.asp
iv As explained in the Quarterly Financial Accounts for Ireland, Q1, 2011: “During 2010, the State financed capitalinjections to Anglo Irish Bank and Irish Nationwide Building Society (INBS) through the issuance of apromissory note to the banks, which is classified as a loan in Government accounts. During Q1 2011, the
promissory note accounted for 17 per cent of Government liabilities.” (CBI 2011b:6)v Available online at http://www.centralbank.ie/polstats/stats/sis/pages/issues.aspx
vi For example, Oliver (2011)
vii The benchmark bonds are traded through Euroclear.
viii Data obtained from the Irish Stock Exchange at www.ise.ie
ix Data obtained from the Irish Stock Exchange at www.ise.ie
x In response to a question by Deputy Sean Fleming, available online athttp://debates.oireachtas.ie/dail/2011/04/20/00071.asp Minister Noonan said: “The Central Bank of Irelandmaintains a register of Irish Government bonds. The bonds held by Euroclear, representing 99.74% of IrishGovernment bonds in issue, are registered in one omnibus account in the Central Bank’s register but details ofthe bond transactions relating to those bonds are held by Euroclear. All transactions in relation to the
remaining 0.26% of Irish Government bonds are made through the Central Bank and information regardingindividual holders is treated as confidential.”
xi Dáil answers, available online at http://debates.oireachtas.ie/dail/2010/06/01/00109.asp#N2
xii Details of the extension at http://ntma.ie/Publications/2011/ELGScheme.pdf
xiii Available online at http://ntma.ie/Publications/2011/Outstanding_ELG.pdf
xiv See CBO (2010), page 122 for a discussion on the penalty rate
xv Dáil answers, available online at http://debates.oireachtas.ie/dail/2011/07/20/00075.asp
xvi Noonan (2011) in the Irish Independent
xvii Dáil answers, available online at http://debates.oireachtas.ie/dail/2010/04/20/00109.asp
xviii Extracted from Table A.4.2 of the Money and Banking Statistics: July 20111- Accessed online 2 September 2011
at http://www.centralbank.ie/polstats/stats/cmab/Documents/2011m07_ie_monthly_statistics.pdfxix Dáil answers, available online at http://debates.oireachtas.ie/dail/2010/06/09/00044.asp#N2
xx Page 117
xxi Figures for this table have been taken from the NTMA list of ELG certificates.
xxii ILP (2010), p.209
xxiii ILP (2011) p. 97
xxiv Available online http://www.ntma.ie/GovernmentBonds/Daily_Bonds_Outstanding.pdf
xxv Table A.4.2 - Accessed online 28 June 2011 athttp://www.centralbank.ie/polstats/stats/cmab/Documents/2011m05_ie_monthly_statistics.pdf
xxvi Table A.4.2 - Accessed online 28 June 2011 athttp://www.centralbank.ie/polstats/stats/cmab/Documents/2011m05_ie_monthly_statistics.pdf

8/4/2019 Killiam Garvey Shaw.an Audit of Irish Debt
http://slidepdf.com/reader/full/killiam-garvey-shawan-audit-of-irish-debt 43/48
xxvii These are AIB, Bank of Ireland, Irish Life and Permanent and EBS
xxviii Available online at http://debates,oireachtas.ie/dail/2011/06/02/00051.asp
xxix ECB press release 10 May, 2010. Available online athttp://www.ecb.int/press/pr/date/2010/html/pr100510.en.html
xxx Available online http://www.ecb.int/mopo/liq/html/index.en.html
xxxi Table A.2 Financial Statement of the Bank of Ireland: Accessed online athttp://www.centralbank.ie/publications/Documents/Quarterly%20Bulletin%20Q3.pdf
xxxii Compiled from data available online at http://www.centralbank.ie/polstats/stats/conbs/Pages/data.aspxand http://www.centralbank.ie/polstats/stats/cmab/pages/Money%20and%20Banking.aspx
xxxiii Available online at http://www.ntma.ie/Publications/2009/ELG_Scheme.pdf
xxxiv Available online at http://ntma.ie/Publications/2011/Outstanding_ELG.pdf
xxxv Available onlinehttp://www.centralbank.ie/polstats/stats/conbs/documents/ie_consolidated_banking_statistics_covered_in
st_aggregate_bs.xlsxxxvi Source: http://ntma.ie/GovernmentDebt/CompositionOfDebt.php
xxxvii Available online http://www.nama.ie/Publications/2011/Section55QuarterlyReport31032011.pdf
xxxviii Buiter (2011a:4) notes: “Since these promissory notes were issued by the Irish sovereign and are alreadyaccounted for in the public accounts, the increase in the ‘true’ (not the official) consolidated generalgovernment Irish gross debt as a result of ELA would be somewhat smaller than the headline €49bn or so –how much smaller depends on the amount of lending granted against such collateral.”
xxxix In the context of CDS contracts, the decision to classify whether a credit event occurs falls to a committee inthe International Swaps and Derivatives Association (ISDA). Thus a CDS credit event is materially differentfrom a default.
xl See Carswell (2011c) for more details
xli CDS clearinghouses have been launched with varying success. Clearing houses have been initiated in the USby CME and Euronext Liffe, while in Europe, current clearing providers Eurex Clearing and LCH.Clearnet havebeen involved in initiatives. These initiatives have looked to create effective counterparty solutions, an issue ofcentral concern for regulators. There is little consistency of approach to calculating margin requirements, andthere are concerns that this could become a key tool for competition between clearinghouses. There are alsounresolved issues around clearing positions in different jurisdictions.
xlii Available online at http://sdw.ecb.europa.eu/home.do?chart=t1.11
xliii Opinion of the European Central Bank of 11 January 2010 on a proposal for a directive of the EuropeanParliament and of the Council amending Directives 2003/71/EC and 2004/109/EC (CON/2010/6), cited inBuiter et al (2011)
xliv Cable ID 08DUBLIN556, available online at http://wikileaks.org/cable/2008/10/08DUBLIN556.html
xlv See for example http://wikileaks.org/cable/2009/02/09DUBLIN86.html andhttp://wikileaks.org/cable/2009/10/09DUBLIN422.html
xlvi The total of debt Certificates: 51,957, subordinated Liabilities: 6,609 and other liabilities of 29,095
xlvii Diary entry, 1879
35

8/4/2019 Killiam Garvey Shaw.an Audit of Irish Debt
http://slidepdf.com/reader/full/killiam-garvey-shawan-audit-of-irish-debt 44/48

8/4/2019 Killiam Garvey Shaw.an Audit of Irish Debt
http://slidepdf.com/reader/full/killiam-garvey-shawan-audit-of-irish-debt 45/48

8/4/2019 Killiam Garvey Shaw.an Audit of Irish Debt
http://slidepdf.com/reader/full/killiam-garvey-shawan-audit-of-irish-debt 46/48

8/4/2019 Killiam Garvey Shaw.an Audit of Irish Debt
http://slidepdf.com/reader/full/killiam-garvey-shawan-audit-of-irish-debt 47/48
8/4/2019 Killiam Garvey Shaw.an Audit of Irish Debt
http://slidepdf.com/reader/full/killiam-garvey-shawan-audit-of-irish-debt 48/48
//////////////////////////////////////////////////////////////
For further information contact:
/ / / / / / / / / / / / / / / / / / / / / / / / / / / / / / / / / / / / / /
Debt and Development Coalition Ireland
Unit F5, Spade Enterprise Centre,
North King Street, Dublin 7, Ireland
Ph: +353 1 6174835Email: [email protected]
Website: www.debtireland.org
Afri
134 Phibsborough Road, Dublin 7, Ireland.
Tel: +353 (0)1 882 7563/7581
E-mail: [email protected]
Website: www.afri.ie
Unite
15 MerrionSquareDublin 2
Tel: 01 6611063
Fax: 01 6611738
web: www.unitetheunion.org/ireland