
Kidney Injury Panel 1 (rat) Kit - Meso Scale/media/files/product...In the Kidney Injury Panel 1...
20
17497-v13-2018Mar | 1 Kidney Injury Panel 1 (rat) Kit 1-Plate Kit K15162C-1 5-Plate Kit K15162C-2 25-Plate Kit K15162C-4
Transcript of Kidney Injury Panel 1 (rat) Kit - Meso Scale/media/files/product...In the Kidney Injury Panel 1...
17497-v13-2018Mar | 1
Kidney Injury Panel 1 (rat) Kit
1-Plate Kit K15162C-1
5-Plate Kit K15162C-2
25-Plate Kit K15162C-4
17497-v13-2018Mar | 2
MSD Toxicology Assays
Kidney Injury Panel 1 (rat) Kit Lipocalin-2, Osteopontin, Albumin, TIM-1
This package insert must be read in its entirety before using this product.
FOR RESEARCH USE ONLY.
NOT FOR USE IN DIAGNOSTIC PROCEDURES.
MESO SCALE DISCOVERY® A division of Meso Scale Diagnostics, LLC. 1601 Research Blvd. Rockville, MD 20850 USA www.mesoscale.com
MESO SCALE DISCOVERY, MESO SCALE DIAGNOSTICS, MSD, MSD GOLD, DISCOVERY WORKBENCH, MULTI-ARRAY, MULTI-SPOT, QUICKPLEX, SECTOR, SECTOR PR, SECTOR HTS, SULFO-TAG, R-PLEX, S-PLEX, T-PLEX, U-PLEX, V-PLEX, STREPTAVIDIN GOLD, MESO, www.mesoscale.com, SMALL SPOT (design), 96 WELL 1, 4, 7, 9, & 10-SPOT (designs), 384 WELL 1 & 4-SPOT (designs), MSD (design), R-PLEX (design), S-PLEX (design), T-PLEX (design), U-PLEX (design), V-PLEX (design), It’s All About U, and SPOT THE DIFFERENCE are trademarks and/or service marks of Meso Scale Diagnostics, LLC. ©2012-2014, 2018 Meso Scale Diagnostics, LLC. All rights reserved.
17497-v13-2018Mar | 3
Table of Contents Introduction .................................................................................................................................................................. 4 Principle of the Assay ................................................................................................................................................... 5 Reagents Supplied ........................................................................................................................................................ 6 Additional Materials and Equipment ............................................................................................................................... 6 Safety ........................................................................................................................................................................... 7 Best Practices ............................................................................................................................................................... 7 Reagent Preparation ...................................................................................................................................................... 8 Protocol ..................................................................................................................................................................... 10 Validation and Verification........................................................................................................................................... 10 Analysis of Results ...................................................................................................................................................... 12 Typical Data ................................................................................................................................................................ 12 Sensitivity .................................................................................................................................................................. 13 Precision .................................................................................................................................................................... 14 Dilution Linearity ........................................................................................................................................................ 15 Spike Recovery ........................................................................................................................................................... 16 Specificity .................................................................................................................................................................. 16 Tested Samples........................................................................................................................................................... 17 Assay Components ..................................................................................................................................................... 18 References .................................................................................................................................................................. 18 Summary Protocol ...................................................................................................................................................... 19 Plate Diagrams ........................................................................................................................................................... 20
Contact Information MSD Customer Service Phone: 1-240-314-2795 Fax: 1-301-990-2776 Email: [email protected]
MSD Scientific Support Phone: 1-240-314-2798 Fax: 1-240-632-2219 attn: Scientific Support Email: [email protected]
17497-v13-2018Mar | 4
Introduction Traditional biomarkers in kidney injury research such as BUN and serum creatinine are not sensitive enough to detect subtle kidney damage and often do not correlate to damage measured by histopathology. MSD’s kidney injury panels were designed to use traditional and novel biomarkers in kidney injury research that can overcome these shortcomings.
Lipocalin-2 belongs to the calycin superfamily of proteins also known as neutrophil gelatinase-associated lipocalin (NGAL). It is a 25 kDa glycoprotein that acts as a transport protein carrying small hydrophobic molecules such as steroid hormones, vitamins, and metabolic products. Lipocalin-2 is expressed in most tissues and is induced in epithelial cells upon inflammation. In the kidney, lipocalin-2 may be implicated in both the progress of and protection from renal injury.
Osteopontin (OPN) is a secreted acidic and phosphorylated glycoprotein that is involved in bone metabolism, immune regulation, cell survival, and tumor progression. OPN is mostly expressed in bone, kidney, and epithelial tissues.
Albumin is the most abundant serum protein and acts as a transport protein for hemin and fatty acids. Albumin is produced in the liver and secreted into the bloodstream. Damage to the kidney can lead to albuminuria, which is secretion of albumin into the urine.
TIM-1 (T cell immunoglobulin and mucin domain containing molecule 1) also known as KIM-1 (kidney injury molecule-1) or HAVCR (hepatitis A virus cellular receptor 1) is a type 1 transmembrane glycoprotein found on CD4+ T cells and renal proximal tubule epithelial cells. The extracellular domain of TIM-1 is made of an immunoglobulin-like domain topping a long mucin-like domain, suggesting a possible role in cell adhesion. TIM-1 is released upon certain types of acute kidney injury and can be measured in urine, serum, or plasma.
17497-v13-2018Mar | 5
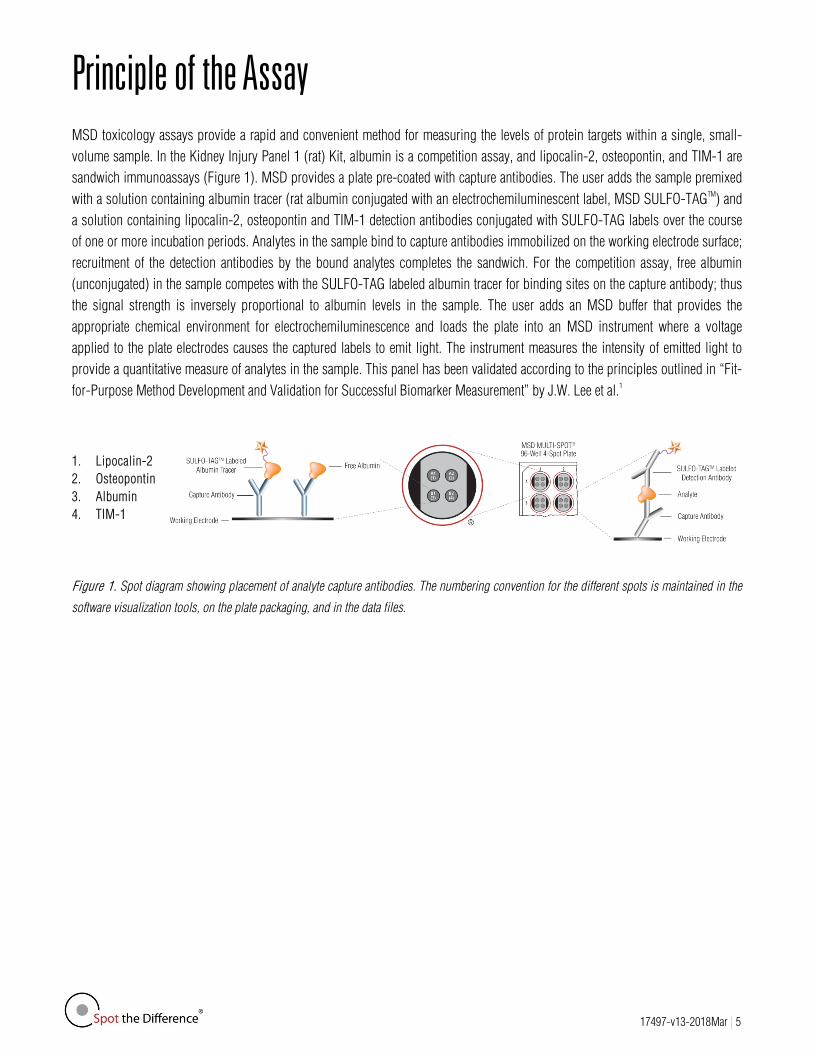
Principle of the Assay MSD toxicology assays provide a rapid and convenient method for measuring the levels of protein targets within a single, small-volume sample. In the Kidney Injury Panel 1 (rat) Kit, albumin is a competition assay, and lipocalin-2, osteopontin, and TIM-1 are sandwich immunoassays (Figure 1). MSD provides a plate pre-coated with capture antibodies. The user adds the sample premixed with a solution containing albumin tracer (rat albumin conjugated with an electrochemiluminescent label, MSD SULFO-TAGTM) and a solution containing lipocalin-2, osteopontin and TIM-1 detection antibodies conjugated with SULFO-TAG labels over the course of one or more incubation periods. Analytes in the sample bind to capture antibodies immobilized on the working electrode surface; recruitment of the detection antibodies by the bound analytes completes the sandwich. For the competition assay, free albumin (unconjugated) in the sample competes with the SULFO-TAG labeled albumin tracer for binding sites on the capture antibody; thus the signal strength is inversely proportional to albumin levels in the sample. The user adds an MSD buffer that provides the appropriate chemical environment for electrochemiluminescence and loads the plate into an MSD instrument where a voltage applied to the plate electrodes causes the captured labels to emit light. The instrument measures the intensity of emitted light to provide a quantitative measure of analytes in the sample. This panel has been validated according to the principles outlined in “Fit-for-Purpose Method Development and Validation for Successful Biomarker Measurement” by J.W. Lee et al.1 1. Lipocalin-2 2. Osteopontin 3. Albumin 4. TIM-1
Figure 1. Spot diagram showing placement of analyte capture antibodies. The numbering convention for the different spots is maintained in the
software visualization tools, on the plate packaging, and in the data files.

17497-v13-2018Mar | 6
Reagents Supplied Product Description Storage Catalog # Size
Quantity per Kit K15162C-1 K15162C-2 K15162C-4
MULTI-SPOT® 96-Well Kidney Injury Panel 1 (rat) Plate
2–8°C N45162A 4-spot 1 plate 5 plates 25 plates
SULFO-TAG Anti-rat Lipocalin-2 Antibody (50X)1 2–8°C
D23IJ-2 75 µL 1 vial D23IJ-3 375 µL 1 vial 5 vials
SULFO-TAG Anti-rat Osteopontin Antibody (50X)1 2–8°C
D23HJ-2 75 µL 1 vial D23HJ-3 375 µL 1 vial 5 vials
SULFO-TAG Albumin Tracer (200X)1 2–8°C C23IK-2 25 µL 1 vial C23IK-3 125 µL 1 vial 5 vials
SULFO-TAG Anti-rat TIM-1/KIM-1/ HAVCR Antibody (50X)1 2–8°C
D23JH-2 75 µL 1 vial D23JH-3 375 µL 1 vial 5 vials
Kidney Injury Panel 1 (rat) Calibrator Blend (20X)
≤-70°C C0162-2 15 µL 1 vial 5 vials 25 vials
Diluent 29 ≤-10°C R50HA-4 15 mL 1 bottles R50HA-3 40 mL 2 bottles 10 bottles
Blocker A Kit (Blocker A [dry] in 250 mL bottle and 50 mL bottle of 5X Phosphate Buffer)
RT R93AA-2 250 mL 1 kit 1 kit 5 kits
Read Buffer T (4X) RT R92TC-3 50 mL 1 bottle 1 bottle 5 bottles
1 SULFO-TAG conjugated detection antibodies should be stored in the dark.
Additional Materials and Equipment Appropriately sized tubes for reagent preparation
Microcentrifuge tubes for preparing serial dilutions
Phosphate-buffered saline plus 0.05% Tween-20 (PBS-T) for plate washing or MSD Wash Buffer (Catalog No. R61AA-1)
Liquid handling equipment for desired throughput, capable of dispensing 10 to 150 µL/well into a 96-well microtiter plate
Plate washing equipment: automated plate washer or multichannel pipette
Adhesive plate seals
Microtiter plate shaker (rotary) capable of shaking at 500–1,000 rpm
Deionized water
Vortex mixer

17497-v13-2018Mar | 7
Safety Use safe laboratory practices and wear gloves, safety glasses, and lab coats when handling kit components. Handle and dispose of all hazardous samples properly in accordance with local, state, and federal guidelines.
Additional product-specific safety information is available in the safety data sheet (SDS), which can be obtained from MSD Customer Service or at www.mesoscale.com.
Best Practices • Bring frozen diluent to room temperature in a 22-25°C water bath. Thaw frozen calibrator (when applicable) on wet ice.
• Prepare Calibrator Standards and samples in polypropylene microcentrifuge tubes. Use a fresh pipette tip for each dilution and mix by vortexing after each dilution.
• Avoid prolonged exposure of the detection antibody (stock or diluted) to light. During the antibody incubation step, plates do not need to be shielded from light (except for direct sunlight).
• Avoid bubbles in wells during all pipetting steps as they may lead to variable results. Bubbles introduced when adding Read Buffer may interfere with signal detection.
• Use reverse pipetting when necessary to avoid the introduction of bubbles. For empty wells, pipette gently to the bottom corner.
• Plate shaking should be vigorous, with a rotary motion between 500 and 1,000 rpm. Binding reactions may reach equilibrium sooner if you use shaking at the middle of this range (~700 rpm) or above.
• When using an automated plate washer, rotate the plate 180 degrees between wash steps to improve assay precision.
• Gently tap the plate on a paper towel to remove residual fluid after washing.
• If an incubation step needs to be extended, leave the sample or detection antibody solution in the plate to keep the plate from drying out.
• Remove the plate seal prior to reading the plate.
• Make sure that the read buffer is at room temperature when added to a plate.
• Do not shake the plate after adding the read buffer.
• To improve inter-plate precision, keep time intervals consistent between adding the read buffer and reading the plate. Unless otherwise directed, read the plate as soon as possible after adding the read buffer.
• If the sample results are above the top of the calibration curve, dilute the samples and repeat the assay.
• When running a partial plate, seal the unused sectors to avoid contaminating unused wells. Remove all seals before reading. The uncoated wells of a partially used plate may be sealed and stored up to 30 days at 2–8°C in the original foil pouch with desiccant. You may adjust volumes proportionally when preparing reagents.

17497-v13-2018Mar | 8
Reagent Preparation Bring all reagents to room temperature. Thaw the stock calibrator blend on ice.
Important: Upon first thaw, separate Diluent 29 into aliquots appropriate for the size of your needs before refreezing. The diluent can go through 3 freeze–thaw cycles without significantly affecting the performance of the assay.
Prepare Blocker A Solution
Follow the Blocker A instructions included in the kit.
Prepare Albumin Tracer Solution
MSD provides albumin tracer as a 200X stock solution. The working tracer solution is 1X.
For one plate, combine:
20 µL of 200X SULFO-TAG Albumin Tracer
3,980 µL of Diluent 29
Prepare Calibrator Solutions
MSD supplies blended calibrator for the Kidney Injury Panel 1 (rat) Kit at 20-fold higher concentration than the recommended highest standard. We recommend a 7-point standard curve with 3-fold serial dilution steps and a zero calibrator blank. Signals from the blank should be excluded when generating the curve. Thaw the stock calibrator and keep on ice, then add to diluent at room temperature to make the standard curve solutions. For the actual concentration of each calibrator in the blend, refer to the certificate of analysis (COA) supplied with the kit or available at www.mesoscale.com.
To prepare 7 standard solutions plus a zero calibrator for up to 3 replicates:
1) Prepare the highest standard by adding 10 µL of stock calibrator to 190 µL of Diluent 29. Mix well.
2) Prepare the next standard by transferring 80 µL of the highest standard to 160 µL of Diluent 29. Mix well. Repeat 3-fold serial dilutions 5 additional times to generate 7 standards.
3) Use Diluent 29 as the blank.
Calibrators should be prepared at room temperature no more than 20 minutes before combining with 1X albumin tracer.
Prepare Samples
For rat urine samples, MSD recommends 10-fold dilution in Diluent 29; however, you may need to adjust the dilution factor for the sample set under investigation.

17497-v13-2018Mar | 9
Prepare Premix of Standards and Samples with 1X Albumin Tracer
Combine equal volumes of diluted sample and 1X albumin tracer solution.
For two replicates, combine: 75 µL of diluted sample/standards
75 µL of 1X albumin tracer solution
For three replicates, combine: 100 µL of diluted sample/standards
100 µL of 1X albumin tracer solution
Incubate the prepared standards and samples at room temperature without shaking for at least 30 minutes before adding to the assay plate.
Prepare Detection Antibody Solution
MSD provides each detection antibody as a 50X stock solution. The working detection antibody solution is 1X.
For one plate, combine:
60 µL of 50X SULFO-TAG Anti-rat Lipocalin-2 Antibody
60 µL of 50X SULFO-TAG Anti-rat Osteopontin Antibody
60 µL of 50X SULFO-TAG Anti-rat TIM-1 Antibody
2,820 µL of Diluent 29
You may omit detection antibody for any analyte not being measured; add 60 µL of Diluent 29 for each omitted antibody.
Prepare Wash Buffer
MSD provides Wash Buffer as a 20X stock solution. The working solution is 1X. PBS + 0.05% Tween-20 can be used instead.
For one plate, combine: 15 mL of MSD Wash Buffer (20X)
285 mL of deionized water
1X MSD Wash Buffer can be stored at room temperature for up to two weeks.
Prepare Read Buffer
MSD provides Read Buffer T as a 4X stock solution. The working solution is 1X.
For one plate, combine: 5 mL of Read Buffer T (4X)
15 mL of deionized water
You may prepare diluted read buffer in advance and store it at room temperature in a tightly sealed container.
Prepare MSD Plate
MSD plates are pre-coated with capture antibodies (Figure 1) and exposed to a proprietary stabilizing treatment to ensure the integrity and stability of the immobilized antibodies. Plates can be used as delivered; no additional preparation (e.g., pre-wetting) is required.

17497-v13-2018Mar | 10
Protocol Note: Follow Reagent Preparation before beginning this assay protocol.
STEP 1: Add Blocker A Solution
Add 150 µL of Blocker A solution to each well. Seal the plate with an adhesive plate seal and incubate for 1 hour with vigorous shaking (500–1,000 rpm) at room temperature.
STEP 2: Wash and Add Sample
Wash the plate 3 times with 300 µL/well of 1X MSD Wash Buffer or PBS-T.
Add 50 µL of sample (standards, controls, or unknowns) – premixed with 1X albumin tracer – per well. Seal the plate with an adhesive plate seal and incubate for 2 hours with vigorous shaking (500–1,000 rpm) at room temperature.
You may prepare detection antibody solution during incubation.
STEP 3: Wash and Add Detection Antibody Solution
Wash the plate 3 times with 300 µL/well of 1X MSD Wash Buffer or PBS-T.
Add 25 µL of detection antibody solution to each well. Seal the plate with an adhesive plate seal and incubate for 2 hours with vigorous shaking (500–1,000 rpm) at room temperature.
You may prepare diluted read buffer during incubation.
STEP 4: Wash and Read
Wash the plate 3 times with 300 µL/well of 1X MSD Wash Buffer or PBS-T.
Add 150 µL of 1X Read Buffer T to each well. Analyze the plate on an MSD instrument. Incubation in read buffer is not required before reading the plate.
Validation and Verification MSD’s validation testing is conducted according to fit-for-purpose principles1through a design-control process.
Validation. Bioanalytical and functional characterizations of calibrators, antibodies, and other assay components are completed to ensure quality and consistency of reagents between lots. This includes plate coating uniformity and reagent and component specificity testing for individual kit lots. Multiple control sample replicates in the specified matrices are tested to ensure the assay meets MSD’s accuracy, precision, and sensitivity criteria.
Verification. Multi-day analysis with multiple runs per day using 6–12 plates is performed as part of the release testing for each lot.

17497-v13-2018Mar | 11
Curve Fitting
Calibration curve fitting methods, including weighting functions and 4- or 5-parameter logistic models, are evaluated on multiple runs to select the best curve-fitting algorithm.
Sensitivity and Dynamic Range
• Sensitivity. The lower limit of detection (LLOD) is established based on runs throughout assay development. It is a calculated concentration based on a signal 2.5 standard deviations above the average reading from the blank calibrators. This results in a signal that is significantly higher than the background.
• Dynamic Range. The dynamic (quantitative) range is established based on multiple runs from multiple lots. The limits of the range—lower limit of quantification (LLOQ) and upper limit of quantification (ULOQ)—are the lowest and highest concentrations that can be measured with acceptable levels of precision and accuracy.
The limits of quantification defined in this product insert are verified for each lot as part of the lot verification and quality control release.
Precision and Accuracy
Control samples made in the specified matrix are tested over multiple days to measure intra-run, inter-run, and inter-lot accuracy and precision. Coefficient of variance (CV) information is presented in the product insert. During the validation process, the assay is tested over multiple days with multiple runs per day using a total of 15–20 complete kits. Precision and accuracy are verified for each lot as part of the lot verification and quality control release.
• Precision. The typical specification for precision is a CV of less than 20% for controls on both intra-and inter-day runs.
• Accuracy. The typical specification for accuracy includes a calculated concentration CV of less than 20%, accuracy within 20% of expected concentration, and a total error of less than 30%.
Robustness and Stability
Freeze–thaw testing and accelerated stability studies for calibrators, antibodies, and controls are performed during assay development and are augmented with real-time stability studies on complete kits out to 24 months from the date of manufacture.
Specificity, Spike Recovery, and Dilution Linearity
Assays are tested in the targeted matrix for non-specific bindings. Spike recovery and dilution linearity are tested across the assay range to evaluate sample matrix effects.
Tested Samples
Normal samples for the specified species are tested to determine the normal range of biomarker concentration detected with the assay.
Representative data from this kit’s validation process are presented below. The lot-specific standard curve and measured limits of quantification can be found in the COA enclosed with each kit. You can also find a copy of the lot-specific COA at www.mesoscale.com.
17497-v13-2018Mar | 12
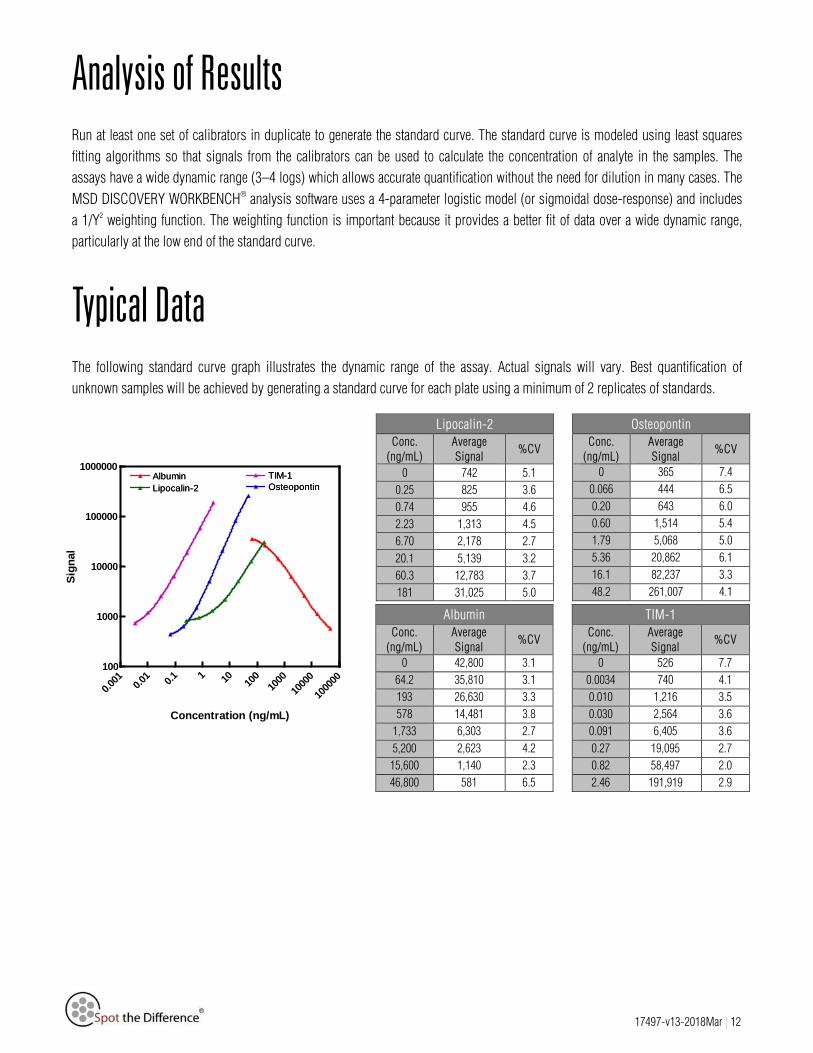
Analysis of Results Run at least one set of calibrators in duplicate to generate the standard curve. The standard curve is modeled using least squares fitting algorithms so that signals from the calibrators can be used to calculate the concentration of analyte in the samples. The assays have a wide dynamic range (3–4 logs) which allows accurate quantification without the need for dilution in many cases. The MSD DISCOVERY WORKBENCH® analysis software uses a 4-parameter logistic model (or sigmoidal dose-response) and includes a 1/Y2 weighting function. The weighting function is important because it provides a better fit of data over a wide dynamic range, particularly at the low end of the standard curve.
Typical Data The following standard curve graph illustrates the dynamic range of the assay. Actual signals will vary. Best quantification of unknown samples will be achieved by generating a standard curve for each plate using a minimum of 2 replicates of standards.
Lipocalin-2 Osteopontin Conc.
(ng/mL) Average Signal
%CV Conc. (ng/mL)
Average Signal
%CV
0 742 5.1 0 365 7.4 0.25 825 3.6 0.066 444 6.5 0.74 955 4.6 0.20 643 6.0 2.23 1,313 4.5 0.60 1,514 5.4 6.70 2,178 2.7 1.79 5,068 5.0 20.1 5,139 3.2 5.36 20,862 6.1 60.3 12,783 3.7 16.1 82,237 3.3 181 31,025 5.0 48.2 261,007 4.1
Albumin TIM-1 Conc.
(ng/mL) Average Signal
%CV Conc. (ng/mL)
Average Signal
%CV
0 42,800 3.1 0 526 7.7 64.2 35,810 3.1 0.0034 740 4.1 193 26,630 3.3 0.010 1,216 3.5 578 14,481 3.8 0.030 2,564 3.6
1,733 6,303 2.7 0.091 6,405 3.6 5,200 2,623 4.2 0.27 19,095 2.7
15,600 1,140 2.3 0.82 58,497 2.0 46,800 581 6.5 2.46 191,919 2.9
0.001 0.0
1 0.1 1 10 100
1000
1000
0
1000
00100
1000
10000
100000
1000000
OsteopontinLipocalin-2TIM-1AlbuminOsteopontin
AlbuminLipocalin-2
TIM-1
Concentration (ng/mL)
Sign
al
17497-v13-2018Mar | 13
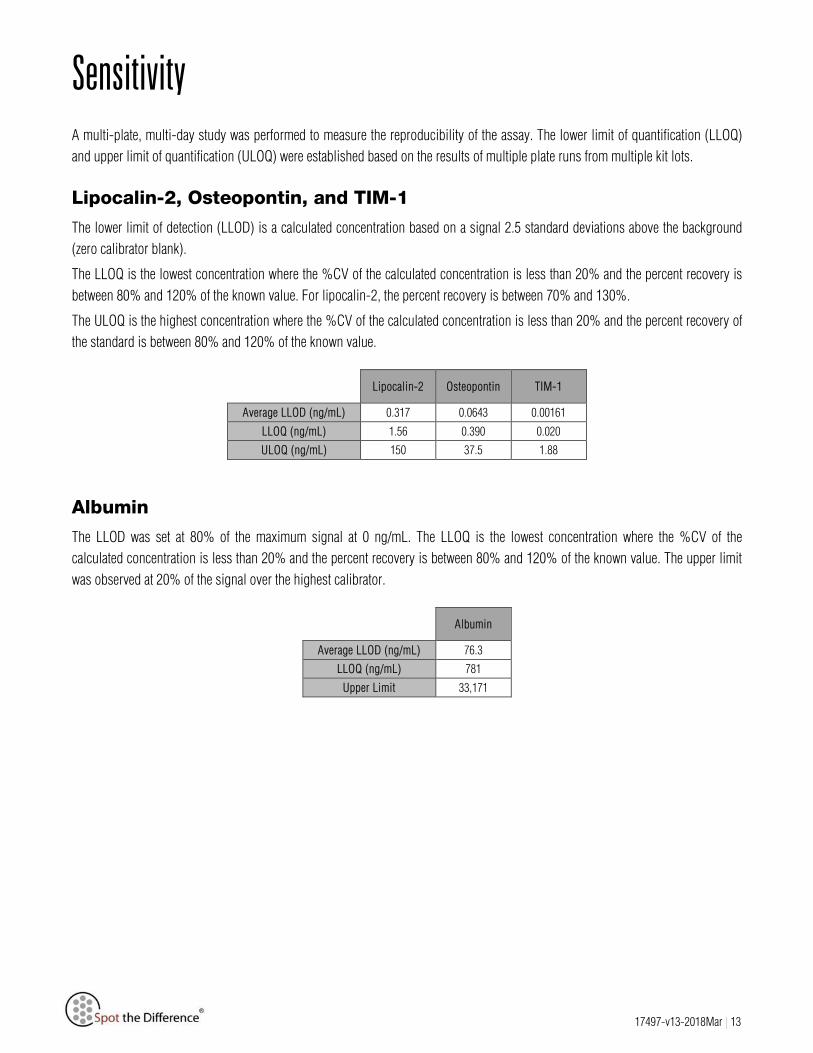
Sensitivity A multi-plate, multi-day study was performed to measure the reproducibility of the assay. The lower limit of quantification (LLOQ) and upper limit of quantification (ULOQ) were established based on the results of multiple plate runs from multiple kit lots.
Lipocalin-2, Osteopontin, and TIM-1
The lower limit of detection (LLOD) is a calculated concentration based on a signal 2.5 standard deviations above the background (zero calibrator blank).
The LLOQ is the lowest concentration where the %CV of the calculated concentration is less than 20% and the percent recovery is between 80% and 120% of the known value. For lipocalin-2, the percent recovery is between 70% and 130%.
The ULOQ is the highest concentration where the %CV of the calculated concentration is less than 20% and the percent recovery of the standard is between 80% and 120% of the known value.
Lipocalin-2 Osteopontin TIM-1
Average LLOD (ng/mL) 0.317 0.0643 0.00161
LLOQ (ng/mL) 1.56 0.390 0.020
ULOQ (ng/mL) 150 37.5 1.88
Albumin
The LLOD was set at 80% of the maximum signal at 0 ng/mL. The LLOQ is the lowest concentration where the %CV of the calculated concentration is less than 20% and the percent recovery is between 80% and 120% of the known value. The upper limit was observed at 20% of the signal over the highest calibrator.
Albumin
Average LLOD (ng/mL) 76.3
LLOQ (ng/mL) 781
Upper Limit 33,171

17497-v13-2018Mar | 14
Precision Controls were made by spiking calibrator into rat urine at levels throughout the range of the assay. Analyte levels were measured using a minimum of 3 replicates on 13 runs over 4 days.
Average intra-run %CV is the average %CV of the control replicates within an individual run.
Inter-run %CV is the variability of controls across 13 runs.
Inter-lot %CV is the variability of controls across 5 kit lots.
Control Runs Average
Conc. (ng/mL) Average
Intra-run %CV Inter-run
%CV Inter-lot
%CV
Lipocalin-2 Mid 13 91.5 6.4 9.0 10.0 Low 13 42.3 5.6 8.2 9.5
Osteopontin High 13 15.6 5.0 6.4 8.5 Mid 13 6.06 4.5 6.4 9.8
Albumin High 13 12,040 3.5 5.8 3.2 Mid 13 4,137 3.4 4.5 6.1 Low 13 1,765 3.1 7.2 6.2
TIM-1 High 13 0.960 3.5 4.4 8.7 Mid 13 0.329 3.8 5.7 7.3 Low 13 0.133 4.2 9.9 6.0

17497-v13-2018Mar | 15
Dilution Linearity To assess linearity, urine samples were diluted 5-fold, 10-fold, 20-fold, and 40-fold before testing. Percent recovery at each dilution was calculated by dividing the calculated concentration by the expected concentration, i.e., the concentration of the previous dilution. % Recovery=measured/expected∗100
Lipocalin-2 Osteopontin Sample
Type Fold
Dilution Conc.
(ng/mL) Conc. % CV
% Recovery
Conc. (ng/mL)
Conc. % CV
% Recovery
Urine 1
5 427 5.8 4.66 7.8 10 663 12.5 155 10.3 6.5 222 20 797 9.5 120 19.3 6.5 187 40 895 10.4 112 34.7 5.1 179
Urine 2
5 46.3 26.2 <LLOQ - - 10 61.4 6.7 133 <LLOQ - - 20 65.0 3.6 106 <LLOQ - - 40 64.1 12.0 99 <LLOQ - -
Urine 3
5 51.1 4.0 2.72 1.8 10 74.9 3.7 147 4.48 3.3 164 20 82.6 7.4 110 <LLOQ - - 40 81.7 3.4 99 <LLOQ - -
Albumin TIM-1 Sample
Type Fold
Dilution Conc.
(ng/mL) Conc. % CV
% Recovery
Conc. (ng/mL)
Conc. % CV
% Recovery
Urine 1
5 42,503 4.0 21.2 5.2 10 44,591 2.7 105 25.1 2.5 118 20 45,853 7.0 103 24.9 3.8 100 40 45,996 4.3 100 24.9 5.7 100
Urine 2
5 7,390 4.9 0.623 6.8 10 7,878 4.3 107 0.643 3.6 103 20 <LLOQ - - 0.632 8.6 98 40 <LLOQ - - <LLOQ - -
Urine 3
5 11,312 1.9 1.30 2.7 10 11,575 1.9 102 1.37 1.6 105 20 <LLOQ - - 1.43 1.2 104 40 <LLOQ - - 1.36 2.1 96

17497-v13-2018Mar | 16
Spike Recovery Normal Sprague-Dawley rat urine samples were diluted 10-fold and spiked with calibrators at multiple levels throughout the range of the assay. We observed that recombinant rat osteopontin is under-recovered when spiked into urine samples, as shown below. Osteopontin has been found to bind to calcium oxalate crystals in the urine, causing inaccurate measurements by ELISA.4
% Recovery=measured/expected∗100
Lipocalin-2 Osteopontin Sample
Type Spike Conc.
(ng/mL) Measured
Conc. (ng/mL) Measured Conc.
%CV %
Recovery Spike Conc.
(ng/mL) Measured
Conc. (ng/mL) Measured
Conc. %CV %
Recovery
Urine 1
0 77.5 9.3 0 2.70 3.8 4.44 89.0 0.9 109 1.11 2.71 2.5 71 13.3 110 2.9 121 3.33 3.14 2.2 52 40.0 135 3.2 115 10.0 3.87 2.3 31
Urine 2
0 4.88 9.5 0 0.194 10.8 4.44 8.99 5.6 96 1.11 0.787 0.8 60 13.3 17.5 4.9 96 3.33 2.00 5.2 57 40.0 41.0 3.0 91 10.0 4.25 4.1 42
Urine 3
0 6.33 3.6 0 0.419 2.0 4.44 11.3 3.9 105 1.11 0.878 3.0 57 13.3 19.6 7.0 100 3.33 1.89 2.6 50 40.0 42.0 7.9 91 10.0 4.31 1.4 41
Albumin TIM-1
Sample Type
Spike Conc. (ng/mL)
Measured Conc. (ng/mL)
Measured Conc. %CV
% Recovery
Spike Conc. (ng/mL)
Measured Conc. (ng/mL)
Measured Conc. %CV
% Recovery
Urine 1
0 5,976 3.2 0 1.79 1.4 1,111 7,538 4.1 106 0.0556 1.67 2.9 90 3,333 9,577 2.9 103 0.167 1.82 1.7 93 10,000 16,427 5.5 103 0.500 2.22 1.0 97
Urine 2
0 652 3.4 0 0.0545 1.9 1,111 1,723 7.7 98 0.0556 0.109 4.2 99 3,333 4,168 5.1 105 0.167 0.245 1.5 111 10,000 10,729 0.3 101 0.500 0.625 1.3 113
Urine 3
0 1,059 2.2 0 0.126 2.6 1,111 2,185 1.8 101 0.0556 0.175 4.2 96 3,333 4,136 3.8 94 0.167 0.292 3.0 100 10,000 10,125 2.2 92 0.500 0.646 2.0 103
Specificity To assess specificity of the individual assays, the Kidney Injury Panel 1 (rat) was run using blended calibrators and single detection antibodies. Dilute the stock calibrator blend 60-fold in diluent 29 prior to use. No significant cross-reactivity (<0.2%) was observed, except with binding of the Lipocalin-2 detection antibody to the OPN calibrator (<5%). The extent of binding of the Lipocalin-2 detection antibody to the OPN calibrator varies due to inconsistent behavior of diluent raw materials.

17497-v13-2018Mar | 17
Tested Samples Rat urine samples were diluted 10-fold, and tested with the Kidney Injury Panel 1 (rat). The Mild Tox and High Tox samples were from rats exposed to known nephrotoxicants prior to sample collection. High Tox-designated samples that assayed above the ULOQ were assayed again at a 40-fold dilution to bring them into the quantitative range. For all of the analytes on the panel, significant correspondence between histopathology score and abundance is observed. Concentrations in gray are below the LLOQ.
Animal # Designation Histopathology
Score Lipocalin-2
(ng/mL) Osteopontin
(ng/mL) Albumin (ng/mL)
TIM-1 (ng/mL)
1 Control 0 79.4 2.0 6,380 0.26 2 Control 0 81.8 10.6 4,676 0.22 3 Control 0 54.0 6.8 5,639 0.15 4 Control 0 50.9 5.7 2,172 0.09 5 Control 0 80.2 9.5 7,981 0.21 6 Control 0 32.8 10.4 13,063 0.27 7 Control 0 68.2 9.3 4,099 0.15 8 Control 0 43.6 8.7 25,787 0.24 9 Control 0 68.6 17.7 6,010 0.25
10 Control 0 48.1 14.7 10,219 0.16 11 Mild Tox 1 68.9 8.5 24,359 0.14 12 Mild Tox 1 216 20.1 582,857 1.66 13 Mild Tox 1 185 18.7 347,477 2.43 14 Mild Tox 2 185 25.8 63,056 1.99 15 Mild Tox 2 110 18.1 190,213 0.84 16 Mild Tox 3 184 28.1 593,019 1.34 17 Mild Tox 2 264 47.6 409,532 1.56 18 Mild Tox 2 242 59.7 1,375,229 1.92 19 Mild Tox 2 325 53.4 438,888 2.00
Animal # Designation Histopathology Score
Lipocalin-2 (ng/mL)
Osteopontin (ng/mL)
Albumin (ng/mL)
TIM-1 (ng/mL)
20 High Tox 3 334 32.5 1,398,916 1.91 21 High Tox 3 345 41.4 814,377 0.64 22 High Tox 3 308 39.5 1,822,741 1.29 23 High Tox 3 134 17.0 141,078 0.37 24 High Tox 3 144 24.0 122,467 0.39 25 High Tox 4 297 24.7 352,434 0.45 26 High Tox 3 689 40.8 20,037 3.38 27 High Tox 3 309 75.7 13,009 1.18 28 High Tox 3 493 27.8 25,402 5.11 29 High Tox 3 800 67.7 71,925 5.76 30 High Tox 3 665 96.0 42,825 4.00 31 Control 0 261 2.7 10,563 0.26 32 Control 0 51.8 12.8 4,724 0.25 33 Control 0 109 7.1 26,265 0.18 34 Control 0 73.2 17.4 5,412 0.27 35 Control 0 96.5 8.3 3,501 0.19 36 Control 0 1.3 7.9 5,178 0.25 37 Control 0 56.7 12.5 5,138 0.34 38 Control 0 70.1 19.0 10,322 0.41 39 Control 0 41.9 15.9 12,564 0.26

17497-v13-2018Mar | 18
Assay Components Calibrators
The assay calibrator blend uses the following recombinant rat proteins:
Lipocalin-2 (residues 21–198), expressed in murine myeloma cells
Osteopontin (full-length), expressed in Chinese Hamster Ovary-derived cells
TIM-1 (residues 18–238), expressed in murine myeloma cells
Albumin, isolated from serum of Sprague-Dawley rats and treated to be essentially globulin-free
Antibodies
Source Species Analyte MSD Capture Antibody MSD Detection Antibody
Lipocalin-2 Goat Polyclonal Goat Polyclonal Osteopontin Goat Polyclonal Rabbit Polyclonal
Albumin Rabbit Polyclonal n/a TIM-1 Goat Polyclonal Goat Polyclonal
References 1. Lee JW, et al. Fit-for-purpose method development and validation for successful biomarker measurement. Pharm Res. 2006 Feb;23(2):312-28.
2. Mishra J, et al. Identification of Neutrophil Gelatinase-Associated Lipocalin as a Novel Early Urinary Biomarker for Ischemic Renal Injury. J Am Soc Nephrol. 2003;14:2534–2543.
3. Dieterle F, et al. Monitoring kidney safety in drug development: emerging technologies and their implications. Curr. Opin. Drug Discov. Devel. 2008;11(1):60-71.
4. Thurgood LA, Grover PK, Ryall RL. High calcium concentration and calcium oxalate crystals cause significant inaccuracies in the measurement of urinary osteopontin by enzyme linked immunosorbent assay. Urol Res. 2008;36:103-110.

17497-v13-2018Mar | 19
Summary Protocol Kidney Injury Panel 1 (rat) Kit
MSD provides this summary protocol for your convenience. Please read the entire detailed protocol prior to performing the Kidney Injury Panel 1 (rat) assays.
Sample and Reagent Preparation Bring all reagents to room temperature and thaw the calibrator on ice.
Prepare Blocker A solution.
Prepare 7 standard solutions using the supplied calibrator:
o Dilute the stock calibrator blend 20-fold in Diluent 29. Perform a series of 3-fold dilution steps and prepare a zero calibrator blank.
Dilute samples 10-fold (or as needed) in Diluent 29.
Mix each standard, control, or diluted sample with an equal volume of 1X albumin tracer. Incubate for 30 minutes at room temperature.
Prepare combined detection antibody solution by diluting each stock detection antibody 50-fold in Diluent 29.
Prepare 1X Read Buffer T by diluting stock 4X Read Buffer T 4-fold with deionized water.
STEP 1: Add Blocker A Solution
Add 150 µL/well of Blocker A solution.
Incubate at room temperature with vigorous shaking (500–1,000 rpm) for 1 hour.
STEP 2: Wash and Add Sample
Wash plate 3 times with 300 µL/well of PBS-T.
Add 50 µL/well of sample (standards, controls, or unknowns) premixed with 1X albumin tracer.
Incubate at room temperature with vigorous shaking (500–1,000 rpm) for 2 hours.
STEP 3: Wash and Add Detection Antibody Solution Wash plate 3 times with 300 µL/well of 1X MSD Wash Buffer or PBS-T.
Add 25 µL/well of 1X detection antibody solution.
Incubate at room temperature with vigorous shaking (500–1,000 rpm) for 2 hours.
STEP 4: Wash and Read Plate
Wash plate 3 times with 300 µL/well of 1X MSD Wash Buffer or PBS-T.
Add 150 µL/well of 1X Read Buffer T.
Analyze plate on an MSD instrument.
17497-v13-2018Mar | 20
Plate Diagrams