Kick-Starting Your Modern Maintenance Program for Manufacturing eBook.pdf · In Figure 1. is an...
18
Kick-Starting Your Modern Maintenance Program for Manufacturing
Transcript of Kick-Starting Your Modern Maintenance Program for Manufacturing eBook.pdf · In Figure 1. is an...

Kick-Starting Your Modern Maintenance Program for Manufacturing
2
C H A P T E R 1 I N T R O D U C T I O N T O M O D E R N M A I N T E N A N C E
C H A P T E R 2 A D V A N C E D M A I N T E N A N C E & T E C H N O L O G Y
C H A P T E R 3 T H R E E K E Y M E T R I C S F O R M A X I M I Z I N G O E E
Ǡ Section 1: Backlog Ǡ Section 2: Inventory & Stock Outs Ǡ Section 3: The 80/20 Rule
C H A P T E R 4 A P P E M : A P L A N F O R S U C C E S S Ǡ Section 1: Overview Ǡ Section 2: APPEM
Ǡ Assess Ǡ Prioritize Ǡ Plan Ǡ Execute Ǡ Maintain
C H A P T E R 5 C O N C L U S I O N : K E E P I N G Y O U R E Y E O N T H E P R I Z E
TABLE OF CONTENTS
3
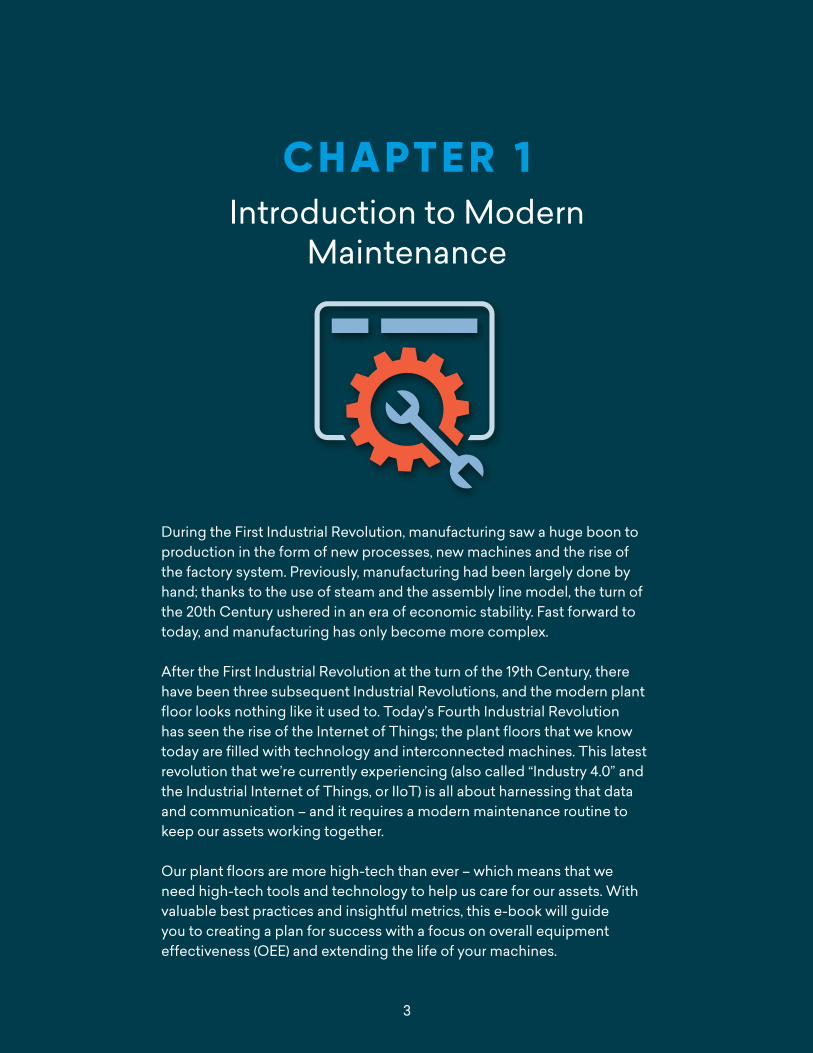
CHAPTER 1Introduction to Modern
Maintenance
During the First Industrial Revolution, manufacturing saw a huge boon to production in the form of new processes, new machines and the rise of the factory system. Previously, manufacturing had been largely done by hand; thanks to the use of steam and the assembly line model, the turn of the 20th Century ushered in an era of economic stability. Fast forward to today, and manufacturing has only become more complex.
After the First Industrial Revolution at the turn of the 19th Century, there have been three subsequent Industrial Revolutions, and the modern plant floor looks nothing like it used to. Today’s Fourth Industrial Revolution has seen the rise of the Internet of Things; the plant floors that we know today are filled with technology and interconnected machines. This latest revolution that we’re currently experiencing (also called “Industry 4.0” and the Industrial Internet of Things, or IIoT) is all about harnessing that data and communication – and it requires a modern maintenance routine to keep our assets working together.
Our plant floors are more high-tech than ever – which means that we need high-tech tools and technology to help us care for our assets. With valuable best practices and insightful metrics, this e-book will guide you to creating a plan for success with a focus on overall equipment effectiveness (OEE) and extending the life of your machines.
4
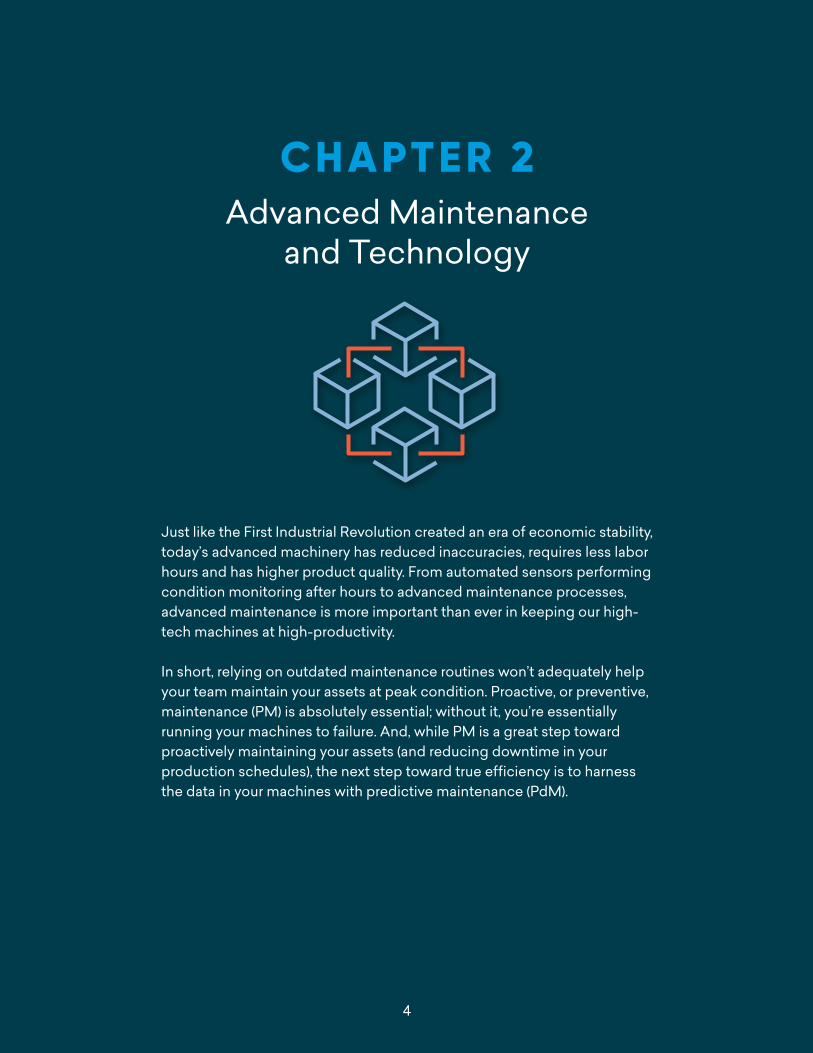
CHAPTER 2Advanced Maintenance
and Technology
Just like the First Industrial Revolution created an era of economic stability, today’s advanced machinery has reduced inaccuracies, requires less labor hours and has higher product quality. From automated sensors performing condition monitoring after hours to advanced maintenance processes, advanced maintenance is more important than ever in keeping our high-tech machines at high-productivity.
In short, relying on outdated maintenance routines won’t adequately help your team maintain your assets at peak condition. Proactive, or preventive, maintenance (PM) is absolutely essential; without it, you’re essentially running your machines to failure. And, while PM is a great step toward proactively maintaining your assets (and reducing downtime in your production schedules), the next step toward true efficiency is to harness the data in your machines with predictive maintenance (PdM).
5
Figure 1
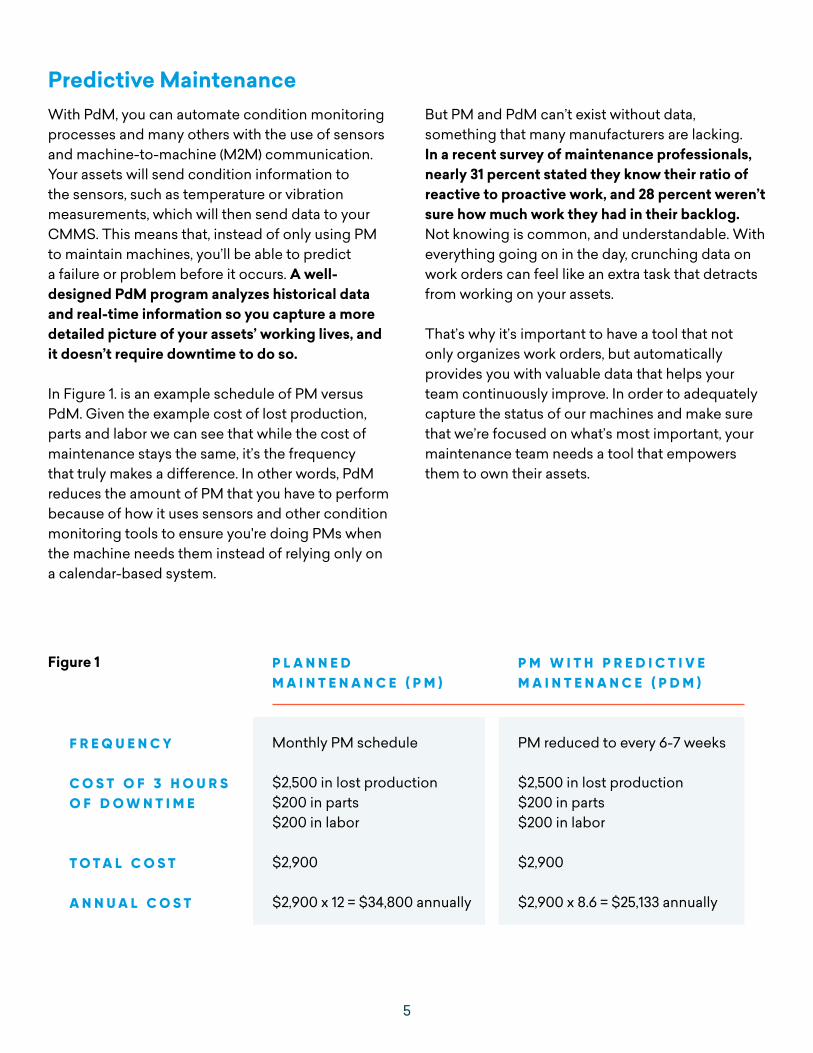
Predictive MaintenanceWith PdM, you can automate condition monitoring processes and many others with the use of sensors and machine-to-machine (M2M) communication. Your assets will send condition information to the sensors, such as temperature or vibration measurements, which will then send data to your CMMS. This means that, instead of only using PM to maintain machines, you’ll be able to predict a failure or problem before it occurs. A well-designed PdM program analyzes historical data and real-time information so you capture a more detailed picture of your assets’ working lives, and it doesn’t require downtime to do so.
In Figure 1. is an example schedule of PM versus PdM. Given the example cost of lost production, parts and labor we can see that while the cost of maintenance stays the same, it’s the frequency that truly makes a difference. In other words, PdM reduces the amount of PM that you have to perform because of how it uses sensors and other condition monitoring tools to ensure you're doing PMs when the machine needs them instead of relying only on a calendar-based system.
But PM and PdM can’t exist without data, something that many manufacturers are lacking. In a recent survey of maintenance professionals, nearly 31 percent stated they know their ratio of reactive to proactive work, and 28 percent weren’t sure how much work they had in their backlog. Not knowing is common, and understandable. With everything going on in the day, crunching data on work orders can feel like an extra task that detracts from working on your assets.
That’s why it’s important to have a tool that not only organizes work orders, but automatically provides you with valuable data that helps your team continuously improve. In order to adequately capture the status of our machines and make sure that we’re focused on what’s most important, your maintenance team needs a tool that empowers them to own their assets.
F R E Q U E N C Y
C O S T O F 3 H O U R S O F D O W N T I M E
T O T A L C O S T
A N N U A L C O S T
Monthly PM schedule
$2,500 in lost production$200 in parts$200 in labor
$2,900
$2,900 x 12 = $34,800 annually
PM reduced to every 6-7 weeks
$2,500 in lost production$200 in parts$200 in labor
$2,900
$2,900 x 8.6 = $25,133 annually
P L A N N E D M A I N T E N A N C E ( P M )
P M W I T H P R E D I C T I V E M A I N T E N A N C E ( P D M )
6
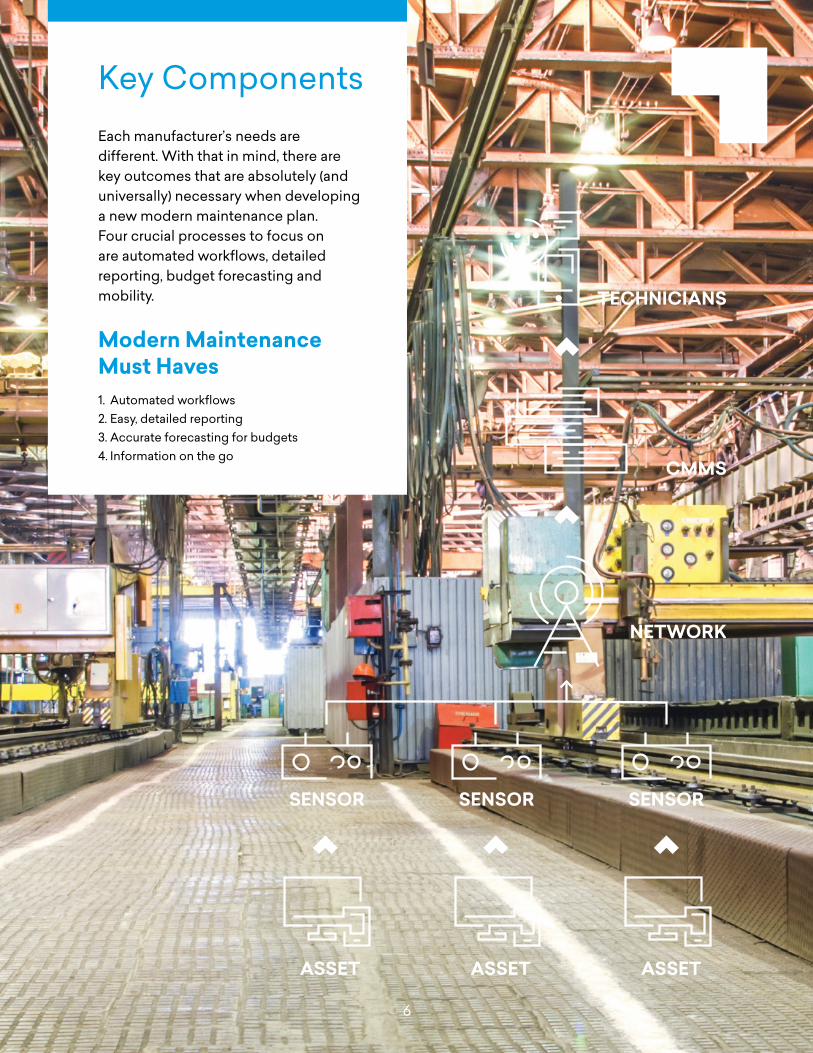
Key ComponentsEach manufacturer’s needs are different. With that in mind, there are key outcomes that are absolutely (and universally) necessary when developing a new modern maintenance plan. Four crucial processes to focus on are automated workflows, detailed reporting, budget forecasting and mobility.
Modern Maintenance Must Haves1. Automated workflows2. Easy, detailed reporting3. Accurate forecasting for budgets4. Information on the go
NETWORK
CMMS
TECHNICIANS
ASSET ASSET ASSET
SENSOR SENSOR SENSOR
7
Automated WorkflowsWorking hand in hand with work order management, automated workflows take out the need for the tedious process of work assignments. When a new work order is created, you can create settings in your work order system that will automatically route the tasks to the appropriate technician. These tasks can trigger e-mail notifications, and if you use sensors for PdM, these notifications can be sent after hours as soon as a problem is detected. This means that you don’t have to wait until the next day to discover that an error occurred; a technician can receive the message and address it immediately, preventing a delay in production.
Easy, Detailed ReportingWith all of the data in your machines, you want to make sure that your solution can take that information and give you insights. For example, a central dashboard can be used to see how many work orders exist, your current inventory and more. You can also create reports to give to key stakeholders, which will help them understand the value of maintenance and prove the worth of your efforts.
Accurate Forecasting for BudgetsBy predicting when a piece of equipment will fail or reach the end of its useful life, you can then accurately project those expenses into your budget. If, for example, you see that an asset needs to be repaired soon based on your PdM forecast, you can also look back into your historical data for the asset’s work orders. If you determine that it costs more to repair than to replace it, you can then justify this in a report that uses both your condition monitoring data and maintenance history.
Information on the GoExpecting your technicians to return to a desktop to update their information, or to keep up with their latest tasks via e-mail, isn’t realistic or efficient. A computerized maintenance management system (CMMS) is a great way to introduce mobile practices to your team. Many CMMS providers have optimized their layouts to work on any device, and some vendors also have mobile apps that offer almost all of the same features as the desktop version and even use the mobile device’s features to improve workflow.
For example, technicians can attach and annotate photos and other documentation to open work orders, use QR codes and more all while they’re on the plant floor. The app allows your technicians to receive real-time information from wherever they are without having to return to a central desktop.
Getting StartedMany maintenance teams are already started on their PM and PdM journey. But what if you’re still relying on outdated work order methods, or you’ve tried incorporating PM or PdM into your maintenance routine with little success? How can you be sure that you’re staying focused on the areas that will matter the most for your assets? In 2017, we conducted a survey of maintenance professionals with Plant Services, and based on responses we’ve identified three key metrics for maximizing OEE. Whether you’re starting to shop for a solution or you’re looking to improve upon your current processes, these data points will make the biggest impact for your team.

8
CHAPTER 33 Key Metrics for Maximizing OEE
1 2 3
9
29.4%
9+WEEKS
28.7%
22.7%
7.4%
11.8%
5-6WEEKS
3-4WEEKS
3-4WEEKS
DON’T KNOW OR UNSURE
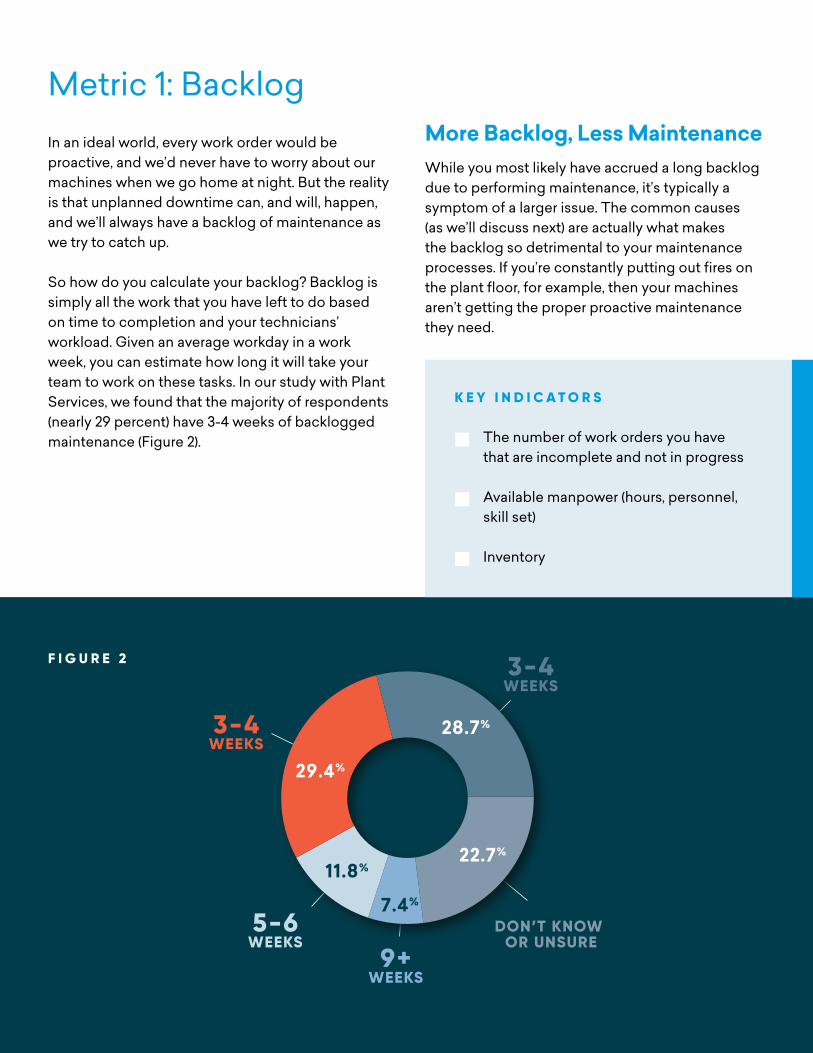
F I G U R E 2
Metric 1: BacklogIn an ideal world, every work order would be proactive, and we’d never have to worry about our machines when we go home at night. But the reality is that unplanned downtime can, and will, happen, and we’ll always have a backlog of maintenance as we try to catch up.
So how do you calculate your backlog? Backlog is simply all the work that you have left to do based on time to completion and your technicians’ workload. Given an average workday in a work week, you can estimate how long it will take your team to work on these tasks. In our study with Plant Services, we found that the majority of respondents (nearly 29 percent) have 3-4 weeks of backlogged maintenance (Figure 2).
More Backlog, Less MaintenanceWhile you most likely have accrued a long backlog due to performing maintenance, it’s typically a symptom of a larger issue. The common causes (as we’ll discuss next) are actually what makes the backlog so detrimental to your maintenance processes. If you’re constantly putting out fires on the plant floor, for example, then your machines aren’t getting the proper proactive maintenance they need.
K E Y I N D I C A T O R S
The number of work orders you have that are incomplete and not in progress
Available manpower (hours, personnel, skill set)
Inventory
10
A long backlog of maintenance means that you’re either understaffed, have too much reactive work to be proactive, or (most likely) a combination of both. It can also indicate:
Ǡ No cultural focus on proactive work over reactive Ǡ A lack of proper skills in your workforce, leading to
imbalanced workloads Ǡ Improper inventory management
While a long backlog is always bad, what about a short backlog? Believe it or not, a short backlog isn’t always a good thing. It could mean that you have too many staff members (and therefore, your staff doesn’t have enough work), or it could mean that a lot of your maintenance work is done without being input into your CMMS. The key is to look into the data in your CMMS and find the culprit, and there may be many factors.
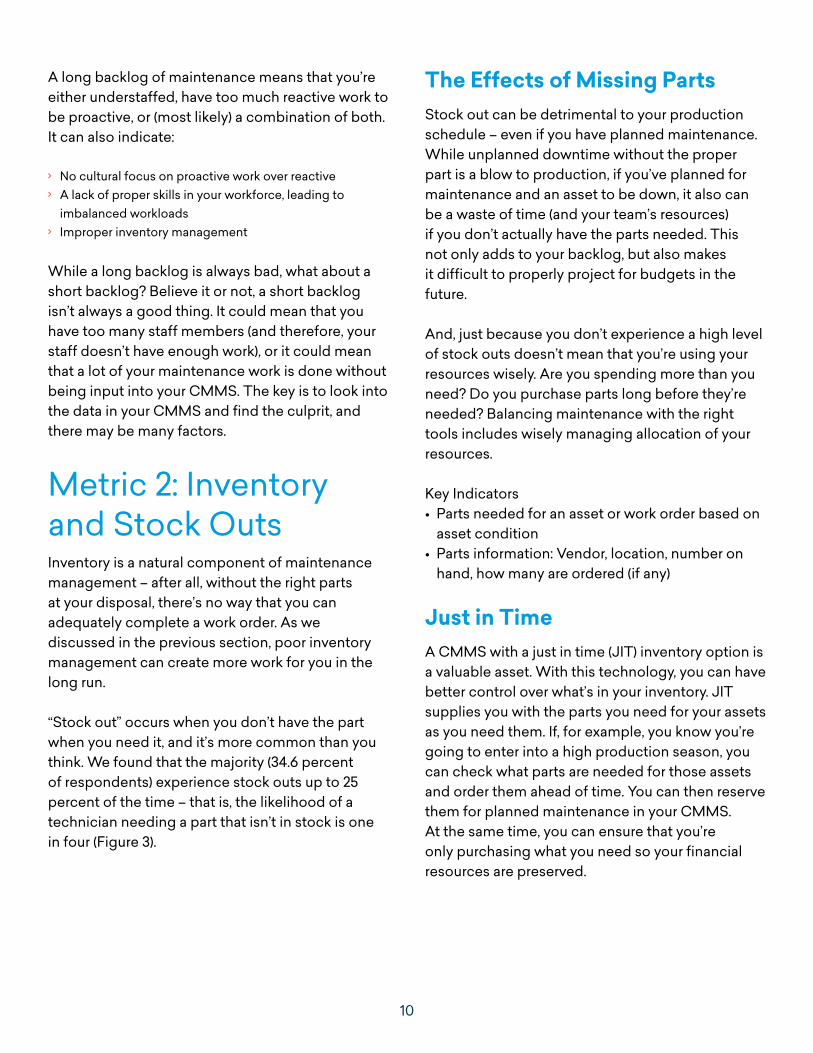
Metric 2: Inventory and Stock OutsInventory is a natural component of maintenance management – after all, without the right parts at your disposal, there’s no way that you can adequately complete a work order. As we discussed in the previous section, poor inventory management can create more work for you in the long run.
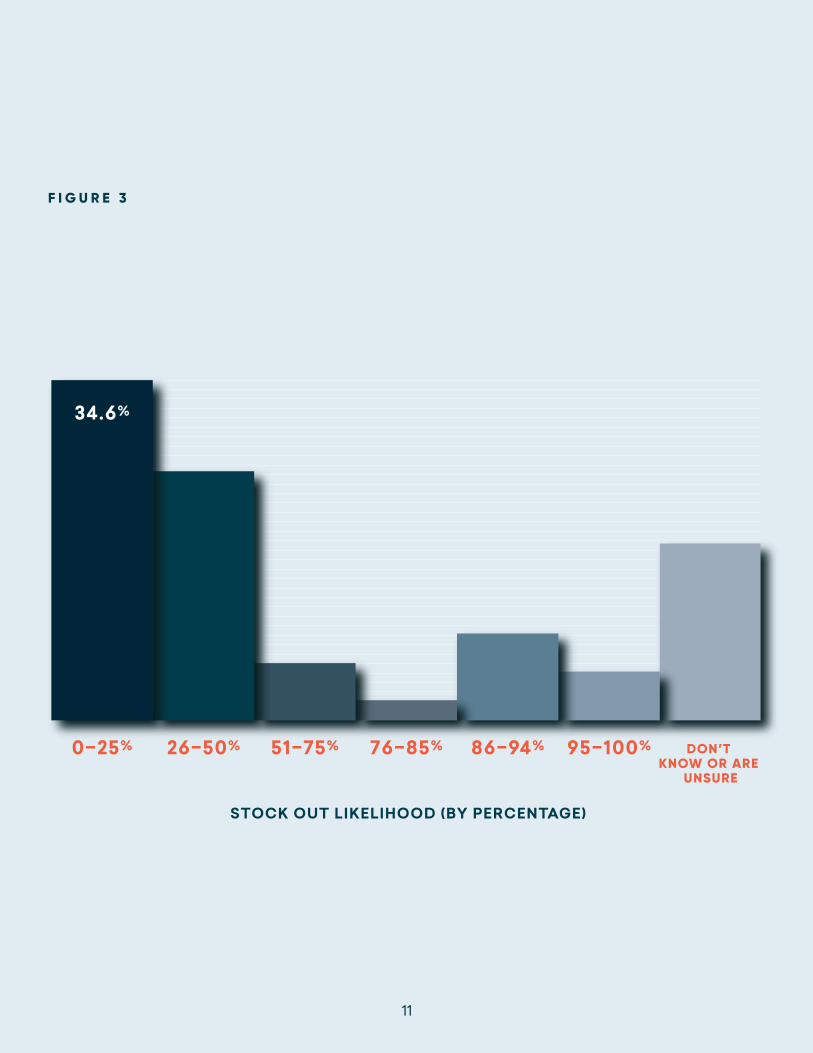
“Stock out” occurs when you don’t have the part when you need it, and it’s more common than you think. We found that the majority (34.6 percent of respondents) experience stock outs up to 25 percent of the time – that is, the likelihood of a technician needing a part that isn’t in stock is one in four (Figure 3).
The Effects of Missing PartsStock out can be detrimental to your production schedule – even if you have planned maintenance. While unplanned downtime without the proper part is a blow to production, if you’ve planned for maintenance and an asset to be down, it also can be a waste of time (and your team’s resources) if you don’t actually have the parts needed. This not only adds to your backlog, but also makes it difficult to properly project for budgets in the future.
And, just because you don’t experience a high level of stock outs doesn’t mean that you’re using your resources wisely. Are you spending more than you need? Do you purchase parts long before they’re needed? Balancing maintenance with the right tools includes wisely managing allocation of your resources.
Key Indicators• Parts needed for an asset or work order based on
asset condition• Parts information: Vendor, location, number on
hand, how many are ordered (if any)
Just in Time A CMMS with a just in time (JIT) inventory option is a valuable asset. With this technology, you can have better control over what’s in your inventory. JIT supplies you with the parts you need for your assets as you need them. If, for example, you know you’re going to enter into a high production season, you can check what parts are needed for those assets and order them ahead of time. You can then reserve them for planned maintenance in your CMMS. At the same time, you can ensure that you’re only purchasing what you need so your financial resources are preserved.
11
F I G U R E 3
DON’T KNOW OR ARE
UNSURE
STOCK OUT LIKELIHOOD (BY PERCENTAGE)
0–25% 26–50% 51–75% 76–85% 86–94% 95–100%
34.6%
12
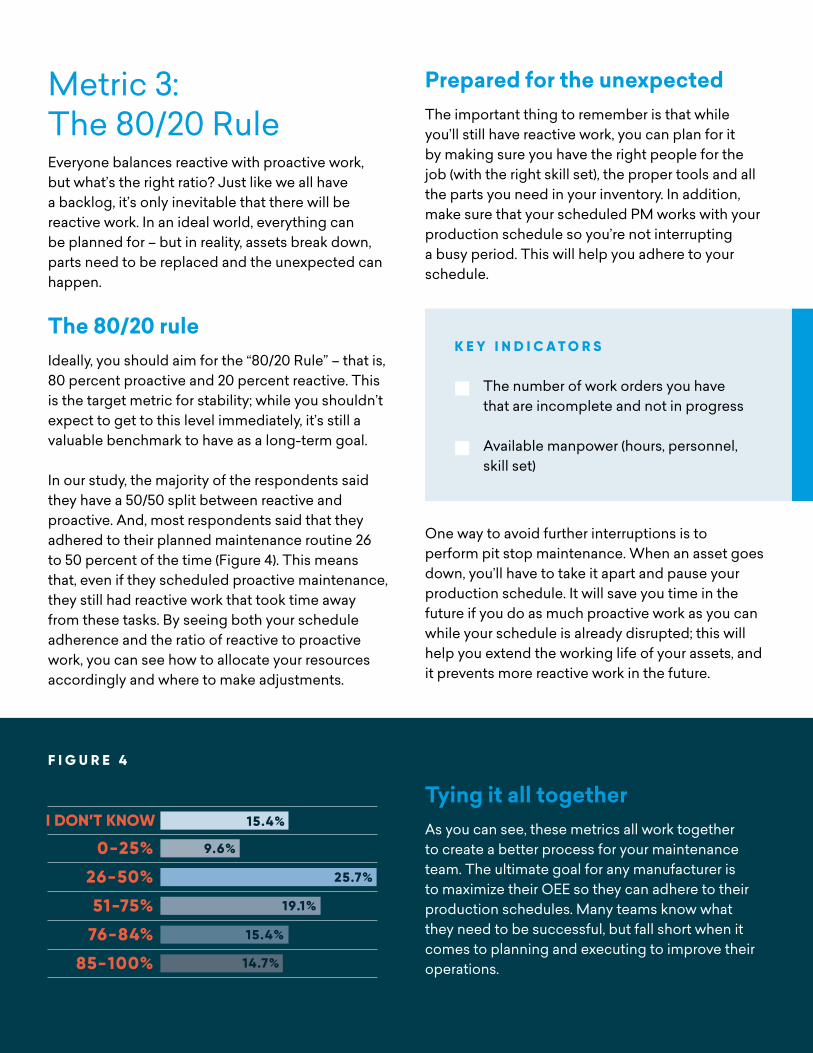
Metric 3: The 80/20 RuleEveryone balances reactive with proactive work, but what’s the right ratio? Just like we all have a backlog, it’s only inevitable that there will be reactive work. In an ideal world, everything can be planned for – but in reality, assets break down, parts need to be replaced and the unexpected can happen.
The 80/20 ruleIdeally, you should aim for the “80/20 Rule” – that is, 80 percent proactive and 20 percent reactive. This is the target metric for stability; while you shouldn’t expect to get to this level immediately, it’s still a valuable benchmark to have as a long-term goal.
In our study, the majority of the respondents said they have a 50/50 split between reactive and proactive. And, most respondents said that they adhered to their planned maintenance routine 26 to 50 percent of the time (Figure 4). This means that, even if they scheduled proactive maintenance, they still had reactive work that took time away from these tasks. By seeing both your schedule adherence and the ratio of reactive to proactive work, you can see how to allocate your resources accordingly and where to make adjustments.
Prepared for the unexpectedThe important thing to remember is that while you’ll still have reactive work, you can plan for it by making sure you have the right people for the job (with the right skill set), the proper tools and all the parts you need in your inventory. In addition, make sure that your scheduled PM works with your production schedule so you’re not interrupting a busy period. This will help you adhere to your schedule.
One way to avoid further interruptions is to perform pit stop maintenance. When an asset goes down, you’ll have to take it apart and pause your production schedule. It will save you time in the future if you do as much proactive work as you can while your schedule is already disrupted; this will help you extend the working life of your assets, and it prevents more reactive work in the future.
K E Y I N D I C A T O R S
The number of work orders you have that are incomplete and not in progress
Available manpower (hours, personnel, skill set)
F I G U R E 4
Tying it all togetherAs you can see, these metrics all work together to create a better process for your maintenance team. The ultimate goal for any manufacturer is to maximize their OEE so they can adhere to their production schedules. Many teams know what they need to be successful, but fall short when it comes to planning and executing to improve their operations.
I DON’T KNOW
0-25%
26-50%
51-75%
76-84%
85-100%
9.6%
25.7%
19.1%
15.4%
14.7%
15.4%
13
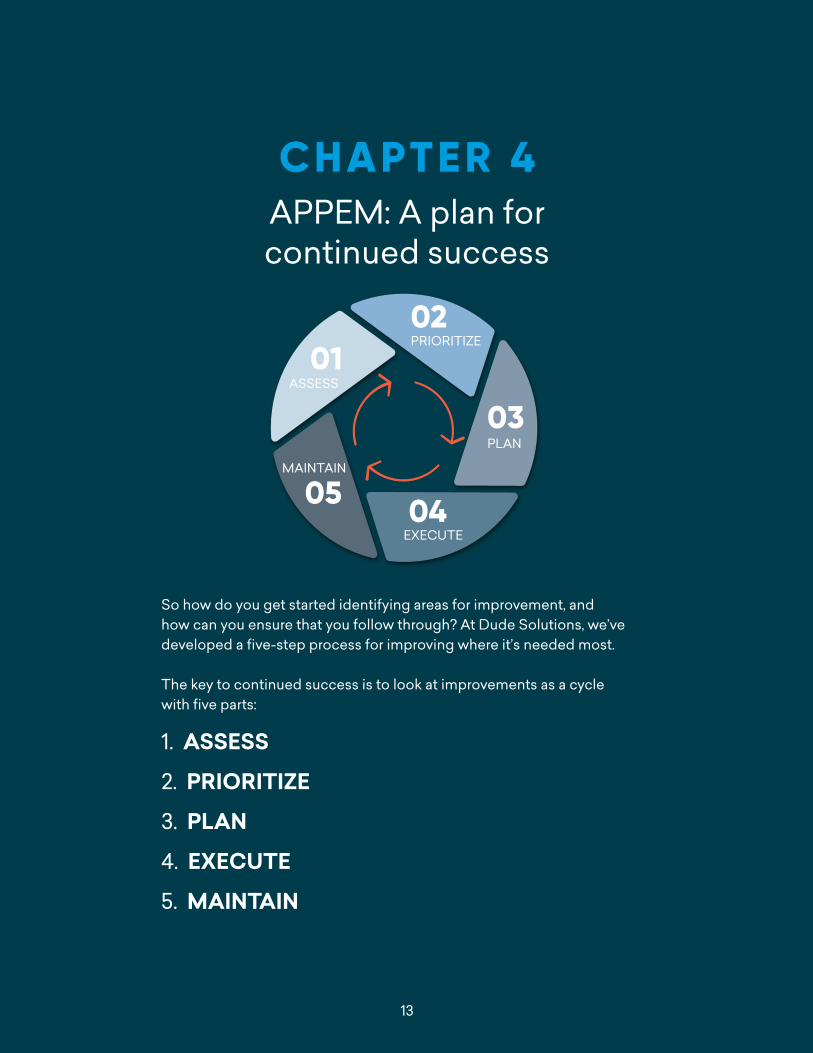
CHAPTER 4APPEM: A plan for continued success
So how do you get started identifying areas for improvement, and how can you ensure that you follow through? At Dude Solutions, we’ve developed a five-step process for improving where it’s needed most.
The key to continued success is to look at improvements as a cycle with five parts:
1. ASSESS
2. PRIORITIZE
3. PLAN
4. EXECUTE
5. MAINTAIN
ASSESS01
02PRIORITIZE
03PLAN
EXECUTE0405
MAINTAIN
14
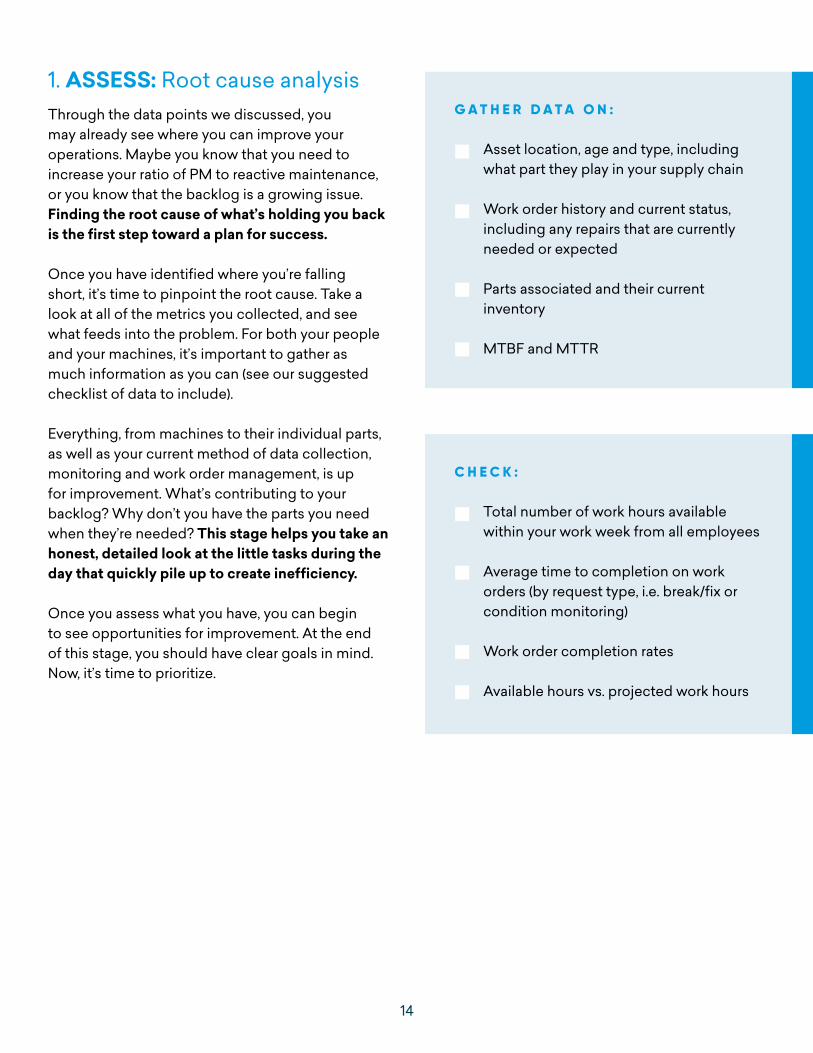
1. ASSESS: Root cause analysisThrough the data points we discussed, you may already see where you can improve your operations. Maybe you know that you need to increase your ratio of PM to reactive maintenance, or you know that the backlog is a growing issue. Finding the root cause of what’s holding you back is the first step toward a plan for success.
Once you have identified where you’re falling short, it’s time to pinpoint the root cause. Take a look at all of the metrics you collected, and see what feeds into the problem. For both your people and your machines, it’s important to gather as much information as you can (see our suggested checklist of data to include).
Everything, from machines to their individual parts, as well as your current method of data collection, monitoring and work order management, is up for improvement. What’s contributing to your backlog? Why don’t you have the parts you need when they’re needed? This stage helps you take an honest, detailed look at the little tasks during the day that quickly pile up to create inefficiency.
Once you assess what you have, you can begin to see opportunities for improvement. At the end of this stage, you should have clear goals in mind. Now, it’s time to prioritize.
G A T H E R D A T A O N :
Asset location, age and type, including what part they play in your supply chain
Work order history and current status, including any repairs that are currently needed or expected
Parts associated and their current inventory
MTBF and MTTR
C H E C K :
Total number of work hours available within your work week from all employees
Average time to completion on work orders (by request type, i.e. break/fix or condition monitoring)
Work order completion rates
Available hours vs. projected work hours
15
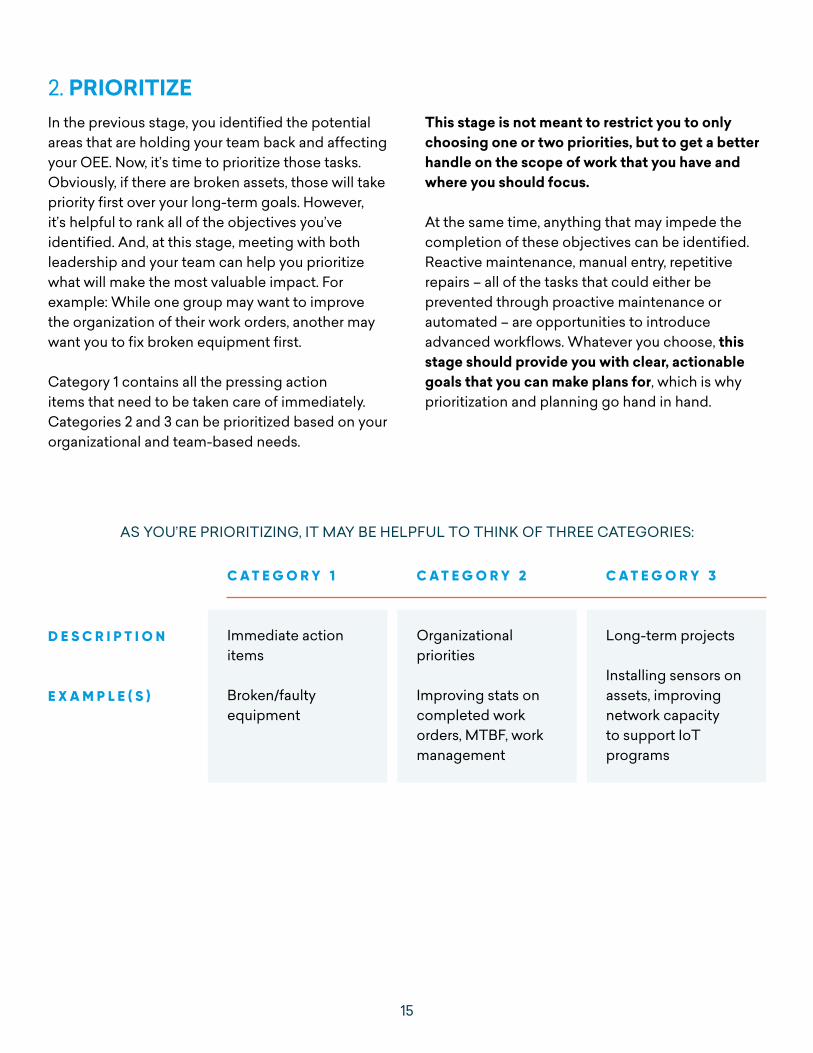
2. PRIORITIZE In the previous stage, you identified the potential areas that are holding your team back and affecting your OEE. Now, it’s time to prioritize those tasks. Obviously, if there are broken assets, those will take priority first over your long-term goals. However, it’s helpful to rank all of the objectives you’ve identified. And, at this stage, meeting with both leadership and your team can help you prioritize what will make the most valuable impact. For example: While one group may want to improve the organization of their work orders, another may want you to fix broken equipment first.
Category 1 contains all the pressing action items that need to be taken care of immediately. Categories 2 and 3 can be prioritized based on your organizational and team-based needs.
This stage is not meant to restrict you to only choosing one or two priorities, but to get a better handle on the scope of work that you have and where you should focus.
At the same time, anything that may impede the completion of these objectives can be identified. Reactive maintenance, manual entry, repetitive repairs – all of the tasks that could either be prevented through proactive maintenance or automated – are opportunities to introduce advanced workflows. Whatever you choose, this stage should provide you with clear, actionable goals that you can make plans for, which is why prioritization and planning go hand in hand.
AS YOU’RE PRIORITIZING, IT MAY BE HELPFUL TO THINK OF THREE CATEGORIES:
Long-term projects
Installing sensors on assets, improving network capacityto support IoT programs
Organizational priorities
Improving stats on completed work orders, MTBF, work management
Immediate action items
Broken/faulty equipment
D E S C R I P T I O N
E X A M P L E ( S )
C A T E G O R Y 1 C A T E G O R Y 2 C A T E G O R Y 3
16
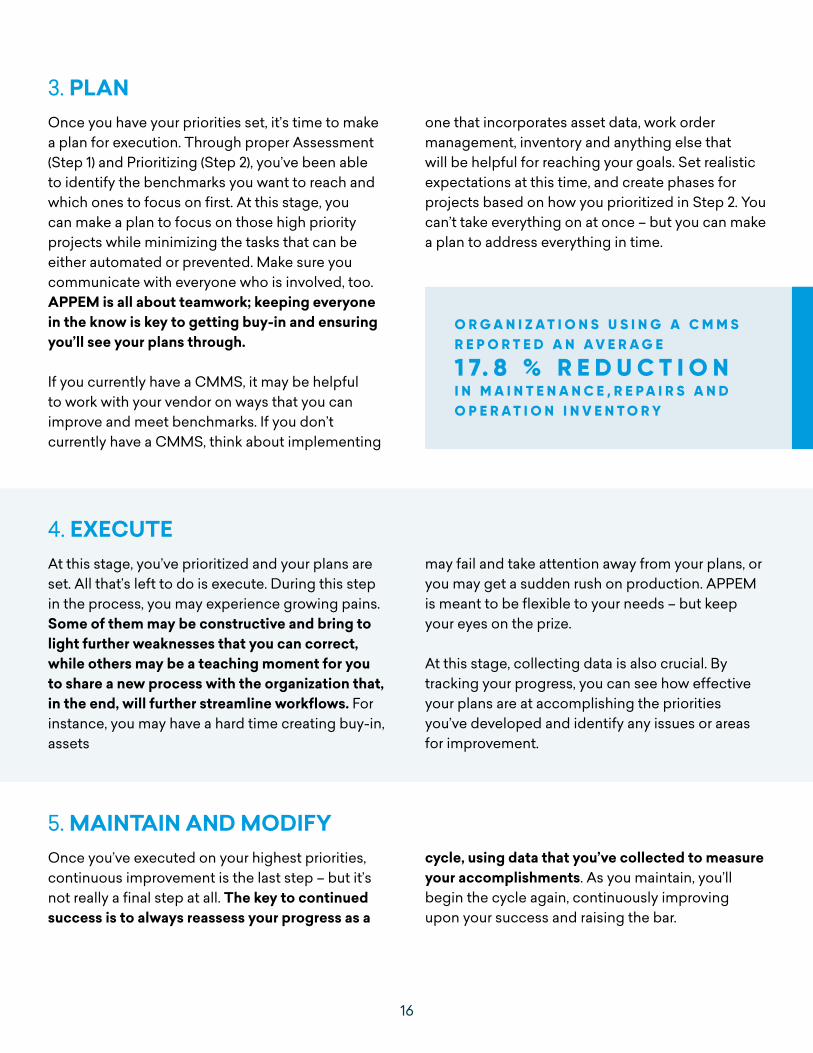
3. PLAN Once you have your priorities set, it’s time to make a plan for execution. Through proper Assessment (Step 1) and Prioritizing (Step 2), you’ve been able to identify the benchmarks you want to reach and which ones to focus on first. At this stage, you can make a plan to focus on those high priority projects while minimizing the tasks that can be either automated or prevented. Make sure you communicate with everyone who is involved, too. APPEM is all about teamwork; keeping everyone in the know is key to getting buy-in and ensuring you’ll see your plans through.
If you currently have a CMMS, it may be helpful to work with your vendor on ways that you can improve and meet benchmarks. If you don’t currently have a CMMS, think about implementing
one that incorporates asset data, work order management, inventory and anything else that will be helpful for reaching your goals. Set realistic expectations at this time, and create phases for projects based on how you prioritized in Step 2. You can’t take everything on at once – but you can make a plan to address everything in time.
4. EXECUTE At this stage, you’ve prioritized and your plans are set. All that’s left to do is execute. During this step in the process, you may experience growing pains. Some of them may be constructive and bring to light further weaknesses that you can correct, while others may be a teaching moment for you to share a new process with the organization that, in the end, will further streamline workflows. For instance, you may have a hard time creating buy-in, assets
may fail and take attention away from your plans, or you may get a sudden rush on production. APPEM is meant to be flexible to your needs – but keep your eyes on the prize.
At this stage, collecting data is also crucial. By tracking your progress, you can see how effective your plans are at accomplishing the priorities you’ve developed and identify any issues or areas for improvement.
O R G A N I Z A T I O N S U S I N G A C M M SR E P O R T E D A N A V E R A G E
1 7. 8 % R E D U C T I O N I N M A I N T E N A N C E , R E P A I R S A N D O P E R A T I O N I N V E N T O R Y
5. MAINTAIN AND MODIFY Once you’ve executed on your highest priorities,continuous improvement is the last step – but it’s not really a final step at all. The key to continued success is to always reassess your progress as a
cycle, using data that you’ve collected to measure your accomplishments. As you maintain, you’ll begin the cycle again, continuously improving upon your success and raising the bar.

17
CHAPTER 5CONCLUSION:
Keeping your eye on the prize
Many manufacturers already have an idea of where they can improve, but it’s that next step toward creating a plan and executing it that can be a challenge. That’s why it’s so important to have your team on your side. Buy-in is key for change management; whether you’re adopting a new CMMS, changing from your old solution or looking to develop your own APPEM plan, focusing on the value of these changes will win over key stakeholders.
It’s also important to keep your eye on the prize, and that involves setting realistic expectations. Although we’d like to tackle everything at once, improvement is an ongoing process that will take time. As such, starting small is a great idea. By focusing on the most vulnerable or most expensive assets, you’ll be able to create focus on one meaningful project and learn how to apply what you’ve learned about APPEM the next time.
At the same time, know that what works for you may not work for everyone else, and vice versa. Tailor your APPEM process to your needs. Look for a vendor who will work with your team on achieving your goals and help you develop as a maintenance professional. Dude Solutions’ Client Success Team helps identify areas for development and create a plan for continuous improvement. With the help of data and cloud-based software, clients are able to see their success in realtime and take control of their operations so they can get back to what matters most: Their assets.
It’s time to take control of your assets – not let your assets control you.

866.455.3833 / [email protected] / dudesolutions.com
A B O U T D U D E S O L U T I O N S
Dude Solutions is a leading software-as-a-service (SaaS) provider of operations management solutions to education, government, healthcare, senior living, manufacturing and membership-based organizations. For nearly two decades, Dude Solutions has inspired clients to create better work and better lives. We combine innovative, user-friendly technology with the world’s smartest operations engine, empowering operations leaders to transform the most important places in our lives. Today, more than 10,000 organizations use our award-winning software to manage maintenance, assets, energy, safety, IT, events and more. For more information, visit dudesolutions.com.