KeyStone’s AUGUST 2020
56
Subscriptions ANNUAL SUBSCRIPTIONS CANADIAN SMALL-CAP GROWTH ANNUAL PAYMENT: $799.00 (PLUS APPLICABLE TAXES) CANADIAN INCOME STOCK RESEARCH ANNUAL PAYMENT: $799.00 (PLUS APPLICABLE TAXES) KeyStone Financial Publishing Corp. 71513-1463 Johnston Rd White Rock, BC V4B 5J5, Canada Phone: 1-888-27-STOCK Fax: (604) 239-2138 Visit: www.keystocks.com E-mail: [email protected] Visit www.keystocks.com for more details. Editor’s Notes 2020 marks the release of KeyStone’s inaugural Canadian Green/Alternative Energy Stock Report. Our analysts started with over 80 TSX and TSX-Venture listed stocks in Canada screening for profitability, growth, balance sheet liquidity and track records within the green space. As an emerging sector, it is generally typified by a lack of consistent cash flow, however, within the Alternative Energy Production & Distribution group, Canada has been a significant leader. As such, the 2020 Report focusses on Alternative Energy Production & Distribution stocks, but we include Energy Efficiency (Industrial), Waste Reduction & Water Management, Low Impact Material & Products, and a number of stocks in the Miscellaneous category that have some level of association with green related products or services. Contents Introduction......................................................................................................................................2, 3, 4, 5 Table 1....................................................................................................................................................... 6, 7 Table 2....................................................................................................................................................... 8, 9 Table 3...................................................................................................................................................10, 11 Table 4....................................................................................................................................................12, 13 Table 5...................................................................................................................................................14, 15 Mini Reports & Recommendations..................................................................................................16 -55 Independent Equity Advisors KeyStone’s 2020 Canadian Green/Alternative Energy Stock Report KeyStone’s The information presented in this publication is drawn from sources believed to be reliable; however, the accuracy or completeness of this information is not guaranteed. Neither KeyStone Financial Publishing Corp. nor any of its affiliates accepts any liabilities whatsoever for any loss resulting from the use of this publication or its content. It should not be assumed that the past performance of any companies featured in this publication will equal future performance. KeyStone Financial Publishing Corp. is under no obligation to update information contained within this publication. KeyStone Financial Publishing Corp. does not accept fees or benefits of any nature from any corporation for the selection of the company within this publication. Employees of KeyStone Financial Publishing Corp. may hold a minor position in some of the featured companies’ securities. The information contained herein is for informative purposes only. This publication does not constitute an offer to sell or the solicitation of an offer to buy any securities. KeyStone’s Investment Research is not designed to counsel individual investors; those seeking specific investment advice should consider a qualified investment professional. AUGUST 2020 WWW.KEYSTOCKS.COM Editor: Ryan Irvine, BBA (Finance) Senior Analyst: Aaron Dunn, CFA Junior Analyst: Brennan Habetler, B.Comm (Finance)
Transcript of KeyStone’s AUGUST 2020
Subscriptions ANNUAL SUBSCRIPTIONS
CANADIAN SMALL-CAP GROWTH
ANNUAL PAYMENT: $799.00
(PLUS APPLICABLE TAXES)
CANADIAN INCOME STOCK RESEARCH
ANNUAL PAYMENT: $799.00
(PLUS APPLICABLE TAXES)
KeyStone Financial Publishing Corp. 71513-1463 Johnston Rd White Rock, BC V4B 5J5, Canada
Phone: 1-888-27-STOCK Fax: (604) 239-2138 Visit: www.keystocks.comE-mail: [email protected]
Visit www.keystocks.com for more details.
Editor’s Notes 2020 marks the release of KeyStone’s inaugural Canadian Green/Alternative Energy Stock Report. Our analysts started with over 80 TSX and TSX-Venture listed stocks in Canada screening for profitability, growth, balance sheet liquidity and track records within the green space. As an emerging sector, it is generally typified by a lack of consistent cash flow, however, within the Alternative Energy Production & Distribution group, Canada has been a significant leader. As such, the 2020 Report focusses on Alternative Energy Production & Distribution stocks, but we include Energy Efficiency (Industrial), Waste Reduction & Water Management, Low Impact Material & Products, and a number of stocks in the Miscellaneous category that have some level of association with green related products or services.
Contents Introduction......................................................................................................................................2, 3, 4, 5
Table 1....................................................................................................................................................... 6, 7
Table 2....................................................................................................................................................... 8, 9
Table 3...................................................................................................................................................10, 11
Table 4....................................................................................................................................................12, 13
Table 5...................................................................................................................................................14, 15
Mini Reports & Recommendations..................................................................................................16 -55
Independent Equity Advisors
KeyStone’s 2020 Canadian Green/Alternative Energy Stock Report
KeyStone’s
The information presented in this publication is drawn from sources believed to be reliable; however, the accuracy or completeness of this information is not guaranteed. Neither KeyStone Financial Publishing Corp. nor any of its affiliates accepts any liabilities whatsoever for any loss resulting from the use of this publication or its content. It should not be assumed that the past performance of any companies featured in this publication will equal future performance. KeyStone Financial Publishing Corp. is under no obligation to update information contained within this publication. KeyStone Financial Publishing Corp. does not accept fees or benefits of any nature from any corporation for the selection of the company within this publication. Employees of KeyStone Financial Publishing Corp. may hold a minor position in some of the featured companies’ securities. The information contained herein is for informative purposes only. This publication does not constitute an offer to sell or the solicitation of an offer to buy any securities. KeyStone’s Investment Research is not designed to counsel individual investors; those seeking specific investment advice should consider a qualified investment professional.
AUGUST 2020
www.keystocks.com
Editor: Ryan Irvine, BBA (Finance) Senior Analyst: Aaron Dunn, CFAJunior Analyst: Brennan Habetler, B.Comm (Finance)
2 Copyright 2020 KeyStone Financial Publishing Corp.
KeyStone’s Small-Cap/Income Stock Report August 2020
KeyStone’s 2020 Canadian Green/Alternative Energy Stock Report
2020 marks the release of KeyStone’s inaugural Canadian Green/Alternative Energy Stock Report. Our analysts start-ed with over 80 TSX and TSX-Venture listed stocks in Canada screening for profitability, growth, balance sheet li-quidity and track records within the green space. As an emerging sector, it is generally typified by a lack of consistent cash flow, however, within the Alternative Energy Production & Distribution group, Canada has been a significant leader. As such, the 2020 Report focusses on Alternative Energy Production & Distribution stocks, but we include En-ergy Efficiency (Industrial), Waste Reduction & Water Management, Low Impact Material & Products, and a number of stocks in the Miscellaneous category that have some level of association with green related products or services.
The alternative/renewable energy sector is comprised of companies that engage in the generation and distribution of renewable and clean energy, as well as related products and services. Renewable energy is any energy that’s derived from renewable resources that are replenished at a rate that is equal to or faster than the rate at which they are con-sumed. It includes everything from energy generated from solar, wind, geothermal, hydropower and ocean resources, biogas and liquid biofuels. So renewable energy stocks are tied to companies that produce the capability for us to leverage these types of energies.
Globally, renewable energy is a massive sector and a potentially promising place to put your investment dollars. It is one segment we have strategically placed KeyStone clients firmly in for well over a decade with great success includ-ing past recommendations such as WFI Waterfurnace (acquired for a massive gain) and Algonquin Power & Utili-ties Corp. (AQN:TSX) has produced strong gains and remains a long-term BUY. By as early as 2015, twice as much international capital was invested in clean energy as in fossil fuels – we believe this trend will continue. The growing list of names in the sector includes companies like Israel-based SolarEdge Technologies Inc. (SEDG:NASDAQ) – a recommended BUY from KeyStone’s US Growth Stock Coverage that has doubled in 2020, Brazil-based Compan-hia Energetica de Minas Gerais CEMIG (CIG:NYSE), Brookfield Renewable Partners L.P. (BEP:NYSE), and First Solar Inc. (FSLR:NASDAQ).
While a switch cannot occur overnight, the global economy is slowly pivoting away from greenhouse-gas-emitting fossil fuels toward cleaner and renewable alternatives. This transition to clean energy will take innovation and tril-lions of dollars and many decades to complete. However, it has the potential to make investors a lot of money. Of course, if you invest in the wrong companies, the opposite is also true.
How Fast is Renewable Energy Growing?
According to the International Energy Agency (IEA), renewables reached 25% of global electricity generation capac-ity in 2018. The IEA sees renewable energy generating capacity growing by another 50% through 2024 under its base-case scenario, with even faster growth possible if governments put the right policies and financial incentives in place. This is a tremendous growth rate.
The IEA sees the brightest future for solar, projecting that this technology will power the majority of that growth, ac-counting for 700 gigawatts (GW) of the 1,200 GW in anticipated new capacity additions through 2024. Onshore wind should be the next-largest contributor at 300 GW, followed by hydropower at more than 100 GW and offshore wind at about 50 GW.
Aside from technology improvement and cost, one potential headwind that has traditionally held back clean energy development is funding. There has been more investment needed than available capital, which is both a challenge and an opportunity.
What to Look for in Renewable Energy Investments
Renewable energy companies that generate free cash flow and have strong balance sheets have a competitive advan-tage over financially weaker rivals, since they have greater access to the capital needed to finance growth. As with any sector, in the alternative/renewable energy segment we stress investors should focus their attention on financially strong clean energy companies.
The sheer growth potential of the renewable energy sector provides the opportunity for any company focused on the industry to thrive. However, not all will, because growing topline revenues for the sake of growth won’t enrich share-
Introduction
3Copyright 2020 KeyStone Financial Publishing Corp.
KeyStone’s Small-Cap/Income Stock Report August 2020
holders. Instead, investors should seek companies that wisely allocate capital to renewable energy projects that gener-ate attractive returns on investment. Smart capital allocation is essential to maintaining a strong financial profile.
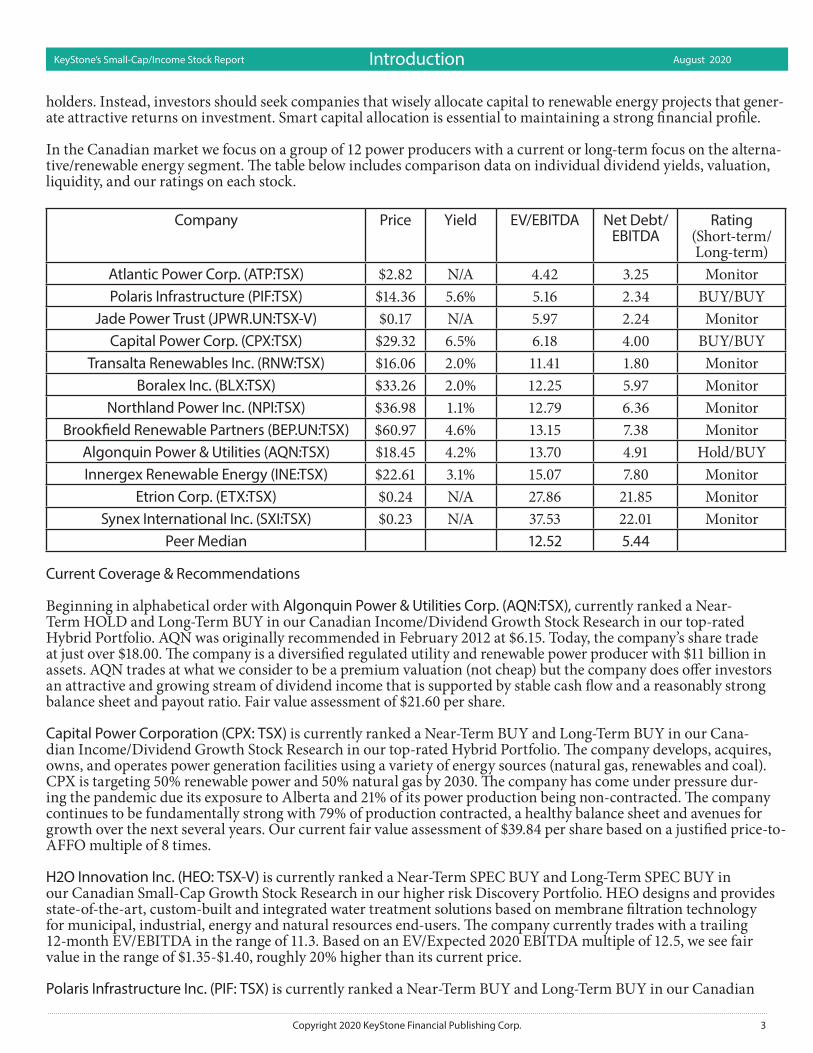
In the Canadian market we focus on a group of 12 power producers with a current or long-term focus on the alterna-tive/renewable energy segment. The table below includes comparison data on individual dividend yields, valuation, liquidity, and our ratings on each stock.
Company Price Yield EV/EBITDA Net Debt/EBITDA
Rating (Short-term/Long-term)
Atlantic Power Corp. (ATP:TSX) $2.82 N/A 4.42 3.25 MonitorPolaris Infrastructure (PIF:TSX) $14.36 5.6% 5.16 2.34 BUY/BUY
Jade Power Trust (JPWR.UN:TSX-V) $0.17 N/A 5.97 2.24 MonitorCapital Power Corp. (CPX:TSX) $29.32 6.5% 6.18 4.00 BUY/BUY
Transalta Renewables Inc. (RNW:TSX) $16.06 2.0% 11.41 1.80 MonitorBoralex Inc. (BLX:TSX) $33.26 2.0% 12.25 5.97 Monitor
Northland Power Inc. (NPI:TSX) $36.98 1.1% 12.79 6.36 MonitorBrookfield Renewable Partners (BEP.UN:TSX) $60.97 4.6% 13.15 7.38 Monitor
Algonquin Power & Utilities (AQN:TSX) $18.45 4.2% 13.70 4.91 Hold/BUYInnergex Renewable Energy (INE:TSX) $22.61 3.1% 15.07 7.80 Monitor
Etrion Corp. (ETX:TSX) $0.24 N/A 27.86 21.85 MonitorSynex International Inc. (SXI:TSX) $0.23 N/A 37.53 22.01 Monitor
Peer Median 12.52 5.44
Current Coverage & Recommendations
Beginning in alphabetical order with Algonquin Power & Utilities Corp. (AQN:TSX), currently ranked a Near-Term HOLD and Long-Term BUY in our Canadian Income/Dividend Growth Stock Research in our top-rated Hybrid Portfolio. AQN was originally recommended in February 2012 at $6.15. Today, the company’s share trade at just over $18.00. The company is a diversified regulated utility and renewable power producer with $11 billion in assets. AQN trades at what we consider to be a premium valuation (not cheap) but the company does offer investors an attractive and growing stream of dividend income that is supported by stable cash flow and a reasonably strong balance sheet and payout ratio. Fair value assessment of $21.60 per share.
Capital Power Corporation (CPX: TSX) is currently ranked a Near-Term BUY and Long-Term BUY in our Cana-dian Income/Dividend Growth Stock Research in our top-rated Hybrid Portfolio. The company develops, acquires, owns, and operates power generation facilities using a variety of energy sources (natural gas, renewables and coal). CPX is targeting 50% renewable power and 50% natural gas by 2030. The company has come under pressure dur-ing the pandemic due its exposure to Alberta and 21% of its power production being non-contracted. The company continues to be fundamentally strong with 79% of production contracted, a healthy balance sheet and avenues for growth over the next several years. Our current fair value assessment of $39.84 per share based on a justified price-to-AFFO multiple of 8 times.
H2O Innovation Inc. (HEO: TSX-V) is currently ranked a Near-Term SPEC BUY and Long-Term SPEC BUY in our Canadian Small-Cap Growth Stock Research in our higher risk Discovery Portfolio. HEO designs and provides state-of-the-art, custom-built and integrated water treatment solutions based on membrane filtration technology for municipal, industrial, energy and natural resources end-users. The company currently trades with a trailing 12-month EV/EBITDA in the range of 11.3. Based on an EV/Expected 2020 EBITDA multiple of 12.5, we see fair value in the range of $1.35-$1.40, roughly 20% higher than its current price.
Polaris Infrastructure Inc. (PIF: TSX) is currently ranked a Near-Term BUY and Long-Term BUY in our Canadian
Introduction
4 Copyright 2020 KeyStone Financial Publishing Corp.
KeyStone’s Small-Cap/Income Stock Report August 2020
Income/Dividend Growth Stock Research in our top-rated Hybrid Portfolio. The company is a Canadian-based, renewable power producer with projects in Latin America. Currently, PIF operates a 72MW geothermal project lo-cated in Nicaragua and a 3 run-of-river hydro projects located in Peru with total capacity of 32MW. The stock is very attractively valued at ~4 times trailing operating cash flow of US$2.97 per share. The balance sheet is well capitalized with low debt leverage ratios, and US$48 million in cash, and the dividend payment is conservatively covered by cash flow (payout ratio of 20%). The main risk of PIF remains the project and country concentration and we continue to view the company as high-risk among our income stock recommendations. PIF’s current fair value assessment of $20.00 per share based on a justified price-to-cash flow multiple of ~5 times.
Questor Technology Inc. (QST: TSX-V) is currently ranked a Near-Term HOLD and Long-Term HOLD in our Ca-nadian Small-Cap Growth Stock Research in our higher risk Discovery Portfolio. The company provides specialized waste gas incineration products and services that destroy harmful pollutants in any waste gas stream at 99.99% ef-ficiency enabling clients to meet emission regulations, address community concerns and improve safety at industrial sites. Questor entered 2020 on a strong footing with a great balance sheet, strong cash flow and expansion of its large rental fleet into new markets. All of this ended as global oil prices collapsed in the global COVID-19 pandemic. The company’s shares have suffered significantly since. Questor’s strong balance sheet will protect the business mid-term in the economic turmoil and enables growth when the market’s confidence improves. At present, we shift Questor to a HOLD and would not enter new positions. We do see a potential for a recovery as the energy sector stabilizes once again, but this is likely at least 12 months forward. For those who do not wish to hold for the next 2-3 years, the stock could be sold and capital deployed in other opportunities with better near and mid-term cash flow growth potential from our Focus BUY Portfolio.
Notable Mentions
While not current recommendations, we continue to closely monitor a number of names from the tables above in-cluding (in alphabetical order) Biorem Inc. (BRM: TSX-V), a clean technology company that designs, manufactures, and distributes a comprehensive line of high-efficiency emissions control systems used to eliminate odors, volatile organic compounds (VOCs) and hazardous air pollutants (HAPs). BRM has a strong balance sheet for a micro-cap with a net cash position. The company has a good order backlog but the contract nature of this business has histori-cally created lumpy and less predictable earnings. There is potential for higher risk, patient investors and we continue to monitor it.
Northland Power Inc. (NPI: TSX) is a power producer dedicated to developing, building, owning and operating clean and green power infrastructure assets in Canada, Europe and other selected global jurisdictions. NPI has been a strong growth stock with the renewable power space. The company maintains a robust pipeline of development projects which should support continued growth in upcoming years. The balance sheet does carry a relatively high amount of debt leverage. For 2020, the company’s guidance indicates free cash flow roughly in line (to moderately higher) than 2019.
PFB Corporation. (PFB: TSX) is a company the TSX classifies as green, but we consider it to have a more “loose” association with the green product segment. The company manufactures and markets insulating building products made from expanded polystyrene materials (EPS) for the residential, industrial, and commercial construction mar-kets in North America. Valuations appear attractive with the business trading with a trailing EV/EBITDA multiple of around 4. Add in a strong balance sheet and a solid 3.2% dividend yield and PFB checks off a good deal of our boxes. The business is both seasonal and cyclical in nature and can fluctuate significantly within the business cycle. Management has stated they expect growth to be interrupted by this health crisis. The extent or length of the decline is unknown. We see PFB as a well-run business with cyclical business cycle risk. We are monitoring for potential entry points which may or may not present themselves.
Thermal Energy International Inc. (TMG:TSX-V) is a provider of proprietary and proven energy and water effi-ciency and emission reduction products and solutions to the industrial, commercial, and institutional markets. TMG, a true micro-cap with an ~$12 million market cap, in recent years has produced decent growth in revenue, adjusted EBITDA and has a strong balance sheet with a net cash position, all while paying down its debt. The company ap-pears to trade with an attractive EV/EBITDA multiple of ~4.2. Unfortunately, the company does not provide any guidance other than its backlog in revenue, which just hit an 8-quarter low, indicating the company may have limited growth or face negative growth near term. The company also announced that its business has slowed due to the CO-VID-19 pandemic, as many projects have been delayed. Despite Thermal Energy’s generally attractive fundamentals, the large decrease in its backlog has made us place the stock on our monitor list.
Introduction

5Copyright 2020 KeyStone Financial Publishing Corp.
KeyStone’s Small-Cap/Income Stock Report August 2020
Xebec Adsorption Inc. (XBC: TSX-V) specializes in developing products and technology solutions for environ-mentally responsible generation, purification, dehydration, separation, and filtration applications for gases. XBC is a business we like. The revenue growth has been strong and the continued increase in backlog and bidding activity in a couple of segments with significant tailwinds are positives long term. At present, based on the company’s cash flow, earnings, and EBITDA over the last 12 months, the stock is pricy. Given the current COVID-19 environment, while management has maintained its 2020 revenue guidance of $80 to $90 million, it has retracted earnings and EBITDA guidance. It may be a long-term option for investors looking for green exposure, but the lack of consistent cash flow at present and high relative valuations put XBC outside of our strict criteria.
Introduction
6 Copyright 2020 KeyStone Financial Publishing Corp.
KeyStone’s Small-Cap/Income Stock Report August 2020 TABLE 1
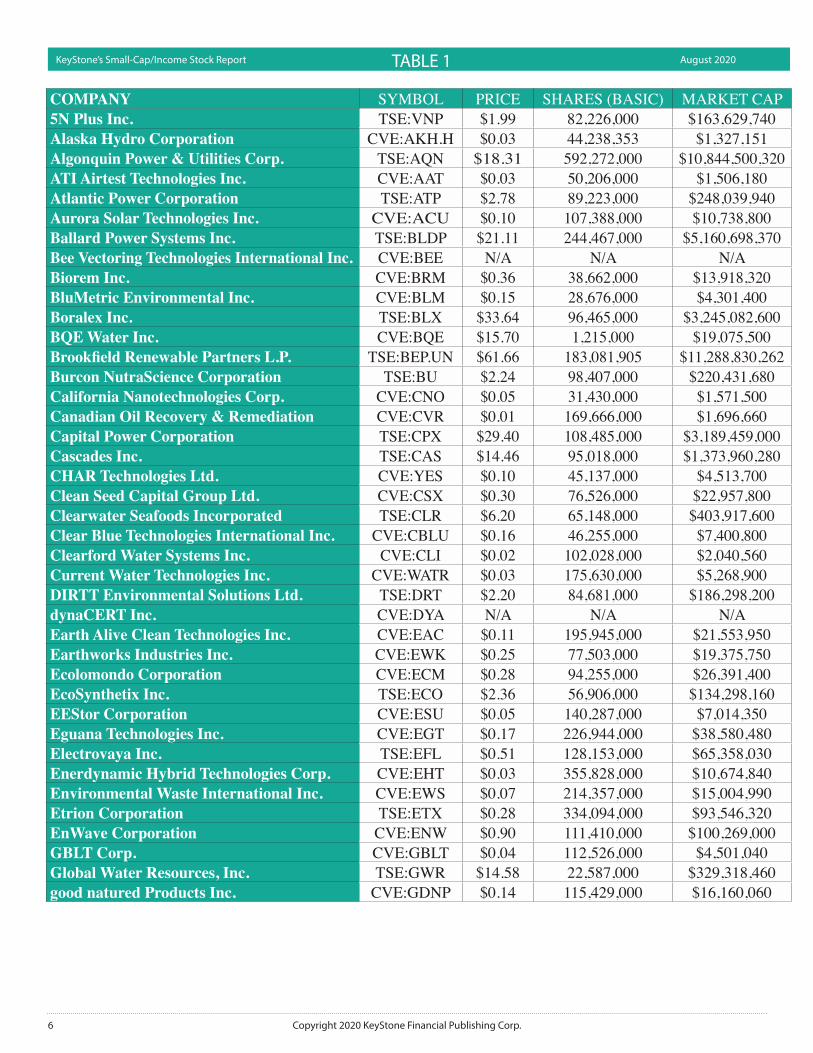
COMPANY SYMBOL PRICE SHARES (BASIC) MARKET CAP5N Plus Inc. TSE:VNP $1.99 82,226,000 $163,629,740Alaska Hydro Corporation CVE:AKH.H $0.03 44,238,353 $1,327,151Algonquin Power & Utilities Corp. TSE:AQN $18.31 592,272,000 $10,844,500,320ATI Airtest Technologies Inc. CVE:AAT $0.03 50,206,000 $1,506,180Atlantic Power Corporation TSE:ATP $2.78 89,223,000 $248,039,940Aurora Solar Technologies Inc. CVE:ACU $0.10 107,388,000 $10,738,800Ballard Power Systems Inc. TSE:BLDP $21.11 244,467,000 $5,160,698,370Bee Vectoring Technologies International Inc. CVE:BEE N/A N/A N/ABiorem Inc. CVE:BRM $0.36 38,662,000 $13,918,320BluMetric Environmental Inc. CVE:BLM $0.15 28,676,000 $4,301,400Boralex Inc. TSE:BLX $33.64 96,465,000 $3,245,082,600BQE Water Inc. CVE:BQE $15.70 1,215,000 $19,075,500Brookfield Renewable Partners L.P. TSE:BEP.UN $61.66 183,081,905 $11,288,830,262Burcon NutraScience Corporation TSE:BU $2.24 98,407,000 $220,431,680California Nanotechnologies Corp. CVE:CNO $0.05 31,430,000 $1,571,500Canadian Oil Recovery & Remediation CVE:CVR $0.01 169,666,000 $1,696,660Capital Power Corporation TSE:CPX $29.40 108,485,000 $3,189,459,000Cascades Inc. TSE:CAS $14.46 95,018,000 $1,373,960,280CHAR Technologies Ltd. CVE:YES $0.10 45,137,000 $4,513,700Clean Seed Capital Group Ltd. CVE:CSX $0.30 76,526,000 $22,957,800Clearwater Seafoods Incorporated TSE:CLR $6.20 65,148,000 $403,917,600Clear Blue Technologies International Inc. CVE:CBLU $0.16 46,255,000 $7,400,800Clearford Water Systems Inc. CVE:CLI $0.02 102,028,000 $2,040,560Current Water Technologies Inc. CVE:WATR $0.03 175,630,000 $5,268,900DIRTT Environmental Solutions Ltd. TSE:DRT $2.20 84,681,000 $186,298,200dynaCERT Inc. CVE:DYA N/A N/A N/AEarth Alive Clean Technologies Inc. CVE:EAC $0.11 195,945,000 $21,553,950Earthworks Industries Inc. CVE:EWK $0.25 77,503,000 $19,375,750Ecolomondo Corporation CVE:ECM $0.28 94,255,000 $26,391,400EcoSynthetix Inc. TSE:ECO $2.36 56,906,000 $134,298,160EEStor Corporation CVE:ESU $0.05 140,287,000 $7,014,350Eguana Technologies Inc. CVE:EGT $0.17 226,944,000 $38,580,480Electrovaya Inc. TSE:EFL $0.51 128,153,000 $65,358,030Enerdynamic Hybrid Technologies Corp. CVE:EHT $0.03 355,828,000 $10,674,840Environmental Waste International Inc. CVE:EWS $0.07 214,357,000 $15,004,990Etrion Corporation TSE:ETX $0.28 334,094,000 $93,546,320EnWave Corporation CVE:ENW $0.90 111,410,000 $100,269,000GBLT Corp. CVE:GBLT $0.04 112,526,000 $4,501,040Global Water Resources, Inc. TSE:GWR $14.58 22,587,000 $329,318,460good natured Products Inc. CVE:GDNP $0.14 115,429,000 $16,160,060
7Copyright 2020 KeyStone Financial Publishing Corp.
KeyStone’s Small-Cap/Income Stock Report August 2020 TABLE 1
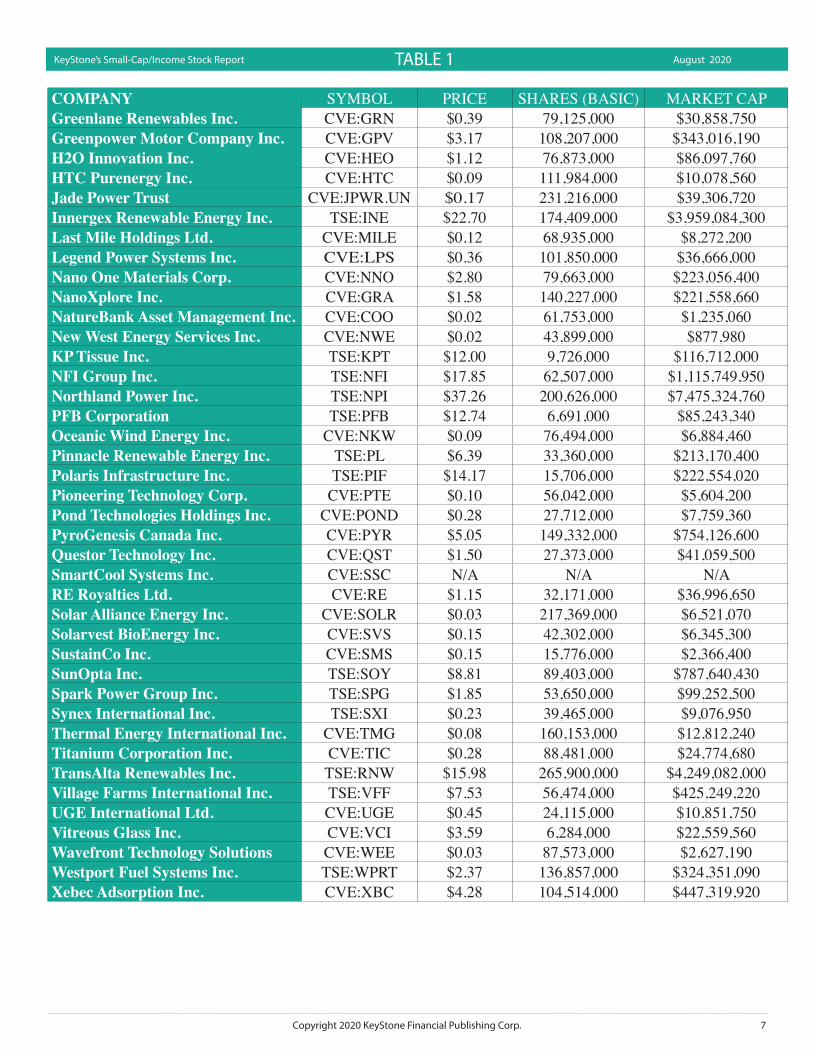
COMPANY SYMBOL PRICE SHARES (BASIC) MARKET CAPGreenlane Renewables Inc. CVE:GRN $0.39 79,125,000 $30,858,750Greenpower Motor Company Inc. CVE:GPV $3.17 108,207,000 $343,016,190H2O Innovation Inc. CVE:HEO $1.12 76,873,000 $86,097,760HTC Purenergy Inc. CVE:HTC $0.09 111,984,000 $10,078,560Jade Power Trust CVE:JPWR.UN $0.17 231,216,000 $39,306,720Innergex Renewable Energy Inc. TSE:INE $22.70 174,409,000 $3,959,084,300Last Mile Holdings Ltd. CVE:MILE $0.12 68,935,000 $8,272,200Legend Power Systems Inc. CVE:LPS $0.36 101,850,000 $36,666,000Nano One Materials Corp. CVE:NNO $2.80 79,663,000 $223,056,400NanoXplore Inc. CVE:GRA $1.58 140,227,000 $221,558,660NatureBank Asset Management Inc. CVE:COO $0.02 61,753,000 $1,235,060New West Energy Services Inc. CVE:NWE $0.02 43,899,000 $877,980KP Tissue Inc. TSE:KPT $12.00 9,726,000 $116,712,000NFI Group Inc. TSE:NFI $17.85 62,507,000 $1,115,749,950Northland Power Inc. TSE:NPI $37.26 200,626,000 $7,475,324,760PFB Corporation TSE:PFB $12.74 6,691,000 $85,243,340Oceanic Wind Energy Inc. CVE:NKW $0.09 76,494,000 $6,884,460Pinnacle Renewable Energy Inc. TSE:PL $6.39 33,360,000 $213,170,400Polaris Infrastructure Inc. TSE:PIF $14.17 15,706,000 $222,554,020Pioneering Technology Corp. CVE:PTE $0.10 56,042,000 $5,604,200Pond Technologies Holdings Inc. CVE:POND $0.28 27,712,000 $7,759,360PyroGenesis Canada Inc. CVE:PYR $5.05 149,332,000 $754,126,600Questor Technology Inc. CVE:QST $1.50 27,373,000 $41,059,500SmartCool Systems Inc. CVE:SSC N/A N/A N/ARE Royalties Ltd. CVE:RE $1.15 32,171,000 $36,996,650Solar Alliance Energy Inc. CVE:SOLR $0.03 217,369,000 $6,521,070Solarvest BioEnergy Inc. CVE:SVS $0.15 42,302,000 $6,345,300SustainCo Inc. CVE:SMS $0.15 15,776,000 $2,366,400SunOpta Inc. TSE:SOY $8.81 89,403,000 $787,640,430Spark Power Group Inc. TSE:SPG $1.85 53,650,000 $99,252,500Synex International Inc. TSE:SXI $0.23 39,465,000 $9,076,950Thermal Energy International Inc. CVE:TMG $0.08 160,153,000 $12,812,240Titanium Corporation Inc. CVE:TIC $0.28 88,481,000 $24,774,680TransAlta Renewables Inc. TSE:RNW $15.98 265,900,000 $4,249,082,000Village Farms International Inc. TSE:VFF $7.53 56,474,000 $425,249,220UGE International Ltd. CVE:UGE $0.45 24,115,000 $10,851,750Vitreous Glass Inc. CVE:VCI $3.59 6,284,000 $22,559,560Wavefront Technology Solutions CVE:WEE $0.03 87,573,000 $2,627,190Westport Fuel Systems Inc. TSE:WPRT $2.37 136,857,000 $324,351,090Xebec Adsorption Inc. CVE:XBC $4.28 104,514,000 $447,319,920

8 Copyright 2020 KeyStone Financial Publishing Corp.
KeyStone’s Small-Cap/Income Stock Report August 2020 TABLE 2
COMPANY CATEGORY REVENUE (Q)5N Plus Inc. Misc. $49,954,000Alaska Hydro Corporation Energy Production & Distribution $0Algonquin Power & Utilities Corp. Energy Production & Distribution $464,901,000ATI Airtest Technologies Inc. Energy Efficiency (Industrial) $865,131Atlantic Power Corporation Energy Production & Distribution $72,800,000Aurora Solar Technologies Inc. Energy Efficiency (Industrial) $1,013,763Ballard Power Systems Inc. Energy Efficiency (Industrial) $24,000,000Bee Vectoring Technologies International Misc. $216,963Biorem Inc. Waste Reduction & Water Management $6,897,722BluMetric Environmental Inc. Waste Reduction & Water Management $6,315,574Boralex Inc. Energy Production & Distribution $200,000,000BQE Water Inc. Waste Reduction & Water Management $1,935,697Brookfield Renewable Partners L.P. Energy Production & Distribution $792,000,000Burcon NutraScience Corporation Misc. $3,399California Nanotechnologies Corp. Misc. $831,052Canadian Oil Recovery & Remediation Energy Production & Distribution $49,144Capital Power Corporation Energy Production & Distribution $504,000,000Cascades Inc. Low Impact Material & Products $1,313,000,000CHAR Technologies Ltd. Low Impact Material & Products $534,343Clean Seed Capital Group Ltd. Low Impact Material & Products $0Clearwater Seafoods Incorporated Misc. $100,341,000Clear Blue Technologies International Inc. Energy Production & Distribution $238,171Clearford Water Systems Inc. Waste Reduction & Water Management $3,177,322Current Water Technologies Inc. Waste Reduction & Water Management $207,905DIRTT Environmental Solutions Ltd. Misc. $40,981,000dynaCERT Inc. Misc. $312,584Earth Alive Clean Technologies Inc. Low Impact Material and Products $1,253,822Earthworks Industries Inc. Waste Reduction & Water Management $0Ecolomondo Corporation Waste Reduction & Water Management $0EcoSynthetix Inc. Low Impact Material and Products $4,224,416EEStor Corporation Misc. $0Eguana Technologies Inc. Misc. $1,638,778Electrovaya Inc. Energy Efficiency (Industrial) $1,947,000Enerdynamic Hybrid Technologies Corp. Misc. $23,922Environmental Waste International Inc. Waste Reduction & Water Management $41,822Etrion Corporation Energy Production & Distribution $4,296,000EnWave Corporation Misc. $7,492,000GBLT Corp. Energy Efficiency (Industrial) $20,428,698Global Water Resources, Inc. Waste Reduction & Water Management $8,230,000good natured Products Inc. Low Impact Material and Products $3,052,087

9Copyright 2020 KeyStone Financial Publishing Corp.
KeyStone’s Small-Cap/Income Stock Report August 2020 TABLE 2
COMPANY CATEGORY REVENUE (Q)Greenlane Renewables Inc. Energy Production & Distribution $2,930,000Greenpower Motor Company Inc. Misc. $4,977,548H2O Innovation Inc. Waste Reduction & Water Management $36,061,000HTC Purenergy Inc. Misc. $707,615Jade Power Trust Energy Production & Distribution $5,603,387Innergex Renewable Energy Inc. Energy Production & Distribution $132,116,000Last Mile Holdings Ltd. Misc. $293,584Legend Power Systems Inc. Energy Efficiency (Industrial) $676,359Nano One Materials Corp. Low Impact Material and Products $0NanoXplore Inc. Low Impact Material and Products $14,866,180NatureBank Asset Management Inc. Misc. $323,504New West Energy Services Inc. Waste Reduction & Water Management $1,892,471KP Tissue Inc. Low Impact Material and Products $375,100,000NFI Group Inc. Misc. $710,400,000Northland Power Inc. Energy Production & Distribution $667,695,000PFB Corporation Energy Efficiency (Industrial) $24,233,000Oceanic Wind Energy Inc. Energy Production & Distribution $0Pinnacle Renewable Energy Inc. Low Impact Material and Products $109,675,000Polaris Infrastructure Inc. Energy Production & Distribution $20,272,000Pioneering Technology Corp. Energy Efficiency (Industrial) $2,514,757Pond Technologies Holdings Inc. Misc. $0PyroGenesis Canada Inc. Waste Reduction & Water Management $718,908Questor Technology Inc. Low Impact Material and Products $4,489,470SmartCool Systems Inc. Energy Efficiency (Industrial) $727,570RE Royalties Ltd. Misc. $443,486Solar Alliance Energy Inc. Energy Production & Distribution $625,288Solarvest BioEnergy Inc. Low Impact Material and Products $0SustainCo Inc. Misc. $2,139,824SunOpta Inc. Low Impact Material and Products $335,949,000Spark Power Group Inc. Misc. $53,512,000Synex International Inc. Energy Production & Distribution $1,049,390Thermal Energy International Inc. Energy Efficiency (Industrial) $5,811,626Titanium Corporation Inc. Waste Reduction and Water Management $0TransAlta Renewables Inc. Energy Production & Distribution $606,000,000Village Farms International Inc. Misc. $32,112,000UGE International Ltd. Energy Production & Distribution $640,013Vitreous Glass Inc. Low Impact Material and Products $1,416,820Wavefront Technology Solutions Inc. Waste Reduction and Water Management $706,040Westport Fuel Systems Inc. Energy Efficiency (Industrial) $67,223,000Xebec Adsorption Inc. Energy Efficiency (Industrial) $12,192,910

10 Copyright 2020 KeyStone Financial Publishing Corp.
KeyStone’s Small-Cap/Income Stock Report August 2020 TABLE 3
COMPANY REVENUE (Q-1)
REV GROWTH CFO (Q) ADJ. EARNINGS (Q)
5N Plus Inc. $51,413,000 -2.84% $4,774,000 $2,445,000Alaska Hydro Corporation $0 N/AAlgonquin Power & Utilities Corp. $477,225,000 -2.58% $66,867,000 $141,914,000ATI Airtest Technologies Inc. $673,570 28.44% -$170,064 -$500,796Atlantic Power Corporation $73,000,000 -0.27% $8,400,000 $14,900,000Aurora Solar Technologies Inc. $0 N/A $165,348 -$68,936Ballard Power Systems Inc. $16,000,000 50.00% -$10,100,000 -$13,500,000Bee Vectoring Technologies International $58,084 273.53% -$1,953,320 -$740,304Biorem Inc. $4,061,321 69.84% $74,332 $193,360BluMetric Environmental Inc. $7,601,208 -16.91% -$1,256,464 $55,379Boralex Inc. $172,000,000 16.28% $124,000,000 $24,000,000BQE Water Inc. $716,360 170.21% -$1,031,102 $41,019Brookfield Renewable Partners L.P. $825,000,000 -4.00% $355,000,000 $114,000,000Burcon NutraScience Corporation $11,731 -71.03% -$219,173 -$509,314California Nanotechnologies Corp. $749,793 10.84% $136,248 -$24,823Canadian Oil Recovery & Remediation $31,373 56.64% -$98,685Capital Power Corporation $365,000,000 38.08% $103,000,000 $28,000,000Cascades Inc. $1,230,000,000 6.75% $119,000,000 $39,000,000CHAR Technologies Ltd. $298,003 79.31% $18,824 -$434,219Clean Seed Capital Group Ltd. $0 N/A -$377,713Clearwater Seafoods Incorporated $120,083,000 -16.44% $4,043,000 -$6,327,000Clear Blue Technologies International Inc. $340,266 -30.00% $299,308 -$1,086,862Clearford Water Systems Inc. $2,011,437 57.96% -$3,458,053 -$641,680Current Water Technologies Inc. $542,656 -61.69% -$70,143 -$124,142DIRTT Environmental Solutions Ltd. $65,061,000 -37.01% -$760,000 -$7,289,000dynaCERT Inc. $3,240 9547.65% -$3,066,801 -$2,307,513Earth Alive Clean Technologies Inc. $212,613 489.72% -$80,426 -$222,088Earthworks Industries Inc. $0 N/AEcolomondo Corporation $0 N/AEcoSynthetix Inc. $4,468,721 -5.47% $583,957 -$705,229EEStor Corporation $0 N/AEguana Technologies Inc. $973,140 68.40% -$2,913,252 -$1,112,023Electrovaya Inc. $1,253,000 55.39% -$2,761,000 -$227,000Enerdynamic Hybrid Technologies Corp. $13,382 78.76% -$927,410 -$765,732Environmental Waste International Inc. $41,674 0.36% -$202,429 -$348,496Etrion Corporation $4,216,000 1.90% $1,221,000 -$1,425,000EnWave Corporation $8,773,000 -14.60% -$748,000 -$1,840,000GBLT Corp. $20,701,094 -1.32% $324,545 -$733,652Global Water Resources, Inc. $7,723,000 6.56% $3,170,000 $1,591,000good natured Products Inc. $2,056,014 48.45% -$2,699,865 -$430,781

11Copyright 2020 KeyStone Financial Publishing Corp.
KeyStone’s Small-Cap/Income Stock Report August 2020 TABLE 3
COMPANY REVENUE (Q-1)
REV GROWTH CFO (Q) ADJ. EARNINGS (Q)
Greenlane Renewables Inc. $0 N/A -$2,273,000 -$1,049,000Greenpower Motor Company Inc. $1,106,530 349.83% -$1,728,948 -$462,521H2O Innovation Inc. $32,325,000 11.56% $883,000 $2,404,000HTC Purenergy Inc. $768,880 -7.97% -$26,724 -$1,261,848Jade Power Trust $4,877,476 14.88% $1,523,682 $2,429,753Innergex Renewable Energy Inc. $126,419,000 4.51% $19,033,000 -$8,456,000Last Mile Holdings Ltd. $45,411 546.50% -$2,480,287 -$2,704,805Legend Power Systems Inc. $769,443 -12.10% -$1,712,409 -$1,498,549Nano One Materials Corp. $0 N/ANanoXplore Inc. $20,720,455 -28.25% -$602,054 -$1,961,314NatureBank Asset Management Inc. $416,627 -22.35% $119,768 -$199,114New West Energy Services Inc. $3,196,071 -40.79% $24,421KP Tissue Inc. $351,000,000 6.87% $26,800,000NFI Group Inc. $567,000,000 25.29% -$16,383,000 -$500,000Northland Power Inc. $498,540,000 33.93% $367,594,000 $336,027,000PFB Corporation $24,113,000 0.50% -$5,454,000 $601,000Oceanic Wind Energy Inc. $0 N/APinnacle Renewable Energy Inc. $89,627,000 22.37% $11,799,000 -$6,606,000Polaris Infrastructure Inc. $18,601,000 8.98% $8,898,000 $8,616,000Pioneering Technology Corp. $914,544 174.97% $2,059,257 -$225,867Pond Technologies Holdings Inc. $0 N/APyroGenesis Canada Inc. $736,443 -2.38% $267,068 -$956,400Questor Technology Inc. $7,720,488 -41.85% $1,360,790 $490,917SmartCool Systems Inc. $214,147 239.75% -$1,169,989 -$41,246RE Royalties Ltd. $282,152 57.18% $268,056 -$14,585Solar Alliance Energy Inc. $213,547 192.81% $2,969 $10,105Solarvest BioEnergy Inc. $0 N/ASustainCo Inc. $3,730,914 -42.65% $4,133 -$379,812SunOpta Inc. $305,275,000 10.05% $34,749,000 $939,000Spark Power Group Inc. $34,272,000 56.14% -$3,012,000 -$159,000Synex International Inc. $781,529 34.27% $57,492 $296,342Thermal Energy International Inc. $3,114,757 86.58% -$944,673 $604,711Titanium Corporation Inc. $0 N/ATransAlta Renewables Inc. $648,000,000 -6.48% $214,000,000 $66,000,000Village Farms International Inc. $31,890,000 0.70% -$535,000 $2,564,000UGE International Ltd. $2,065,556 -69.01% -$465,351 -$649,479Vitreous Glass Inc. $1,071,062 32.28% $582,508 $640,217Wavefront Technology Solutions Inc. $894,887 -21.10% -$583,380 -$425,916Westport Fuel Systems Inc. $73,191,000 -8.15% -$9,808,000 -$11,670,000Xebec Adsorption Inc. $9,768,797 24.81% -$918,767 $674,060
12 Copyright 2020 KeyStone Financial Publishing Corp.
KeyStone’s Small-Cap/Income Stock Report August 2020 TABLE 4
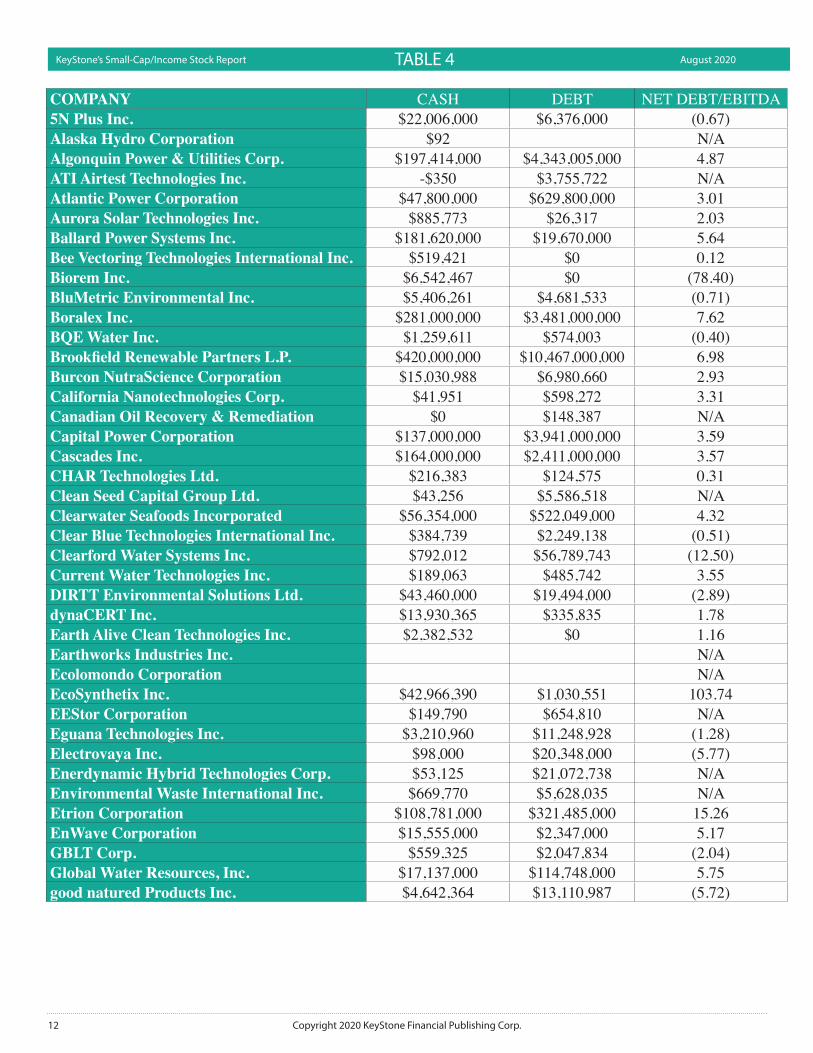
COMPANY CASH DEBT NET DEBT/EBITDA5N Plus Inc. $22,006,000 $6,376,000 (0.67)Alaska Hydro Corporation $92 N/AAlgonquin Power & Utilities Corp. $197,414,000 $4,343,005,000 4.87ATI Airtest Technologies Inc. -$350 $3,755,722 N/AAtlantic Power Corporation $47,800,000 $629,800,000 3.01Aurora Solar Technologies Inc. $885,773 $26,317 2.03Ballard Power Systems Inc. $181,620,000 $19,670,000 5.64Bee Vectoring Technologies International Inc. $519,421 $0 0.12Biorem Inc. $6,542,467 $0 (78.40)BluMetric Environmental Inc. $5,406,261 $4,681,533 (0.71)Boralex Inc. $281,000,000 $3,481,000,000 7.62BQE Water Inc. $1,259,611 $574,003 (0.40)Brookfield Renewable Partners L.P. $420,000,000 $10,467,000,000 6.98Burcon NutraScience Corporation $15,030,988 $6,980,660 2.93California Nanotechnologies Corp. $41,951 $598,272 3.31Canadian Oil Recovery & Remediation $0 $148,387 N/ACapital Power Corporation $137,000,000 $3,941,000,000 3.59Cascades Inc. $164,000,000 $2,411,000,000 3.57CHAR Technologies Ltd. $216,383 $124,575 0.31Clean Seed Capital Group Ltd. $43,256 $5,586,518 N/AClearwater Seafoods Incorporated $56,354,000 $522,049,000 4.32Clear Blue Technologies International Inc. $384,739 $2,249,138 (0.51)Clearford Water Systems Inc. $792,012 $56,789,743 (12.50)Current Water Technologies Inc. $189,063 $485,742 3.55DIRTT Environmental Solutions Ltd. $43,460,000 $19,494,000 (2.89)dynaCERT Inc. $13,930,365 $335,835 1.78Earth Alive Clean Technologies Inc. $2,382,532 $0 1.16Earthworks Industries Inc. N/AEcolomondo Corporation N/AEcoSynthetix Inc. $42,966,390 $1,030,551 103.74EEStor Corporation $149,790 $654,810 N/AEguana Technologies Inc. $3,210,960 $11,248,928 (1.28)Electrovaya Inc. $98,000 $20,348,000 (5.77)Enerdynamic Hybrid Technologies Corp. $53,125 $21,072,738 N/AEnvironmental Waste International Inc. $669,770 $5,628,035 N/AEtrion Corporation $108,781,000 $321,485,000 15.26EnWave Corporation $15,555,000 $2,347,000 5.17GBLT Corp. $559,325 $2,047,834 (2.04)Global Water Resources, Inc. $17,137,000 $114,748,000 5.75good natured Products Inc. $4,642,364 $13,110,987 (5.72)
13Copyright 2020 KeyStone Financial Publishing Corp.
KeyStone’s Small-Cap/Income Stock Report August 2020 TABLE 4
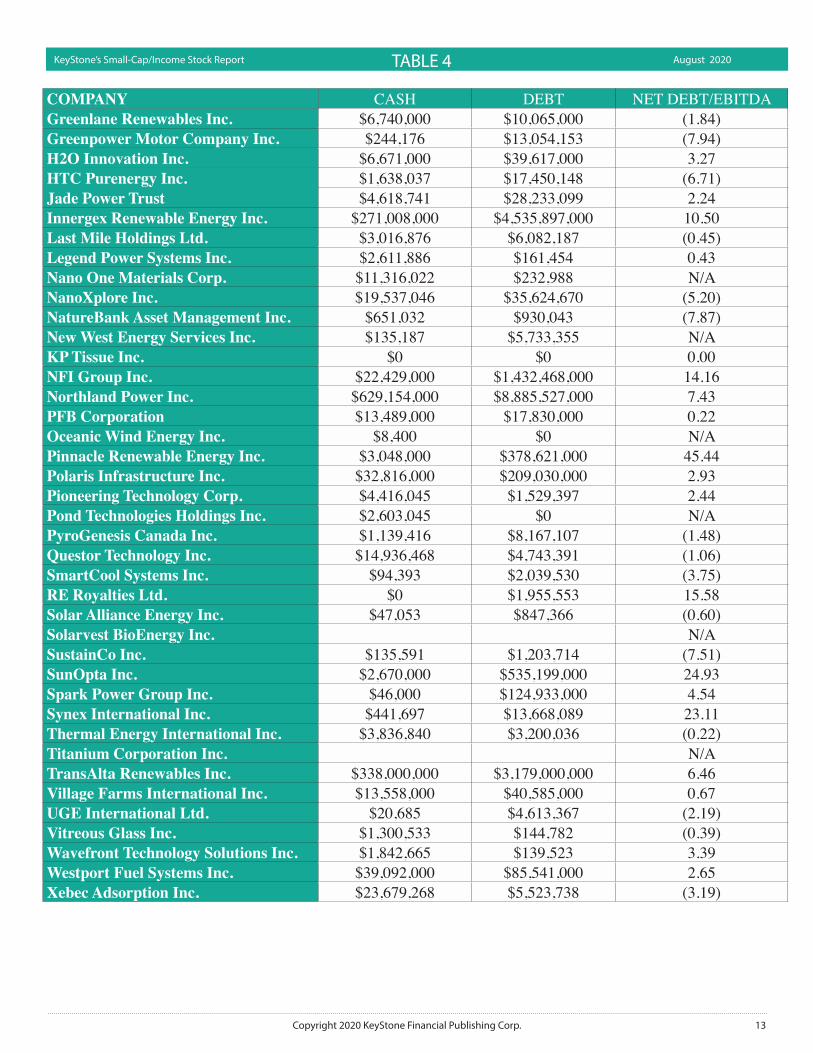
COMPANY CASH DEBT NET DEBT/EBITDAGreenlane Renewables Inc. $6,740,000 $10,065,000 (1.84)Greenpower Motor Company Inc. $244,176 $13,054,153 (7.94)H2O Innovation Inc. $6,671,000 $39,617,000 3.27HTC Purenergy Inc. $1,638,037 $17,450,148 (6.71)Jade Power Trust $4,618,741 $28,233,099 2.24Innergex Renewable Energy Inc. $271,008,000 $4,535,897,000 10.50Last Mile Holdings Ltd. $3,016,876 $6,082,187 (0.45)Legend Power Systems Inc. $2,611,886 $161,454 0.43Nano One Materials Corp. $11,316,022 $232,988 N/ANanoXplore Inc. $19,537,046 $35,624,670 (5.20)NatureBank Asset Management Inc. $651,032 $930,043 (7.87)New West Energy Services Inc. $135,187 $5,733,355 N/AKP Tissue Inc. $0 $0 0.00NFI Group Inc. $22,429,000 $1,432,468,000 14.16Northland Power Inc. $629,154,000 $8,885,527,000 7.43PFB Corporation $13,489,000 $17,830,000 0.22Oceanic Wind Energy Inc. $8,400 $0 N/APinnacle Renewable Energy Inc. $3,048,000 $378,621,000 45.44Polaris Infrastructure Inc. $32,816,000 $209,030,000 2.93Pioneering Technology Corp. $4,416,045 $1,529,397 2.44Pond Technologies Holdings Inc. $2,603,045 $0 N/APyroGenesis Canada Inc. $1,139,416 $8,167,107 (1.48)Questor Technology Inc. $14,936,468 $4,743,391 (1.06)SmartCool Systems Inc. $94,393 $2,039,530 (3.75)RE Royalties Ltd. $0 $1,955,553 15.58Solar Alliance Energy Inc. $47,053 $847,366 (0.60)Solarvest BioEnergy Inc. N/ASustainCo Inc. $135,591 $1,203,714 (7.51)SunOpta Inc. $2,670,000 $535,199,000 24.93Spark Power Group Inc. $46,000 $124,933,000 4.54Synex International Inc. $441,697 $13,668,089 23.11Thermal Energy International Inc. $3,836,840 $3,200,036 (0.22)Titanium Corporation Inc. N/ATransAlta Renewables Inc. $338,000,000 $3,179,000,000 6.46Village Farms International Inc. $13,558,000 $40,585,000 0.67UGE International Ltd. $20,685 $4,613,367 (2.19)Vitreous Glass Inc. $1,300,533 $144,782 (0.39)Wavefront Technology Solutions Inc. $1,842,665 $139,523 3.39Westport Fuel Systems Inc. $39,092,000 $85,541,000 2.65Xebec Adsorption Inc. $23,679,268 $5,523,738 (3.19)
14 Copyright 2020 KeyStone Financial Publishing Corp.
KeyStone’s Small-Cap/Income Stock Report August 2020 TABLE 5
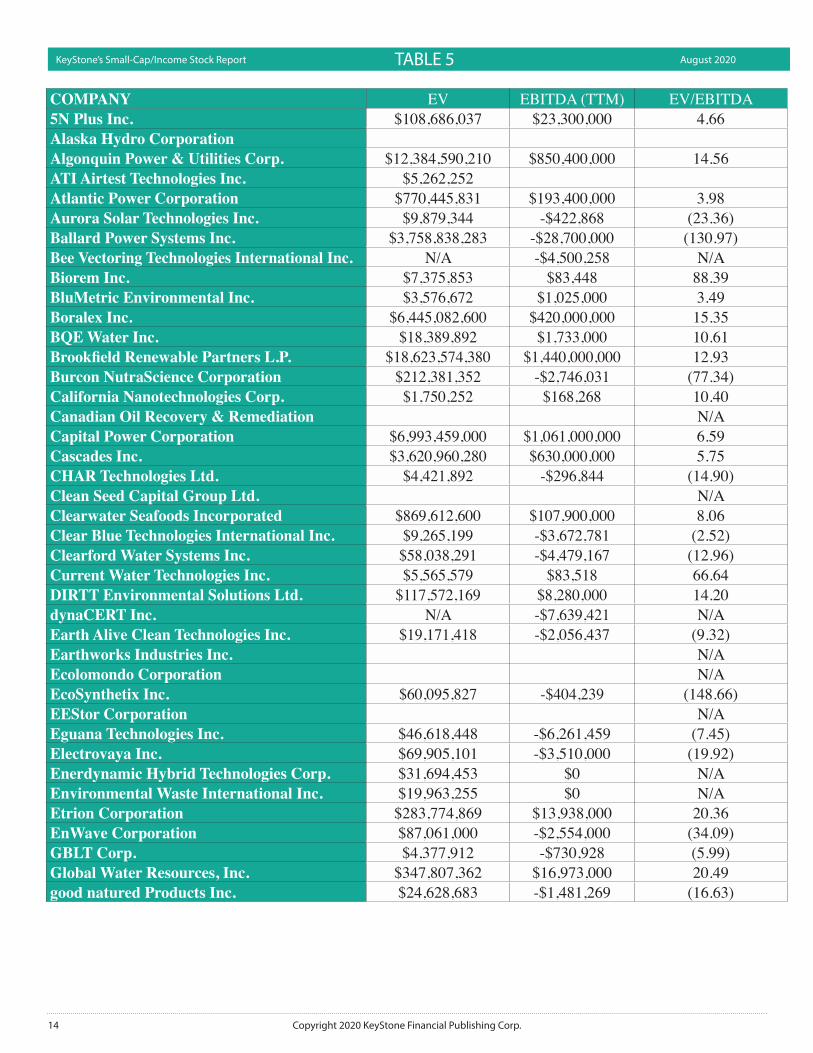
COMPANY EV EBITDA (TTM) EV/EBITDA5N Plus Inc. $108,686,037 $23,300,000 4.66Alaska Hydro CorporationAlgonquin Power & Utilities Corp. $12,384,590,210 $850,400,000 14.56ATI Airtest Technologies Inc. $5,262,252Atlantic Power Corporation $770,445,831 $193,400,000 3.98Aurora Solar Technologies Inc. $9,879,344 -$422,868 (23.36)Ballard Power Systems Inc. $3,758,838,283 -$28,700,000 (130.97)Bee Vectoring Technologies International Inc. N/A -$4,500,258 N/ABiorem Inc. $7,375,853 $83,448 88.39BluMetric Environmental Inc. $3,576,672 $1,025,000 3.49Boralex Inc. $6,445,082,600 $420,000,000 15.35BQE Water Inc. $18,389,892 $1,733,000 10.61Brookfield Renewable Partners L.P. $18,623,574,380 $1,440,000,000 12.93Burcon NutraScience Corporation $212,381,352 -$2,746,031 (77.34)California Nanotechnologies Corp. $1,750,252 $168,268 10.40Canadian Oil Recovery & Remediation N/ACapital Power Corporation $6,993,459,000 $1,061,000,000 6.59Cascades Inc. $3,620,960,280 $630,000,000 5.75CHAR Technologies Ltd. $4,421,892 -$296,844 (14.90)Clean Seed Capital Group Ltd. N/AClearwater Seafoods Incorporated $869,612,600 $107,900,000 8.06Clear Blue Technologies International Inc. $9,265,199 -$3,672,781 (2.52)Clearford Water Systems Inc. $58,038,291 -$4,479,167 (12.96)Current Water Technologies Inc. $5,565,579 $83,518 66.64DIRTT Environmental Solutions Ltd. $117,572,169 $8,280,000 14.20dynaCERT Inc. N/A -$7,639,421 N/AEarth Alive Clean Technologies Inc. $19,171,418 -$2,056,437 (9.32)Earthworks Industries Inc. N/AEcolomondo Corporation N/AEcoSynthetix Inc. $60,095,827 -$404,239 (148.66)EEStor Corporation N/AEguana Technologies Inc. $46,618,448 -$6,261,459 (7.45)Electrovaya Inc. $69,905,101 -$3,510,000 (19.92)Enerdynamic Hybrid Technologies Corp. $31,694,453 $0 N/AEnvironmental Waste International Inc. $19,963,255 $0 N/AEtrion Corporation $283,774,869 $13,938,000 20.36EnWave Corporation $87,061,000 -$2,554,000 (34.09)GBLT Corp. $4,377,912 -$730,928 (5.99)Global Water Resources, Inc. $347,807,362 $16,973,000 20.49good natured Products Inc. $24,628,683 -$1,481,269 (16.63)

15Copyright 2020 KeyStone Financial Publishing Corp.
KeyStone’s Small-Cap/Income Stock Report August 2020 TABLE 5
COMPANY EV EBITDA (TTM) EV/EBITDAGreenlane Renewables Inc. $34,183,750 -$1,803,000 (18.96)Greenpower Motor Company Inc. $273,413,051 -$1,613,708 (169.43)H2O Innovation Inc. $119,043,760 $10,088,000 11.80HTC Purenergy Inc. $25,890,671 -$2,357,203 (10.98)Jade Power Trust $62,921,078 $10,551,401 5.96Innergex Renewable Energy Inc. $8,223,973,300 $406,351,000 20.24Last Mile Holdings Ltd. $9,350,031 -$6,872,540 (1.36)Legend Power Systems Inc. $34,215,568 -$5,744,087 (5.96)Nano One Materials Corp. N/ANanoXplore Inc. $237,646,284 -$3,090,998 (76.88)NatureBank Asset Management Inc. $1,514,071 -$35,432 (42.73)New West Energy Services Inc. $6,476,148 N/AKP Tissue Inc. $172,400,000 0.00NFI Group Inc. $2,257,718,716 $99,600,000 22.67Northland Power Inc. $15,731,697,760 $1,111,832,000 14.15PFB Corporation $89,584,340 $19,762,000 4.53Oceanic Wind Energy Inc. N/APinnacle Renewable Energy Inc. $588,743,400 $8,266,000 71.22Polaris Infrastructure Inc. $345,297,161 $60,090,000 5.75Pioneering Technology Corp. $2,717,552 -$1,182,746 (2.30)Pond Technologies Holdings Inc. N/APyroGenesis Canada Inc. $761,154,291 -$4,740,389 (160.57)Questor Technology Inc. $30,866,423 $9,627,545 3.21SmartCool Systems Inc. N/A -$518,184 N/ARE Royalties Ltd. $38,952,203 $125,554 310.24Solar Alliance Energy Inc. $7,321,383 -$1,329,533 (5.51)Solarvest BioEnergy Inc. N/ASustainCo Inc. $3,434,523 -$142,225 (24.15)SunOpta Inc. $1,130,930,834 $21,364,000 52.94Spark Power Group Inc. $224,139,500 $27,500,000 8.15Synex International Inc. $22,303,342 $572,234 38.98Thermal Energy International Inc. $12,175,436 $2,919,000 4.17Titanium Corporation Inc. N/ATransAlta Renewables Inc. $7,090,082,000 $440,000,000 16.11Village Farms International Inc. $350,105,785 $40,500,000 8.64UGE International Ltd. $12,837,189 -$2,095,579 (6.13)Vitreous Glass Inc. $21,403,809 $2,997,795 7.14Wavefront Technology Solutions Inc. $924,048 -$501,988 (1.84)Westport Fuel Systems Inc. $292,871,453 $17,500,000 16.74Xebec Adsorption Inc. $429,164,390 $5,700,000 75.29

16 Copyright 2020 KeyStone Financial Publishing Corp.
KeyStone’s Small-Cap/Income Stock Report August 2020
KeyStone’s 2020 Canadian Green/Alternative Energy Stock Report - Mini Reports & Recom-mendations
Below we have included mini-reports on both recommendations from current coverage in this sec-tor and notable green, alternative/renewable energy stocks we are monitoring from this report.
The companies include:
• 5N Plus Inc. (VNP: TSX)• Algonquin Power & Utilities Corp. (AQN: TSX)• Atlantic Power Corp. (ATP: TSX)• Biorem Inc. (BRM: TSX-V)• Boralex Inc. (BLX: TSX)• Brookfield Renewable Partners L.P. (BEP.UN: TSX)• Capital Power Corporation (CPX: TSX)• H2O Innovation Inc. (HEO: TSX-V)• Innergex Renewable Energy (INE: TSX)• Jade Power Trust (JPWR.UN: TSX-V)• NanoXplore (GRA: TSX-V)• Northland Power Inc. (NPI: TSX)• PFB Corporation. (PFB: TSX)• Polaris Infrastructure Inc. (PIF: TSX)• Questor Technology Inc. (QST: TSX-V)• RE Royalties Ltd. (RE: TSX-V)• Thermal Energy International Inc. (TMG: TSX-V)• TransAlta Renewables Inc. (RNW: TSX)• Vitreous Glass Inc. (VCI: TSX-V)• Westport Fuel Systems Inc. (WPRT: TSX)• Xebec Adsorption Inc. (XBC: TSX-V)
Mini Reports & Recommendations
17Copyright 2020 KeyStone Financial Publishing Corp.
KeyStone’s Small-Cap/Income Stock Report August 2020
5N Plus Inc. (VNP: TSX)Price: $1.90Rating: Monitor
Company Description: 5N Plus is a leading global producer of engineered materials and specialty chemicals with integrated recycling and re-fining assets to manage the sustainability of its business model. The company manufacture’s products which are used as enabling precursors by its customers in a number of advanced electronics, optoelectronics, pharmaceutical, health, renewable energy and industrial applications.
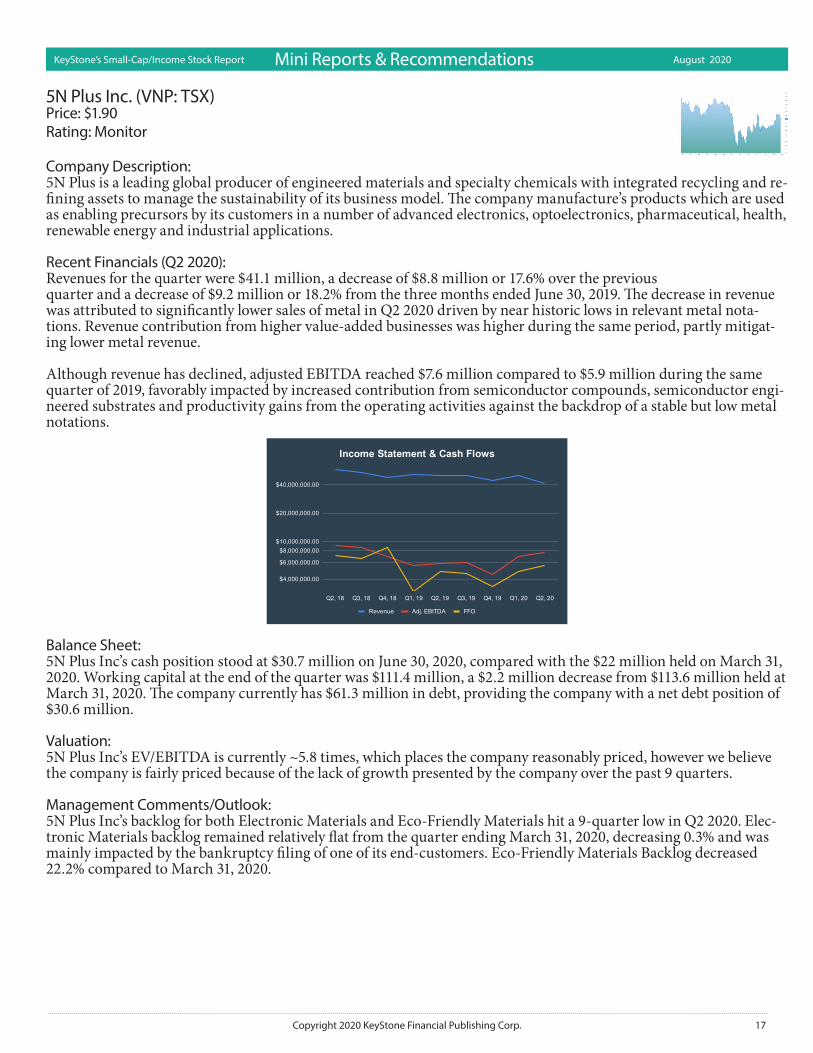
Recent Financials (Q2 2020): Revenues for the quarter were $41.1 million, a decrease of $8.8 million or 17.6% over the previousquarter and a decrease of $9.2 million or 18.2% from the three months ended June 30, 2019. The decrease in revenue was attributed to significantly lower sales of metal in Q2 2020 driven by near historic lows in relevant metal nota-tions. Revenue contribution from higher value‐added businesses was higher during the same period, partly mitigat-ing lower metal revenue.
Although revenue has declined, adjusted EBITDA reached $7.6 million compared to $5.9 million during the same quarter of 2019, favorably impacted by increased contribution from semiconductor compounds, semiconductor engi-neered substrates and productivity gains from the operating activities against the backdrop of a stable but low metal notations.
Balance Sheet: 5N Plus Inc’s cash position stood at $30.7 million on June 30, 2020, compared with the $22 million held on March 31, 2020. Working capital at the end of the quarter was $111.4 million, a $2.2 million decrease from $113.6 million held at March 31, 2020. The company currently has $61.3 million in debt, providing the company with a net debt position of $30.6 million.
Valuation: 5N Plus Inc’s EV/EBITDA is currently ~5.8 times, which places the company reasonably priced, however we believe the company is fairly priced because of the lack of growth presented by the company over the past 9 quarters.
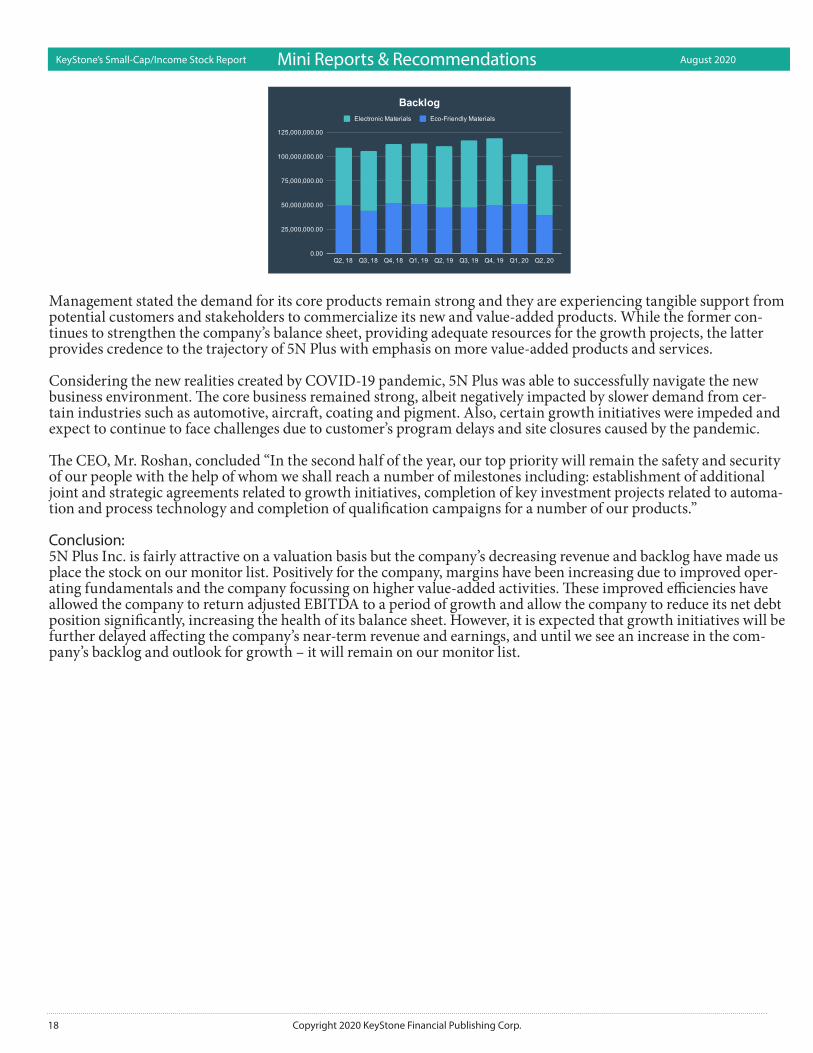
Management Comments/Outlook: 5N Plus Inc’s backlog for both Electronic Materials and Eco-Friendly Materials hit a 9-quarter low in Q2 2020. Elec-tronic Materials backlog remained relatively flat from the quarter ending March 31, 2020, decreasing 0.3% and was mainly impacted by the bankruptcy filing of one of its end‐customers. Eco-Friendly Materials Backlog decreased 22.2% compared to March 31, 2020.
Mini Reports & Recommendations
18 Copyright 2020 KeyStone Financial Publishing Corp.
KeyStone’s Small-Cap/Income Stock Report August 2020
Management stated the demand for its core products remain strong and they are experiencing tangible support from potential customers and stakeholders to commercialize its new and value‐added products. While the former con-tinues to strengthen the company’s balance sheet, providing adequate resources for the growth projects, the latter provides credence to the trajectory of 5N Plus with emphasis on more value‐added products and services.
Considering the new realities created by COVID‐19 pandemic, 5N Plus was able to successfully navigate the new business environment. The core business remained strong, albeit negatively impacted by slower demand from cer-tain industries such as automotive, aircraft, coating and pigment. Also, certain growth initiatives were impeded and expect to continue to face challenges due to customer’s program delays and site closures caused by the pandemic.
The CEO, Mr. Roshan, concluded “In the second half of the year, our top priority will remain the safety and security of our people with the help of whom we shall reach a number of milestones including: establishment of additional joint and strategic agreements related to growth initiatives, completion of key investment projects related to automa-tion and process technology and completion of qualification campaigns for a number of our products.”
Conclusion: 5N Plus Inc. is fairly attractive on a valuation basis but the company’s decreasing revenue and backlog have made us place the stock on our monitor list. Positively for the company, margins have been increasing due to improved oper-ating fundamentals and the company focussing on higher value-added activities. These improved efficiencies have allowed the company to return adjusted EBITDA to a period of growth and allow the company to reduce its net debt position significantly, increasing the health of its balance sheet. However, it is expected that growth initiatives will be further delayed affecting the company’s near-term revenue and earnings, and until we see an increase in the com-pany’s backlog and outlook for growth – it will remain on our monitor list.
Mini Reports & Recommendations
19Copyright 2020 KeyStone Financial Publishing Corp.
KeyStone’s Small-Cap/Income Stock Report August 2020
Algonquin Power & Utilities Corp. (AQN: TSX)Price: $18.18Yield: 4.2%Rating: Short-Term: HOLD/Long-Term: BUY
Company Description:AQN is a diversified regulated utility and renewable power producer with $11 billion in assets. Regulated utilities include natural gas, water, and electricity generation, transmission and distribution utility services to approximately 805,000 connections in the United States and Canada. Renewable power long-term contracted wind, solar and hy-droelectric generating facilities representing over 2 GW of installed capacity and more than 1.4 GW of incremental renewable energy capacity under construction.
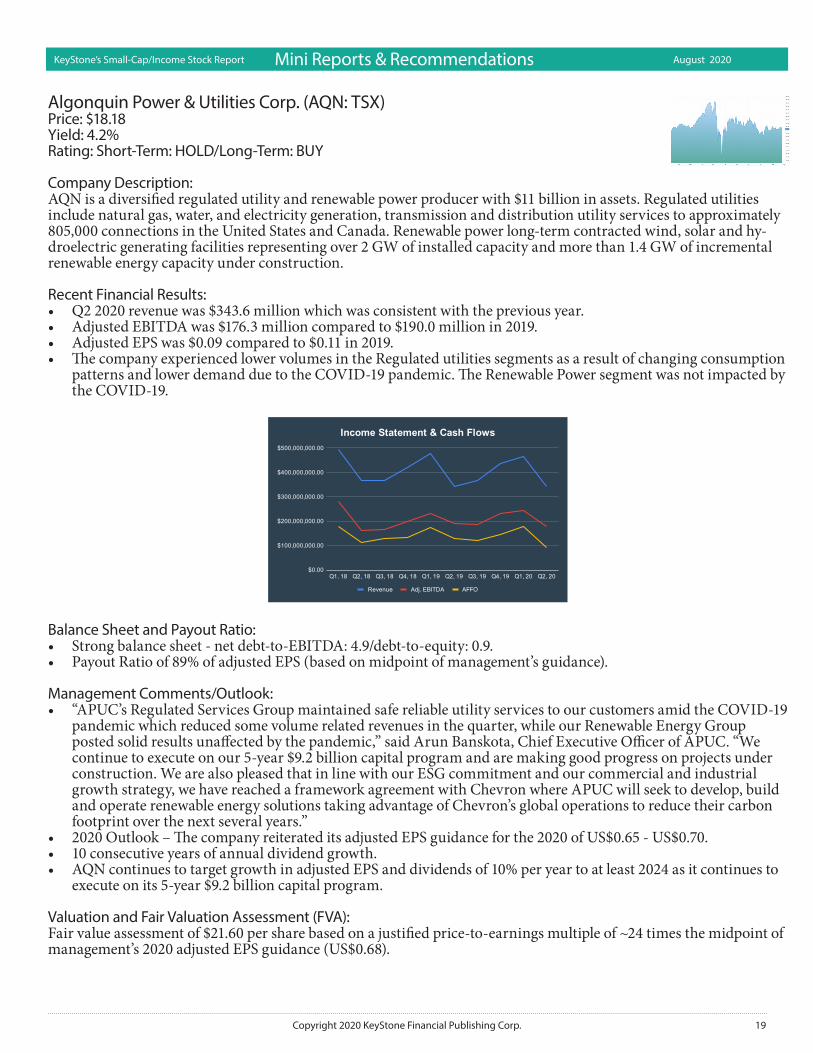
Recent Financial Results:• Q2 2020 revenue was $343.6 million which was consistent with the previous year. • Adjusted EBITDA was $176.3 million compared to $190.0 million in 2019. • Adjusted EPS was $0.09 compared to $0.11 in 2019.• The company experienced lower volumes in the Regulated utilities segments as a result of changing consumption
patterns and lower demand due to the COVID-19 pandemic. The Renewable Power segment was not impacted by the COVID-19.
Balance Sheet and Payout Ratio:• Strong balance sheet - net debt-to-EBITDA: 4.9/debt-to-equity: 0.9.• Payout Ratio of 89% of adjusted EPS (based on midpoint of management’s guidance).
Management Comments/Outlook:• “APUC’s Regulated Services Group maintained safe reliable utility services to our customers amid the COVID-19
pandemic which reduced some volume related revenues in the quarter, while our Renewable Energy Group posted solid results unaffected by the pandemic,” said Arun Banskota, Chief Executive Officer of APUC. “We continue to execute on our 5-year $9.2 billion capital program and are making good progress on projects under construction. We are also pleased that in line with our ESG commitment and our commercial and industrial growth strategy, we have reached a framework agreement with Chevron where APUC will seek to develop, build and operate renewable energy solutions taking advantage of Chevron’s global operations to reduce their carbon footprint over the next several years.”
• 2020 Outlook – The company reiterated its adjusted EPS guidance for the 2020 of US$0.65 - US$0.70. • 10 consecutive years of annual dividend growth.• AQN continues to target growth in adjusted EPS and dividends of 10% per year to at least 2024 as it continues to
execute on its 5-year $9.2 billion capital program.
Valuation and Fair Valuation Assessment (FVA):Fair value assessment of $21.60 per share based on a justified price-to-earnings multiple of ~24 times the midpoint of management’s 2020 adjusted EPS guidance (US$0.68).
Mini Reports & Recommendations

20 Copyright 2020 KeyStone Financial Publishing Corp.
KeyStone’s Small-Cap/Income Stock Report August 2020
Conclusion:AQN trades at what we consider to be a premium valuation (not cheap) but the company does offer investors an at-tractive and growing stream of dividend income that is supported by stable cash flow and a reasonably strong balance sheet and payout ratio. Income investors have limited options in the current environment with long-term govern-ment bond yields well under 1%. Relatively stable, dividend growth stocks like AQN offer an alternative (albeit higher risk) to low yielding bonds. The renewable power and ESG segments continue to garner positive attention from the investment community. The company’s strategy is to execute on its 5-year, US$9.2 billion capital investment program which is expected to support dividend growth of 10% annually to at least 2024. We continue to view AQN as a solid dividend growth opportunity for investors with a minimum time horizon of 5+ years.
Mini Reports & Recommendations
21Copyright 2020 KeyStone Financial Publishing Corp.
KeyStone’s Small-Cap/Income Stock Report August 2020
Atlantic Power Corp. (ATP: TSX) Price: $2.80Rating: Monitor
Company Description: Atlantic Power is an independent power producer that owns power generation assets in eleven states in the United States and two provinces in Canada. Its power generation projects sell electricity to utilities and other large customers predominantly under long-term PPAs. Atlantic Power’s portfolio consists of twenty-three operating projects with an aggregate electric generating capacity of approximately 1,803 megawatts (“MW”). Eighteen of the projects are majori-ty-owned by the company.
A breakdown of the company’s power generation is as follows:
Fuel Type Total MW % of total produc-tion
Natural Gas 1,091 60.5%Biomass 321 17.8%
Coal 262 14.5%Hydro 129 7.2%
1,803 100%
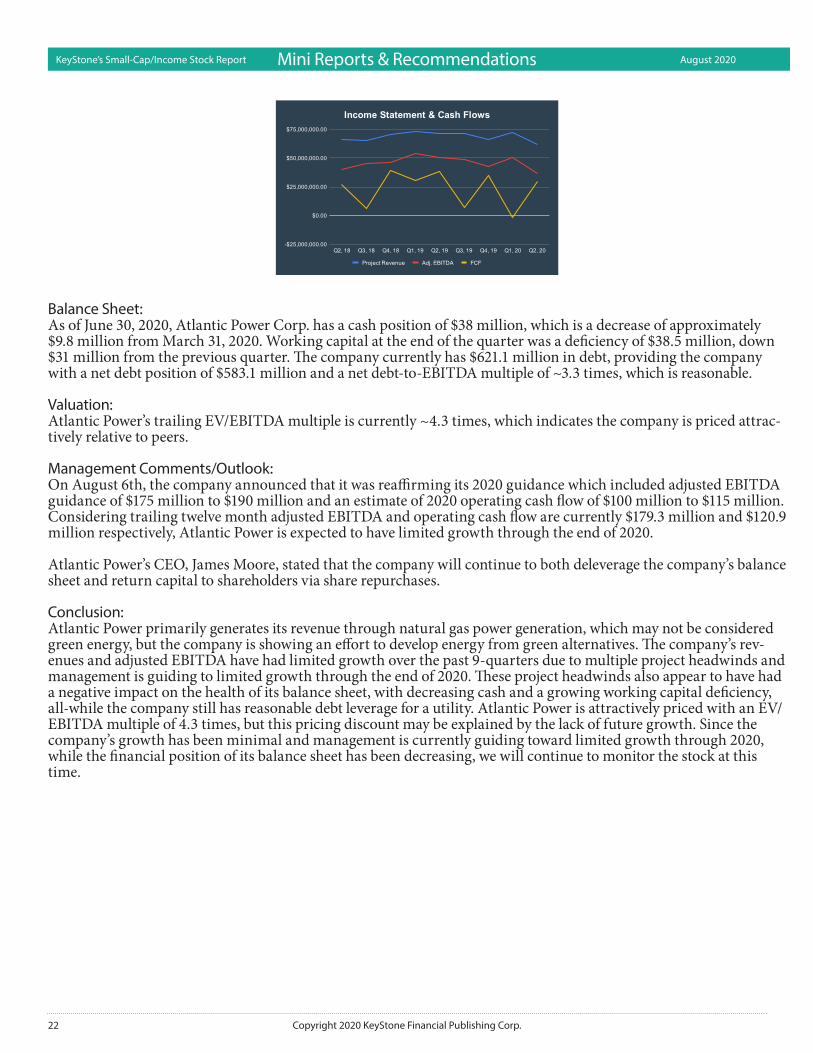
Recent Financials (Q2 2020): Project revenue decreased by 12.6% or $9.0 million to $62.3 million in the three months ended June 30, 2020, from $71.3 million in the three months ended June 30, 2019. The primary drivers of the decrease are as follows:• Curtis Palmer – lower water flows resulted in a decrease in project revenue of $5.7 million from the comparable
2019 period.• Cadillac – the project was non-operational following the fire in September 2019, resulting in a $4.2 million de-
crease in energy and capacity revenue. The project has resumed in late July. • Oxnard – the project had a decrease in project revenue of $2.8 million due to an extended outage in preparation
for the new RMR agreement.• Williams Lake – the project has been curtailed since April 2020 in accordance with the Energy Purchase Agree-
ment with BC Hydro that became effective in October 2019. This resulted in a $2.2 million decrease in project revenue from the comparable 2019 period.
• Morris – there was a $1.7 million decrease in project revenue at our Morris project due to lower fuel index prices than in 2019.
These decreases in project revenue were partially offset by increases in project revenue resulting from:• Allendale and Dorchester – the Allendale and Dorchester projects contributed $5.9 million of revenue in the three months ended June 30, 2020. The projects were purchased in July 2019 and therefore had no impact on revenue in the comparative 2019 period.• Kenilworth – increased steam revenue of $1.0 million from the comparable 2019 period.
Along with a decrease in revenue, adjusted EBITDA contracted by 27.8% or $14.1 million to $36.7 million from Q2 2019.
Mini Reports & Recommendations
22 Copyright 2020 KeyStone Financial Publishing Corp.
KeyStone’s Small-Cap/Income Stock Report August 2020
Balance Sheet: As of June 30, 2020, Atlantic Power Corp. has a cash position of $38 million, which is a decrease of approximately $9.8 million from March 31, 2020. Working capital at the end of the quarter was a deficiency of $38.5 million, down $31 million from the previous quarter. The company currently has $621.1 million in debt, providing the company with a net debt position of $583.1 million and a net debt-to-EBITDA multiple of ~3.3 times, which is reasonable.
Valuation: Atlantic Power’s trailing EV/EBITDA multiple is currently ~4.3 times, which indicates the company is priced attrac-tively relative to peers.
Management Comments/Outlook: On August 6th, the company announced that it was reaffirming its 2020 guidance which included adjusted EBITDA guidance of $175 million to $190 million and an estimate of 2020 operating cash flow of $100 million to $115 million. Considering trailing twelve month adjusted EBITDA and operating cash flow are currently $179.3 million and $120.9 million respectively, Atlantic Power is expected to have limited growth through the end of 2020.
Atlantic Power’s CEO, James Moore, stated that the company will continue to both deleverage the company’s balance sheet and return capital to shareholders via share repurchases.
Conclusion: Atlantic Power primarily generates its revenue through natural gas power generation, which may not be considered green energy, but the company is showing an effort to develop energy from green alternatives. The company’s rev-enues and adjusted EBITDA have had limited growth over the past 9-quarters due to multiple project headwinds and management is guiding to limited growth through the end of 2020. These project headwinds also appear to have had a negative impact on the health of its balance sheet, with decreasing cash and a growing working capital deficiency, all-while the company still has reasonable debt leverage for a utility. Atlantic Power is attractively priced with an EV/EBITDA multiple of 4.3 times, but this pricing discount may be explained by the lack of future growth. Since the company’s growth has been minimal and management is currently guiding toward limited growth through 2020, while the financial position of its balance sheet has been decreasing, we will continue to monitor the stock at this time.
Mini Reports & Recommendations

23Copyright 2020 KeyStone Financial Publishing Corp.
KeyStone’s Small-Cap/Income Stock Report August 2020
Biorem Inc. (BRM: TSX-V) Price: $0.35Rating: Monitor
Company Description: Biorem is a clean technology company that designs, manufactures, and distributes acomprehensive line of high-efficiency emissions control systems used to eliminate odors, volatileorganic compounds (VOCs) and hazardous air pollutants (HAPs). Biorem also offers BiogasConditioning technologies specializing in biological treatment of hydrogen sulfide. The company’s core market is the North American municipal odour control market with international distribution established in China, Middle East, Americas and South Africa as well as opportunistically in other jurisdictions. Project delivery mix varies from quarter-to-quarter but from the data it is evident that Biorem relies heavily on the USA (primary) and Canada. The project mix in the current backlog is consistent with this geographic mix.
Recent Financials: Biorem’s revenues for the second quarter were $5.9 million, a 14% decrease over the previous quarter and on par with the $5.9 million of revenues reported in the same quarter in 2019. Year-to-date revenues totalled $12.9 million, a 22% increase over the $10.0 million reported for the first six months of 2019. The increase in revenues for the first six months of 2020 was due to a $30 million order backlog at the beginning of the year compared to a $22 million order backlog at the beginning of 2019. EBITDA for the quarter was $504,000 compared to $295,000 of EBITDA in the second quarter of 2019. Net earnings for the quarter were $338,000, with year-to-date earnings totalling $801,000 compared to net earnings of $139,000 for the first half of 2019.
Balance Sheet: Biorem’s cash position stood at $8.0 million on June 30, 2020, compared with the $6.5 million held on December 31, 2019. Working capital on June 30, 2020, was $9.7 million an increase from $8.5 million held at December 31, 2019, and up from $9.2 million at March 31, 2019. There is no long-term debt.
Valuation: Biorem’s EV/EBITDA is high at present as the company is coming off a weaker 2019. We expect this number would have significantly improved in 2020 had COVID-19 not hit and could improve moving forward as we saw in Q2 2020.
Management Comments/Outlook: Bookings in the second quarter were $7.7 million, $2.2 million higher than the prior quarter and $4.4 million above the second quarter 2019 bookings. The higher bookings in the quarter reflect the increased bidding activity of the company over the past 12 months and are also due to the timing of the receipt of orders which can fluctuate signifi-cantly by quarter. Year-to-date bookings total $13.2 million compared to $12.7 million of orders booked in the first half of 2019. The orders booked during the quarter were primarily from the company’s core markets in North Ameri-ca. Biorem’s bidding activity during the quarter and subsequent to the quarter continues to be robust.
The order backlog is as follows:
Order Backlog June 2020 March 2020 June 2019$30,900,000 $31,000,000 $22,460,000
Due to customer scheduling, Biorem cannot provide precise guidance as to the quarters when the Backlog will be converted into revenue, however management’s current estimate is that most of the Backlog will be converted into revenue over the next 12 months.
Management stated Biorem continues to have a large sales pipeline of open opportunities that the company expects to bid in the next twelve months. This continuing positive trend is a reflection of municipalities selecting a reliable option for odor control. With urban encroachment on infrastructure posing challenges to the operation of wastewa-ter facilities; safe, efficient solutions with small carbon footprints are being chosen for those high-profile applications. Biorem’s engineered media and innovative designs are well positioned to take advantage of these needs.
Mini Reports & Recommendations

24 Copyright 2020 KeyStone Financial Publishing Corp.
KeyStone’s Small-Cap/Income Stock Report August 2020
Management does not expect any of the existing orders to be canceled and expects to win bids submitted in the same ratio that they historically have. However, it is more than likely that projects will be delayed affecting the company’s near-term revenue and earnings. Given the uncertainty surrounding the COVID-19 pandemic and the efforts to contain it is not possible at this time to provide any guidance on short or medium-term outlook.
Conclusion: 2018 was a strong year for Biorem with $24 million in sales, solid growth over 2017 and significant growth over 2016. The company posted solid profitability and appeared to be on a solid footing for 2019. Biorem’s core North American business delivered solid, but not growth results in 2019, with $19 million in revenue and positive EBITDA. However, the company’s business in China generated $1.6 million in revenue and a negative EBITDA. Collection activities in mainland China have been disrupted, and out of caution, the company recorded a significant valuation provi-sion against accounts receivable in China at December 31, 2019, resulting in the negative EBITDA in China and the reported consolidated loss of $1M for the 2019 year. Heading into 2020, Biorem’s cash position, contracts in hand and working capital puts the company in a strong position going into 2020. In fact, the company posted strong growth in Q1 2020 and better EBITDA in Q2 2020. However, given the COVID-19 related shut-down, it is more than likely that projects will be delayed affecting the company’s near-term revenue and earnings.
Mid and longer term, as governments around the world look to fiscal stimulus strategies to revive stagnant econo-mies, we expect large amounts of funds to be made available for critical infrastructure projects. We expect Biorem is positioned to be a benefactor of this spending.
We see growth potential and with a strong balance sheet Biorem is well positioned to survive and potentially thrive as spending increases and the economy recovers. Profitability has been sporadic however, as long as sales cycles can cause revenue fluctuations period-over-period and since operating expenses are largely based on anticipated revenue trends and a significant portion of expenses are, and will continue to be, fixed, any delay in generating or recognizing revenues can negatively impact profitability on contracts and the business overall. We are monitoring the business as there may be an opportunity in a further sell off if near-term results are affected, but it will only be for higher risk investors given the historically lump nature of the contract business.
Mini Reports & Recommendations

25Copyright 2020 KeyStone Financial Publishing Corp.
KeyStone’s Small-Cap/Income Stock Report August 2020
Boralex Inc. (BLX: TSX)Price: $33.19Yield: 2.0%Rating: Monitor
Company Description:Boralex develops, builds and operates renewable energy power facilities in Canada, France, the United Kingdom and the United States. The company currently has installed capacity of 2,040 MW consisting of wind, solar, hydro and thermal power.
Recent Financials:Q2 2020 combined EBITDA increased 4% to $107 million. Operating cash flow declined -14.2% to $0.53 per share in the second quarter.
Balance Sheet:• High leverage ratios - net debt-to-EBITDA: 7.6/debt-to-equity: 4.1.• Payout Ratio of 19% of trailing 12-month operating cash flow.
Valuation:BLX trades at a price-to-free cash flow valuation of ~10 times based on trailing 12-month operating cash flow of $3.49 per share.
Management Comments/Outlook:• Regarding the Corporation’s outlook, Mr. Lemaire noted that “we’re actively pursuing the development of our
project pipeline, which grew by 103 MW during the quarter, and submitting our projects to calls for tenders in France and New York State. We see strong potential in these two target markets given the public statements made by various levels of government about structuring recovery plans which are based on the accelerated development of renewable energy. We’re also counting on our strong financial position to take advantage of opportunities for accretive acquisitions or partnerships that could arise in the coming months.”
• Financial objectives for 2023:• Discretionary cash flows: Generate discretionary cash flows of $140 million to $150 million in 2023 which will
represent annual compound growth of about 20% for the 2018-2023 period.• Dividend: Pay an ordinary dividend equivalent to a dividend payout ratio of 40% to 60% of discretionary cash
flows.• Installed capacity: Develop a portfolio of energy assets to achieve a gross installed capacity managed by the
corporation of over 2,800 MW in 2023.• The corporation has a portfolio of projects at various stages of development, based on clearly defined criteria, for
a total of 2,593 MW and a Growth Path of 312 MW. These projects put the corporation in a very good position to reach its target capacity of 2,800 MW in 2023.
• 97% of Boralex’s production is under contract with well-defined conditions, so the corporation will continue to generate expected cash flows.
Mini Reports & Recommendations

26 Copyright 2020 KeyStone Financial Publishing Corp.
KeyStone’s Small-Cap/Income Stock Report August 2020
Conclusion: BLX has reported strong financial performance resulting from the development of its renewable power pipeline. The company’s 5-year target (from 2018 to 2023) is for 20% annual compound growth in discretionary (free) cash flow. The balance sheet does have relatively high debt leverage (a risk that is partially mitigated by the contracted nature of the company’s cash flow).
Mini Reports & Recommendations
27Copyright 2020 KeyStone Financial Publishing Corp.
KeyStone’s Small-Cap/Income Stock Report August 2020
Brookfield Renewable Partners L.P. (BEP.UN: TSX)Price: $62.50Yield: 4.6%Rating: Monitor
Company Description:Brookfield Renewable operates one of the world’s largest publicly traded, pure-play renewable power platforms. The company’s portfolio consists of hydroelectric, wind, solar and storage facilities in North America, South America, Europe and Asia, and totals over 19,000 megawatts of installed capacity and a 15,000-megawatt development pipe-line.
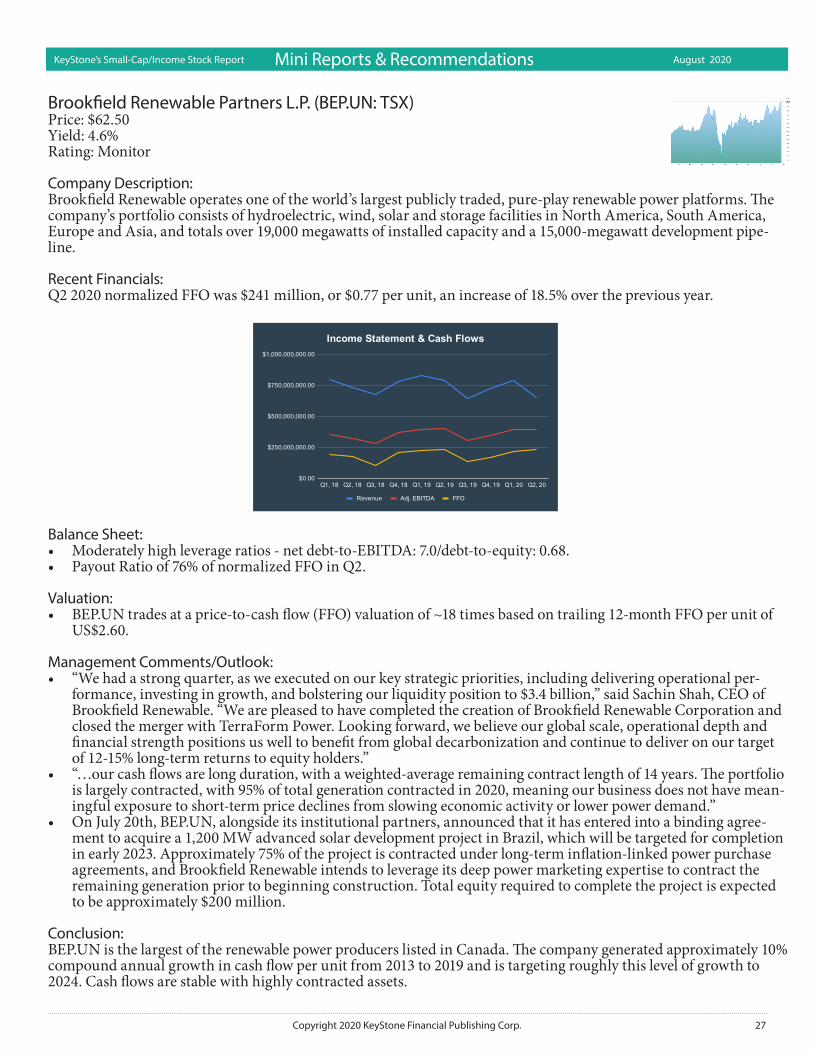
Recent Financials:Q2 2020 normalized FFO was $241 million, or $0.77 per unit, an increase of 18.5% over the previous year.
Balance Sheet:• Moderately high leverage ratios - net debt-to-EBITDA: 7.0/debt-to-equity: 0.68.• Payout Ratio of 76% of normalized FFO in Q2.
Valuation:• BEP.UN trades at a price-to-cash flow (FFO) valuation of ~18 times based on trailing 12-month FFO per unit of
US$2.60.
Management Comments/Outlook:• “We had a strong quarter, as we executed on our key strategic priorities, including delivering operational per-
formance, investing in growth, and bolstering our liquidity position to $3.4 billion,” said Sachin Shah, CEO of Brookfield Renewable. “We are pleased to have completed the creation of Brookfield Renewable Corporation and closed the merger with TerraForm Power. Looking forward, we believe our global scale, operational depth and financial strength positions us well to benefit from global decarbonization and continue to deliver on our target of 12-15% long-term returns to equity holders.”
• “…our cash flows are long duration, with a weighted-average remaining contract length of 14 years. The portfolio is largely contracted, with 95% of total generation contracted in 2020, meaning our business does not have mean-ingful exposure to short-term price declines from slowing economic activity or lower power demand.”
• On July 20th, BEP.UN, alongside its institutional partners, announced that it has entered into a binding agree-ment to acquire a 1,200 MW advanced solar development project in Brazil, which will be targeted for completion in early 2023. Approximately 75% of the project is contracted under long-term inflation-linked power purchase agreements, and Brookfield Renewable intends to leverage its deep power marketing expertise to contract the remaining generation prior to beginning construction. Total equity required to complete the project is expected to be approximately $200 million.
Conclusion: BEP.UN is the largest of the renewable power producers listed in Canada. The company generated approximately 10% compound annual growth in cash flow per unit from 2013 to 2019 and is targeting roughly this level of growth to 2024. Cash flows are stable with highly contracted assets.
Mini Reports & Recommendations

28 Copyright 2020 KeyStone Financial Publishing Corp.
KeyStone’s Small-Cap/Income Stock Report August 2020
Capital Power Corporation (CPX: TSX)Price: $29.27Yield: 6.5%Rating: BUY
Company Description:Capital Power (CPX) is a growth-oriented North American power producer headquartered in Edmonton, Alberta. The company develops, acquires, owns, and operates power generation facilities using a variety of energy sources (natural gas, renewables and coal). Capital Power owns approximately 6,400 megawatts (MW) of power generation capacity at 26 facilities across North America. Approximately 800 MW of owned generation capacity is in advanced development in Alberta and Illinois. The company is targeting 50% renewable power and 50% natural gas by 2030.
Recent Financials:Q2 2020 adjusted EBITDA was $217 million, up 17% year-over-year, largely driven by the acquisition of Goreway and the addition of Whitla Wind 1. Adjusted funds from operations (AFFO) were $97 million in the first quarter of 2020, an increase of 14%, and AFFO per share was $0.92, an increase of 12%.
Balance Sheet:• Strong balance sheet - net debt-to-EBITDA: ~4.0/debt-to-equity: 1.2.• Payout Ratio of 41% of expected 2020 AFFO; long-term AFFO payout ratio target is 45-55%.
Valuation:• Price-to-free cash flow (AFFO) valuation of 5.6 times based on AFFO per share of $4.98 (midpoint of manage-
ment’s 2020 guidance).• Fair value assessment of $39.84 per share based on a justified price-to-AFFO multiple of 8 times.
Management Comments/Outlook:• “Capital Power’s financial results in the second quarter of 2020 were in line with management’s expectations,”
said Brian Vaasjo, President and CEO of Capital Power. “We continue to see minimal impact on our cash flow generation from COVID-19 given the strong operating performance of our facilities combined with a highly contracted and diversified portfolio of generation assets. Our Alberta merchant exposure for the balance of 2020 is significantly hedged and based on our forecast for the remainder of the year, we are on track to deliver AFFO near the midpoint and adjusted EBITDA above the midpoint of our $500 million to $550 million and $935 mil-lion to $985 million annual guidance ranges for 2020, respectively.”
• Increased the common share dividend by 6.8% to $2.05 per year representing the seventh consecutive annual increase. The forecasted payout ratio is below the company’s long-term target of 45% to 55% of AFFO.
• Proceeding with the Strathmore Solar project that will add 40.5 megawatts in early 2022.• Proceeding with the third phase of the Whitla Wind facility that will add 54 megawatts in late 2021.
Conclusion: CPX has come under pressure during the pandemic due its exposure to Alberta and 21% of its power production being non-contracted. The company continues to be fundamentally strong with 79% of production contracted, a healthy balance sheet and avenues for growth over the next several years. At the current price, we view CPX attrac-tively valued and we have no near-term concerns regarding the sustainability of the dividend (which the company
Mini Reports & Recommendations

29Copyright 2020 KeyStone Financial Publishing Corp.
KeyStone’s Small-Cap/Income Stock Report August 2020
expects to continue to grow over at least the next 3 years). The strategy is to continue to grow by acquisition and development, and to transition to 50% renewable power/50% natural gas by 2030. Continued successful execution of this strategy should result in higher cash flow per share and better market valuations (with more production focused on renewables).
Mini Reports & Recommendations
30 Copyright 2020 KeyStone Financial Publishing Corp.
KeyStone’s Small-Cap/Income Stock Report August 2020
H2O Innovation Inc. (HEO: TSX-V) Price: $1.12 Rating: SPEC BUY
Company Description: H2O Innovation designs and provides state-of-the-art, custom-built and integrated water treatment solutions based on membrane filtration technology for municipal, industrial, energy and natural resources end-users. The company’s activities rely on three pillars which are i) water & wastewater projects, and aftermarket services; ii) specialty prod-ucts, including a complete line of specialty chemicals, consumables and specialized products for the water treatment industry; and iii) operation and maintenance services for water and wastewater treatment systems.
Recent Financials: Q3 2020 revenue grew 11.6% over the same period of the previous fiscal year, reaching $36.1 million. Gross profit margin before depreciation and amortization expenses represented 28.7% of total revenues for the third quarter of fiscal year 2020 compared to 23.3 % for the third quarter of previous fiscal year. Adjusted EBITDA reached $3.8 million, or 10.5% of revenues, compared to $2.2 million or 6.8 % of revenues for the comparable quarter of previous fiscal year. Earnings before non-recurring and non-cash impairment of $5.3 million rose significantly to $1.6 million compared to earnings of $0.5 million before no impairment for the comparable quarter of previous fiscal year. Net loss amounted to ($3.1 million) for the third quarter of fiscal year 2020 compared to net earnings of $0.5 million for the comparable quarter of previous fiscal year.
Balance Sheet: H2O’s net debt stood at $18.1 million as t the end of Q2 compared with $9.8 million as at June 30, 2019, representing a $8.3 million increase, or 85.2 %. This increase is mainly attributable to the term loan of $12.0 million contracted to partially financed the acquisition of Genesys on November 15, 2019, offset by the reimbursement of $0.4 million in bank loans. Debt to EBITDA is manageable at 1.87 times. Valuation: H20 currently trades with a trailing 12-month EV/EBITDA in the range of 11.3. Based on an EV/ Expected 2020 EBITDA multiple of 12.5, we see fair value in the range of $1.35-$1.40. If the margin improvement continues to be sustainable and organic growth picks up, there is upside to this target. We will adjust based on management’s 2021 guidance.
Management Comments/Outlook: Despite a slowdown in the company’s Project business, H2O’s combined backlog remains strong and diversified. As at March 31, 2020, the combined backlog of secured contracts between Projects and O&M reached $143.8 million compared to $138.7 million as at March 31, 2019. At present, H2O estimates the combined backlog is in the range of $136.2 million. In light of the COVID-19 crisis, management believes many opportunities will emerge in the coming months and years, notably from H2O’s large distribution network of Specialty Products and O&M business pillar.
Recent News:On July 2, 2020, H2O announced the acquisition of Gulf Utility Service, Inc. (GUS), a company offering complete op-eration, maintenance and management services to water and wastewater infrastructures for different type of clients such as municipalities, municipal utility districts (commonly known as MUD) and public water systems in the State of Texas (United States). The total purchase price amounts to US$2.750 million (CA$3.713 million), equivalent to 5 times GUS’ EBITDA on December 31, 2019. GUS had revenues of approximately US$5.0 million (CA$6.750 million) in revenues and EBITDA of US$0.6 (CA$0.816 million) for the fiscal year ended on December 31, 2019. Management expects that this acquisition will immediately grow EBITDA and be accretive to its earnings.
Conclusion: Since February 2020, the world has been impacted by the unprecedented and evolving COVID-19 pandemic. Being considered as an essential service provider, H2O has been able to maintain its operations and maintenance activi-ties, after-sales services, manufacturing and distribution of specialty chemicals, and design and manufacturing of components for desalination and maple farming equipment. Only the Projects business line was slowed down due to limited access to various construction sites. Q3 2020 marked the company’s highest adjusted EBITDA in a single quarter at $3.8 million, up 71.9 % compared to $2.2 million in Q3 2019. Water will always be essential and operations, pandemic or not, will continue.
Mini Reports & Recommendations

31Copyright 2020 KeyStone Financial Publishing Corp.
KeyStone’s Small-Cap/Income Stock Report August 2020
Recurring revenues were 88% of H20’s total revenues in Q3, notably driven by both the company’s specialty products and by the operation & maintenance of 200 water and wastewater utilities in North America. Additionally, powered by the acquisition of Genesys and the company’s focus to improve profit margins, Q3 gross profit margin increased from 23.3% to 28.7%.
H20 currently trades with a trailing 12-month EV/EBITDA in the range of 11.3. Based on an EV/Expected 2020 EBITDA multiple of 12.5, we see fair value in the range of $1.35-$1.40, roughly 20% higher than its current price. If the margin improvement continues to be sustainable and organic growth picks up, there is upside to this target. We will adjust based on management’s 2021 guidance. Shares are relatively thinly traded and we see no reason to chase the stock. It remains a long-term SPEC BUY in the range of $1.00-$1.15. Use limit orders and be patient. We are look-ing at a holding period of 2-3 years.
Mini Reports & Recommendations
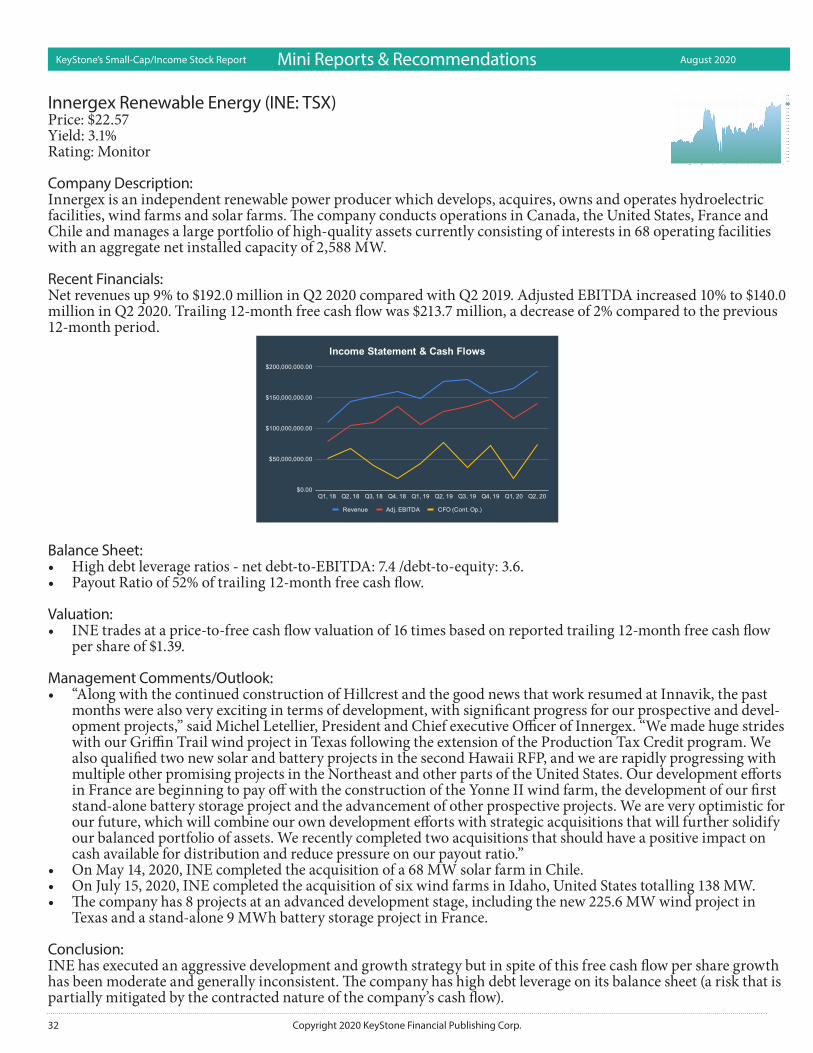
32 Copyright 2020 KeyStone Financial Publishing Corp.
KeyStone’s Small-Cap/Income Stock Report August 2020
Innergex Renewable Energy (INE: TSX)Price: $22.57Yield: 3.1%Rating: Monitor
Company Description:Innergex is an independent renewable power producer which develops, acquires, owns and operates hydroelectric facilities, wind farms and solar farms. The company conducts operations in Canada, the United States, France and Chile and manages a large portfolio of high-quality assets currently consisting of interests in 68 operating facilities with an aggregate net installed capacity of 2,588 MW.
Recent Financials:Net revenues up 9% to $192.0 million in Q2 2020 compared with Q2 2019. Adjusted EBITDA increased 10% to $140.0 million in Q2 2020. Trailing 12-month free cash flow was $213.7 million, a decrease of 2% compared to the previous 12-month period.
Balance Sheet:• High debt leverage ratios - net debt-to-EBITDA: 7.4 /debt-to-equity: 3.6.• Payout Ratio of 52% of trailing 12-month free cash flow.
Valuation:• INE trades at a price-to-free cash flow valuation of 16 times based on reported trailing 12-month free cash flow
per share of $1.39.
Management Comments/Outlook:• “Along with the continued construction of Hillcrest and the good news that work resumed at Innavik, the past
months were also very exciting in terms of development, with significant progress for our prospective and devel-opment projects,” said Michel Letellier, President and Chief executive Officer of Innergex. “We made huge strides with our Griffin Trail wind project in Texas following the extension of the Production Tax Credit program. We also qualified two new solar and battery projects in the second Hawaii RFP, and we are rapidly progressing with multiple other promising projects in the Northeast and other parts of the United States. Our development efforts in France are beginning to pay off with the construction of the Yonne II wind farm, the development of our first stand-alone battery storage project and the advancement of other prospective projects. We are very optimistic for our future, which will combine our own development efforts with strategic acquisitions that will further solidify our balanced portfolio of assets. We recently completed two acquisitions that should have a positive impact on cash available for distribution and reduce pressure on our payout ratio.”
• On May 14, 2020, INE completed the acquisition of a 68 MW solar farm in Chile.• On July 15, 2020, INE completed the acquisition of six wind farms in Idaho, United States totalling 138 MW.• The company has 8 projects at an advanced development stage, including the new 225.6 MW wind project in
Texas and a stand-alone 9 MWh battery storage project in France.
Conclusion: INE has executed an aggressive development and growth strategy but in spite of this free cash flow per share growth has been moderate and generally inconsistent. The company has high debt leverage on its balance sheet (a risk that is partially mitigated by the contracted nature of the company’s cash flow).
Mini Reports & Recommendations
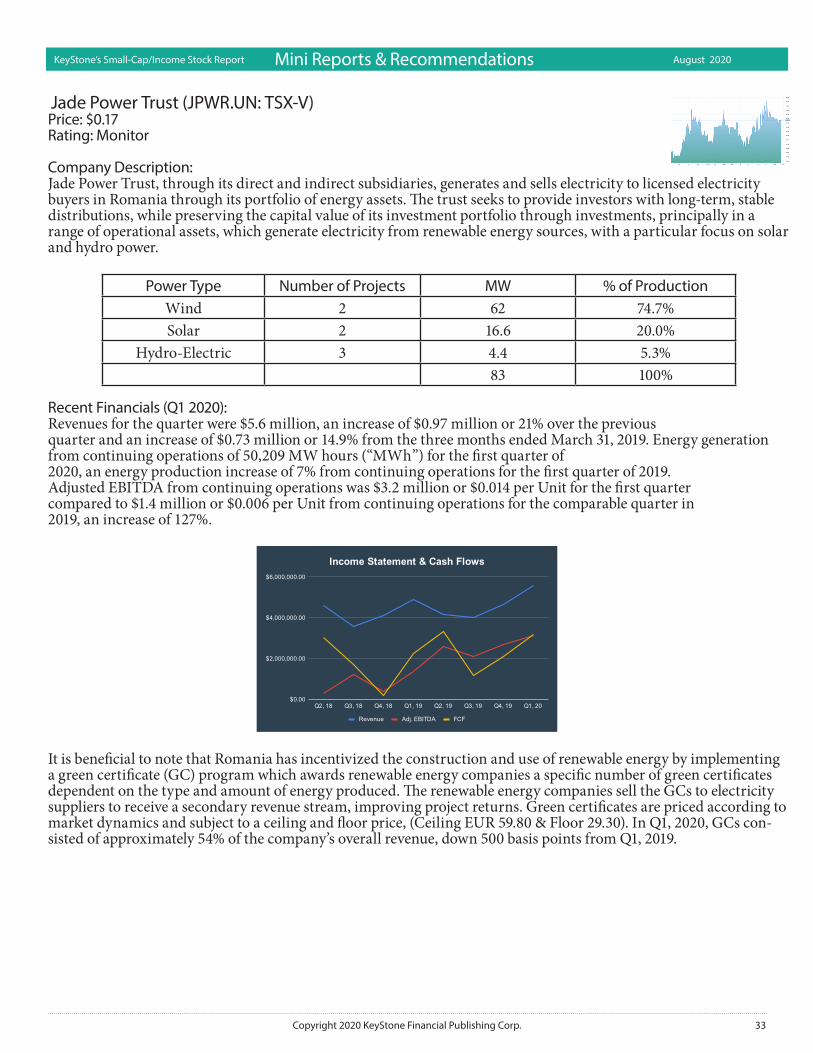
33Copyright 2020 KeyStone Financial Publishing Corp.
KeyStone’s Small-Cap/Income Stock Report August 2020
Jade Power Trust (JPWR.UN: TSX-V) Price: $0.17Rating: Monitor
Company Description: Jade Power Trust, through its direct and indirect subsidiaries, generates and sells electricity to licensed electricity buyers in Romania through its portfolio of energy assets. The trust seeks to provide investors with long-term, stable distributions, while preserving the capital value of its investment portfolio through investments, principally in a range of operational assets, which generate electricity from renewable energy sources, with a particular focus on solar and hydro power.
Power Type Number of Projects MW % of ProductionWind 2 62 74.7%Solar 2 16.6 20.0%
Hydro-Electric 3 4.4 5.3%83 100%
Recent Financials (Q1 2020): Revenues for the quarter were $5.6 million, an increase of $0.97 million or 21% over the previousquarter and an increase of $0.73 million or 14.9% from the three months ended March 31, 2019. Energy generation from continuing operations of 50,209 MW hours (“MWh”) for the first quarter of2020, an energy production increase of 7% from continuing operations for the first quarter of 2019.Adjusted EBITDA from continuing operations was $3.2 million or $0.014 per Unit for the first quartercompared to $1.4 million or $0.006 per Unit from continuing operations for the comparable quarter in2019, an increase of 127%.
It is beneficial to note that Romania has incentivized the construction and use of renewable energy by implementing a green certificate (GC) program which awards renewable energy companies a specific number of green certificates dependent on the type and amount of energy produced. The renewable energy companies sell the GCs to electricity suppliers to receive a secondary revenue stream, improving project returns. Green certificates are priced according to market dynamics and subject to a ceiling and floor price, (Ceiling EUR 59.80 & Floor 29.30). In Q1, 2020, GCs con-sisted of approximately 54% of the company’s overall revenue, down 500 basis points from Q1, 2019.
Mini Reports & Recommendations
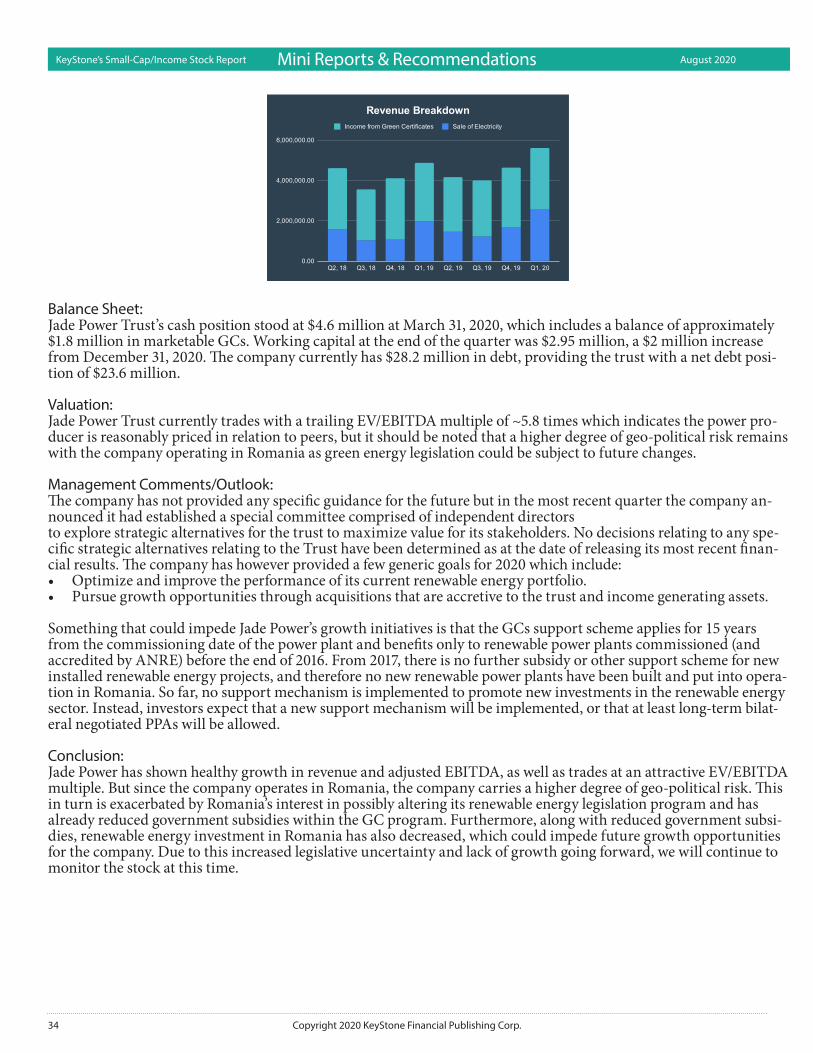
34 Copyright 2020 KeyStone Financial Publishing Corp.
KeyStone’s Small-Cap/Income Stock Report August 2020
Balance Sheet: Jade Power Trust’s cash position stood at $4.6 million at March 31, 2020, which includes a balance of approximately $1.8 million in marketable GCs. Working capital at the end of the quarter was $2.95 million, a $2 million increase from December 31, 2020. The company currently has $28.2 million in debt, providing the trust with a net debt posi-tion of $23.6 million.
Valuation: Jade Power Trust currently trades with a trailing EV/EBITDA multiple of ~5.8 times which indicates the power pro-ducer is reasonably priced in relation to peers, but it should be noted that a higher degree of geo-political risk remains with the company operating in Romania as green energy legislation could be subject to future changes.
Management Comments/Outlook: The company has not provided any specific guidance for the future but in the most recent quarter the company an-nounced it had established a special committee comprised of independent directors to explore strategic alternatives for the trust to maximize value for its stakeholders. No decisions relating to any spe-cific strategic alternatives relating to the Trust have been determined as at the date of releasing its most recent finan-cial results. The company has however provided a few generic goals for 2020 which include: • Optimize and improve the performance of its current renewable energy portfolio.• Pursue growth opportunities through acquisitions that are accretive to the trust and income generating assets.
Something that could impede Jade Power’s growth initiatives is that the GCs support scheme applies for 15 years from the commissioning date of the power plant and benefits only to renewable power plants commissioned (and accredited by ANRE) before the end of 2016. From 2017, there is no further subsidy or other support scheme for new installed renewable energy projects, and therefore no new renewable power plants have been built and put into opera-tion in Romania. So far, no support mechanism is implemented to promote new investments in the renewable energy sector. Instead, investors expect that a new support mechanism will be implemented, or that at least long-term bilat-eral negotiated PPAs will be allowed.
Conclusion: Jade Power has shown healthy growth in revenue and adjusted EBITDA, as well as trades at an attractive EV/EBITDA multiple. But since the company operates in Romania, the company carries a higher degree of geo-political risk. This in turn is exacerbated by Romania’s interest in possibly altering its renewable energy legislation program and has already reduced government subsidies within the GC program. Furthermore, along with reduced government subsi-dies, renewable energy investment in Romania has also decreased, which could impede future growth opportunities for the company. Due to this increased legislative uncertainty and lack of growth going forward, we will continue to monitor the stock at this time.
Mini Reports & Recommendations

35Copyright 2020 KeyStone Financial Publishing Corp.
KeyStone’s Small-Cap/Income Stock Report August 2020
NanoXplore Inc. (GRA: TSX-V) Price: $1.63Rating: Monitor
Company Description: NanoXplore Inc. is a manufacturer and supplier of high-volume graphene powder for use in industrial markets and provides standard and custom graphene-enhanced plastic and composite products to various customers in transpor-tation, packaging, electronics, and other industrial sectors. The company operates 7 production plants in Canada and Switzerland that support graphene production and composite part manufacturing.
Recent Financials (Q3 2020): Revenues for the quarter were $14.9 million, a decrease of $2.9 million or 16.2% over the previousQuarter, a decrease of $5.9 million or 28.3% from the three months ended March 31, 2019. The trucking market is currently undergoing a downturn which has negatively affected the company’s sales since Q2 2020. Combined with the negative impact of the COVID-19 pandemic, transport revenues decreased by $3.7 million for the three-month period ended March 31, 2020, compared to 2019. Moreover, a further decrease in sales is associated with the divesti-ture of Rada Industries ($0.59 million) in April 2019.
For Q3 2020 the company reported an adjusted EBITDA loss of ($0.85) million or ($0.007) per Unit for the first quar-ter compared to a loss of ($1.2) million or ($0.011) per share in Q3 2019.
Balance Sheet: NanoXplore’s cash position was $10.6 million on March 31, 2020, a decrease of approximately $9 million or 46%. After the company reported its financial results on April 3rd, 2020, they completed a private placement for additional gross proceeds of approximately $25 million with the net proceeds being utilized in relation to the use of graphene in lithium ion (Li-ion) batteries, U.S. expansion, debt repayment, expanding its graphene compounding capacity, work-ing capital and general corporate purposes. Including this recent financing, working capital at the end of the quarter was $35.8 million. NanoXplore currently has a debt balance of $32.5 million and a net cash position of $3.1 million.
Valuation: Since NanoXplore has both negative adjusted earnings and negative adjusted EBITDA, we must value the company based on revenue. Which provides the company with a trailing EV/Sales multiple of ~3.1 times, indicating the com-pany is relatively pricey on the valuation spectrum.
Management Comments/Outlook: As a result of the COVID-19 global pandemic, certain company customers idled their manufacturing operations. NanoXplore followed its customers and also temporarily idled most of its manufacturing operations in March. This suspension of manufacturing operations and rapid dissipation of customer demand had a negative impact on the company’s financial results during the second half of March and continued into the second quarter. Although the potential magnitude and duration of the business and economic impacts of COVID-19 are uncertain, a phased restart of the company’s manufacturing facilities and dependent functions has slowly begun in May. The COVID-19 pandemic is expected to have an adverse effect on NanoXplore’s business, results of operations, cash flows and fi-nancial position; however, the full impact cannot be determined at this time, resulting in NanoXplore to provide no
Mini Reports & Recommendations
36 Copyright 2020 KeyStone Financial Publishing Corp.
KeyStone’s Small-Cap/Income Stock Report August 2020
future guidance.
On July 7th, 2020 the company announced the completion of the commissioning of its state of the art 4,000 metric tons/year commercial graphene facility in Montreal.
Conclusion: NanoXplore operates in the graphene industry, which is gaining a lot of attention for the material’s lightweight, strength, flexibility, conductivity and numerous applications. The company currently trades with an EV/Sales multi-ple of ~3.1 times, indicating the stock is expensive, also considering its declining revenues, negative adjusted EBITDA and cash flow from operations. The company does have a healthy balance sheet with a large net cash balance and decreasing debt. Since the outbreak of COVID-19, management has not provided any financial guidance due to the uncertainty of customer demand. Due to the company’s lack of growth, profitability, expensive valuation and uncer-tainty regarding future operations – we will continue to monitor the stock at this time.
Mini Reports & Recommendations
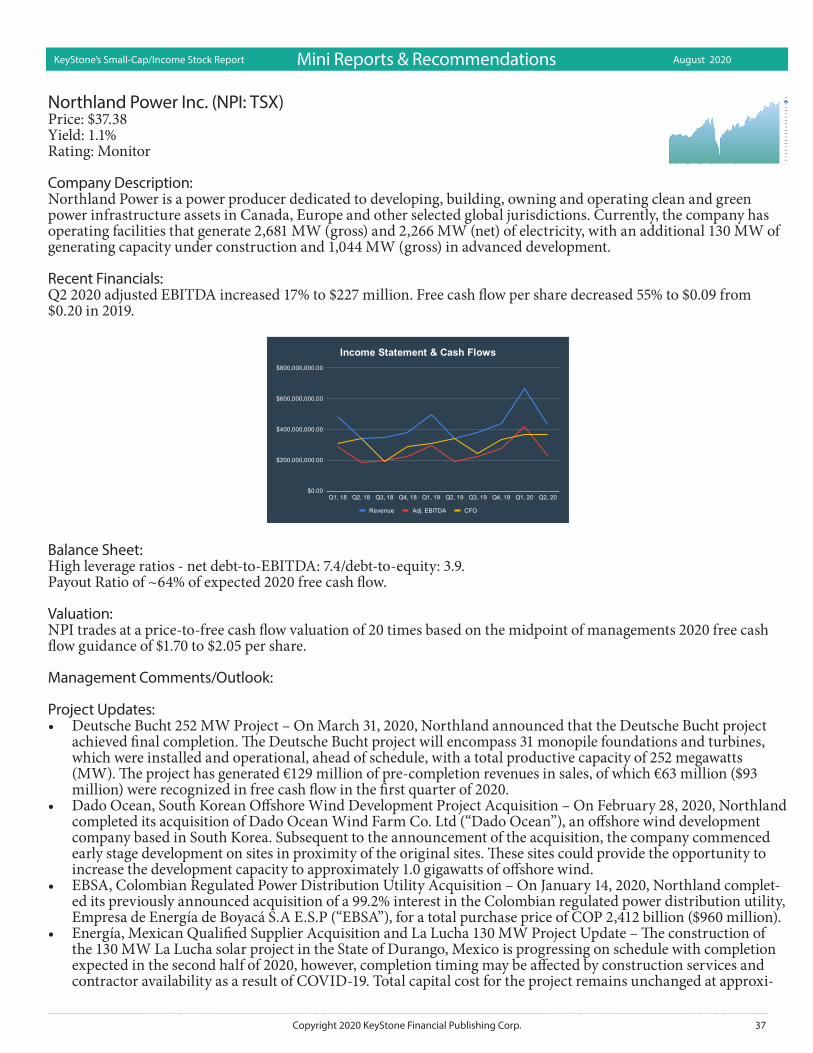
37Copyright 2020 KeyStone Financial Publishing Corp.
KeyStone’s Small-Cap/Income Stock Report August 2020
Northland Power Inc. (NPI: TSX)Price: $37.38Yield: 1.1%Rating: Monitor
Company Description:Northland Power is a power producer dedicated to developing, building, owning and operating clean and green power infrastructure assets in Canada, Europe and other selected global jurisdictions. Currently, the company has operating facilities that generate 2,681 MW (gross) and 2,266 MW (net) of electricity, with an additional 130 MW of generating capacity under construction and 1,044 MW (gross) in advanced development.
Recent Financials:Q2 2020 adjusted EBITDA increased 17% to $227 million. Free cash flow per share decreased 55% to $0.09 from $0.20 in 2019.
Balance Sheet:High leverage ratios - net debt-to-EBITDA: 7.4/debt-to-equity: 3.9.Payout Ratio of ~64% of expected 2020 free cash flow.
Valuation:NPI trades at a price-to-free cash flow valuation of 20 times based on the midpoint of managements 2020 free cash flow guidance of $1.70 to $2.05 per share.
Management Comments/Outlook:
Project Updates:• Deutsche Bucht 252 MW Project – On March 31, 2020, Northland announced that the Deutsche Bucht project
achieved final completion. The Deutsche Bucht project will encompass 31 monopile foundations and turbines, which were installed and operational, ahead of schedule, with a total productive capacity of 252 megawatts (MW). The project has generated €129 million of pre-completion revenues in sales, of which €63 million ($93 million) were recognized in free cash flow in the first quarter of 2020.
• Dado Ocean, South Korean Offshore Wind Development Project Acquisition – On February 28, 2020, Northland completed its acquisition of Dado Ocean Wind Farm Co. Ltd (“Dado Ocean”), an offshore wind development company based in South Korea. Subsequent to the announcement of the acquisition, the company commenced early stage development on sites in proximity of the original sites. These sites could provide the opportunity to increase the development capacity to approximately 1.0 gigawatts of offshore wind.
• EBSA, Colombian Regulated Power Distribution Utility Acquisition – On January 14, 2020, Northland complet-ed its previously announced acquisition of a 99.2% interest in the Colombian regulated power distribution utility, Empresa de Energía de Boyacá S.A E.S.P (“EBSA”), for a total purchase price of COP 2,412 billion ($960 million).
• Energía, Mexican Qualified Supplier Acquisition and La Lucha 130 MW Project Update – The construction of the 130 MW La Lucha solar project in the State of Durango, Mexico is progressing on schedule with completion expected in the second half of 2020, however, completion timing may be affected by construction services and contractor availability as a result of COVID-19. Total capital cost for the project remains unchanged at approxi-
Mini Reports & Recommendations
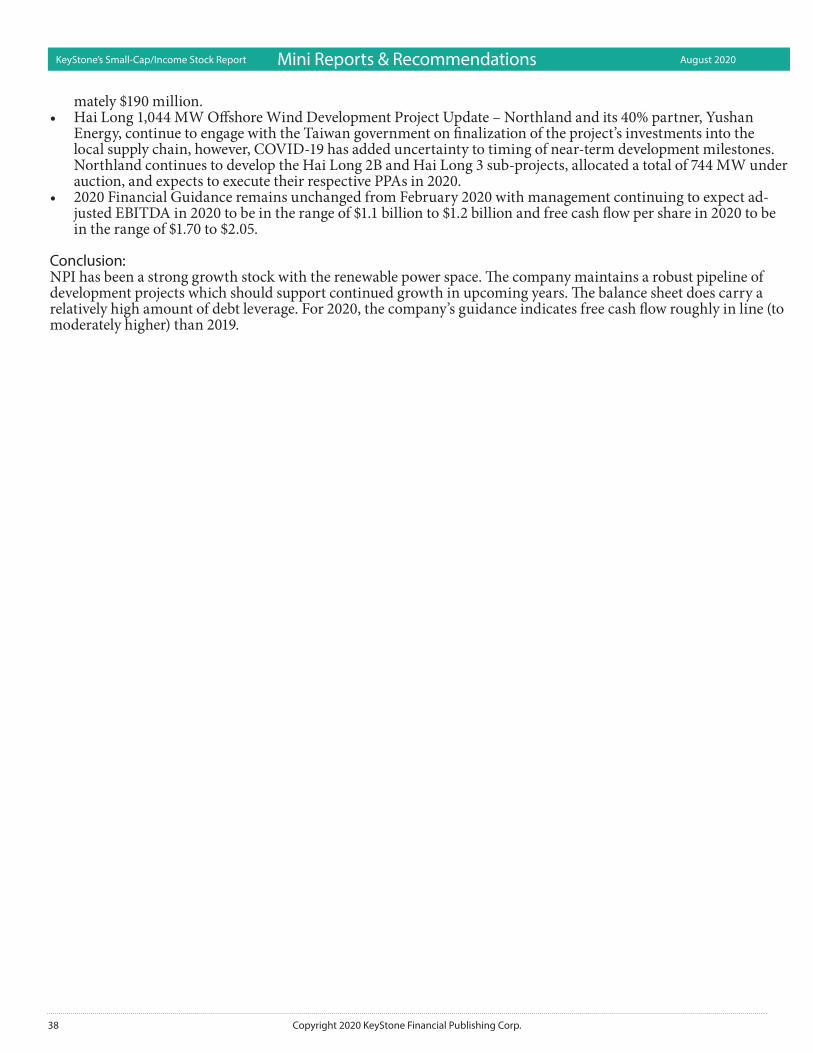
38 Copyright 2020 KeyStone Financial Publishing Corp.
KeyStone’s Small-Cap/Income Stock Report August 2020
mately $190 million. • Hai Long 1,044 MW Offshore Wind Development Project Update – Northland and its 40% partner, Yushan
Energy, continue to engage with the Taiwan government on finalization of the project’s investments into the local supply chain, however, COVID-19 has added uncertainty to timing of near-term development milestones. Northland continues to develop the Hai Long 2B and Hai Long 3 sub-projects, allocated a total of 744 MW under auction, and expects to execute their respective PPAs in 2020.
• 2020 Financial Guidance remains unchanged from February 2020 with management continuing to expect ad-justed EBITDA in 2020 to be in the range of $1.1 billion to $1.2 billion and free cash flow per share in 2020 to be in the range of $1.70 to $2.05.
Conclusion: NPI has been a strong growth stock with the renewable power space. The company maintains a robust pipeline of development projects which should support continued growth in upcoming years. The balance sheet does carry a relatively high amount of debt leverage. For 2020, the company’s guidance indicates free cash flow roughly in line (to moderately higher) than 2019.
Mini Reports & Recommendations
39Copyright 2020 KeyStone Financial Publishing Corp.
KeyStone’s Small-Cap/Income Stock Report August 2020
PFB Corporation. (PFB: TSX) Price: $12.55Rating: Monitor
Company Description: PFB Corporation has two operating subsidiaries, Plasti-Fab Ltd. that operates in Canada and PFB America Corpora-tion that operates in the United States. The Canadian segment primarily derives its revenues from the sale of expand-ed polystyrene (EPS) foam products, which it manufactures at its facilities in Canada. The USA segment primarily derives its revenues from the sale of EPS foam products, customized log and timber structures made at its facilities in the United States, which typically include design and installation services that together provide the basis for a bundled sale of its manufactured products. Both segments develop, manufacture and market insulation building products and technologies based on expanded polystyrene technology; that, when used as components of a building envelope, enable residential and commercial structures to be highly energy-efficient. PFB building products are used in both new and renovation markets in residential, commercial and industrial projects. PFB’s insulating products are enabling building envelope technologies that support Net Near Zero Energy (NZE), Leadership in Energy and Envi-ronmental Design (LEED™) certification and Built Green programs.
Recent Financials: Q2 2020 revenues for the three-month period ended June 30, 2020, declined 11% to $31.5 million compared to $35.42 million in the second quarter of 2019. As a result of lower raw material input costs experienced in Q2 2020, stable product pricing, improved operational efficiencies and management implemented operational expense controls, gross margins improved to 30.2% of sales compared to 26.6% of sales in Q2 2019, an increase of 360 basis points, mitigating the effect of lower sales. PFB reported net income of $3.75 million and basic earnings of $0.56 per share compared to $3.06 million and basic earnings of $0.45 per share, in the comparative three-month period of 2019. Ad-justed EBITDA for the second quarter of 2020 was a record high at $6.28 million compared with adjusted EBITDA of $5.41 million in the second quarter of 2019.
Balance Sheet: PFB’s cash position stood at $22.68 million on June 30, 2020, compared with the $21.05 million held on December 31, 2019. Working capital at the end of the quarter was $29.1 million and long-term debt and lease liabilities total $16.29 million.
Valuation: PFB’s EV/EBITDA is low at just under 4 and the company’s trailing PE is also attractive in range of 6.88.
Management Comments/Outlook: As expected, Q2 sales were adversely impacted by the various North American government and health authority actions intended to slow the spread of the COVID-19 pandemic. Sales were softer in both Canada and USA reporting segments and lower demand was felt in the majority of industries services as delivery schedules were extended and projects delayed. PFB continued uninterrupted operations in all regions with no material disruptions minimizing the potential impact on sales.
Favourable raw material input costs along with stable product pricing, improved operating efficiencies and over-head spending controls resulted in gross margins of 30.2% for Q2 2020 compared to 26.6% for Q2 2019, an increase of 3.6% of sales. We expect this level of gross margin performance to be relatively stable due to pressures within the petrochemical industry that will contribute to styrene monomer pricing stability and continued operational efficien-cies. In addition to the improved gross margins, management implemented cost controls to reduce SG&A expenses contributing to favourable net income and adjusted EBITDA performance for the current quarter and the first six months of the year.
At this time PFB’s order book remains strong and growing as governments ease restrictions,construction activity recovers and government stimulus spending is rolled out. However, as efforts to contain the virus continue, general uncertainty remains. As such, PFB expects its growth trajectory to be interrupted by this health crisis as the company is unable to accurately quantify the impact these events will have on customers’ require-ments. The focus is to remain profitable and generate positive cash flows for the second half of 2020. PFB’s balance sheet is strong with positive working capital and a solid net cash position. Management is confident the company is
Mini Reports & Recommendations

40 Copyright 2020 KeyStone Financial Publishing Corp.
KeyStone’s Small-Cap/Income Stock Report August 2020
well positioned.
Conclusion: PFB’s Q2 2020 results were solid and included record profitability. Valuations are also attractive with the business trading with a trailing EV/EBITDA multiple of just under 4. Add in a strong balance sheet and a solid 3.2% divi-dend yield and PFB checks off a good deal of our boxes. The business is both seasonal and cyclical in nature and can fluctuate significantly within the business cycle. With the current uncertainty on “Main Street”, we expect near-term declines, and this was already evident in the Q2 revenue decrease. Management has stated they expect growth to be interrupted by this health crisis. The extent or length of the decline is unknown. We see PFB as a well-run business with cyclical business cycle risk. The current trailing fundamentals are attractive, but the underlying revenue, earn-ings and cash flow are likely to drop over the next year. We are monitoring for potential entry points as we like the business.
Mini Reports & Recommendations
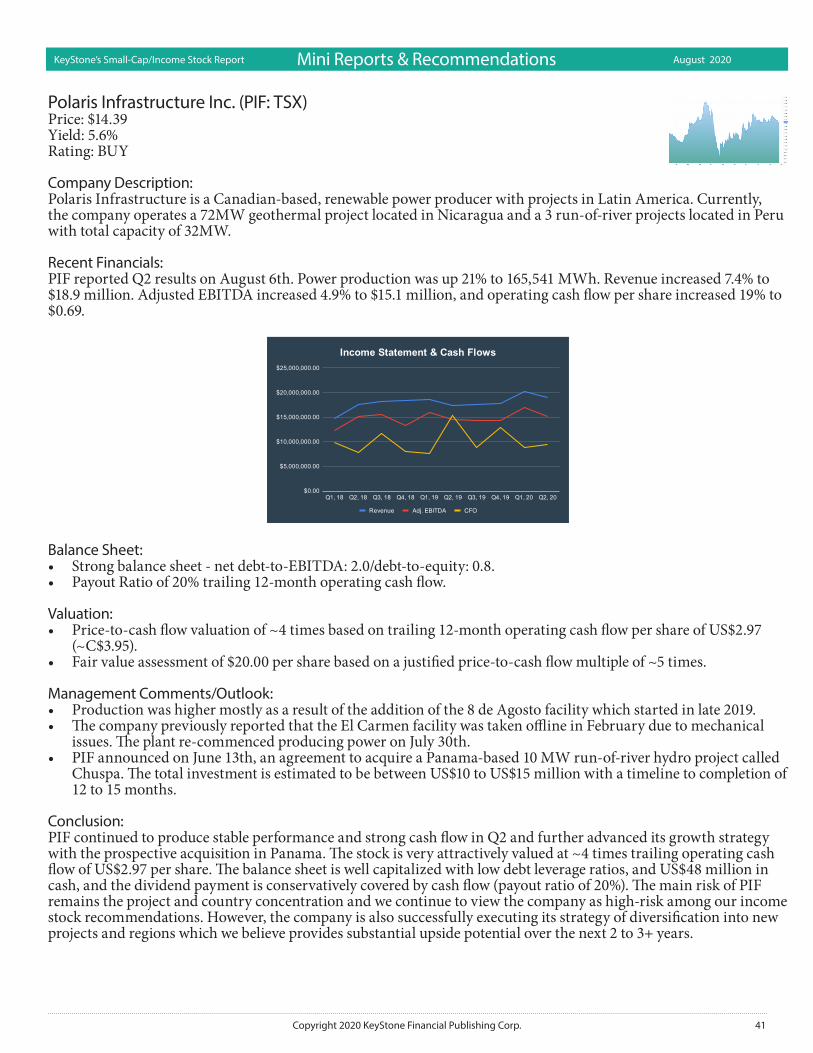
41Copyright 2020 KeyStone Financial Publishing Corp.
KeyStone’s Small-Cap/Income Stock Report August 2020
Polaris Infrastructure Inc. (PIF: TSX)Price: $14.39Yield: 5.6%Rating: BUY
Company Description:Polaris Infrastructure is a Canadian-based, renewable power producer with projects in Latin America. Currently, the company operates a 72MW geothermal project located in Nicaragua and a 3 run-of-river projects located in Peru with total capacity of 32MW.
Recent Financials:PIF reported Q2 results on August 6th. Power production was up 21% to 165,541 MWh. Revenue increased 7.4% to $18.9 million. Adjusted EBITDA increased 4.9% to $15.1 million, and operating cash flow per share increased 19% to $0.69.
Balance Sheet:• Strong balance sheet - net debt-to-EBITDA: 2.0/debt-to-equity: 0.8.• Payout Ratio of 20% trailing 12-month operating cash flow.
Valuation:• Price-to-cash flow valuation of ~4 times based on trailing 12-month operating cash flow per share of US$2.97
(~C$3.95). • Fair value assessment of $20.00 per share based on a justified price-to-cash flow multiple of ~5 times.
Management Comments/Outlook:• Production was higher mostly as a result of the addition of the 8 de Agosto facility which started in late 2019. • The company previously reported that the El Carmen facility was taken offline in February due to mechanical
issues. The plant re-commenced producing power on July 30th. • PIF announced on June 13th, an agreement to acquire a Panama-based 10 MW run-of-river hydro project called
Chuspa. The total investment is estimated to be between US$10 to US$15 million with a timeline to completion of 12 to 15 months.
Conclusion: PIF continued to produce stable performance and strong cash flow in Q2 and further advanced its growth strategy with the prospective acquisition in Panama. The stock is very attractively valued at ~4 times trailing operating cash flow of US$2.97 per share. The balance sheet is well capitalized with low debt leverage ratios, and US$48 million in cash, and the dividend payment is conservatively covered by cash flow (payout ratio of 20%). The main risk of PIF remains the project and country concentration and we continue to view the company as high-risk among our income stock recommendations. However, the company is also successfully executing its strategy of diversification into new projects and regions which we believe provides substantial upside potential over the next 2 to 3+ years.
Mini Reports & Recommendations
42 Copyright 2020 KeyStone Financial Publishing Corp.
KeyStone’s Small-Cap/Income Stock Report August 2020
Questor Technology Inc. (QST: TSX) Price: $1.48Rating: HOLD
Company Description: Headquartered in Calgary, Alberta, Questor provides specialized waste gas incineration products and services that destroy harmful pollutants in any waste gas stream at 99.99% efficiency enabling clients to meet emission regula-tions, address community concerns and improve safety at industrial sites. The company has three primary incinera-tor related revenue streams: sales, rentals and services. Incinerator services include hauling, commissioning, repairs, maintenance, and decommissioning. Questor’s current key incineration markets are Colorado, North Dakota, Mexico, Pennsylvania, Texas, Alberta and North East BC. Questor designs, manufactures, and services proprietary high efficiency waste gas incineration systems.
There are several methods for handling waste gases at oil and gas industrial facilities, the most common being combustion. Flaring and incineration are two methods of combustion accepted by many provincial and state regula-tors. Incineration is the mixing and combusting of waste gas streams, air, and fuel in an enclosed chamber which are mixed at a controlled rate and ignited so that no flame is visible when operating properly. A correctly designed and operated incinerator can yield higher combustion efficiencies through proper mixing, gas composition, retention time, and combustion temperature. Combustion efficiency, generally expressed as a percentage, is represented by the amount of methane converted to CO2, or H2S converted to SO2. The more converted, the better the efficiency. The company’s incineration product line is based on clean combustion technology that was developed by Questor and initially patented in both Canada and the United States in 1999. The company has continued to evolve the technology over the years making several improvements from the original patent which expired in November 2019. Questor cur-rently has five new patent filings that are pending.
Recent Financials: Revenue for the three months ended June 30, 2020, was $1.0 million versus $7.4 million in 2019, a decrease of $6.4 million. Revenue by the major service lines comprised of incinerator rentals ($0.7 million versus $4.8 million), equip-ment sales ($0.1 million versus $1.9 million) and incinerator service ($0.2 million versus $0.7 million). Net income dropped to a loss of $1.2 million from a gain of $2.06 million.
Balance Sheet: In the first half of the year Questor has lived within its cash flow and finished this quarter with a cash balance of $15.2 million. This is a $1.7 million increase from December 31, 2019, and with zero debt. While in a historically tough current market, Questor is positioned to survive, launch new products and tackle new markets, and service its core market midterm. In this period of uncertainty, Questor plans to continue to be disciplined and focus on pre-serving positive operating cash flow in order to maintain its strong balance sheet.
Valuation: Questor’s trailing EV/EBITDA is just over 4, but this low number belies the current crisis the company faces mov-ing forward. The Q2 results may be a low point, but growth in the near term is most likely off the table for at least 3 quarters, unless other markets open up near term.
Management Comments/Outlook: The measures introduced to combat the COVID-19 pandemic are having a significant impact on the private sector and individuals, including unprecedented business, employment and economic disruptions. The continued spread of COVID-19 nationally and globally has had, and will continue to have, a material adverse effect on Questor’s business, operations, and financial results. In addition, the unprecedented reduction of crude oil prices due to excessive supply compared to energy consumption, notwithstanding the recent agreement among OPEC members and other global oil producing countries to implement supply reductions, will continue to have a significant impact on the indus-try for months to come. As such, overall market conditions are anticipated to remain uncertain for the foreseeable future. Upstream, midstream and downstream companies will continue to reduce or carefully manage spending for capital projects and operations where possible until some sort of market stability has returned.
On a somewhat positive note longer term, many funds and investors signalled to the market that their dollars would only be invested in companies that are reducing emissions and have a strong ESG commitment. Many of the larger
Mini Reports & Recommendations

43Copyright 2020 KeyStone Financial Publishing Corp.
KeyStone’s Small-Cap/Income Stock Report August 2020
companies have set net zero goals by 2030. Governments and municipalities are also setting similar goals. Questor’s ability to cleanly combust the methane ensuring zero methane emissions to the atmosphere and the ability to utilize the waste heat to generate power are two very cost-effective ways to attain the goal of net zero and this layered on with the company’s data emission platform will ensure clients have credible information and perhaps help set the standards.
On April 17, 2020, the Canadian federal government announced it will invest $1.7 billion to clean up abandoned and inactive natural gas and oil wells. In addition, it will establish a $750 million Emission Reduction Fund, with a focus on methane, to create and maintain jobs through pollution reduction efforts. This goes a long way toward indicating the federal government does understand the importance of this industry and the struggles it currently faces. Man-agement believes that it is uniquely positioned within the market to offer products and services to support these types of initiatives. We see potential to win business here, but it remains speculative until we see actual contracts and cash flow.
Conclusion: Questor entered 2020 on a strong footing with a great balance sheet, strong cash flow and expansion of its large rental fleet into new markets. All of this ended as global oil prices collapsed in the global COVID-19 pandemic. The compa-ny’s shares have suffered significantly since. Questor’s strong balance sheet will protect the business mid-term in the economic turmoil and enables growth when the market’s confidence improves. The company continues to have $15.2 million in cash, a large rental fleet, and no debt.
At present, we view Questor as a HOLD and would not enter new positions. We do see a potential for a recovery as the energy sector stabilizes once again, but this is likely 12-months forward. For those who do not wish to hold for the next 2-3 years, the stock could be sold and capital deployed in other opportunities with better near and mid-term cash flow growth potential from our Focus BUY Portfolio.
Mini Reports & Recommendations

44 Copyright 2020 KeyStone Financial Publishing Corp.
KeyStone’s Small-Cap/Income Stock Report August 2020
RE Royalties Ltd. (RE: TSX-V) Price: $1.10Yield: 3.8%Rating: Monitor
Company Description: RE Royalties Ltd. acquires revenue‐based royalties from renewable energy generation facilities by providing a non‐dilutive royalty financing solution to privately held and publicly traded renewable energy generation and develop-ment companies. The company’s business objectives are to acquire a portfolio of long‐term, stable, and diversified royalty streams from renewable energy generation facilities and to provide shareholders with capital appreciation and a growing, sustainable, long‐term cash distribution.
The company currently owns a portfolio of 86 royalties (63 as at December 31, 2019) on solar, wind and hydro proj-ects operating in Canada, Europe and the United States. A summary is as follows:
Company Location # of Royalties
Royalty % of Revenue
Remaining Avg. Roy-alty Life (Years)
Energy Type
Status Power(MW)
Original Investment
($CAD million)
Aeolis Wind
Canada 1 1% 17 Wind Operational 102MW $1.24
OntarioCo Canada 60* 2% 18 Solar Operational 16MW** $5.0Fresh Air Energy
Canada 4 1% 15 Solar Operational 40MW $1.87
Scotian Windfields
Canada 12 8% 16 Wind Operational 40MW $4.64
Alpin Sun USA 2 2% 20 Solar Development(Est. 2020 Op-
erational)
152MW $1.3
Belltown Power
USA 1 1% 20 Solar Construction(Est. 2020 Op-
erational)
78MW $3.64
Jade Power Romania 6 1% 17 Solar, Wind, Hydro
Operational 39MW $3.8
* Include additional 11 royalty streams purchased in June 2020. ** Does not include addition MW capacity from 11 additional solar projects from June 2020.
Recent Financials (Q1 2020): Revenues for the quarter were $0.44 million, an increase of $0.11 million or 31.6% over the previousquarter and an increase of $0.16 million or 57.2% from the three months ended March 31, 2019. As a percentage of to-tal revenue, royalty income and finance income were 29.9% and 70.1% respectively, compared to 9.3% and 90.7% for Q1 2019. During Q4, 2019, the company’s total revenue was higher compared to other quarters presented because of a royalty buyout from the Alpin Sun royalty investment transaction. Adjusted EBITDA was $0.06 million compared to $0.07 million for the same quarter last year.
Mini Reports & Recommendations
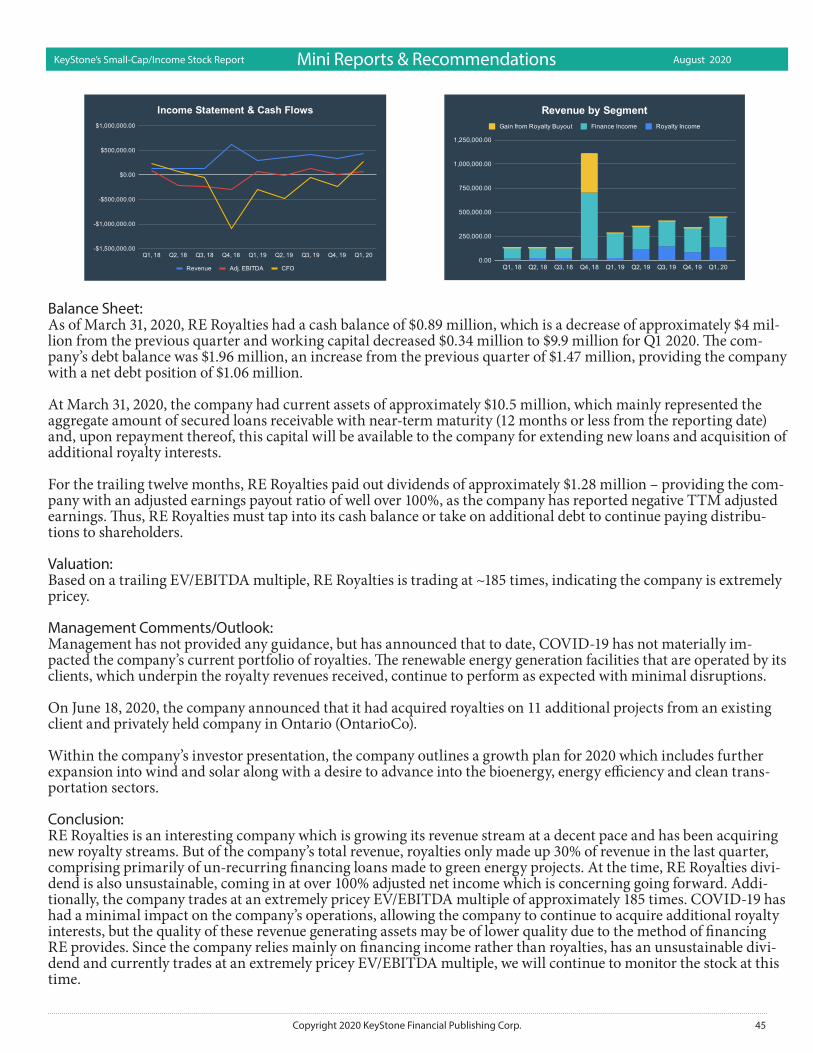
45Copyright 2020 KeyStone Financial Publishing Corp.
KeyStone’s Small-Cap/Income Stock Report August 2020
Balance Sheet: As of March 31, 2020, RE Royalties had a cash balance of $0.89 million, which is a decrease of approximately $4 mil-lion from the previous quarter and working capital decreased $0.34 million to $9.9 million for Q1 2020. The com-pany’s debt balance was $1.96 million, an increase from the previous quarter of $1.47 million, providing the company with a net debt position of $1.06 million.
At March 31, 2020, the company had current assets of approximately $10.5 million, which mainly represented the aggregate amount of secured loans receivable with near‐term maturity (12 months or less from the reporting date) and, upon repayment thereof, this capital will be available to the company for extending new loans and acquisition of additional royalty interests.
For the trailing twelve months, RE Royalties paid out dividends of approximately $1.28 million – providing the com-pany with an adjusted earnings payout ratio of well over 100%, as the company has reported negative TTM adjusted earnings. Thus, RE Royalties must tap into its cash balance or take on additional debt to continue paying distribu-tions to shareholders.
Valuation: Based on a trailing EV/EBITDA multiple, RE Royalties is trading at ~185 times, indicating the company is extremely pricey.
Management Comments/Outlook: Management has not provided any guidance, but has announced that to date, COVID‐19 has not materially im-pacted the company’s current portfolio of royalties. The renewable energy generation facilities that are operated by its clients, which underpin the royalty revenues received, continue to perform as expected with minimal disruptions.
On June 18, 2020, the company announced that it had acquired royalties on 11 additional projects from an existing client and privately held company in Ontario (OntarioCo).
Within the company’s investor presentation, the company outlines a growth plan for 2020 which includes further expansion into wind and solar along with a desire to advance into the bioenergy, energy efficiency and clean trans-portation sectors.
Conclusion: RE Royalties is an interesting company which is growing its revenue stream at a decent pace and has been acquiring new royalty streams. But of the company’s total revenue, royalties only made up 30% of revenue in the last quarter, comprising primarily of un-recurring financing loans made to green energy projects. At the time, RE Royalties divi-dend is also unsustainable, coming in at over 100% adjusted net income which is concerning going forward. Addi-tionally, the company trades at an extremely pricey EV/EBITDA multiple of approximately 185 times. COVID-19 has had a minimal impact on the company’s operations, allowing the company to continue to acquire additional royalty interests, but the quality of these revenue generating assets may be of lower quality due to the method of financing RE provides. Since the company relies mainly on financing income rather than royalties, has an unsustainable divi-dend and currently trades at an extremely pricey EV/EBITDA multiple, we will continue to monitor the stock at this time.
Mini Reports & Recommendations
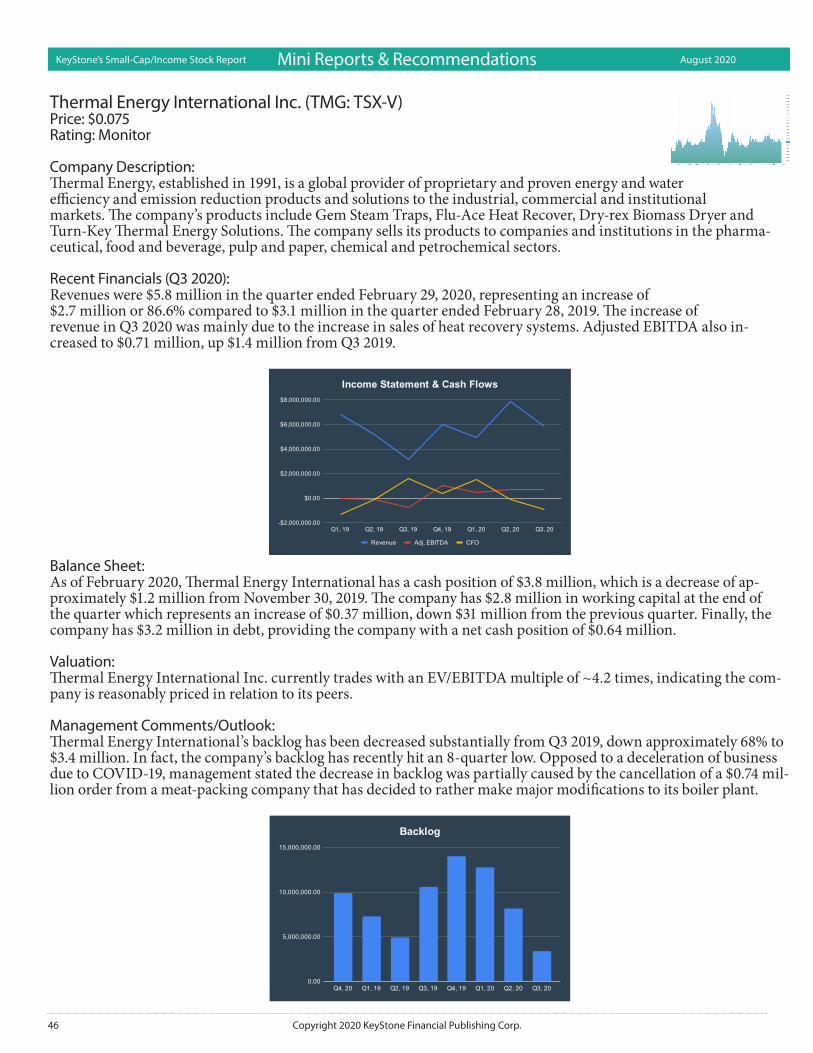
46 Copyright 2020 KeyStone Financial Publishing Corp.
KeyStone’s Small-Cap/Income Stock Report August 2020
Thermal Energy International Inc. (TMG: TSX-V) Price: $0.075Rating: Monitor
Company Description: Thermal Energy, established in 1991, is a global provider of proprietary and proven energy and waterefficiency and emission reduction products and solutions to the industrial, commercial and institutionalmarkets. The company’s products include Gem Steam Traps, Flu-Ace Heat Recover, Dry-rex Biomass Dryer and Turn-Key Thermal Energy Solutions. The company sells its products to companies and institutions in the pharma-ceutical, food and beverage, pulp and paper, chemical and petrochemical sectors.
Recent Financials (Q3 2020): Revenues were $5.8 million in the quarter ended February 29, 2020, representing an increase of$2.7 million or 86.6% compared to $3.1 million in the quarter ended February 28, 2019. The increase ofrevenue in Q3 2020 was mainly due to the increase in sales of heat recovery systems. Adjusted EBITDA also in-creased to $0.71 million, up $1.4 million from Q3 2019.
Balance Sheet:As of February 2020, Thermal Energy International has a cash position of $3.8 million, which is a decrease of ap-proximately $1.2 million from November 30, 2019. The company has $2.8 million in working capital at the end of the quarter which represents an increase of $0.37 million, down $31 million from the previous quarter. Finally, the company has $3.2 million in debt, providing the company with a net cash position of $0.64 million.
Valuation: Thermal Energy International Inc. currently trades with an EV/EBITDA multiple of ~4.2 times, indicating the com-pany is reasonably priced in relation to its peers.
Management Comments/Outlook: Thermal Energy International’s backlog has been decreased substantially from Q3 2019, down approximately 68% to $3.4 million. In fact, the company’s backlog has recently hit an 8-quarter low. Opposed to a deceleration of business due to COVID-19, management stated the decrease in backlog was partially caused by the cancellation of a $0.74 mil-lion order from a meat-packing company that has decided to rather make major modifications to its boiler plant.
Mini Reports & Recommendations
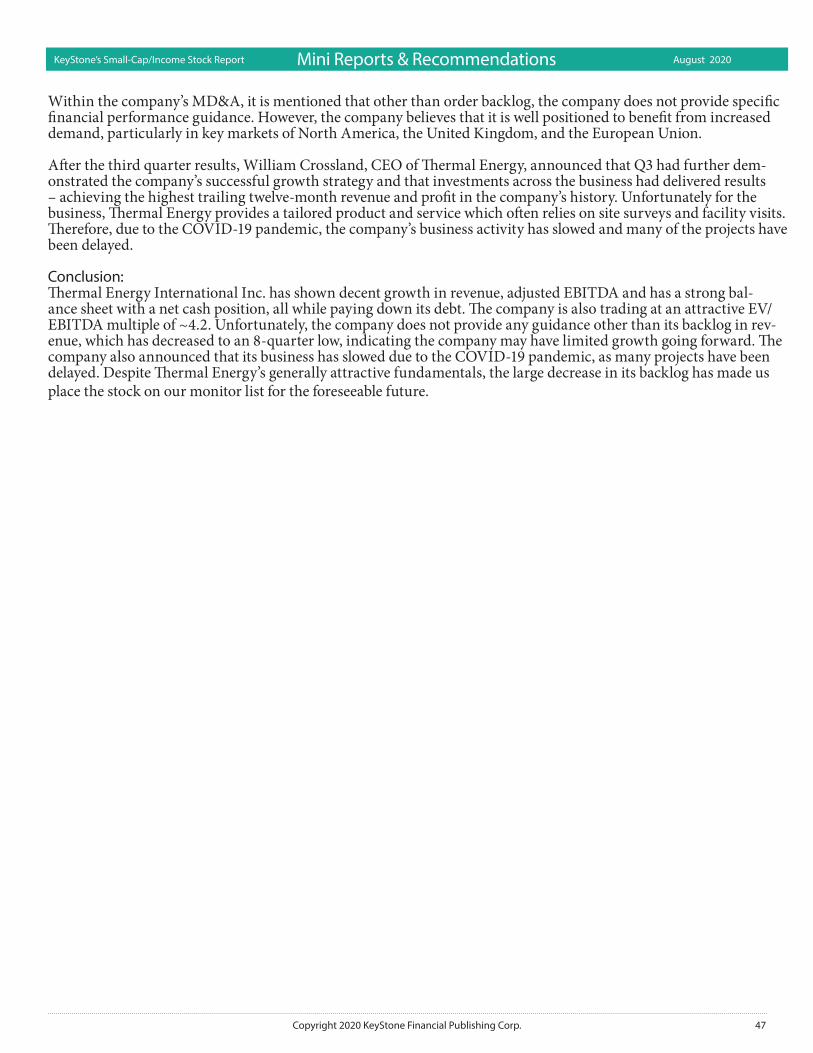
47Copyright 2020 KeyStone Financial Publishing Corp.
KeyStone’s Small-Cap/Income Stock Report August 2020
Within the company’s MD&A, it is mentioned that other than order backlog, the company does not provide specific financial performance guidance. However, the company believes that it is well positioned to benefit from increased demand, particularly in key markets of North America, the United Kingdom, and the European Union.
After the third quarter results, William Crossland, CEO of Thermal Energy, announced that Q3 had further dem-onstrated the company’s successful growth strategy and that investments across the business had delivered results – achieving the highest trailing twelve-month revenue and profit in the company’s history. Unfortunately for the business, Thermal Energy provides a tailored product and service which often relies on site surveys and facility visits. Therefore, due to the COVID-19 pandemic, the company’s business activity has slowed and many of the projects have been delayed.
Conclusion: Thermal Energy International Inc. has shown decent growth in revenue, adjusted EBITDA and has a strong bal-ance sheet with a net cash position, all while paying down its debt. The company is also trading at an attractive EV/EBITDA multiple of ~4.2. Unfortunately, the company does not provide any guidance other than its backlog in rev-enue, which has decreased to an 8-quarter low, indicating the company may have limited growth going forward. The company also announced that its business has slowed due to the COVID-19 pandemic, as many projects have been delayed. Despite Thermal Energy’s generally attractive fundamentals, the large decrease in its backlog has made us place the stock on our monitor list for the foreseeable future.
Mini Reports & Recommendations

48 Copyright 2020 KeyStone Financial Publishing Corp.
KeyStone’s Small-Cap/Income Stock Report August 2020
TransAlta Renewables Inc. (RNW: TSX)Price: $15.97Yield: 2.0%Rating: Monitor
Company Description:TransAlta Renewables is among the largest of any publicly traded renewable independent power producers (“IPP”) in Canada. The company’s asset platform and economic interests are diversified in terms of geography, generation and counterparties and consist of interests in 23 wind facilities, 13 hydroelectric facilities, seven natural gas generation facilities, one solar facility and one natural gas pipeline, representing an ownership interest of 2,527 megawatts of owned generating capacity.
Recent Financials:Q2 2020 comparable EBITDA of $115 million, a $4 million or 4% improvement to the same period in 2019. Adjusted funds from operations (AFFO) of $0.34 per share, an increase of 13% compared to the previous year.
Balance Sheet:• Very low leverage ratios - net debt-to-EBITDA: 1.8/debt-to-equity: 0.38.• Payout Ratio of ~70% of trailing 12-month free cash flow (AFFO). Valuation:• RNW trades at a price-to-free cash flow (AFFO) valuation of ~12 times based on trailing 12-month AFFO per
unit of $1.33.
Management Comments/Outlook:• “Results for the quarter were solid and we are proud to be generating renewable power seamlessly for our custom-
ers throughout our regions during this unparalleled time. We were also able to continue to advance our discus-sions with TransAlta on dropdown opportunities in order to deliver our growth objectives,” said John Kousin-ioris, President.
• Comparable EBITDA for the three and six months ended June 30, 2020, increased by $4 million and $6 million, respectively, driven by higher Comparable EBITDA from US Wind and Solar partially offset by lower Compa-rable EBITDA from Canadian Wind and Canadian Gas. Comparable EBITDA was favourable at US Wind and Solar driven by full period operation of the Big Level and Antrim wind farms along with higher environmental attribute revenues generated from the US Solar facilities. This was partially offset by lower Comparable EBITDA at Canadian Wind primarily due to lower carbon offset revenues, lower government incentives driven by pro-gram expiries, timing of green attribute revenues, and insurance proceeds received in 2019 and lower Compa-rable EBITDA at Canadian Gas due to lower merchant power prices in Ontario in the first six months of 2020 compared to the same period in 2019.
• 2020 guidance (provided on Feb 28th): • Comparable EBITDA - 445 – 475 million (up 1.6 to 8.4% compared to 2019).• Adjusted funds from operations - $343 million (up 2.0 to 10.8% compared to 2019).
Mini Reports & Recommendations

49Copyright 2020 KeyStone Financial Publishing Corp.
KeyStone’s Small-Cap/Income Stock Report August 2020
Conclusion: RNW was originally created as a spin-off of renewable assets from its embattled parent company Transalta Corpora-tion. RNW has very low debt leverage on its balance sheet and stable cash flow as a result of highly contracted assets. The challenge for the company historically has been in maintaining consistent growth. The most recent quarter was strong with contributions from 2 new development projects.
Mini Reports & Recommendations
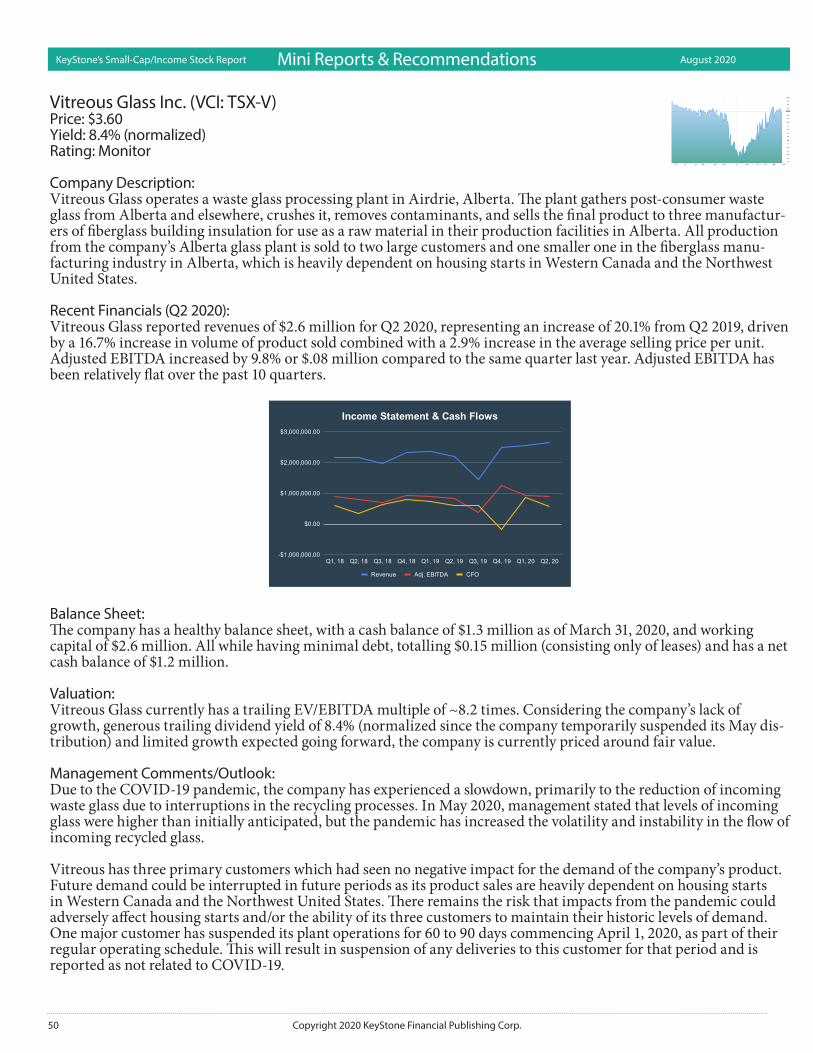
50 Copyright 2020 KeyStone Financial Publishing Corp.
KeyStone’s Small-Cap/Income Stock Report August 2020
Vitreous Glass Inc. (VCI: TSX-V) Price: $3.60Yield: 8.4% (normalized)Rating: Monitor
Company Description: Vitreous Glass operates a waste glass processing plant in Airdrie, Alberta. The plant gathers post-consumer waste glass from Alberta and elsewhere, crushes it, removes contaminants, and sells the final product to three manufactur-ers of fiberglass building insulation for use as a raw material in their production facilities in Alberta. All production from the company’s Alberta glass plant is sold to two large customers and one smaller one in the fiberglass manu-facturing industry in Alberta, which is heavily dependent on housing starts in Western Canada and the Northwest United States.
Recent Financials (Q2 2020): Vitreous Glass reported revenues of $2.6 million for Q2 2020, representing an increase of 20.1% from Q2 2019, driven by a 16.7% increase in volume of product sold combined with a 2.9% increase in the average selling price per unit. Adjusted EBITDA increased by 9.8% or $.08 million compared to the same quarter last year. Adjusted EBITDA has been relatively flat over the past 10 quarters.
Balance Sheet: The company has a healthy balance sheet, with a cash balance of $1.3 million as of March 31, 2020, and working capital of $2.6 million. All while having minimal debt, totalling $0.15 million (consisting only of leases) and has a net cash balance of $1.2 million.
Valuation: Vitreous Glass currently has a trailing EV/EBITDA multiple of ~8.2 times. Considering the company’s lack of growth, generous trailing dividend yield of 8.4% (normalized since the company temporarily suspended its May dis-tribution) and limited growth expected going forward, the company is currently priced around fair value.
Management Comments/Outlook: Due to the COVID-19 pandemic, the company has experienced a slowdown, primarily to the reduction of incoming waste glass due to interruptions in the recycling processes. In May 2020, management stated that levels of incoming glass were higher than initially anticipated, but the pandemic has increased the volatility and instability in the flow of incoming recycled glass.
Vitreous has three primary customers which had seen no negative impact for the demand of the company’s product. Future demand could be interrupted in future periods as its product sales are heavily dependent on housing starts in Western Canada and the Northwest United States. There remains the risk that impacts from the pandemic could adversely affect housing starts and/or the ability of its three customers to maintain their historic levels of demand. One major customer has suspended its plant operations for 60 to 90 days commencing April 1, 2020, as part of their regular operating schedule. This will result in suspension of any deliveries to this customer for that period and is reported as not related to COVID-19.
Mini Reports & Recommendations

51Copyright 2020 KeyStone Financial Publishing Corp.
KeyStone’s Small-Cap/Income Stock Report August 2020
In order to maximize the liquidity of the company, the directors decided to suspend the May 15th, 2020, dividend and have suspended any significant capital additions until further notice. Since this news release, the company has reinstated its dividend payments and paid a cash distribution on July 30th, 2020.
Conclusion: Vitreous Glass has posted decent financial results and pays an attractive dividend, yielding approximately 8.4% (nor-malized), which is a trailing twelve-month payout ratio of 98%. The company also has a healthy balance sheet which is flush with cash and contains limited debt. Considering the company’s limited growth outlook and large payout ratio, it is our opinion that Vitreous is currently trading around fair value. It should be noted that the company is very illiquid, with an average daily trading volume of only 3,000 shares. Investors looking for a green stock with an attractive yield could consider Vitreous Glass as a solid alternative, but due to the company’s limited growth going forward, we have placed the stock on our monitor list.
Mini Reports & Recommendations
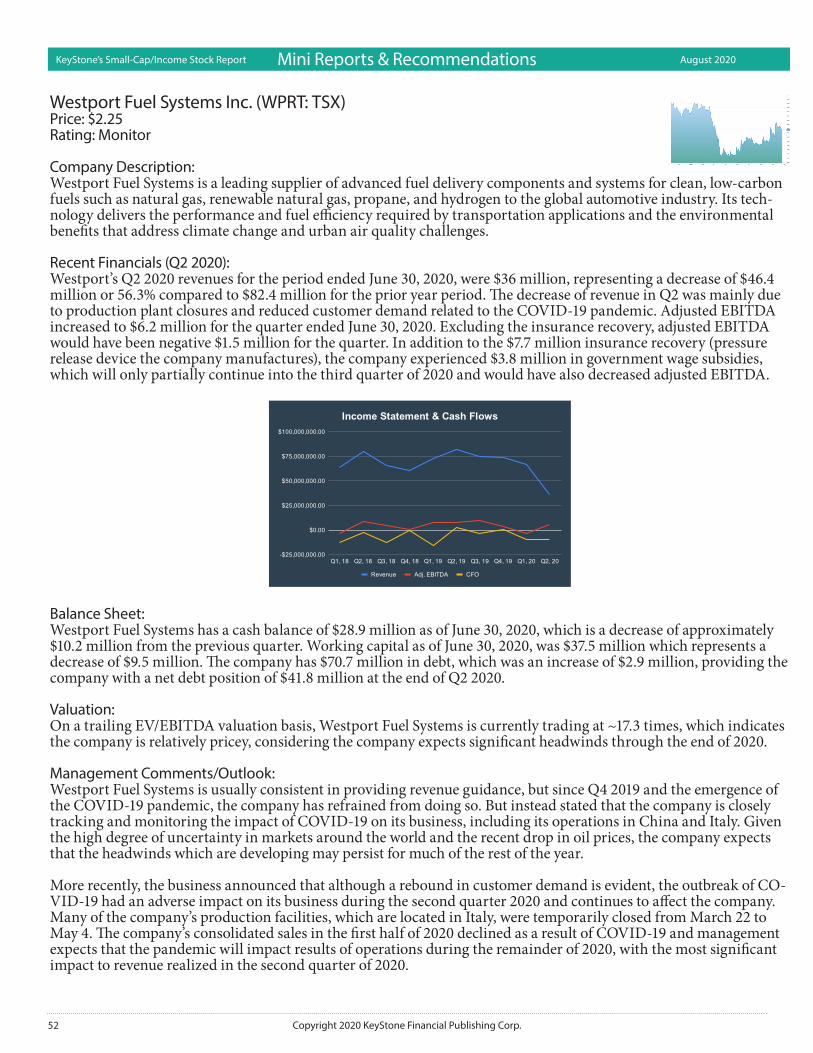
52 Copyright 2020 KeyStone Financial Publishing Corp.
KeyStone’s Small-Cap/Income Stock Report August 2020
Westport Fuel Systems Inc. (WPRT: TSX) Price: $2.25Rating: Monitor Company Description: Westport Fuel Systems is a leading supplier of advanced fuel delivery components and systems for clean, low-carbon fuels such as natural gas, renewable natural gas, propane, and hydrogen to the global automotive industry. Its tech-nology delivers the performance and fuel efficiency required by transportation applications and the environmental benefits that address climate change and urban air quality challenges.
Recent Financials (Q2 2020): Westport’s Q2 2020 revenues for the period ended June 30, 2020, were $36 million, representing a decrease of $46.4 million or 56.3% compared to $82.4 million for the prior year period. The decrease of revenue in Q2 was mainly due to production plant closures and reduced customer demand related to the COVID-19 pandemic. Adjusted EBITDA increased to $6.2 million for the quarter ended June 30, 2020. Excluding the insurance recovery, adjusted EBITDA would have been negative $1.5 million for the quarter. In addition to the $7.7 million insurance recovery (pressure release device the company manufactures), the company experienced $3.8 million in government wage subsidies, which will only partially continue into the third quarter of 2020 and would have also decreased adjusted EBITDA.
Balance Sheet: Westport Fuel Systems has a cash balance of $28.9 million as of June 30, 2020, which is a decrease of approximately $10.2 million from the previous quarter. Working capital as of June 30, 2020, was $37.5 million which represents a decrease of $9.5 million. The company has $70.7 million in debt, which was an increase of $2.9 million, providing the company with a net debt position of $41.8 million at the end of Q2 2020.
Valuation: On a trailing EV/EBITDA valuation basis, Westport Fuel Systems is currently trading at ~17.3 times, which indicates the company is relatively pricey, considering the company expects significant headwinds through the end of 2020.
Management Comments/Outlook: Westport Fuel Systems is usually consistent in providing revenue guidance, but since Q4 2019 and the emergence of the COVID-19 pandemic, the company has refrained from doing so. But instead stated that the company is closely tracking and monitoring the impact of COVID-19 on its business, including its operations in China and Italy. Given the high degree of uncertainty in markets around the world and the recent drop in oil prices, the company expects that the headwinds which are developing may persist for much of the rest of the year.
More recently, the business announced that although a rebound in customer demand is evident, the outbreak of CO-VID-19 had an adverse impact on its business during the second quarter 2020 and continues to affect the company. Many of the company’s production facilities, which are located in Italy, were temporarily closed from March 22 to May 4. The company’s consolidated sales in the first half of 2020 declined as a result of COVID-19 and management expects that the pandemic will impact results of operations during the remainder of 2020, with the most significant impact to revenue realized in the second quarter of 2020.
Mini Reports & Recommendations
53Copyright 2020 KeyStone Financial Publishing Corp.
KeyStone’s Small-Cap/Income Stock Report August 2020
In response to COVID-19, management implemented several austerity measures, including actions to reduce costs, such as salary and other compensation deferrals and reductions, and delaying non-critical projects and capital ex-penditures. Efforts to increase liquidity and reduce the cost of capital, include:• On March 25, 2020, $6.0 million in principal deferrals on term loan from Export Development Canada.• On May 28, 2020, a €5.0 million government backed term loan from UniCredit S.p.A. (“UniCredit”) to Emer
subsidiary.• On July 17, 2020, a €15.0 million government backed term loan from UniCredit to MTM subsidiary.• On July 23, 2020, a $10.0 million bridge loan secured through Export Development Canada at a 6.25% interest
rate.• On July 24, 2020, announced the refinancing of convertible notes with Cartesian Capital Group and its affiliates
(“Cartesian”).
Conclusion: Westport Fuel Systems Inc. is not attractive at its current price. The company has experienced headwinds with the emergence of the COVID-19 outbreak, causing revenue to fall substantially and continues to trade at a pricey EV/EBITDA multiple. Although adjusted EBITDA has increased, this figure still includes insurance benefits and wage subsidies which would have otherwise shown a similar decrease in EBITDA as in revenue. The company’s balance sheet has also been deteriorating, with the company’s cash balance falling substantially, all while taking on more debt to maintain liquidity. Since the company is experiencing near-term difficulties and the long-term outlook for the company is uncertain, we will continue to monitor the stock at this time.
Mini Reports & Recommendations
54 Copyright 2020 KeyStone Financial Publishing Corp.
KeyStone’s Small-Cap/Income Stock Report August 2020
Xebec Adsorption Inc. (XBC: TSX-V) Price: $4.36Rating: Monitor
Company Description: Originally established in 1967, Xebec has over 50 years of experience in adsorption technology, supplying more than 10,000 units to clients worldwide. Xebec specializes in developing products and technology solutions for environ-mentally responsible generation, purification, dehydration, separation, and filtration applications for gases. Over the last 15 years, Xebec has increased its focus on renewable gas generation. Renewable Natural Gas (RNG) and Renew-able Hydrogen (RH2) are low carbon fuel sources that are experiencing increasing demand as we take global action on climate change to reduce the use of fossil fuels.
Recent Financials: • Record revenues of $19.6 million in the second quarter of 2020 compared to $12.8 million for the same period in
2019, a 53% increase.• Negative EBITDA at $0.1 million for the second quarter 2020 compared to a positive $1.8 million for the same
period in 2019.• Net loss of ($0.8) million or ($0.01)/share for the second quarter 2020 compared to a net profit of $1.0 million or
$0.02/share for the same period in 2019.
Balance Sheet: As of June 30, 2020, the company had $60.0 million of cash on hand compared to $22.4 as of December 31, 2019. Working capital increased to $87.2 million on June 30, 2020, for a current ratio of 6.5:1 compared with working capi-tal of $36.9 million and a 3.2:1 ratio on December 31, 2019.
Valuation: At present, based on the company’s cash flow, earnings, and EBITDA over the last 12 months, the stock is pricy. The company’s trailing EV/EBITDA following its latest quarter is over 100.
Management Comments/Outlook: Xebec’s market outlook for renewable natural gas and hydrogen purification equipment under the company’s Clean-tech Systems segment remains unchanged from previous guidance. Xebec continues to guide for Cleantech revenue in the $50 to $55 million range for 2020, but the company is seeing lower than anticipated margins in the larger biogas plants as Xebec invests in the standardization of these designs. The company’s engineering and supply chain teams are working on complexity reductions and sourcing synergies between different product platforms, which should allow Xebec to generate Cleantech margins in the 25% to 30% range. Xebec’s current quote log remained strong at $1.05 billion (as of August 10th, 2020) and the segment’s order backlog is $85.5 million.
Management expects the Industrial Service and Support segment to continue its revenue growth in line with Xebec’s long-term strategy. The company continues to pursue organic and inorganic growth opportunities and expects to grow revenues from $11.5 million in 2019 to about $30 to $35 million in 2020. The current run rate for industrial service and support revenues is approximately $25 million, and Xebec expects to close 2 more acquisitions within the next 60 to 90 days. As a result, Xebec is on track to hit revenue guidance of $30 million+ range for 2020. In Q2 2020 the company achieved a gross margin of 37%, somewhat lower than the targeted 40%+. As purchasing power increas-es, management believes that company should be able to improve the margin into the targeted range.
As such, Xebec maintained its revenue guidance of $80 to $90 million but retract earnings and EBITDA guidance. Xebec expects to be profitable on a net earnings and EBITDA basis for 2020 but given the results of the first two quar-ters, the company stated it was unable to maintain the previous guidance. Execution and organizational development will be key for continued growth. Management recognizes this and is focused on operational performance and the creation of an environment that will allow the company to scale.
Renewable Gas Infrastructure:On July 3rd, 2020, the Québec government announced its organic material management plan with a target to recycle or recover 70% of organic waste in the province by 2030. In conjunction with this target, the province earmarked $1.2 billion in funding to support municipalities and private companies with the build out of organic matter collection
Mini Reports & Recommendations
55Copyright 2020 KeyStone Financial Publishing Corp.
KeyStone’s Small-Cap/Income Stock Report August 2020
services and processing facilities. In addition, there is a specific program (PTMOBC) for the treatment of organic materials by bio-methanation (RNG production) and composting, whose budget will be increased by $308 million. In addition, the Québec government announced on July 4th, 2020, it is commitment to provide $70 million in fund-ing for RNG projects. These developments are positive for Xebec’s recently announced fund (GNR Québec Capital L.P.) with the Fonds de solidarité FTQ. This new investment vehicle aims to increase renewable natural gas (RNG) production in Québec and when fully capitalized and appropriately leveraged, could fund 12 to 15 renewable natural gas projects in the province.
Conclusion: Xebec is a business we like. The revenue growth has been strong and the continued increase in backlog and bidding activity in a couple of segments with significant tailwinds are positives long term. We see strong potential for con-tinued growth for the business long term. At present, based on the company’s cash flow, earnings, and EBITDA over the last 12 months, the stock is pricy. In fact, the company’s trailing EV/EBITDA follow its latest quarter is over 100. Given the current COVID-19 environment, while management has maintained its 2020 revenue guidance of $80 to $90 million, it has retracted earnings and EBITDA guidance. Again, we like the business, but the current valuations are pricing in significant growth over the near and mid-term with significant margin improvement. Both are pos-sible, but with management unable to provide profitability guidance near term, we continue to Monitor the stock. It may be a long-term option for investors looking for green exposure, but the lack of consistent cash flow at present and high relative valuations put Xebec outside of our strict criteria.
Mini Reports & Recommendations
56 Copyright 2020 KeyStone Financial Publishing Corp.
KeyStone’s Small-Cap/Income Stock Report August 2020 Ratios and Definitions
2008a; 2009e
The term (a) refers to the actually results that a company has posted on its financial statements. The term (e) refers to analyst estimates of future results.
Book value (BV)
The total value of a company’s assets, on its Balance Sheet, less any liabilities. Also referred to as Shareholder Equity. (The value of a companies assets, on its Balance Sheet, does not necessarily
reflect the true value of assets).
Cash Flow from Operations (CFO; Operating Cash Flow)
The cash inflow that a company recieves during a period, resulting from operating activities (does
not include Cash Flow from Investing or Financing).
Current ratio
One of many ratios designed to evaluate short-term liquidity of a company. Calculated as current assets divided by current liabilities, this ratio gauges the level of cash resources relative to current liabilities as a measure of cash obligations (the ratio should be greater than 1).
D/E: Debt-to-equity ratio
A measure of a company’s financial leverage calculated by dividing long term debt by sharehold-ers equity. It indicates what proportion of equity and debt the company is using to finance its assets (a lower ratio indicates lower relative debt ratios).
EBITDA
Earnings before interest, taxes, depreciation, and amortization. EBITDA is calculated as revenue minus expenses (excluding tax, interest, depreciation, and amortization).
EPS: Earnings per share
A company’s earnings available to common shareholders, also known as net income or net profit, divided by the number of shares outstanding.
Fair Value
The price at which an analyst believes a companies stock should be priced. Although this value is based on intelligent analysis, it in no way is a representation of what the companies share price will be trading at given any period of time. The analysis used to determine Fair Value is based on numerous assumptions and uncertainties. Fair Value should be used only as a general guide to investing and should not be depended upon.
FCFE: Free cash flow to equity
Cash flow from operations less working capital requirements, sustaining capital expenditures and scheduled debt repayments. FCFE consists of cash inflows that are available to the shareholders of the company.
Net working capital surplus (deficiency)
A measure of the company’s ability to carry on its normal business comfortably and without
financial stringency, to expand its operations without the need of new financing, and to meet
emergencies and losses. Calculated by deducting current liabilities from the current assets (as
positive figure is a surplus, whereas a negative figure is a deficiency).
P/B: Price-to-book ratio
Calculated as a stock’s market value (current closing price) divided by its latest quarter’s book
value. While a lower P/B ratio could mean that the stock is undervalued, it could also serve as a
sign of weak fundamentals, and as with most ratios, this varies a fair amount by industry.
P/CF: Price-to-cash flow ratio
Calculated as a company’s current share price divided by its cash flow per share (i.e., free cash
flow divided by the number of company’s shares outstanding) over the last four quarters (called
“TTM,” or “trailing 12 months” calculation). It is a measure of the market’s expectations regard-
ing a firm’s future financial health.
P/S: Price-to-sales ratio
It is calculated as a stock’s current market price divided by its sales (revenue) per share. When
calculating this ratio, we use the company’s revenue from its latest four quarters, or on a TTM
basis.
ROE: Return on equity
A measure of a corporation’s profitability, calculated as net income divided by shareholder’s
equity. ROE is often useful in comparing the profitability of a company to other firms in the same
industry.
Tangible Book Value (TBV)
The total value of a company’s assets, on its Balance Sheet, less any liabilities and intangible assets
such as goodwill. Also referred to as Shareholder Equity. (Also true asset values likely differ from
Balance Sheet Values, Tangible Book Value is generally considered a more accurate representa-
tion of value).
Times Interest Earned
The multiple of Net Income (before interest and taxes) to interest payments during the period.
This assesses a companies ability and margin of safety, with respect to meeting its interest obliga-
tions (a higher number is more attractive).
Yield
The investment return resulting from income distributions. Calculated as the annual or annual-
ized interest or dividend distribution, divided by the cost of the original investment.
Disclaimer: The information in this publication is derived from sources believed to be reliable. Neither KeyStone Financial, its employees or any affiliated parties guarantee the accuracy of this information or accept any liability for losses, financial or otherwise, arising from using these reports. These reports contain forward looking data, which is based on estimates and assumptions. Actual results may differ significantly from the estimates contained in these reports. Recommendations contained in these report do not consider the risk tolerance or financial situation of individual users. For personal financial advice, it is recommended that you consult a qualified financial advisor.
Disclosure
Stock Holding Other
Companies KeyStone KeyStone Employees Related Companies Investment Banking Client Related Company Business Relationship
5N Plus Inc. Algonquin Power & Utilities Corp.Atlantic Power Corp. Biorem Inc. Boralex Inc. Brookfield Renewable Partners L.P.Capital Power Corporation H2O Innovation Inc. Innergex Renewable Energy Jade Power Trust NanoXploreNorthland Power Inc. PFB Corporation. Polaris Infrastructure Inc. Questor Technology Inc. RE Royalties Ltd.Thermal Energy International Inc.TransAlta Renewables Inc. Vitreous Glass Inc.Westport Fuel Systems Inc. Xebec Adsorption Inc.
NOYESNONONONONONONONONONONOYESNONONONONONONO
NOYESNONONONOYESNONONONONONOYESNONONONONONONO
NONONONONONONONONONONONONONONONONONONONONO
NONONONONONONONONONONONONONONONONONONONONO
NONONONONONONONONONONONONONONONONONONONONO