Keys to Performance Excellence
16
2008 Annual Report Keys to Performance Excellence
Transcript of Keys to Performance Excellence
2008 Annual Report
Keys to PerformanceExcellence

Charleston Water System is a public water and wastewater utility that serves the Greater Charleston area.
We provide drinking water to more than 400,000 people across three counties, including wholesale water service to ten neighboring utilities and municipalities. Our drinking water comes from the Bushy Park Reservoir and the Edisto River and is treated at our Hanahan Water Treatment Plant.
Our wastewater system serves some 180,000 people, most of which are inside the City of Charleston, but we also provide wholesale purchased treatment to three municipalities and a public service district. Our two wastewater treatment plants discharge clean water into the Charleston Harbor.
Officially known as the Commissioners of Public Works of the City of Charleston, we are governed by an elected Board of Commissioners, which meets monthly. Daily operations are carried out by our staff of 450 associates.
We are proud to be ISO 14001 certified for environmental management. Our services protect public health and the environment, provide fire protection, and support our economy and quality of life.
About Us
Our MissionIs to protect public health and enhance the environment of our service community by providing clean water services of exceptional quality and value.
Our Vision Is to become, by 2012, an organization worthy of a South Carolina Governor’s Quality Award achieved through teamwork, customer focus and performance excellence.
Key Performance Indicators Our Strategic Plan includes 27 key performance indicators, or KPIs, that measure our performance against targets based on industry best practices. Many of these KPIs and the 2008 results are listed throughout this report.

Dear Friends,
The last year was defined by the economic recession, but as a provider of essential services, Charleston Water System has weathered the downturn with a focus on improving our processes and controlling expenses.
The effect of the economy is most apparent in the number of new connections to our water system. In 2007—the height of the new home construction boom—we added 3,070 accounts, compared to 1,740 in 2008. Customers are also using less water: The average monthly water use for our residential water accounts dropped from 6,000 to 5,200 gallons, a statistic that may have as much to do with greater awareness of water conservation as the economy. But that’s only part of the story. Charleston Water System maintains a strong financial position, one that is supported by a strong and diverse customer base, conservative budgeting, defined expense controls, and a rate structure that supports our capital improvements.
Difficult economic times provide an opportunity to find ways to work harder and smarter. The pursuit of our Vision led us to the Malcolm Baldrige Criteria for Performance Excellence, a nationally recognized standard for organizational excellence, which we are using to improve operations for the benefit of our customers. The influence of this journey is reflected in many of our initiatives, from establishing key performance indicators to identifying and improving key processes.
For Charleston Water System, it is this effort of continual improvement, not the economic recession, that most defines the last year, and will continue to define our future.
Sincerely,
Charleston Water System
OfficersAndy Fairey, Chief Operating Officer; Dorothy Harrison, Chief Adminis-trative Officer; Kin Hill, P.E., Chief Executive Officer; Mark Cline, P.E., Capital Projects Officer; Wesley Ropp, CMA, Chief Financial Officer
Board of CommissionersThomas Pritchard, Chairman; David E. Rivers, Vice Chairman; William E. Koopman, Jr, Commissioner; Louis Waring, Charleston City Council; Joseph P. Riley, Jr., Mayor, City of Charleston
1

Cheers!From supporting our economy to fighting fires and protecting public health, Charleston tap water touches thousands of lives every day.
In this photo: Charleston Water System associates Furman Middleton, Becky Thames, and Dave Schach.
2

Partnership for Safe WaterCharleston Water System is a proud member of the Partnership for Safe Water, a voluntary program for utilities committed to treating water beyond what is required by regulations. Charleston Water joined the Partnership in 1995, received the prestigious Director’s Award in 2004, and was awarded the Five-Year Director’s Award in June 2008.
Statistical Process ControlThe Hanahan Water Treatment Plant has implemented Statistical Process Control, or data trend analysis, to improve processes and reduce cost. From instrumentation to process adjustments, the plant’s engineers, maintenance staff, and operators are using this data-based decision model to improve efficiency.
Drinking Water Treatment and Distribution
2008 Key Stats
Retail Water Accounts 105,795
Miles of Water Pipe 1,694
Fire Hydrants 8,135
Billion gallons of water sold 18
Treatment Plant 1
The Survey Says...In a 2008 telephone survey of more than 400 customers, 97% of respondents said we’re doing a good job or very good job of providing reliable service, and 94% agreed or strongly agreed that our water is safe and healthy to drink.
Key Performance IndicatorsKPI 2008 Target 2008 ActualDrinking Water Compliance Rate Percentage of time in compliance with drinking water standards & regulations.
100% 100%
Water Distribution System Integrity Number of water line breaks/leaks per 100 miles of pipe.
30 10
Lincolnville
3

Award-Winning TreatmentCharleston Water System’s Plum Island Wastewater Treatment Plant returns clean water to the Charleston Harbor. The facility was awarded the Gold Peak Performance Award by the National Association of Clean Water Agencies (NACWA) for no permit violations in 2008.
4

Wastewater Collection and TreatmentInfiltration & Inflow ReductionGround and storm water that finds its way into the sewer system takes up capacity in sewer lines and increases treatment costs. An initiative to find and eliminate these sources of infiltration and inflow has removed more than 2.4 million gallons per day of extraneous flow, resulting in an annual cost savings of over $400,000.
Researching Pharmaceutical Compounds in WaterPharmaceutical compounds in our nation’s waterways is a topic of concern that has gained public attention. Charleston Water System is participating in a two-year study by the National Oceanic and Atmospheric Administration (NOAA), the College of Charleston, and the SC Sea Grant Consortium. Researchers are studying samples from the Plum Island Wastewater Treatment Plant to find out which compounds are present in the wastewater and at what levels—and how effective the treatment process is at removing these compounds.
2008 Key Stats
Retail Sewer Accounts 47,546
Miles of Gravity Pipe 526
Miles of Main Force 80
Pump Stations 188
Wastewater Treatment Plants 2
Billion Gallons Treated/year 8.27
Million Gallons Treated/day (avg.) 22.58
Key Performance IndicatorsKPI 2008 Target 2008 Actual
Wastewater Treatment Effectiveness Rate Percent of time in compliance with effluent quality requirements.
100% 100%
Wastewater Collection System Integrity Number of sewer line break/leaks per 100 miles of pipe.
10 5
Retail WastewaterCollection Area
Wholesale WastewaterService Area
5
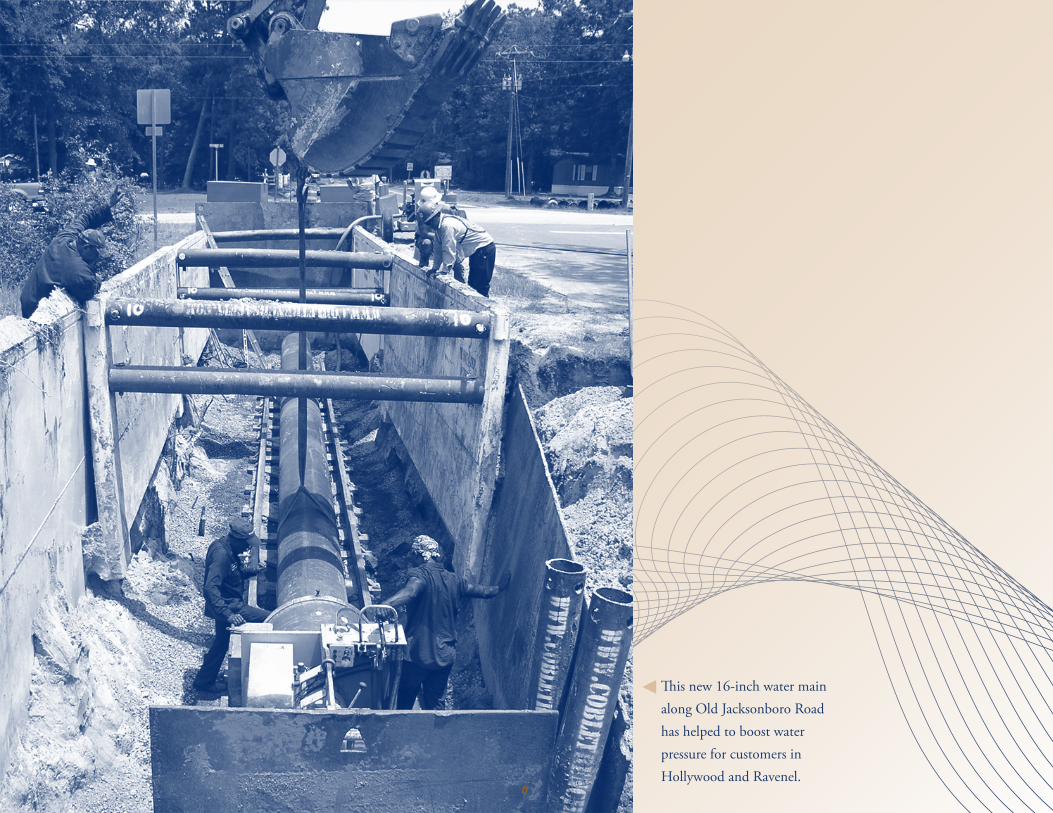
This new 16-inch water main along Old Jacksonboro Road has helped to boost water pressure for customers in Hollywood and Ravenel.
6

Capital Improvement ProgramMeeting future demands for water and sewer services requires investingin our infrastructure. In 2006, Charleston Water System began work on a $155.5 million Capital Improvement Program, which includes 45 high-priority water and sewer projects identified through our master planning studies. The program is funded by a bond issue and water and sewer rate increases; it includes the rehabilitation of existing infrastructure, new infrastructure, and expansion of treatment facilities to meet the demands of growth and new regulations.
Engineering ExcellenceCharleston Water System and the engineering firm Hussey, Gay, Bell, and DeYoung were awarded the Palmetto Award by the American Society of Engineers for the Second Cooper River Crossing water line project. When it was completed in 2007, the three-mile, 40-inch steel pipe was the longest directional drill project of its size in the nation. The project cost $16.5 million.
Investing in Our Infrastructure
Key Performance IndicatorsKPI 2008 Target 2008 ActualWater Distribution System Renewal & Replacement Rate Measures needed infrastructure replacement rates based on target lives of assets.
20% 29%
Wastewater Collection System Renewal & Replacement Rate Same calculation as above, but for wastewater collection system assets.
10% 28%
Projects Completed in 2008Water
Grimball Rd. 30-inch Transmission Main $3,600,000Hollywood/Ravenel 16-inch Water Main $3,000,000Stono River Crossing Replacement $5,750,000Rantowles Creek Water Main Replacement $820,000MUSC Area Water Main Improvements $920,000
SewerWastewater Tunnel Replacement Project: Phase III (Cooper Tunnel) $48,500,000 Phase IV (Daniel Island Extension) $30,800,000Daniel Island Wastewater Treatment Plant: Odor Control Improvements $920,000
Under Construction in 2008Water
Peninsula Trunk Main $17,700,000Lower King Street Water Main Replacement $980,000Windermere Area Water Main Replacement $350,000Hanahan Water Treatment Plant Projects: New Chemical Storage and Filter Building $21,500,000 Electrical Distribution System Upgrade $7,900,000 Elevated Filter Backwash Storage Tank $5,800,000
SewerPlum Island Wastewater Treatment Plant: Electrical System and Blower Improvements $12,500,000
7

Improvement ProgramsEach year, Charleston Water System lists and ranks our activities that can impact the environment—positively or negatively—and develops improvement programs to better control potential negative environmental impacts. These programs include goals, objectives, and targets, and progress is reported throughout the year. Below is a sampling of 2008 improvement programs.
2008 EMS Improvement ProgramsAsset Management Program Design/ImplementationRechargeable Battery InitiativeAerial Water Main AssessmentStorm Drain/Sanitary Sewer Conflict RehabilitationWastewater Treatment Solids Removal OptimizationTV Camera Inspection of Sewer Mains
Goose Creek Reservoir 8

Protecting and Improving Our EnvironmentCelebrating 10 Years of Environmental ManagementIn 1998, Charleston Water System implemented an Environmental Management System (EMS) to help manage and reduce our impact on the environment.
Our EMS program helped us become the first water and wastewater utility in the nation to achieve certification under the international standard for environmental management—ISO 14001. The EMS has provided a foundation for implementing the Baldrige Criteria and pursuing our Vision.
SC Environmental Excellence ProgramCharleston Water System is a member of this voluntary program that recognizes organizations that demonstrate superior environmental performance through pollution prevention, energy and resource conservation, and the use of an environmental management system.
Key Performance IndicatorsKPI 2008 Target 2008 ActualDistribution System Water Loss Percentage of unaccounted for water loss. 10% 9.2%
Sewer System Overflow Rate Number of sewer overflows per 100 miles of sewer pipe.
2.00 1.18
Promoting WaterSenseSM
Charleston Water has partnered with the U.S. Environmental Protection Agency’s WaterSense program, a voluntary public-private partnership initiative with a mission to protect the future of our nation’s water supply by promoting and enhancing the market for water-efficient products and services.
Going Green!As a member of the City of Charleston’s Green Committee, Charleston Water is helping promote sustainable, environmentally friendly initiatives. Our internal Green Team, made up of associates from various departments, recommends ideas on how to green our workplace.
9

A water fountain now greets walkers, runners, and cyclists on the Charleston side of the Arthur Ravenel Bridge’s pedes-trian path. The fountain was sponsored by Dixon-Hughes, LLC, the Coastal Community Foundation, the Charleston Running Club, and Charleston Water System.
Wilbur White mans the Water Wheel of Trivia at the annual First Day Festival celebrating the beginning of the school year. Charleston Water System provides drinking water and educational activities for various community events throughout the year.
10

Serving Our Customers and Our Community
Key Performance IndicatorsKPI 2008 Target 2008 ActualOverall Customer Satisfaction Rating Average overall ranking of CWS on a scale of 1-10 (10=Excellent) by respondents to biannual survey.
7.5 8.0
Community Outreach ActivitiesNumber of community outreach activities (festivals, career fairs, etc.).
36 31
Customer ServiceWe’re continually working to better serve our customers. In 2008, we introduced a new customer service phone system that allows customers to pay their bill over the phone. We also implemented a new interface for our computer system to help staff better respond to customer needs. We continued the gradual installation of automated meters with an additional 25,000 meters. Nearly half of our customers are now served by these accurate, easy-to-read meters.
Operation Round UpOur customers can give back to the community by choosing to round up their water bill to the nearest dollar. Customers get to choose which program their round-up donations will benefit—Charleston Water’s Good Neighbor Program, which assists low-income customers in paying their water bill, or the Charleston-based non-profit Water Missions International.
Preserving our HistoryThe South Carolina State Historical Records Advisory Board presented Charleston Water System with its Award of Merit for preservation of historical records.
Our vast assortment of old photos and documents date back to the late 1800s and chronicle the City’s efforts to find a suitable supply of water for Charleston’s growing population.
Some of these images, along with an overview of our history, are featured on our website, www.charlestonwater.com.
This stock certificate was issued in 1880 by Charleston Water System’s predecessor, the Charleston Water Works Company
11
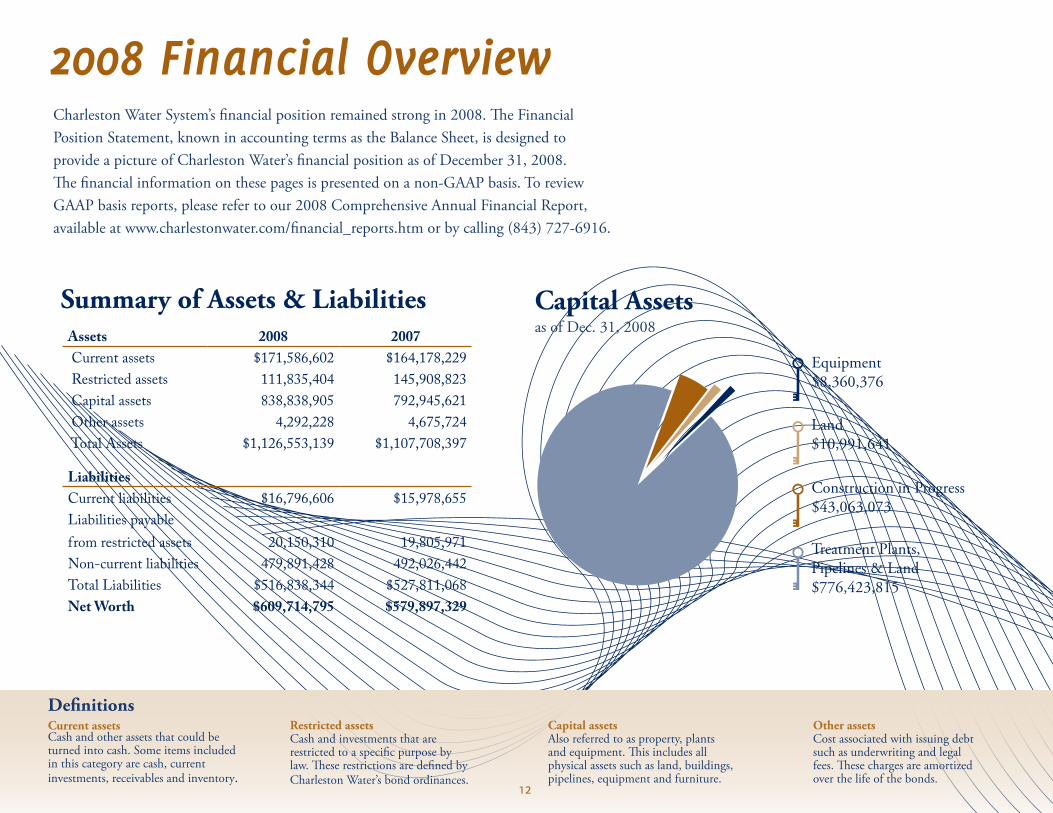
Charleston Water System’s financial position remained strong in 2008. The Financial Position Statement, known in accounting terms as the Balance Sheet, is designed to provide a picture of Charleston Water’s financial position as of December 31, 2008. The financial information on these pages is presented on a non-GAAP basis. To review GAAP basis reports, please refer to our 2008 Comprehensive Annual Financial Report, available at www.charlestonwater.com/financial_reports.htm or by calling (843) 727-6916.
2008 Financial Overview
Assets 2008 2007 Current assets $171,586,602 $164,178,229 Restricted assets 111,835,404 145,908,823 Capital assets 838,838,905 792,945,621 Other assets 4,292,228 4,675,724 Total Assets $1,126,553,139 $1,107,708,397
LiabilitiesCurrent liabilities $16,796,606 $15,978,655 Liabilities payable from restricted assets
20,150,310
19,805,971
Non-current liabilities 479,891,428 492,026,442Total Liabilities $516,838,344 $527,811,068Net Worth $609,714,795 $579,897,329
Summary of Assets & Liabilities Capital Assets as of Dec. 31, 2008
Definitions Current assetsCash and other assets that could be turned into cash. Some items included in this category are cash, current investments, receivables and inventory.
Restricted assetsCash and investments that are restricted to a specific purpose by law. These restrictions are defined by Charleston Water’s bond ordinances.
Capital assetsAlso referred to as property, plants and equipment. This includes all physical assets such as land, buildings, pipelines, equipment and furniture.
Other assetsCost associated with issuing debt such as underwriting and legal fees. These charges are amortized over the life of the bonds.
Land$10,991,641
Equipment$8,360,376
Construction in Progress$43,063,073
Treatment Plants, Pipelines & Land$776,423,815
12

Revenues
$10,000,000
$20,000,000
$30,000,000
$40,000,000
$50,000,000
Investment Income$8,218,472
Wastewater Sales$38,900,130
Water Sales$49,468,039
Other/Misc$4,003,525
Total Revenues $100,590,166
Charleston Water System’s Bond RatingsMoody’s Aa3 Received upgrade in 2001
S&P AA Received upgrade in 2006
Fitch AA First rated in 2006
Key Performance IndicatorKPI 2008 Target 2008 ActualDebt Ratio - With Impact Fees (Earnings Test)A ratio of annual net earnings to annual debt payments.
1.53 1.77
Current liabilitiesPayments owed by Charleston Water to others who supply a service or good, which are due within twelve months.
Liabilities payable from restricted assetsThe amount of bond debt that is due within the next year.
Non-current liabilitiesThe amount of bonds that has been issued and is still owed. This amount is due in payments beyond one year.
Net worthThe difference between the assets owned and the liabilities that must be paid.
$5,000,000
$10,000,000
$15,000,000
$20,000,000
$25,000,000
$30,000,000Maintenance & Repairs$7,659,716
Personnel$28,053,317
Debt Services$19,387,111
Other$2,390,320
Office Expenses$2,869,927
Utilities$4,287,420
Depreciation$21,115,727
Contractual Services$3,668,520
Intergovernmental Fee$1,095,000
Cash Reserves for Future Capital Improvements$10,063,108
Expenses & Cash ReservesTotal Expenses $100,590,166Expenses & Cash Reserves2008 Financial Overview
13

103 St. Philip St. 843.727.6800
www.charlestonwater.com