Keynote Presentation April 19, 2018 - ERM) Symposium · 2018-11-08 · The evolution of ERM State...
25
James Lam President, James Lam & Associates Director and Chair, Risk Oversight Committee, E*TRADE Financial Director, RiskLens SOA 2018 ERM Symposium Keynote Presentation April 19, 2018
Transcript of Keynote Presentation April 19, 2018 - ERM) Symposium · 2018-11-08 · The evolution of ERM State...

James LamPresident, James Lam & AssociatesDirector and Chair, Risk Oversight Committee, E*TRADE FinancialDirector, RiskLens
SOA 2018 ERM SymposiumKeynote PresentationApril 19, 2018

Group question
“In your mind’s eye, what is the shape of risk?”
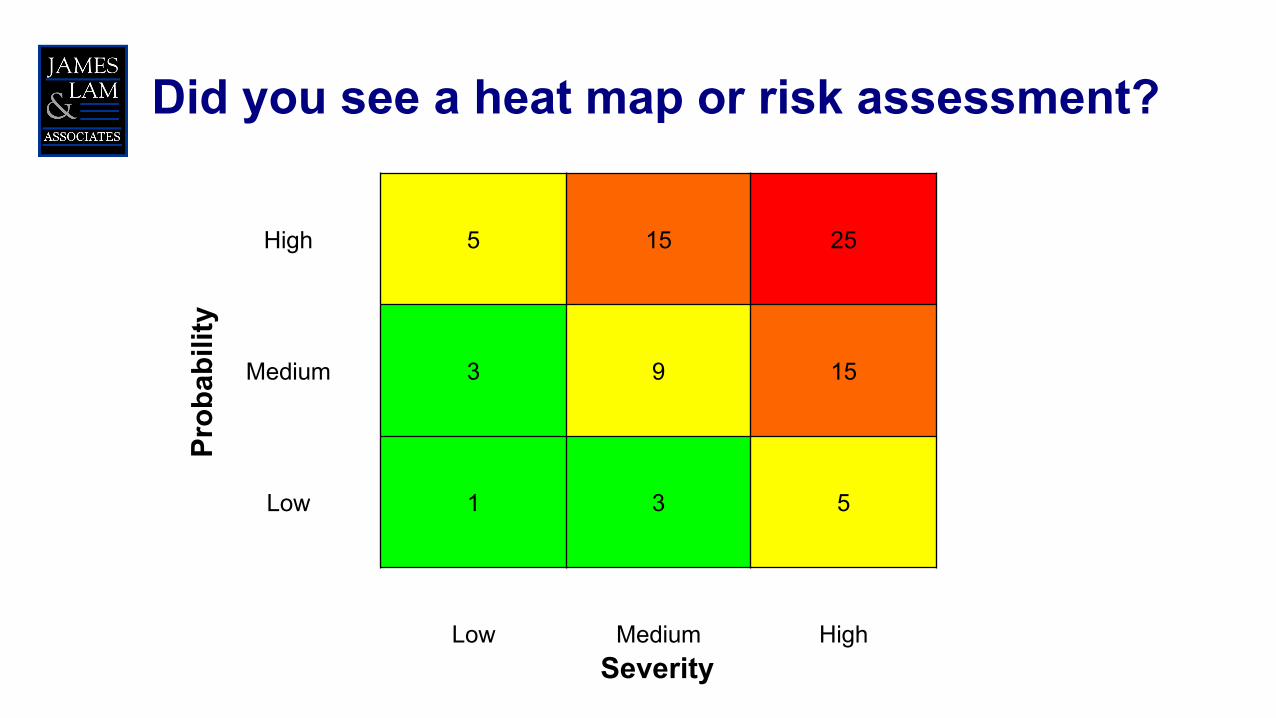
Did you see a heat map or risk assessment?
High 5 15 25
Medium 3 9 15
Low 1 3 5
Low Medium High
Prob
abili
ty
Severity
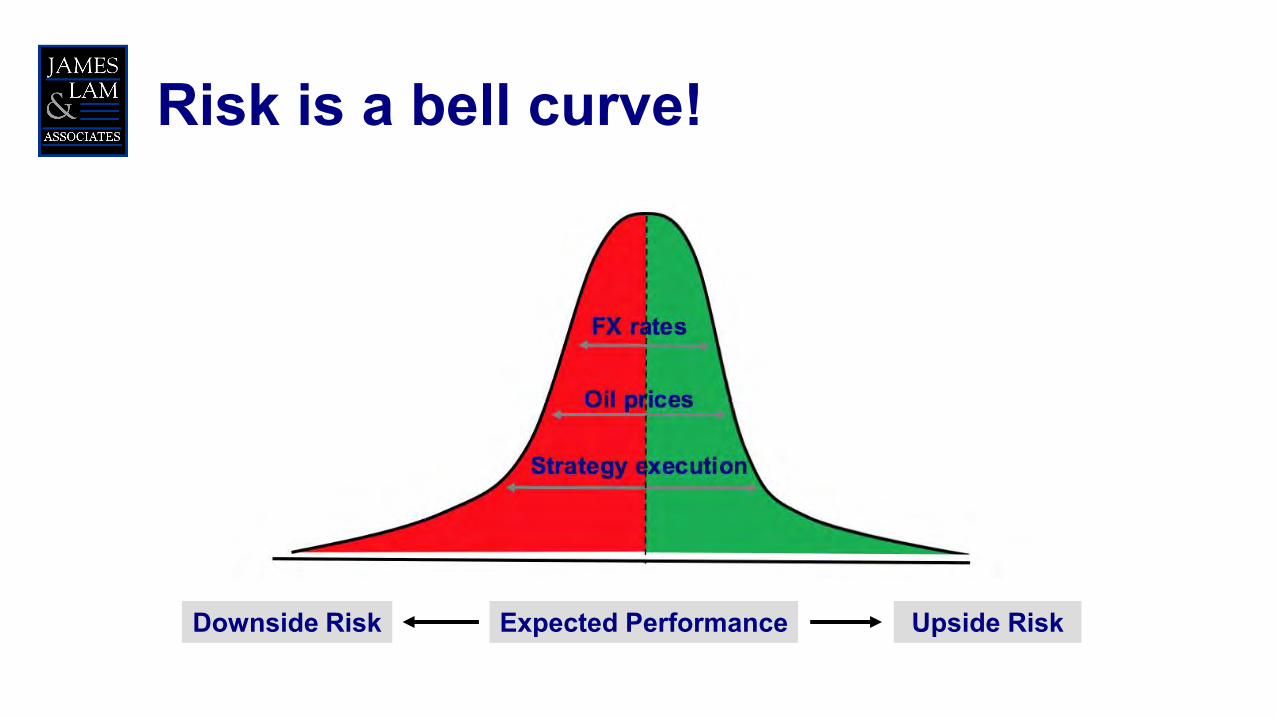
Risk is a bell curve!
Upside RiskDownside Risk Expected Performance

Risks come in different shapes and sizes

3. Manage the upside• Business plan
execution • Strategic growth
& innovation• Capital allocation
Risk management is about optimizing the bell curve
2. Manage the expected• Risk acceptance/ avoidance • Pricing for the cost of risk
1. Manage the downside• Risk mitigation • Risk transfer • Risk appetite • Capital adequacy

ERM should be defined as a value-added function
• Risk is a variable that can cause deviation from an expected outcome.
• Enterprise risk management is an integrated and continuousprocess for managing enterprise-wide risks‒strategic, financial, operational, compliance, and reputational risks‒in order to minimize unexpected performance variance and maximize firm value.
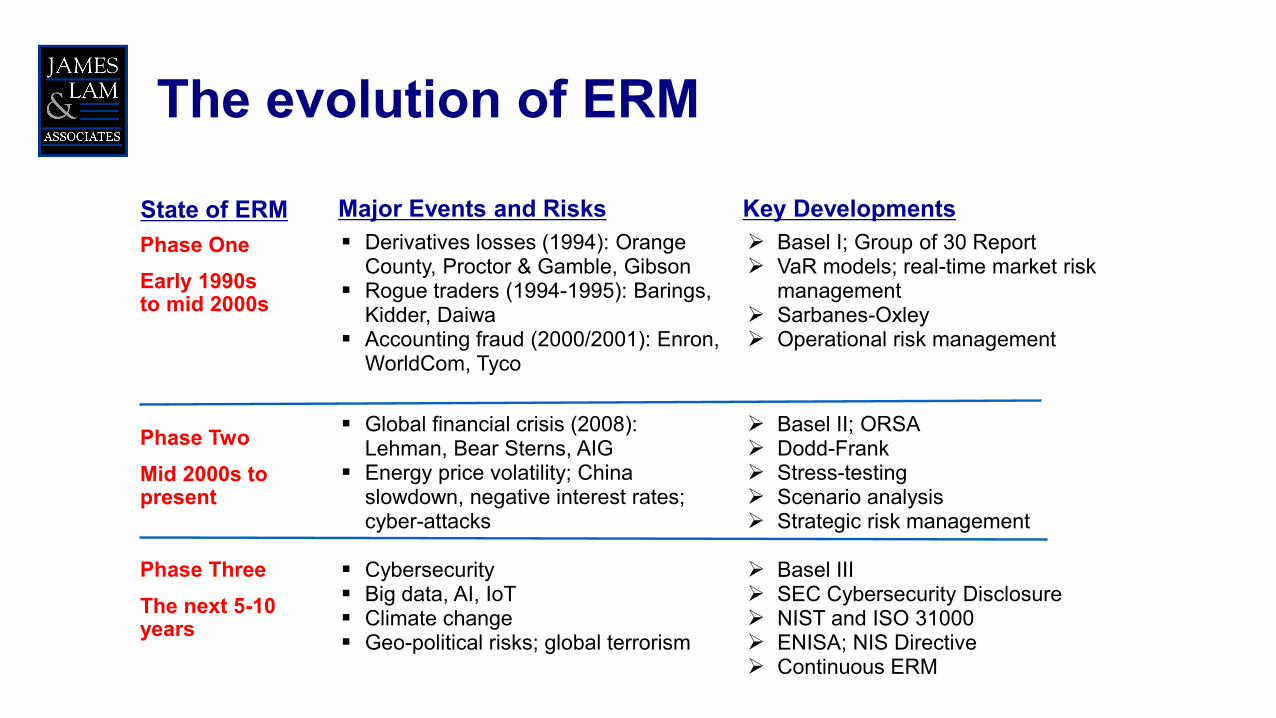
The evolution of ERM
Major Events and Risks Key Developments State of ERMPhase OneEarly 1990s to mid 2000s
Phase TwoMid 2000s to present
Phase ThreeThe next 5-10 years
Derivatives losses (1994): Orange County, Proctor & Gamble, Gibson
Rogue traders (1994-1995): Barings, Kidder, Daiwa
Accounting fraud (2000/2001): Enron, WorldCom, Tyco
Global financial crisis (2008): Lehman, Bear Sterns, AIG
Energy price volatility; China slowdown, negative interest rates; cyber-attacks
Cybersecurity Big data, AI, IoT Climate change Geo-political risks; global terrorism
Basel I; Group of 30 Report VaR models; real-time market risk
management Sarbanes-Oxley Operational risk management
Basel II; ORSA Dodd-Frank Stress-testing Scenario analysis Strategic risk management
Basel III SEC Cybersecurity Disclosure NIST and ISO 31000 ENISA; NIS Directive Continuous ERM
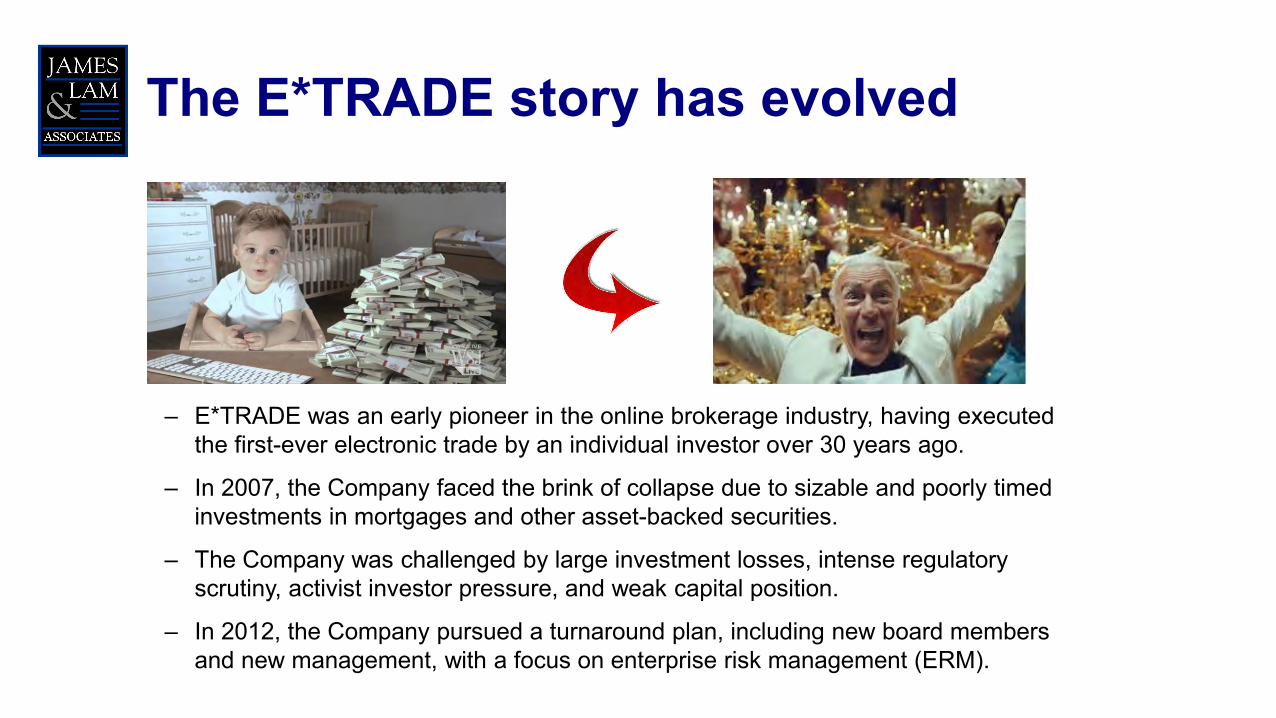
The E*TRADE story has evolved
– E*TRADE was an early pioneer in the online brokerage industry, having executed the first-ever electronic trade by an individual investor over 30 years ago.
– In 2007, the Company faced the brink of collapse due to sizable and poorly timed investments in mortgages and other asset-backed securities.
– The Company was challenged by large investment losses, intense regulatory scrutiny, activist investor pressure, and weak capital position.
– In 2012, the Company pursued a turnaround plan, including new board members and new management, with a focus on enterprise risk management (ERM).
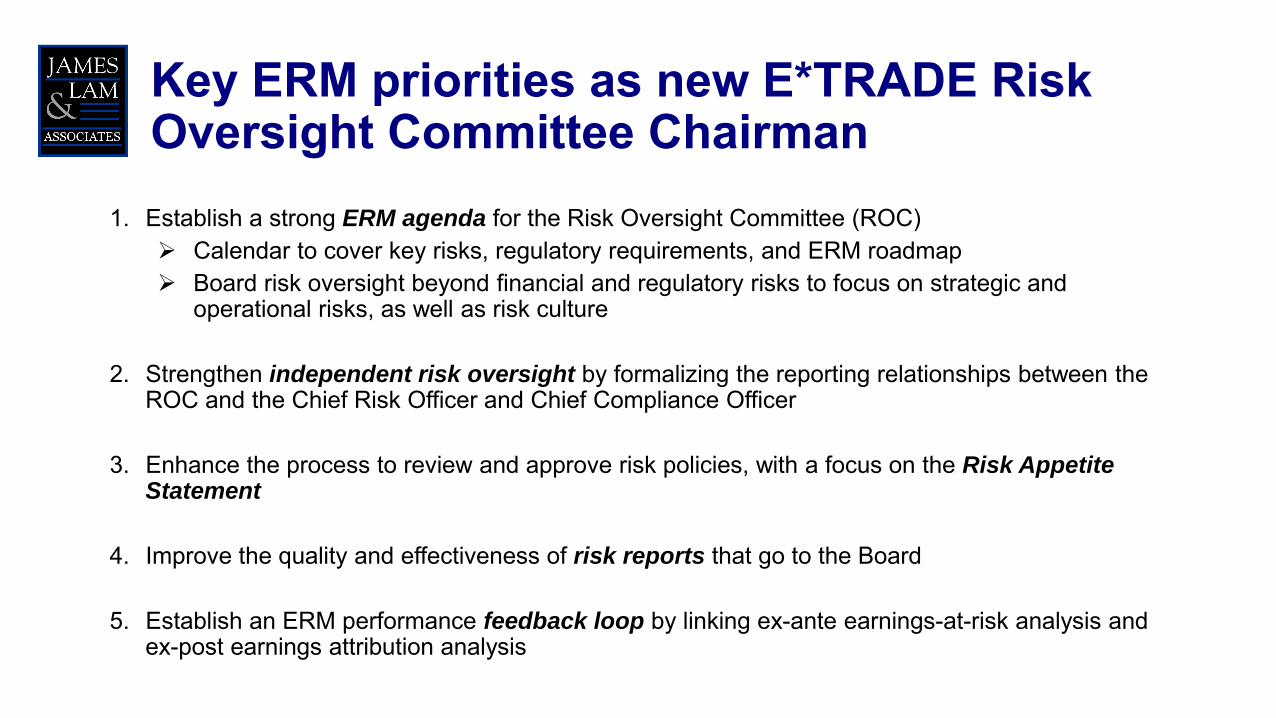
1. Establish a strong ERM agenda for the Risk Oversight Committee (ROC) Calendar to cover key risks, regulatory requirements, and ERM roadmap Board risk oversight beyond financial and regulatory risks to focus on strategic and
operational risks, as well as risk culture
2. Strengthen independent risk oversight by formalizing the reporting relationships between the ROC and the Chief Risk Officer and Chief Compliance Officer
3. Enhance the process to review and approve risk policies, with a focus on the Risk Appetite Statement
4. Improve the quality and effectiveness of risk reports that go to the Board
5. Establish an ERM performance feedback loop by linking ex-ante earnings-at-risk analysis and ex-post earnings attribution analysis
Key ERM priorities as new E*TRADE Risk Oversight Committee Chairman
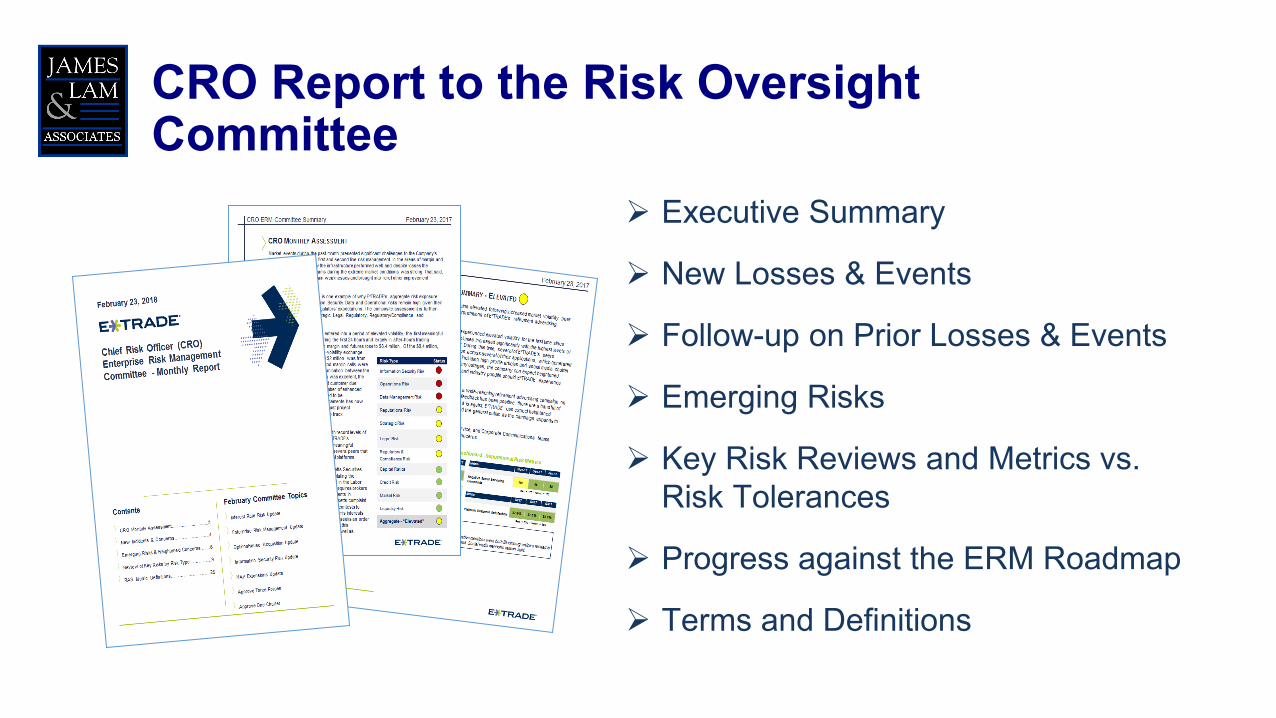
CRO Report to the Risk Oversight Committee
Executive Summary
New Losses & Events
Follow-up on Prior Losses & Events
Emerging Risks
Key Risk Reviews and Metrics vs. Risk Tolerances
Progress against the ERM Roadmap
Terms and Definitions
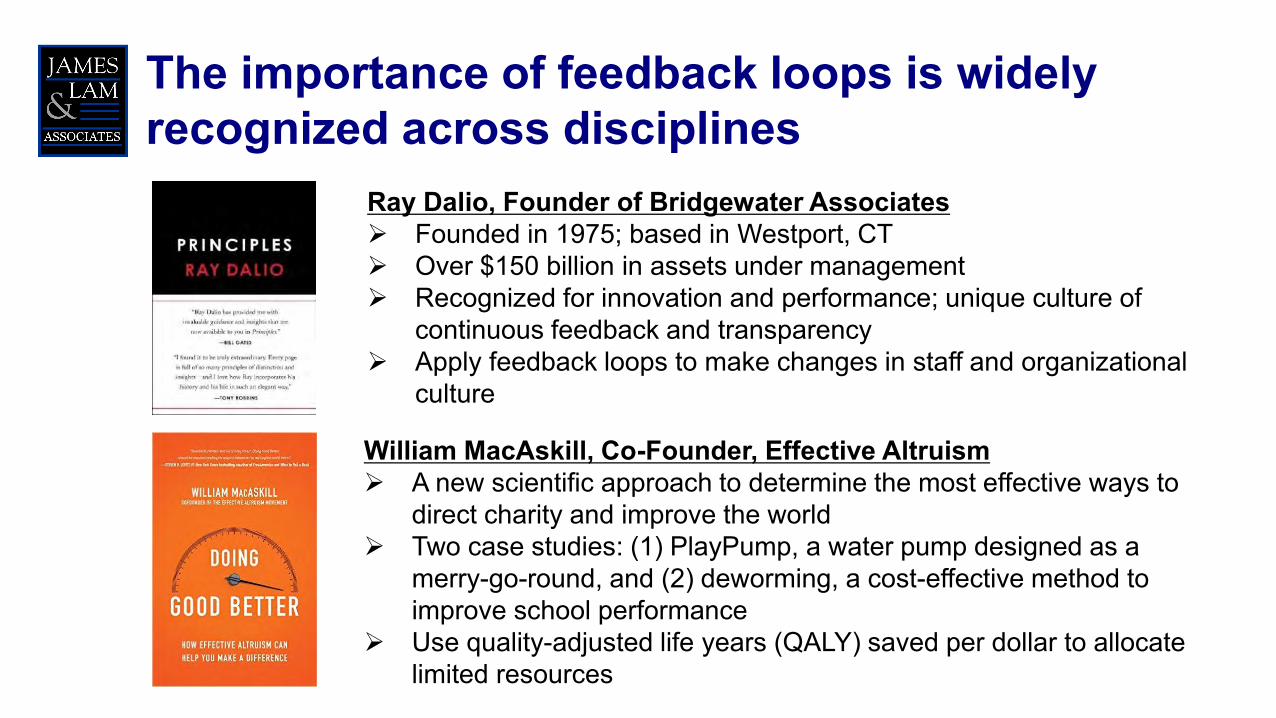
The importance of feedback loops is widely recognized across disciplines
Ray Dalio, Founder of Bridgewater Associates Founded in 1975; based in Westport, CT Over $150 billion in assets under management Recognized for innovation and performance; unique culture of
continuous feedback and transparency Apply feedback loops to make changes in staff and organizational
culture
William MacAskill, Co-Founder, Effective Altruism A new scientific approach to determine the most effective ways to
direct charity and improve the world Two case studies: (1) PlayPump, a water pump designed as a
merry-go-round, and (2) deworming, a cost-effective method to improve school performance
Use quality-adjusted life years (QALY) saved per dollar to allocate limited resources
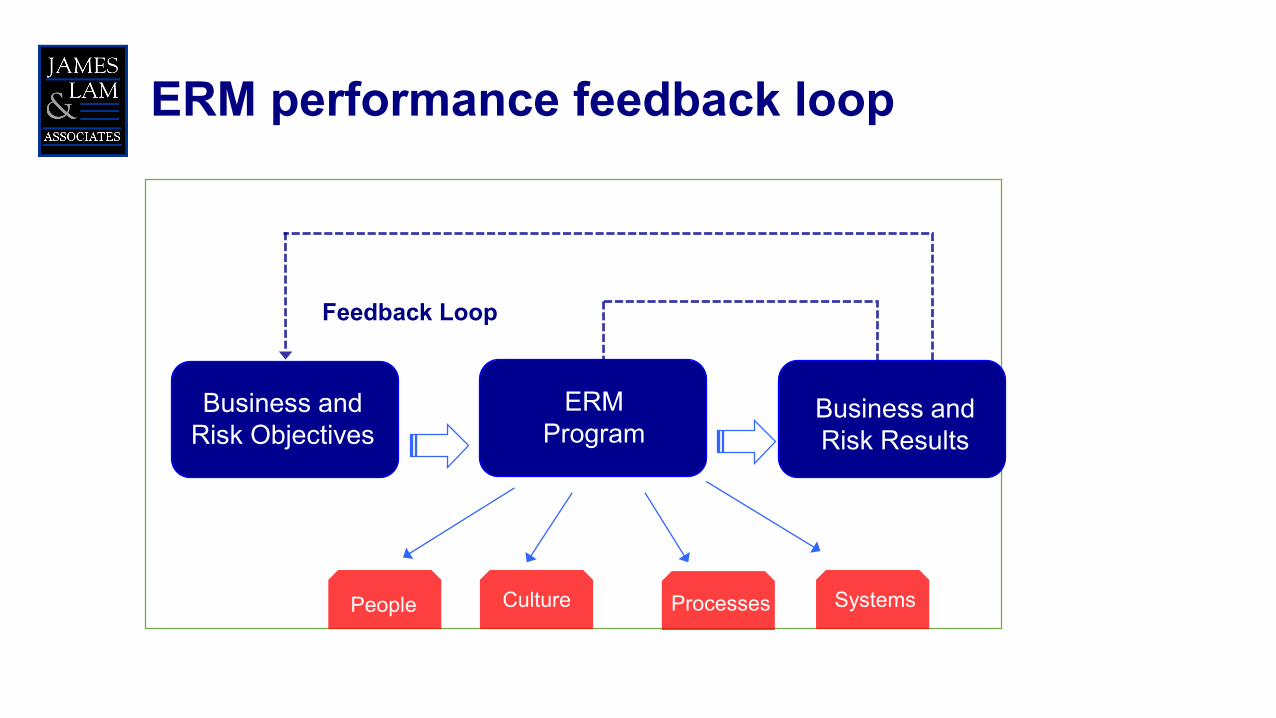
ERM performance feedback loop
Business and Risk Objectives ERM
FrameworkBusiness and Role Performance
ERM Program
Business and Risk Results
People Processes Systems
Feedback Loop
ProcessesPeople Culture Systems

Key question: how do you know if risk management is working effectively?
Worst CaseEPS = ($1.00)
ExpectedEPS = $3.00
Earnings-at-Risk Analysis Earnings Attribution Analysis
1. Business Plan: $2.002. Interest Rates: $1.003. Oil Price: $0.504. Key Initiatives: $0.305. Expense Control: $0.20
$4.00
Expected EPS : $3.00Actual EPS: $1.00
Difference: $2.00
Business Plan: $1.00Interest Rates: $0.50Key Initiatives: $0.10Unforeseen Factors: $0.40
$2.00Key Questions:1. Did we identify the key risk
factors?2. Were our EPS sensitivity
analyses accurate?3. Did risk management impact
our risk/return positively?

The “Lam Report” (illustrative data)
$8.0
8.0%
$5.0
$2.0
$63.0
3.6%
Pre-Tax Income (Downside / Upside) $690 M$315 M
Credit
Severity (%)
3.0%2.0%Default Rate (%) 4.0%
25.0%35.0% 15.0%
30.0%
Balance Sheet Size ($B) $60.0 $70.0$65.0
Business Drivers
Revenue / Growth ($B) $1.5 $4.5$3.0
New Assets ($B) $9.0 $12.0$9.0
Customer Attrition (%) 10.0% 5.0%6.0%
Operating Costs ($B) $4.0 $8.0$6.0
2018 Earnings Sensitivity ($M)Earnings Sensitivity Downside 2018 Budget Upside
$500 M2018 Budget 2017 Actual
($30)
($45)
($10)
($5)
($25)
($40)
($30)
$35
$45
$10
$5
$25
$40
$30
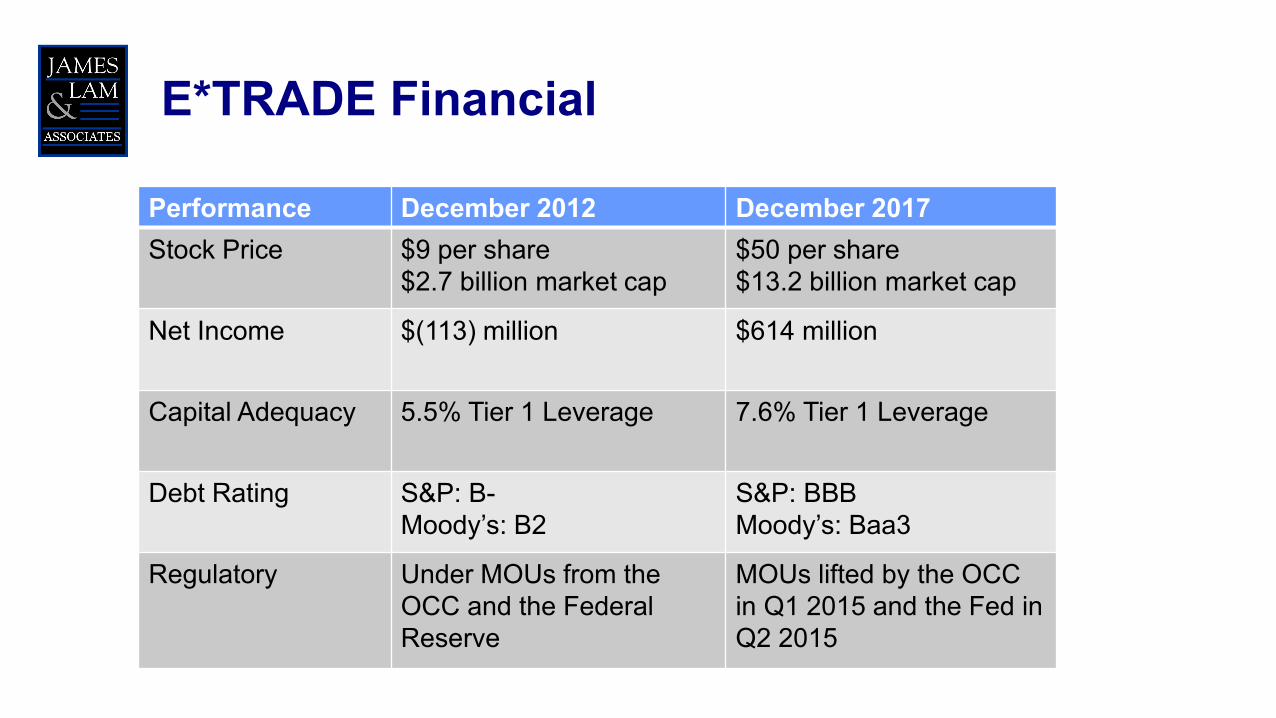
Performance December 2012 December 2017Stock Price $9 per share
$2.7 billion market cap$50 per share$13.2 billion market cap
Net Income $(113) million $614 million
Capital Adequacy 5.5% Tier 1 Leverage 7.6% Tier 1 Leverage
Debt Rating S&P: B-Moody’s: B2
S&P: BBBMoody’s: Baa3
Regulatory Under MOUs from theOCC and the Federal Reserve
MOUs lifted by the OCCin Q1 2015 and the Fed in Q2 2015
E*TRADE Financial
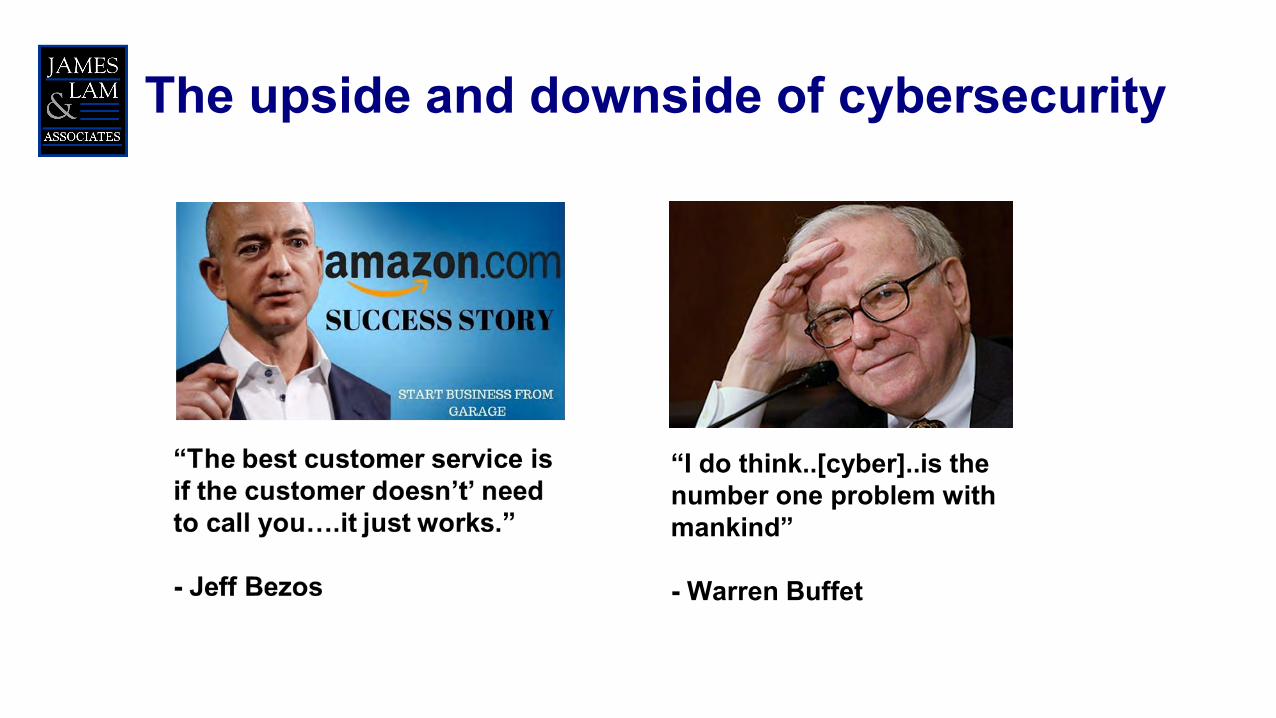
The upside and downside of cybersecurity
“I do think..[cyber]..is the number one problem with mankind”
- Warren Buffet
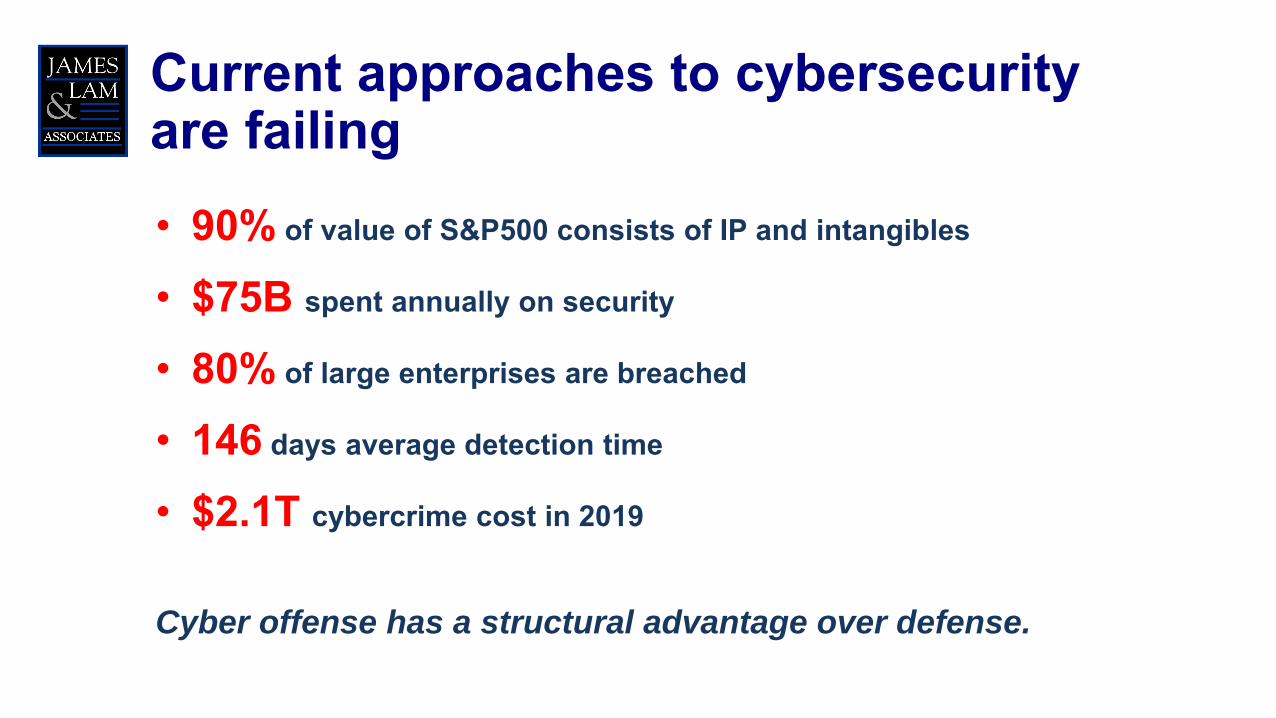
Current approaches to cybersecurity are failing• 90% of value of S&P500 consists of IP and intangibles
• $75B spent annually on security
• 80% of large enterprises are breached
• 146 days average detection time
• $2.1T cybercrime cost in 2019
Cyber offense has a structural advantage over defense.

ERM vs. NIST Framework
What is missing in NIST?• Cyber risk governance• Cybersecurity risk policy and strategy• Cyber risk quantification• Risk appetite tolerance• Reporting and performance feedback
19
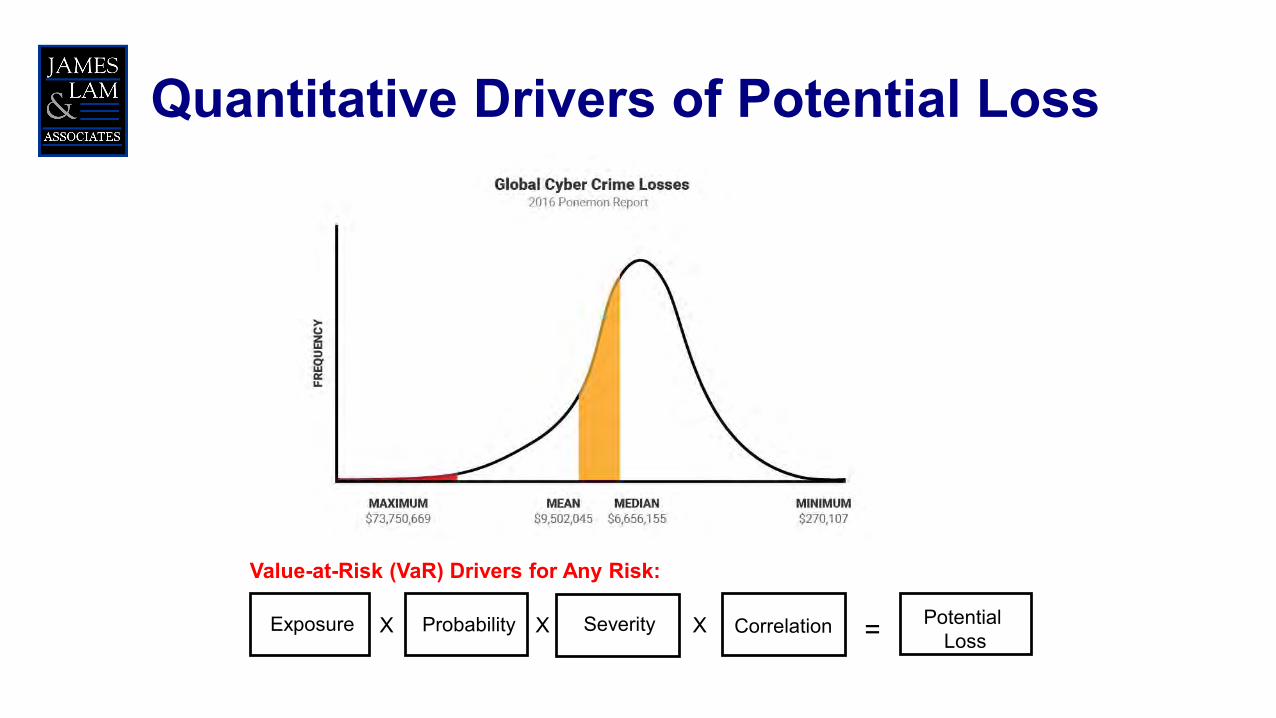
Quantitative Drivers of Potential Loss
PotentialLoss
Value-at-Risk (VaR) Drivers for Any Risk:
Exposure Probability Severity CorrelationX XX =
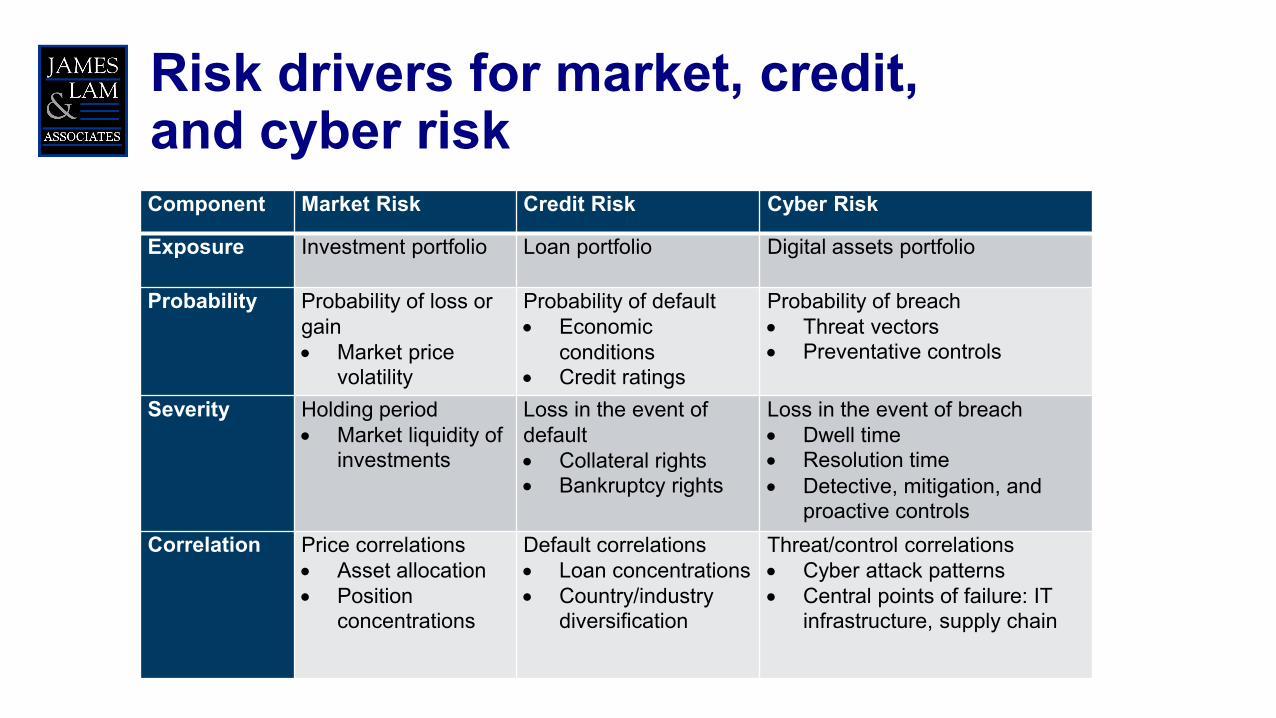
Risk drivers for market, credit, and cyber riskComponent Market Risk Credit Risk Cyber Risk
Exposure Investment portfolio Loan portfolio Digital assets portfolio
Probability Probability of loss or gain Market price
volatility
Probability of default Economic
conditions Credit ratings
Probability of breach Threat vectors Preventative controls
Severity Holding period Market liquidity of
investments
Loss in the event of default Collateral rights Bankruptcy rights
Loss in the event of breach Dwell time Resolution time Detective, mitigation, and
proactive controlsCorrelation Price correlations
Asset allocation Position
concentrations
Default correlations Loan concentrations Country/industry
diversification
Threat/control correlations Cyber attack patterns Central points of failure: IT
infrastructure, supply chain

Example: cybersecurity metrics
Key Controls • Enterprise-wide patches deployed within SLA• Average time to close a cyber case (days) • % system downtime; time to recover • Mission critical applications with a tested
disaster recovery solution • Percent of key controls rated below adequate
Program Effectiveness • Company security rating • Average time to detect (dwell time)• Average time to remediate• Unresolved critical Pentest findings • Open Audit issues• Open Regulatory Findings (MRAs)• NIST program maturity assessment• Performance of table-top exercises and third-
party testing
Threat Environment• E-ISAC Cyber Threat Trend• NCFTA Cyber Fraud Threat • Global Computer Virus & Spyware
Activity
General Information Security• Number of systems and
applications, including those deemed critical
• Value of digital assets, including “crown jewels”
3rd Party Vendor Risk • Number of high risk, critical 3rd
parties • Critical 3rd parties average and
range of security ratings
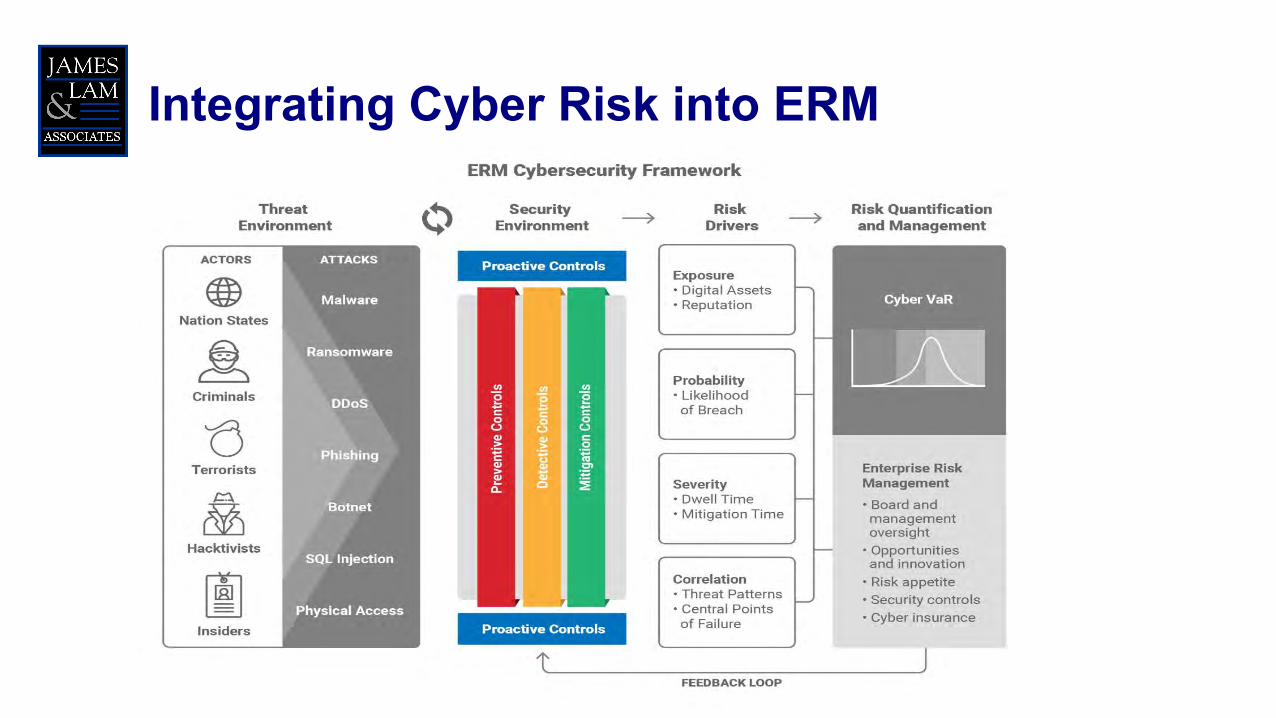
Integrating Cyber Risk into ERM

Key Takeaways
1. Visualize, quantify, and optimize bell curve
2. Board risk oversight should focus on ERM fundamentals: independent oversight, risk appetite, and risk reporting
3. Effective cybersecurity requires better risk quantification and ERM integration
4. Beware of black swans and grey rhinos: invest in preparedness and resilience
5. Establish a performance feedback loop for ERM

Key Success Factors as a Risk Professional: My Top 5 Lessons Learned
Lesson #1: Establish clear and tangible goals
Lesson #2: Develop a “model T” skills set and a branding strategy
Lesson #3: Develop strong communication skills
Lesson #4: Learn to play the corporate game
Lesson #5: Focus on usefulness, not precision