
Keybridge Research LLC 3050 K Street, Suite 220 Washington, D.C. 20007 202.965.9480 How and When...
38
Keybridge Research LLC • 3050 K Street, Suite 220 • Washington, D.C. 20007 • 202.965.9480 How and When Will the Global Economic and Financial Crisis End? ISEO Summer School 26 June 2009 Robert Wescott, Ph.D. Keybridge Research LLC
-
Upload
maya-horry -
Category
Documents
-
view
213 -
download
0
Transcript of Keybridge Research LLC 3050 K Street, Suite 220 Washington, D.C. 20007 202.965.9480 How and When...

Keybridge Research LLC • 3050 K Street, Suite 220 • Washington, D.C. 20007 • 202.965.9480
How and When Will the Global Economic and Financial Crisis
End?
ISEO Summer School26 June 2009
Robert Wescott, Ph.D.Keybridge Research LLC

TOPICS TO COVER
I. Current position of U.S. and world economies
II. What policymakers are doing– Fiscal policy– Monetary policy– Financial rescue package (TARP)– Confidence measures
III. How and when the economic recovery will begin
IV. Risks
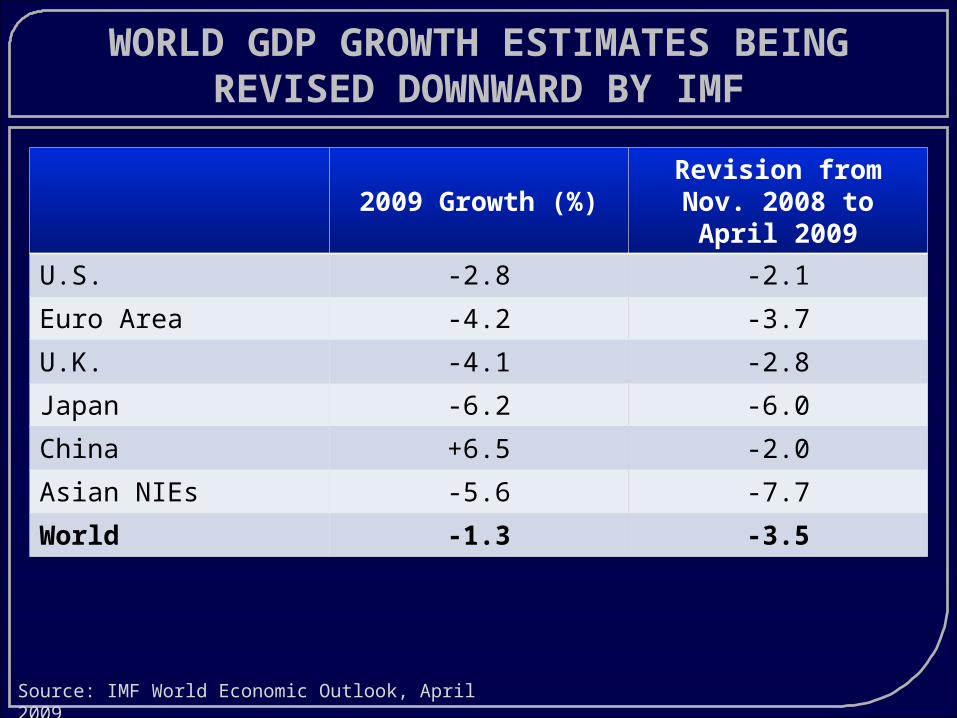
WORLD GDP GROWTH ESTIMATES BEING REVISED DOWNWARD BY IMF
2009 Growth (%)Revision from
Nov. 2008 to April 2009
U.S. -2.8 -2.1
Euro Area -4.2 -3.7
U.K. -4.1 -2.8
Japan -6.2 -6.0
China +6.5 -2.0
Asian NIEs -5.6 -7.7
World -1.3 -3.5
Source: IMF World Economic Outlook, April 2009

U.S. EMPLOYMENT LOSSES: DEEPEST OF ALL RECESSIONS
24 months pre; 24 months post business cycle peak
Current Recession1974 & 1982 Recessions1991 & 2001 Recessions
Non-Farm Payroll Employment During U.S. Recessions
April 2009

NEGATIVE RIPPLE EFFECTS ON CONFIDENCE
Be asked to take a pay cut
Be laid off
Lose some/all health benefits
Your employer may move/go out of
business
Feb 2009
Jan 2008
+12
+6
+4
+1
“Very/somewhat likely in the next year that you may…”
Source: Pew Research Center, 2/12/09, N=760
Overall, 44% of American are now worried about their jobs/job security

HOUSEHOLDS FEELING THE EFFECTS OF ECONOMIC DOWNTURN AROUND THE
WORLD A Lot A Little
U.S.
Nigeria
Ghana
India
Brazil
Indonesia
Japan
China
Italy
Spain
U.K.
Gro
un
d
Zero
Heavy
Exp
ort
ers
Low
In
teg
rati
on
Source: BBC World Service Poll, March 2009
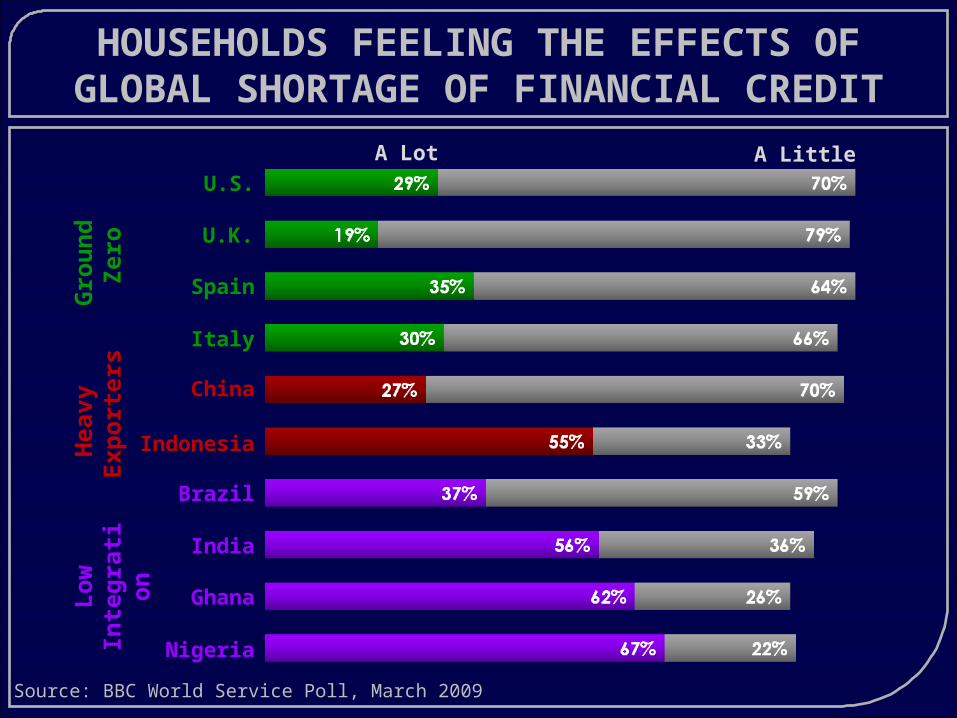
HOUSEHOLDS FEELING THE EFFECTS OF GLOBAL SHORTAGE OF FINANCIAL
CREDIT A Lot A Little
U.S.
Nigeria
Ghana
India
Brazil
Indonesia
China
Italy
Spain
U.K.
Gro
un
d
Zero
Heavy
Exp
ort
ers
Low
In
teg
rati
on
Source: BBC World Service Poll, March 2009

POLICY RESPONSES
I. Fiscal policy
II.Monetary policy
III.Financial rescue packages (TARP, etc.)
IV.Confidence measures

POLICYMAKERS’ FEAR: ANOTHER GREAT DEPRESSION
1929-1933
GDP: -30% World Trade: -67% Unemployment Rate: 25%


HOW DOES OBAMA’S $787 BILLION STIMULUS PLAN COMPARE TO
HISTORICAL GOVERNMENT EXPENDITURES?
YearsExpenditur
e at the time
2008 Equivalent
Dollars
World War II 1940s $290 billion $3.6 trillion
Vietnam War 1960s $111 billion $698 billion
Iraq War 2003-2008
$551 billion $597 billion
Korean War 1950s $54 billion $454 billion
Interstate Highway System
1950s-60s
$58 billion $425 billion
Race to the Moon 1960s $36.4 billion $237 billion
Savings and Loan Crisis 1980s $153 billion $256 billion
Louisiana Purchase 1803 $15 million $217 billion
Marshall Plan 1940s $12.7 billion $115.3 billion
Work Projects Administration
1930s $7 billion $100 billionSource: The Washington Post

TIMING & SCOPE OF THE US STIMULUS PACKAGE(BILLIONS)
student loans
state fiscal stabilization fund
highway construction
energy efficiency/ renewable energy
health insurance assistance for unemployed
school facilities renovation
unemployment benefits
tax provisions$74
$39
$27
$13
$17
$28
$54
$17
Source: Congressional Budget Office, February 13, 2009

TODAY’S FISCAL IMPULSE – ON PAR WITH ONSET OF WWII
1990 - 2010Great Depression - WWII
+7.8
+5.2
+6.5

MONEY SUPPLY EXPANSIONARY TODAY, UNLIKE THE GREAT DEPRESSION

A MASSIVE EXPLOSION OF THE FEDERAL RESERVE’S BALANCE SHEET
Net portfolio holdings Commercial Paper Funding Facility LLC
Securities to dealers TLSF
Foreign central bank TAF
Term auction credit TAF
Securities held outright
Credit to AIG
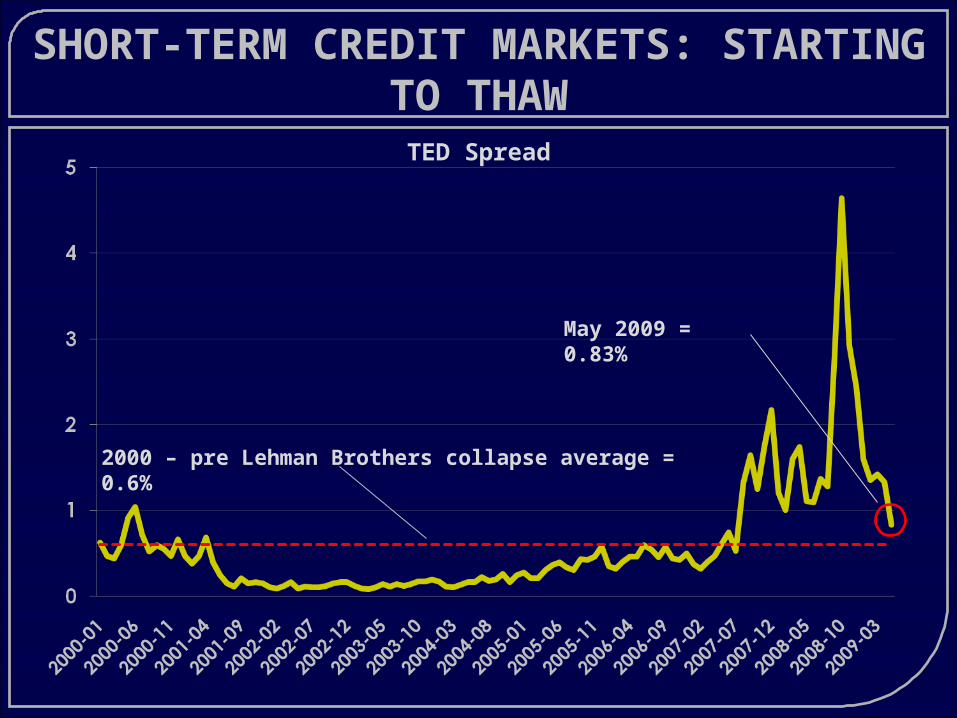
SHORT-TERM CREDIT MARKETS: STARTING TO THAW
2000 – pre Lehman Brothers collapse average = 0.6%
May 2009 = 0.83%
TED Spread

Merrill Lynch US High Yield Spread vs. 10-Year Treasuries
Source: Merrill Lynch
LONG-TERM CREDIT MARKETS: TURNED THE CORNER, BUT STILL A LONG
WAY TO GO
Latest: 11%
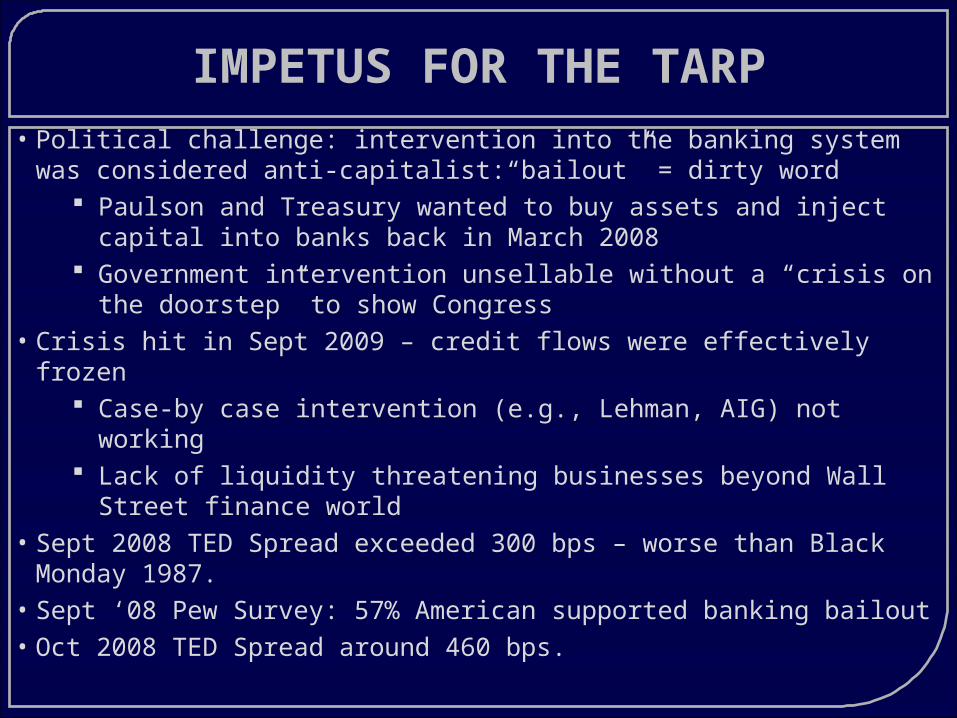
IMPETUS FOR THE TARP• Political challenge: intervention into the banking system was
considered anti-capitalist:“bailout” = dirty word Paulson and Treasury wanted to buy assets and inject
capital into banks back in March 2008 Government intervention unsellable without a “crisis on
the doorstep” to show Congress• Crisis hit in Sept 2009 – credit flows were effectively frozen
Case-by case intervention (e.g., Lehman, AIG) not working Lack of liquidity threatening businesses beyond Wall
Street finance world• Sept 2008 TED Spread exceeded 300 bps – worse than Black
Monday 1987. • Sept ‘08 Pew Survey: 57% American supported banking bailout• Oct 2008 TED Spread around 460 bps.

TARP: BASICS OF THE PLAN
• Passed by Congress on October 3, 2008• Covered more than 600 banks• Authorized for $700 billion in loans• Largest recipients of funds = Citigroup, Goldman
Sachs, Bank of America, JPMorgan Chase• Controversial provisions:
No more “golden parachutes” for executives No more incentives to top executives for
taking on unnecessary/excessive risk Bailout funds apply to GM and Chrysler

TARP: THE POSITIVES AND NEGATIVES
• Many banks say lending increased
• Several banks posted quarterly profits
• Average bank stock
up 25%
• Banks still have “toxic assets”
• Rising losses from credit cards and commercial real estate
• No financial regulatory reform yet
POSITIVE NEGATIVE
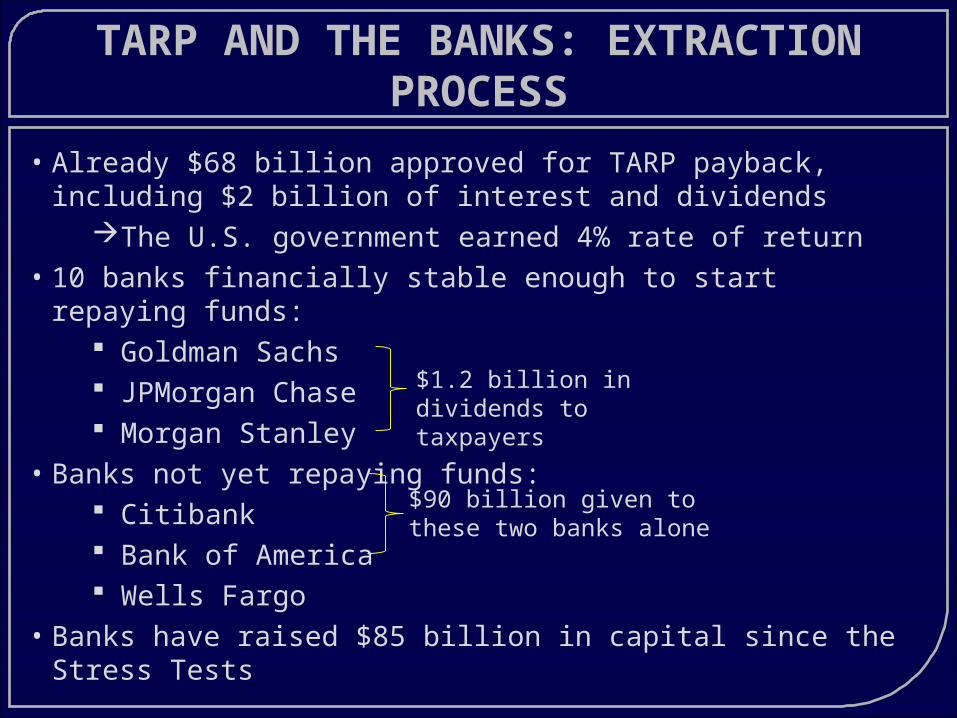
TARP AND THE BANKS: EXTRACTION PROCESS
• Already $68 billion approved for TARP payback, including $2 billion of interest and dividends
The U.S. government earned 4% rate of return• 10 banks financially stable enough to start repaying funds:
Goldman Sachs JPMorgan Chase Morgan Stanley
• Banks not yet repaying funds: Citibank Bank of America Wells Fargo
• Banks have raised $85 billion in capital since the Stress Tests
$90 billion given to these two banks alone
$1.2 billion in dividends to taxpayers

PAIN HEAVILY U.S. CENTERED: POTENTIAL GLOBAL FINANCIAL
WRITEDOWNS (2007-10)April 2009 Estimate Implied
Cumulative Loss (%)
United States
Loans $1,068 Billion 7.9%
Securities $1,644 Billion 12.6%
Europe
Loans $888 Billion 4.3%
Securities $305 Billion 10.0%
Japan
Loans $131 Billion 2.0%
Securities $17 Billion 2.2%
Total all Loans and Securities
$4,054 Billion 7.0%
Source: IMF, Global Financial Stability Report, April 2009

U.S. BANK “STRESS TEST” RESULTS
New capital needed (6% threshold)
New equity needed to absorb
future losses
Estimated consumer
mortgage losses
-- $39 B--
$28 B
--
$44 B
----
--
--
--
$34 B
$47 B$14 B
$12 B $3 B$9 B
$5 B
TH
E G
OO
DTH
E B
AD
TH
E
UG
LY

PUBLIC CONFIDENCE IN OBAMA’S ECONOMICS
“How confident are you that Obama’s economic program will improve the economy?”
Source: Washington Post-ABC News poll, 1/18/09
74%
92%
72%
Confident
43%
Not Confident
Independents
Democrats
All
Republicans

PUBLIC CONFIDENCE IN THE U.S. ECONOMY
Improvement in personal finances
Sustained gains in the stock market
Infrastructure projects
Signing of stimulus bill
Unsure
25%
19%
15%
7%
34%
Source: Ipsos/McClatchy Poll, 1/15/09-1/18/09, N=979
"Which of the following would have the greatest positive effect on your confidence in the U.S. economy?”

• Based on sample of 65 recessions over past 50 years in 21 industrial countries
• Examples of Recessions Associated with Financial Crisis
• Study based on regression analysis.
NEW IMF STUDY OF RECESSION DURATION AND DEPTH
Australia 1990: Q2 – 1991: Q2
Finland 1990: Q1 – 1993: Q3
Japan 1993: Q2 – 1993: Q4
Sweden 1990: Q2 – 1993: Q1
United Kingdom 1973: Q3 – 1974: Q1
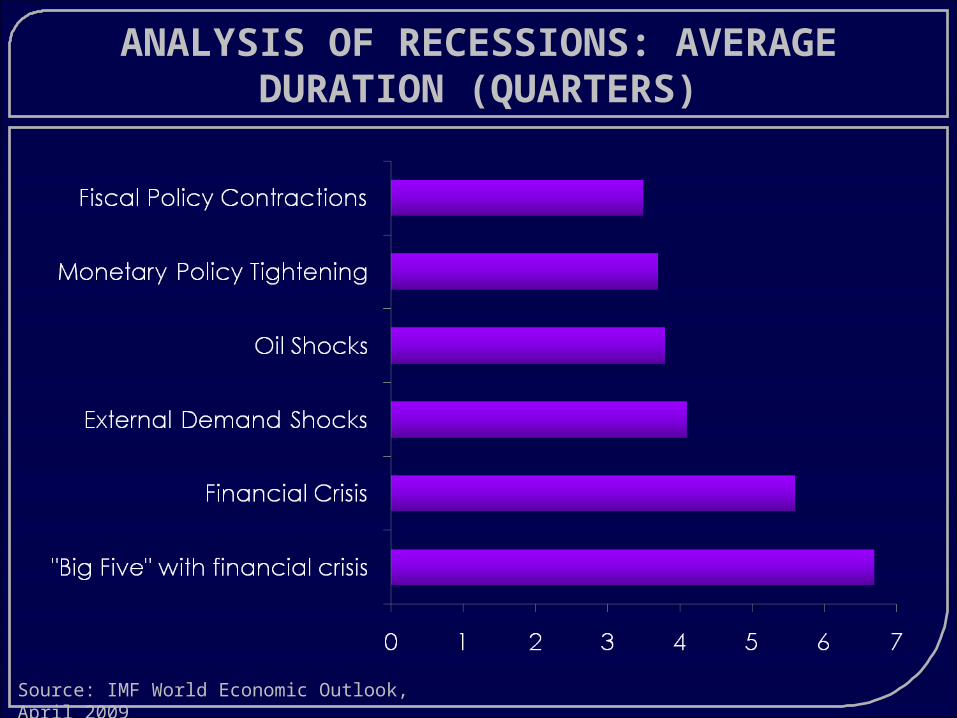
ANALYSIS OF RECESSIONS: AVERAGE DURATION (QUARTERS)
Source: IMF World Economic Outlook, April 2009

ANALYSIS OF RECESSIONS: OUTPUT LOSS
(% FROM PEAK)
Source: IMF World Economic Outlook, April 2009

KEYBRIDGE RESEARCH U.S. ECONOMIC MOMENTUM MONITOR
0
5
10
0 5 10
Recent Momentum
Histo
rical St
rength
Stro
ngW
eak
AcceleratingDecelerating
July 2007December 2007December 2008May 2009July 2008

SOME “GREEN SHOOTS” AROUND THE WORLD

KEY TO OUTLOOK: U.S. PERSONAL SAVING RATE NOW REBOUNDING FROM
HISTORIC LOWS
2005 - III = -0.7
Mar 2009 = 4.2
60-Year Historic Average = 7%
U.S. Personal Saving Rate

FACTORS SUPPORTING GLOBAL RECOVERY
• U.S.: $787 billion stimulus package, 0% interest rates, TARP, TALF, PPIP, TAF, small business loans
• China: $586 billion stimulus package, 50% increases in M2 and loans
• France: $46 billion Paris transport infrastructure, cut of VAT on restaurants
• New Zealand: interest rate cuts• Brazil: interest rate cuts• Globally: money growth of +10.1% year on year, 600 similar policy initiatives

MOST LIKELY CASE NOW FOR U.S. ECONOMIC GROWTH
• Massive stimulus policy does restart U.S. economy• Economy hits bottom during August-October 2009• Modest growth in 2009Q4 to 2010Q2 as households
continue to rebuild savings (+1 to +2% SAAR)• Credit market unthawing continues—banks start slowly
returning to lending by 2010Q1-Q2• Labor markets still weak for rest of 2009—
unemployment rate keeps climbing until early 2010• Public starts to believe in Obama’s economic policies
and they gain acceptance• Commodity prices remain weak for first 2 years of
recovery, as is the historical pattern

MOST LIKELY CASE NOW FOR ECONOMIC GROWTH IN
REST OF WORLD• Massive stimulus policy in China helps to restore Asian growth,
but exports remain weak. Construction sector helps economy grow moderately.
• Korea and Japan remain soft until early-mid 2010 because of slow recovery of export demand to US and EU.
• EU recovery lags behind global recovery because of late easing of monetary policy/strong euro. Negative GDP until early 2010.
• Unthawing of global capital markets helps restore credit flows to “stronger” emerging markets, like Brazil and India.
• Massive IMF and official flows help restore credit flows to “weaker” emerging markets, like Ukraine, African countries.
• Oil exporters tread water with oil prices remain in the $60-$70s.• World GDP returns to positive range for 2010, gather speed as
year progresses. 2011 return to normalcy.

Good Idea
Bad Idea
UnsureBoth
Neither
IS AMERICA BECOMING PROTECTIONIST?
Source: Pew Research Center, 2/4-8/09, N=1,303
Is the ‘Buy America Provision’ in the Stimulus Bill a good or bad idea?
1930: Smoot and Hawley
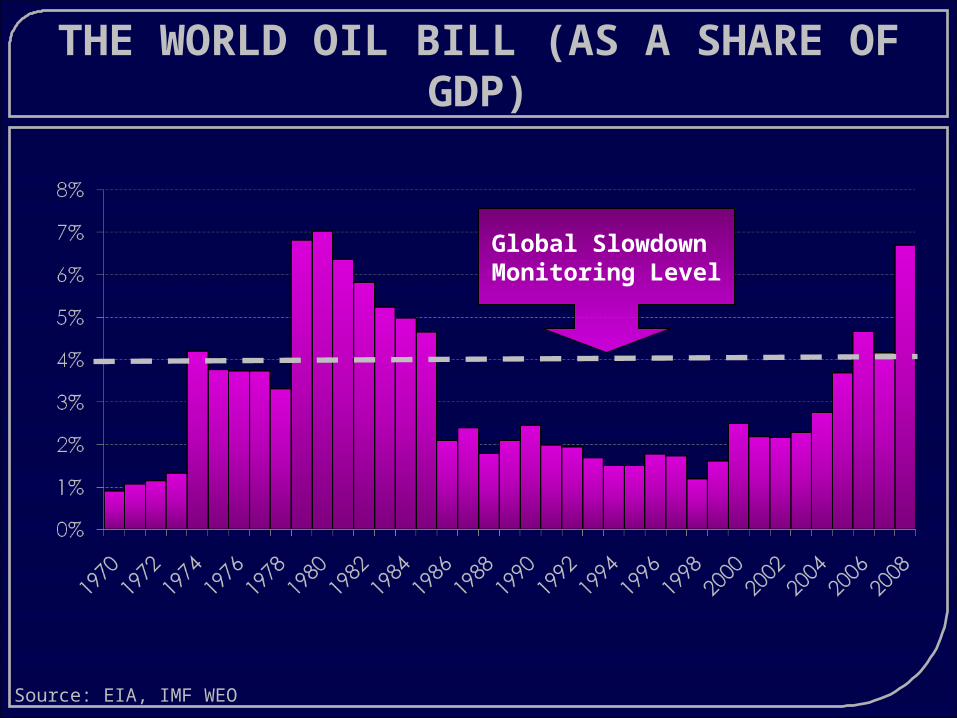
THE WORLD OIL BILL (AS A SHARE OF GDP)
Global Slowdown Monitoring Level
Source: EIA, IMF WEO

INFLATION RISKS?
• The driving risk factors: global money supply +10.1% and massive fiscal stimulus
• The counterweights: wage moderation around the world
• Japan: wages -3.7% year on year• Korea: wages -2.1% year on year• United Kingdom: wages +0.1% year on year• Wage cuts/freezes around the world
• Policy challenge—can stimulus be turned off after economic takeoff, before inflation?
• One possibility—a smaller “cleanup” recession in 2011-12?

VEHICLE AND PARTS MANUFACTURING PROFITS, PERCENTAGE OF TOTAL U.S.
PROFITS
Historic Average = 3%
Source: BEA, NIPA Tables 6.16B-D