KEY PERFORMANCE INDICATORS IN A HIGH...
155
1 POLYTECHNIC INSTITUTE OF VIANA DO CASTELO School of Technology and Management KEY PERFORMANCE INDICATORS IN A HIGH EDUCATIONAL INSTITUTION: A BUSINESS INTELLIGENCE APPROACH Irakli Rostomashvili
-
Upload
phungkhuong -
Category
Documents
-
view
212 -
download
0
Transcript of KEY PERFORMANCE INDICATORS IN A HIGH...

1
POLYTECHNIC INSTITUTE OF VIANA DO CASTELO School of Technology and Management
KEY PERFORMANCE INDICATORS IN A HIGH EDUCATIONAL INSTITUTION:
A BUSINESS INTELLIGENCE APPROACH
Irakli Rostomashvili


Irakli Rostomashvili KEY PERFORMANCE INDICATORS
IN A HIGH EDUCATIONAL INSTITUTION: A BUSINESS INTELLIGENCE APPROACH
Master in Technology and Management of Information Systems
Supervisor Pedro Castro
Co-supervisor Miguel Bento Alves
October 2010
Program was supported by ERASMUS MUNDUS External Cooperation Window for Georgia, Armenia and Azerbaijan (Lot 5)


I dedicate this project to my parents, to my relatives, to my friends.


Acknowledgement
I would like to say that I appreciate the help from Polytechnic Institute Viana do
Castelo. Direct thanks to my supervisors Professor Pedro Castro and co-supervisor Mr.
Professor Miguel Bento Alves for their support during the thesis preparation.
I want express my gratitude to Professor Jorge Ribeiro, who helped me a lot
during my work. He provided me with books, materials and his advice was always
extremely helpful.
I want to say many thanks to my teachers in IPVC Institute, to Professor Sara
Paiva, Professor Antonio Miguel Cruz, Professor Rui Gomes and others. And special
thank to Elsa Coelho and Sónia Simas, I would like to express my thanks to them for
cooperation and support during my studies in Portugal. I am very thankful that they
gave me the thorough knowledge and inspired me to work in this field.
My special thanks go to the European Commission, Education, Audiovisual
and Culture Executive Agency (EACEA) and to my Erasmus Mundus program
coordinator in Greece - Prof. Tania Kapiki. She gave me the opportunity to do my
Master‟s degree in Portugal. It was a great challenge and a wonderful experience to be
an Erasmus Mundus student. It was a great chance to meet other international students
and I have lots of good memories that are never going to fade.
Special thanks to Professor Marina Javakhishvili in Georgia – Telavi State
University coordinator of International Exchange office for her support and assistant
during my participation in this program.
I want to say great thanks to Boris Elvison, Vice President and Principal Analyst
at Forrester Research. I was very happy when I received his reply providing me with the
up-to-date materials related to my research work.
Many thanks to Paruyr Khnkoyan (Employee in Synopsys
http://www.synopsys.com as a Software Engineer II, December 2006 - April 2010,
Yerevan-Armenia); I received his assistance and consultations during my thesis
document preparation.


Abstract
Nowadays it is impossible for organizations to perform business activities
without using the Information and Communication Technologies (ICT), which includes
computers, networks hardware and applications. Usually organizations use applications
to perform their business processes storing daily transactional data related to products,
customers and other entities into operational databases. Operational databases are
embedded into applications in order to provide to users mechanisms to analyze data and
get reports from different points of view. On the other hand, there is an increasing
amount of data stored in operational databases, which can be used in analytical reports
in order to help managers in decision making activities. In this context, it is important
for organizations to evaluate if their applications work well and answer to the business
requirements, as well as control all business processes in all organization´s levels,
namely, produce reliable and high quality products, increase customers‟ satisfaction,
improve application performances and the quality of services provided to costumers and
collaborators. For this purpose, organizations have the opportunity to comply with ISO
(International Organization of Standards) requirements, guidelines and instructions in
order to improve quality of processes, and then achieve the Quality Management
System (QMS) in different levels of the organization.
In order to improve business performances in enterprises, decision makers define
key performance indicators (KPI) for all (or some) business processes, which are based
according to their strategies and goals, to evaluate, control and monitor services in order
to improve business activities. For this purpose, Business Intelligence (BI) system
demonstrates to be a possible solution to achieve this issue, allowing to integrate all
enterprise operational data into a single data repository, get analytical data and generate
reports. In general, a BI application is a meta-data driving tool, which has the capability
to extract data from different systems and store them into a data repository (also called a
data warehouse). It gives the opportunity to gather, store, filter and analyze huge
volumes of data, providing to access historical data and develop set of reports in a quick
and easy manner in order to support decision making activities.
During the last years there are many examples of the application of BI systems
in different types of organizations. BI systems can also be used in educational
institutions. Applying BI in educational institutions gives the opportunity to integrate all

data of educational processes into data warehouses, from where it is possible to deliver
KPI reports for decision makers through the use of Online Analytical Processing tools.
In this context, this project focuses to apply BI systems in a Quality Management
System (ISO 9001 Standard) implemented in a high educational institution (Polytechnic
Institute of Viana do Castelo), with the objective to provide analytical tools to decision
makers in order to evaluate, control, monitor and improve educational performances in
all levels of the institution. With this work we have developed a BI application to
provide IPVC decision makers with management tools to analyze data from QMS and
get KPI reports with the purpose to satisfy the needs and expectations of IPVC
managers.
October, 2010

Table of Contents
1. Chapter 1 – Introduction ....................................................................................... 1
1.1 Background ..................................................................................................... 1 1.2 Problem Description ....................................................................................... 3 1.3 Objective ......................................................................................................... 4 1.4 Structure of the document .............................................................................. 6
2. Chapter 2 - Quality Management Systems .......................................................... 7
2.1 Introduction .................................................................................................... 7
2.2 Quality Management Systems Objectives ...................................................... 7 2.3 International Organization for Standardization (ISO) .................................... 9 2.4 Applicability of Quality Management System ............................................. 11
2.5 Benefit of Quality Management System ...................................................... 13
3. Chapter 3 – Business Intelligence systems ......................................................... 15
3.1 Introduction .................................................................................................. 15 3.2 BI systems .................................................................................................... 17 3.3 Applying BI systems in companies .............................................................. 18 3.4 Applicability of Business Intelligence .......................................................... 20
3.5 Key Performance Indicators (KPI) ............................................................... 24 3.6 Operational Database .................................................................................... 25
3.7 Data Warehouse systems .............................................................................. 26 3.8 Online Analytical Process (OLAP) .............................................................. 30
3.9 BI Reports ..................................................................................................... 31 3.10 Business Intelligence Vendors...................................................................... 32
4. Chapter 4 - BI System Implementation in IPVC ............................................... 35
4.1 Introduction .................................................................................................. 35
4.2 IPVC and Quality Management System ....................................................... 36 4.3 IPVC QMS Process Description .................................................................. 37 4.4 Using Agile BI methodology ........................................................................ 41
4.5 Selected BI Tools ......................................................................................... 44
4.6 Implementation ............................................................................................. 46
4.7 Answering IPVC Business Needs ................................................................ 54 4.8 Key Performance Indicators (KPI) in Dashboard Report ............................. 76
5. Chapter 5 - Conclusions and Future Work ........................................................ 79
5.1 Conclusion .................................................................................................... 79 5.2 Future work .................................................................................................. 82
6. Bibliography .......................................................................................................... 83
Appendix A– Current standards from ISO/TC 176 and its subcommittees ........... 85
Appendix B – IPVC business needs and DW models ................................................ 87


List of Figures
Figure 1 - ISO 9000 process approach [5 p. 2] ............................................................. 11 Figure 2 - Three keys for effective decision making [10 p. 10] ..................................... 16
Figure 3 - Specific goals at each level of the organization [10 p. 18] ............................ 18 Figure 4 - Concrete measures at each level of the organization [10 p. 18] .................... 19 Figure 5 - Timing of the foundation and feedback information [10 p. 19] .................... 19 Figure 6 - Traditional Business Intelligence Architecture [11 p. 7] ............................... 20 Figure 7 - Self-Service BI application [18 p. 5] ............................................................. 23
Figure 8 - Massachusetts DW - clarifying questions through the data analysis process
[17 p. 6]. ......................................................................................................................... 23
Figure 9 - Digital Dashboard report ............................................................................... 25 Figure 10 - Relational Database Model [23] .................................................................. 26 Figure 11 - Data Warehouse Star Model [29 p. 19] ....................................................... 28 Figure 12 - Data Warehouse Snow Flake Model [29 p. 20] ........................................... 29 Figure 13 - A data cube example. ................................................................................... 30
Figure 14 - BI Report Service [30] ................................................................................. 32 Figure 15 - BI Agile Methodology Life Cycle (adapted from [34]) .............................. 43 Figure 16 - IPVC Schools Data Warehouse Model ........................................................ 47 Figure 17 - Example of Academic Service ETL process ............................................... 49
Figure 18 - Cube structure interface ............................................................................... 50 Figure 19 – Definition of a calculated measure. ............................................................. 51
Figure 20 - Web browser tab of the Cube Designer ....................................................... 52 Figure 21 - KPIs tab on the Cub Design ......................................................................... 53
Figure 22 - IPVC Digital Dashboard report ................................................................... 54 Figure 23 – Star model of student‟s online subscription of academic service process .. 55 Figure 24 - OLAP cube of students online subscription of academic service process ... 56
Figure 25 - Microsoft Excel report of student‟s online subscription .............................. 56 Figure 26 - Chart report of students‟ online subscription ............................................... 57
Figure 27 – Star model of simulacra indicator of EHS process ..................................... 58 Figure 28 - Microsoft Excel report of EHS simulacra indicator .................................... 58 Figure 29 - Chart report of EHS simulacra indicator ..................................................... 59 Figure 30 - Web report of EHS simulacra indicator ....................................................... 59
Figure 31 – Star model of complaints number of EHS process. .................................... 60 Figure 32 - Microsoft Excel report of EHS complaints number .................................... 61
Figure 33 - Chart report of EHS complaints number ..................................................... 61 Figure 34 - Web report of EHS complaints number ....................................................... 62 Figure 35 – Star model of manuals indicator of EHS process........................................ 62 Figure 36 - Microsoft Excel report of EHS manuals indicator....................................... 63 Figure 37 - Chart report of EHS manuals indicators ...................................................... 64
Figure 38 - Web report of EHS manuals indicator ......................................................... 64 Figure 39 – Star model of average cost of alimentation process .................................... 65 Figure 40 - Microsoft Excel report of alimentation average cost ................................... 66 Figure 41 - Chart report of alimentation average cost .................................................... 66
Figure 42 – Star model of percentage of users in canteens of alimentation process. ..... 67 Figure 43 - Microsoft Excel Report of alimentation users‟ percentage in canteen ........ 68 Figure 44 - Chart report of alimentation users‟ percentage in canteen .......................... 68
Figure 45 – Star model of average satisfaction of alimentation process ........................ 69

Figure 46 - Microsoft Excel report of alimentation average satisfaction level .............. 70
Figure 47 - Chart report of alimentation average satisfaction level ............................... 70 Figure 48 – Star model of occupancy rate of accommodation process .......................... 71 Figure 49 - Microsoft Excel report of accommodation occupancy rate ......................... 72 Figure 50 - Chart report of accommodation occupancy rate .......................................... 72 Figure 51 - Microsoft Excel report of accommodation variation rate ............................ 73
Figure 52 - Chart report of accommodation variation rate ............................................. 74 Figure 53 – Star model of satisfaction level of accommodation process. ...................... 74 Figure 54 - Microsoft Excel report of accommodation satisfaction ............................... 75 Figure 55 - Chart report of accommodation satisfaction ................................................ 75 Figure 56 - IPVC digital dashboard report ..................................................................... 77
Figure 57 - Dashboard report with Tableau Software .................................................... 77 Figure 58 – Star model of scholarship interviews and domiciliary visits. ..................... 89

Tables
Table 1 - Decision making support table ........................................................................ 17 Table 2 - Student online subscription KPI requirement ................................................. 55
Table 3 - Simulacra KPI requirement ............................................................................. 57 Table 4 - EHS complaints KPI requirement ................................................................... 60 Table 5 - EHS number of manuals KPI requirement ..................................................... 62 Table 6 - Alimentation average cost KPI requirement ................................................... 65 Table 7 - Percentage of users in canteens KPI requirement ........................................... 67
Table 8 - Average level of satisfaction KPI requirement ............................................... 69
Table 9 - Occupancy rate of residences KPI requirement .............................................. 71
Table 10 - Housed students‟ variation KPI requirements............................................... 73 Table 11 - Accommodation satisfaction level KPI requirement .................................... 74


Abbreviations
BI Business Intelligence
DI Data Integration
DW Data Warehouse
EDW Education Data Warehouse
EDW Enterprise Data Warehouse
IS Information Systems
IT Information Technology
IPVC Viana do Castelo Politechnic Institute
ISO International Organization for Standards
KPI Key Performance Indicators
MDX Multidimensional Expression
OLAP Online Analytical Processes
OLTP Online Transactional Processes
RDMS Relational Database Management Systems
SSIS SQL Server Data Integration Service
UDM Unified Dimensional Model


1
1. Chapter 1 – Introduction
1.1 Background
Nowadays, we live in an information age where huge volumes of information are
stored around us and we have to choose from mountains of data to produce useful
information. Very often we have difficulties to find and choose the right information,
losing resources and a lot of time filtering and sorting data in order to find the right one
from the huge of data volumes which are collected and produced by organizations.
People waste a tremendous amount of time trying to find and sort through the
information in order to perform their tasks. According to Forrester Consulting research
[1 p. 23], “office workers spend 42% on working on information and 58% using the
information making reports and analyzing”.
Indeed, the data produced and stored by enterprises increases overtime as a
result of their internal and external processes, which are related to their products and
customers services. In this context, organizations have the objective to reduce the
amount of time consumed on searching and sorting through mountains of data and
spend more time on analysis and making decisions.
In a competitive environment, organizations need to have the right and on time
information in order to be able to get advanced position in the markets. Traditionally, in
enterprises, information is located in various internal or external places in different
sources and for business people (for example the managers and decision makers), it
becomes harder and harder to find the right information, which consumes a lot of time
and energy. In this context, Business Intelligence (BI) Systems are used to overcome
these difficulties, since they enable to get quickly needed information by transforming
mountain of data into meaningful, useful and insightful information, which will help to
meet business requirements to make real time decisions. In recent years, demands for BI
systems are increasing in enterprises. BI systems begin to rise due to the increasing data
volumes, the growing of complex business operations, the necessity to generate reports
with increasing complexity and the need to answer to complex regulatory and general
report requirements. Furthermore, most of enterprises have to comply with rules and
implement BI tools to ensure legal compliance [1 p. 5].

2
On the other hand, enterprises need to implement quality management system
(QMS) in order to improve and control all processes in the organization that will help to
monitor and evaluate business operations and satisfy customers demand. Using the
QMS, organizations manage their work in a systematic manner, where all activities are
documented in accordance with the written manuals, procedures, instruction,
specification and forms, which help to determine whether prescribed activities are
accomplished successfully. QMS stores large volumes of information related to
products and services that can be used to monitor the performance of the services and
define actions to improve the performance, efficiency and accuracy of services.
Decision makers have the necessity to have access to performance indicators to control
and evaluate business processes. To access to the set of indicators about processes, there
is a need to concentrate all information into a data repository, from where decision
makers should be able to access indicators related to their business processes using
simple, fast and easy tools that will help to define strategies and make decisions.
Considering the points mentioned previously in the context of the evaluation and
improvement of processes across departments in enterprises, BI solutions reveal to be
appropriate solutions. BI applications can be valuable tools to evaluate, monitor, control
and audit all organization levels using Key Performance Indicators. Using BI solutions
decision makers have the opportunity to access real time information, be provided with
high quality reports and to achieve a level of maturity to implement multiple BI projects
in the future.
In fact, Business Intelligence requirements are increasing and enterprises are
depending on IT staff to fulfill these requirements. They usually depend on IT personnel
to get requested BI reports. Business requirements can be inconsistent because they
depend on economic impact, regulations and many other factors. Consequently, BI
applications and models need to be changed and populated overtime in order to support
new type of requirements and make new type of analysis. On other hand, business
requirements changes very frequently overtime, and by this fact companies need
different kind of management reports to overcome market changes and get advanced
position against to competitors. In another point of view, IT staff needs time to develop
new type of reports for business, however the managers or decision makers need to get
the required report in a very short time, for that reason there is a need of “BI self service

3
tool”[1 p. 7], which will decrease IT support to a minimum level.
On the other point of view, Business Intelligence (BI) applications are composed
by multiple tasks and components such as data integration, modeling, warehousing,
OLAP, matrix creation and management, reports, dashboards, queries alerts and many
more. When business requirements frequently changes overtime, implementing many
component BI projects becomes hard and difficult. In this context, in order to simplify
the implementation of BI projects, there is a need to use a kind of BI tool that has the
capability to automatically update all dependent components when occurs changes in
any single component [2 p. 4] Unfortunately not all BI tools have such kind of
automatically components changing capability. According to Forrester [2 pp. 5-6] BI
applications are classified into two categories: “first generation metadata-driven BI” and
“second generation metadata-data driven BI”, where second generation BI systems are
improved BI systems, which has agile and self service capability.
1.2 Problem Description
The Polytechnic Institute of Viana do Castelo (IPVC) is a high public
educational institution providing opportunities for quality training in the human,
cultural, scientific and technical sectors. IPVC integrates seven organizational
structures, namely, five schools (Education School, Agricultural College, Technology
and Management School, Management Sciences School, Health School), Social
Services and Central Services.
Recently, the IPVC implemented a quality management system (QMS)1 in 2009
that allowed to ensure the ISO 9000 certification. QMS is used to perform daily services
in the organized manner, covering the activities of the IPVC materialized in many
processes, in particular, Academic, Environment, Health and Safety, Social Services,
Courses Creation/Restructuration, Training, Economic-financial management,
Management of works and Infrastructure, Information Management, Management and
Improvement System, Project Management, Information Systems Management,
Observatory, Promotion and Image, Human Resources and Technical and Educational
Resources.
1 IPVC-QMS, 2009, Web site that supports the Quality Management System of the Viana do Castelo
Polytechnic Institute. Available on: http://www.sgq.ipvc.pt/publico.html

4
Nowadays, the QMS plays an important role in the management of the IPVC. In
fact, the QMS can help managers to perform services effectively, as well as to define
actions to improve it. In that context, top managers (and especially QMS managers)
have defined a set of key performance indicators (KPI) in order to observe and evaluate
all management processes to support decision making activities. The purpose of KPI is
to get quantifiable measure, which reflects critical factors of success towards the
institution strategy and goals. In the case of IPVC, the defined KPIs comprise the
twenty-four processes covered by QMS of the institution departments, which are
dispersed geographically. In this sense, IPVC has the need to integrate all data of QMS
into one place that will help to define and evaluate institution work and to be eligible to
compare current state with their strategies and goals. In fact, integrating all data across
all the schools will give the possibility to get valuable information on how the work is
performed by IPVC departments. The integration of all data across all the schools to
produce KPI will allow to have an important tool to monitor IPVC activities. For the
Institution, it is necessary and important to provide decision makers with tools that will
permit to access KPIs on time, based on information produced by the QMS. KPI reports
are vitally important for IPVC in order to monitor and analyze all services, activities, as
well as to improve the performance objectives.
In that perspective, it is appropriate to study and explore the implementation of a
Business Intelligence environment for the managers of the quality management system
in Polytechnic Institute of Viana do Castelo. In this context, the motivation of applying
BI application in the IPVC Quality Management System (QMS) is to develop a decision
support system that will help to control, evaluate and improve IPVC educational
performances.
1.3 Objective
The purpose of this project is to support quality management staff in decision
making activities, in order to give opportunity to define and evaluate the institution
services, compare institution strategies and goals and help in the planning of the future
improvements. In this sense, the main objective is to implement a decision support
system using BI technologies that will answer to the Key Performance Indicates (KPI)
requirements. For this purpose decision makers need to access information about all the

5
processes of IPVC schools from one system to simplify and support decision making
activities. Using business intelligence applications it is possible to satisfy business
needs and QMS manager‟s expectations, such as increase productivity of work and
improve and optimize processes in educational institution. In this work we will consider
and apply BI tools in order to develop a decision making system to answer to the KPI
requirements specified by the QMS managers. For this purpose, we define the following
objectives in the frame of our project:
Develop a Data Warehouse system in IPVC, which will give advantages to
integrate all IPVC QMS processes data into one common place and to achieve a
maturity level to be able to develop various business intelligence projects in the
future, depending on demands and necessities;
Analyze integrated data and prepare analytical reports;
Develop a decision support system for IPVC in order to support decision making
activities;
Develop tools in order to monitor and evaluate predefined Key Performance
Indicators (KPI) to assess the state of education performance in a short period of
time.
In the context of the decision support system, the objective is to create a
Business Intelligence environment in a high educational institution. Within this project
we will provide to the IPVC decision makers (or managers) with analytical reports in
order to help and support right decisions making in a timely manner. To develop this
project we will need to integrate all information about IPVC processes from different
data sources into a single repository, called Educational Data Warehouse, which is
suitable for direct querying and analysis, as well as to apply Business Intelligence tools
to generate reports and dashboards using predefined Key Performance Indicators in
order to observe and evaluate all management processes in a timely manner.
Taking into account the objectives of this work and due to time limitations and
difficulties to involve QMS managers, the BI system in this project has only been fully
implemented for some processes of IPVC. However, we consider that, despite these
limitations, the project is a contribution to demonstrate the advantages and benefits to
develop BI tools in a high educational institution.
6
1.4 Structure of the document
The thesis is composed of five chapters.
Chapter 1 introduces the project, the problem description and the purpose of this
document.
Chapter 2 presents the concepts and objectives of Quality Management Systems
(QMS) and ISO standards.
The next chapter is about Business intelligence (BI) concepts and its
components such as operational systems, data warehouse, data analysis and reporting.
The fourth chapter is entirely devoted to implementation details of BI system for
IPVC QMS. In this chapter we present business needs, the methodology used to develop
the project, the data warehouse models and reports.
The last chapter of this document consists of summary and conclusions about
this project and points future work as well.

7
2. Chapter 2 - Quality Management Systems
2.1 Introduction
Traditionally organizations move their activities by the need to produce high
rates of performance, efficiency and efficacy, the satisfaction of their employees,
customers and suppliers in order to be competitive and to enable organizations to face
competition. The application of Quality Management Systems – QMS, particularly the
ISO 9001 standard in organizations allows the definition of a set of processual and
organizational documentation in order to guide and achieve high levels of efficiency,
improve the services performance and to improve the internal and external quality of the
services provided. In this sense, in the next sections we will describe shortly the
objectives, the characteristics and the general benefits of the implementation of QMS in
organizations.
2.2 Quality Management Systems Objectives
Quality Management System (QMS) is a set of coordinated activities, which
guarantees a common attitude in the management of an organization and helps to
control all processes in order to improve the efficiency and performance of the business.
In organizations all rules are defined as policies, procedures, tasks, which are aligned
into QMS functions with their objectives to help end-users to perform their daily work.
The objective of QMS is to satisfy business‟ and customers‟ requirements and at
the same time, to extend the business operations outside of the company. QMS allows
companies to present high rates of yield, by the satisfaction of their clients, partners or
collaborators, and by maintaining high levels of competitiveness that allows them to
face concurrency and assure their survival in the markets where they develop their
activities. QMS includes many organizational processes and functions, which are
interlinked between them in order to satisfy stakeholders and customers. In this sense,
the main purpose of QMS is to increase customers‟ satisfaction, credibility, and
improve products and services quality [3].

8
The development of QMS documentation is achieved by defining quality
standards and practices in order to monitor and review external or internal performance
against the defined quality standards and practices.
The document structure of a Quality Management System consists of a set of
documents, where is specified quality requirements, which are materialized through
procedures, policies, structural matrixes and forms. With this information it is possible
to define quality standards and identify and provide the best practices in order to
monitor and review the efficiency and performance of the processes.
In general, organizations use QMS to manage their work in a systematic manner.
As mentioned in Westinghouse Electric Company QMS document, “In QMS all
activities are documented in accordance with written manuals, procedures, instructions,
specifications and drawings that contain appropriate criteria for determining whether
prescribed activities have been accomplished satisfactorily” [4 p. 5].
In terms of objectives, the QMS implementation in economical organizations
and in educational institutions can converge for a set of goals [5]:
To improve the quality of products and/or services;
To use information and access it in timely manner;
To optimize processes by providing automatic transmissions of requests
between the users and services;
To reduce execution time of tasks and answer to requests efficiently;
To increase the collaboration between internal and external stakeholders by
using centralized environments (for example web-based applications);
To determine key indicators in order to evaluate and monitor services.
In general the Quality Management Systems that are applied to customer‟s
satisfaction must comply with standards of information systems requirements defined
by credible institutions like the ISO (International Organization for Standards). This
institution is recognized by providing a set of standards in order to improve the
efficiency and performance in many areas of the companies, with the purpose to define
guidelines and to develop more efficient, safer and cleaner products and services. Using
the ISO recommendations, companies are able to be recognized as a reliable system,

9
which gives opportunity to increase chances to do business in worldwide more
effectively [5].
One of that standards is the QMS ISO 9001 certification standard. It corresponds
to a tool in order to achieve customer enhanced satisfaction. Implementing the ISO
standards gives opportunity to obtain advanced management mechanism, which will
allow to improve products and services to increase chances of success in the global
competition. In a general point of view the ISO 9001 is a standard documentation of
processes consisting of a set of process matrixes, procedures, work instructions, process
forms, requirements and other kind of documentation related to processes [6]. In the
next section we will present a general description about this standard.
2.3 International Organization for Standardization (ISO)
International Organization for Standardization (ISO) is a worldwide organization
which develops ISO standards. These standards are developed in terms of voluntary
technical efforts in order to improve the performance and efficiency of diverse types of
business operations. The use of ISO standards gives the opportunity to improve all kind
of business operations and to develop more efficient and safer products/services. ISO
Standards safeguard users and consumers. Its related documents are divided into three
main dimensions of sustainable development: economic, environment and social fields
[5].
The work of preparing International Standards is performed through ISO
technical committees, cooperating with international organizations, governmental and
non-governmental bodies. However some companies provide certification services
which are previously certified by the ISO technical committees, for example, SGS -
Société Générale de Surveillance SA2, APCER
3, which belong to the IQNET (The
international Certification Network) Association4.
The ISO 9000 is a family member of international quality management standards
and guidelines. It is recognized in establishing effective and efficient quality
management systems. In the field of Information Systems, ISO Technical Team 176
(TC 176 - see Appendix A) is responsible for the development of standards for quality
2 http://www.sgs.com/
3 http://www.apcer.pt/
4 http://www.iqnet-certification.com/

10
management and quality assurance [5]. In this standard, the documents for Quality
Management Systems are comprised by [5]:
ISO 9000:2005 - Quality management systems – Fundamentals and vocabulary;
ISO/FDIS 9001:2008 - Quality management systems –requirements;
ISO 9004:2000 – Guidelines for performance improvement;
ISO 19011:2002 Guidelines for quality and/or environmental management
systems auditing.
In other hand, the ISO 9000 provides the basic concepts of QMS based on eight
quality management principles and is used to achieve processes with continuous
improvement capability. These eight principles are: customer focus, leadership,
involving people, process approach, systems approach, continual improvement, factual
decision making, and mutually beneficial supplier relationships. The ISO process
approach is illustrated in Figure 1. During the implementation of a QMS, there are five
sections in ISO 9001 standard that indicate activities that need to be taken into account
[5 p. 2]:
Overall requirements for the quality management system and documentation;
Management responsibility, focus, policy, planning and objectives;
Resource management and allocation;
Product realization and process management;
Measurement, monitoring, analysis and improvement.
As we mentioned, the ISO 9001 specifies basic requirements for QMS, which
are needed to provide products and services to enhance customer satisfaction and meet
regulatory requirements. In practical terms, the application of the ISO 9001
requirements allows to achieve first level of QMS performance in order to develop
high quality of products and fulfill customer‟s needs and expectation.
After a system answers to the requirements of ISO standards, it can be used for
certification, registration or contractual purposes in order to be recognized. One fact is
that ISO 9001 Standard recognizes that “customers play a significant role in defining
requirements as inputs” [7 p. 11]. QMS supports the monitoring of customer
satisfaction, which is necessary to evaluate and validate whether customers‟

11
requirements have been meet. The ISO 9004 version gives some guidelines in order to
improve QMS by considering all involved parties interests and to extend the benefits
obtained from ISO 9001. This version is used to achieve systematic and continual
improvement of organizations overall performances.
Figure 1 - ISO 9000 process approach [5 p. 2]
In terms of the control of the implementation of the ISO 9002 family, the ISO
19011 Standard is used for auditing the QMS and has guidelines and instructions on
how the audit of management systems should be performed. During the performing of
an audit, organizations need to ensure that QMS was implemented successfully and
meet all the requirements, which were predefined in ISO 9001 or ISO 9004 standards.
In companies, audits are performed by ISO 9001 Auditing Practice Group (APG) [8].
2.4 Applicability of Quality Management System
There are many good reasons why organizations must apply QMS into their
systems, for example:
To produce products with consistent quality;
To improve their quality of services provided to clients;
To improve companies‟ management processes;
To answer customer‟s requirements of having a certification;

12
To monitor their processes and achieve great client satisfaction.
In order to implement a QMS in an organization, the top managers should define
a set of quality policies, quality objectives and quality indicators. The quality objectives
are measured using quality indicators which includes data availability, data quality and
customer satisfaction. The ISO suggests some steps (or guidelines) to implement
efficiently the standard [5 p. 4]:
1. Fully engage top management
Define the reasons why the organization wants and needs to implement ISO
9001;
Define the mission, vision, and values in the organization;
Define the organization‟s stakeholders: customers, suppliers, stockholders,
employees, society, etc;
Define the quality policy;
Define and align organizational objectives and related product/ service
quality objectives
2. Identify key processes and the interactions needed in order to meet quality
objectives
3. Implement and manage the QMS and its processes (using process management
techniques)
4. Build the ISO 9001-based QMS, in special to:
Identify ISO 9001 requirements;
Map these requirements with the implemented QMS, where applicable;
Make a gap analysis: identify where in the organization the requirements of
the existing system are fulfilled, and where they are not;
Include in the QMS processes the activities, procedures and controls needed.
5. Implement the system, train company staff and verify effective operation of the
processes
6. Manage the QMS:
Focus on satisfaction of customers;
Monitor and measure the operation of the QMS;
Strive for continual improvement;

13
Consider implementing business excellence models in operations of the
company.
7. If necessary, seek third party certification/registration of the QMS or as an
alternative, issue a self-declaration of conformity.
2.5 Benefit of Quality Management System
In terms of the benefits of the QMS implementation in an organization, QMS
enables to achieve the goals and objectives set out in its policy and strategy. According
to Department of Trade and Industry document, “It provides consistency and
satisfaction in terms of methods, materials, equipment, among others, and interacts with
all activities of the organization, beginning with the identification of customer
requirements and ending with their satisfaction, at every transaction interface” [9 p. 1].
The usage of QMS functions gives opportunity to have access to a set of key
performance indicators that reflects the activities of the organization and, in this sense,
it allows to monitor services performance. In the last years, many companies and
organizations applied the ISO 9001 (and other) standards. In general, by the results
achieved and mentioned in the literature, a good quality system can bring the following
benefits:
Set direction and meet customers‟ expectations;
Improve process control;
Reduce wastage;
Lower costs;
Increase market share;
Facilitate training;
Involve staff;
Raise morale.

14

15
3. Chapter 3 – Business Intelligence systems
3.1 Introduction
Day after day, managers need each time more information about the various
business activities of their organizations, to take strategic decisions based on the
information, which are located in the available business sources. Usually, the historical
information of these organizations is stored in information repositories, on which
analytic processing servers process all the possible analysis combinations, disposing fast
response times to all possible queries that decision agents may post.
The Business Intelligence concept refers to a set of techniques, which can be
used to help managers in their decisions in order to respond to business needs using
information technology (IT) capabilities. In this context, the tools to analyze the
business needs could be analytical reports in order to prospect new market needs, which
have the objectives to timely respond to customers, manage customer satisfaction,
increase profit, optimize business processes, among others. In order to develop a
Business Intelligence system, the Information Technology (IT) structure could include
operational systems, databases, data warehouses, online analytical processes (OLAP),
reporting tools and other IT components. In this sense, using this kind of systems to
analyze data with the purpose to deliver analytical reports, gives the opportunity to
align IT to business needs. Additionally, the relationship between the IT capabilities
with BI systems offers the possibility to provide organizations with advanced analytical
solutions, which allow to improve business processes, increase satisfaction of business
persons and be aware about the business competitive environment in terms of
concurrency and challenges.
A Business Intelligence system relies on intelligence information which is used
to support the effective decision making activities concerning production, marketing
and personnel. “Effective decisions are choices that move an organization closer to an
agreed-on set of goals in a timely manner” [1 p. 8]. The decision makers in this process
could be top managers of the company, the chief executive officer (CEO), the
president, chairpersons or others. The key of organizational success is to make good
choices based on specific goals, measures, information and feedbacks.

16
In order to make effective decisions, in general, the high level managers of an
organization consider the set of business goals to measure how chosen courses are
moving toward to these goals. The information about business processes is based on
these measures, which must be provided in a timely manner. Decisions are made based
on “foundation information” about current business conditions and are evaluated after
receiving the “feedback information” as a result of decisions [10 p. 9]. Figure 2
illustrates the concepts of effective decisions that consist of three keys: specific goals,
concrete measures, and timely foundation and feedback of information.
Figure 2 - Three keys for effective decision making [10 p. 10]
Organization need to define measures to understand if their goals and objectives
are achieved or not. As goals are more specific the measures could be defined more
clearly and are more measurable. Measures are the result of decision processes and
feedbacks in the company, they are used to evaluate and monitor business processes.
For example, consequences of some decisions in a company could be sales increase or
decrease and this information will appear automatically in defined measures. The
feedbacks are inputs (sales increased, or decreased) from customers that affect
organization as a result (value) of decisions, which are represented in measures.
Business goals define the status levels of the measures, so if values are less than defined
goal the decision is evaluated as a bad decision, and if it is more than or equal, then
decision could be evaluated as a good decision, meaning that specific goals were
achieved. In an educational institution a global goal could be “students‟ satisfaction in
alimentation process” measured by “percentage of meals served” in canteen with a goal
of 80%, from where “percentage of meals served” is a specific goal. We can measure

17
decision rightness based on the increase or decreased of student‟s meal service
percentage in canteen. Table 1 is an example that shows decisions making support table.
Global Goal Specific goal Measures (How we
know our goals is
reached or not?)
Foundation and
Feedback
Information
1.students
satisfaction in
alimentation
process
Maintain students
number of meals
served at canteen
Students meal
served are 80% and
more
If enrolment are:
>=80%
< 80%
2. Students
registration
academic service
Increase students
online subscription
Students online
subscription are
70% and more
If Online
subscription are:
>=70%
< 70%
Table 1 - Decision making support table
Decisions determine the general course that organization is going to take in a
defined period of time. Decisions point the organizations toward to its goals. The goals
have the repeatable measures that are used to control process toward defined goals and
determine whether the organization is making effective decisions.
3.2 BI systems
“Business Intelligence is the delivery of accurate, useful information to the
appropriate decision makers within the necessary timeframe to support effective
decision making” [10 p. 14].
Business persons have to make effective decisions on time, which must rely on
trusted information from well designed measures. Business Intelligence application has
the capability to provide business persons with feedback information about their
business performances in a timely manner. The feedback information from customers
has a vital importance for business persons to make effective decisions and to evaluate
decisions at all organization levels. Business Intelligence delivers timely updated
information, which significantly influences on decision making processes.

18
Business Intelligence has the capability to analyze huge volume of data. The
exploration of data sources could reveal trends, correlations and dependences, but such
kind of relations could be impossible to be noticed by human being using either layout-
let (designed to get appropriate report) or led discovery (information we find
determines, where we want to go next) [10 p. 16]. In Business Intelligence systems
“highly sophisticated mathematical algorithms are applied to the data to find
correlations between characteristics and events. This type of information can be
extremely helpful in organizations when planning marketing campaigns, setting up
cross-product promotion or doing capacity planning for the future, determining when
additional resources and efforts would be produced for the most effective results” [10 p.
17].
3.3 Applying BI systems in companies
Inside each company decision makers‟ activities can be classified into three
levels [10 p. 18]: upper level decision makers, middle level decision makers and
operational level decision makers. Figure 3, Figure 4 and Figure 5 present decision
makers‟ levels, measures and timing of the foundation and feedback information at each
level of the organization. At different levels of management different type of Business
Intelligence tools and techniques are required to approach predefined goals. In each
level of management specific goals, concrete measures, timing of foundation and
feedback information is required in order to make effective decision.
Figure 3 - Specific goals at each level of the organization [10 p. 18]

19
Figure 4 - Concrete measures at each level of the organization [10 p. 18]
Figure 5 - Timing of the foundation and feedback information [10 p. 19]
Upper level decision makers set long term goals, where measures that are
defined are highly summarized. Highly summarized measures are also known as
Key Performance Indicators (KPI).
Middle-level decision makers manage departments and organization at
operational level. Middle level decisions are based on short term goals that are
needed for planning to manage functional processes in organizations. Decision
makers need to get reports about business activities and to apply drilldown
techniques to the reports. Drilldown techniques are provided by BI reporting service
that are used to obtain more detailed information and help to make better decisions.

20
Middle level management can also use data mining techniques effectively for
making decisions.
Operational level decision makers (forepersons, managers, and group
leaders) rely on day-to-day operational goals in order to manage daily information
to react to changes. Based on the feedback information decision makers need to
react quickly to improve processes on time.
3.4 Applicability of Business Intelligence
In general, the amount of information in organizations increases over time due to
business processes. It is very important for enterprises to maintain and manage all
information related to their businesses. In fact decision makers have the need to get
complete reports about all business in a very short time. For that purpose, there is a need
to have a system which will have the capability to access a variety of data sources
(systems, databases, office programs, text files, web, etc) and to integrate all
information into one common place. For such kind of advanced business needs, the
solution can be provided by Business Intelligence (BI) systems. A BI tool gives the
opportunity for decision makers to access all data, integrate them in a Data Warehouse
(DW) and get analytical reports in a very short time. Figure 6 presents traditional
business intelligence architecture with components that can be used to deliver solutions
for business needs.
Figure 6 - Traditional Business Intelligence Architecture [11 p. 7]
DW
ETL process
Data
Sources
Online
Analytical
Process

21
The major steps to deliver timely BI reports for business persons are: extraction,
transformation, loading, creating data marts with Online Analytical Processes (OLAP)
and deliver BI reports. Extraction, transformation and load are related to data integration
process (DI), which is performed by BI systems to allocate data into a DW as shown in
Figure 6. To implement DI process it is essential to identify data sources. In BI systems,
data is extracted from enterprise sources such as ERP, CRM, financial systems,
databases, text files, among others. These sources may reside in different locations and
on different platforms. After data is loaded into DW, BI systems apply OLAP
techniques to generate Data Marts (DM) [12]. Using OLAP data is stored into small
databases called Data Marts, which give the opportunity to generate various reports, to
have fast access to data by specific groups and distribute information to remote sites. As
shown in Figure 6, BI starts from data sources to support users in the process of
analyzing very large quantity of information and delivers management reports. It
generates semi or fully automatic reports in order to answer daily business questions [13
p. 5].
In an organization, the following steps should be performed to implement a BI
project [14]:
1. Define data sources – In enterprises departments, data is usually stored in
databases via applications;
2. Understand business needs – The identification and understanding of business
needs will enable to construct DW and transform data to business information;
3. Create Data Warehouse - Define measures, dimensions and fact tables to create
a data warehouse;
4. Make an ETL process – ETL process is used to store information into the data
warehouse. BI tool can automatically import and transform data from different
systems and different locations.
5. Analyze data and deliver reports – OLAP tool is used to store data in cubes from
DW in order to analyze data. From cubes, reports are developed and distributed
to decision makers.
These described five steps are the traditional path to develop BI projects. It
enables to answer to business needs in enterprises by focusing on exploring and

22
delivering real time business information. BI has also the possibility to use predictive
analysis tools, which helps to give recommendations to business persons using data
mining techniques. For example, it allows to estimate the future growth of the
enterprises according to its business types [14].
Business requirements often change overtime and depend on economic impact,
regulations and many other factors. Because of that, BI applications and models need to
be changed and populated overtime in order to support new type of requirements and
make new type of analysis. For this reason, it is recommended to decrease reliance on
Information Technologies staff [1 p. 2]. BI applications need to provide the ways for
decision makers to fulfill their information requests related to their businesses via self-
services.
New generation business intelligence applications have seven characteristics
such as “access any data source, easy and accurate data visualization, see relationships,
communication and collaboration, data in view all of the time, intuitive interface,
desktop or server based” [15]. They have also self-services capability which uses five
type of BI search: report search, faced search, NLP search, exploration engines and text
mining [16] that gives opportunity to search and explore large volume of data. Next
generation BI system provides with advanced reporting tools, which gives ability to get
dynamic reports. Advanced reporting tools allows to type key words in natural language
to find needed information in a very short time. New generation BI tools use advanced
language processing algorithms, which gives opportunity to parse questions in common
language into SQL standard language with the objective to query databases (Figure 7).
Finally, it should be noted that, according to Massachusetts Department of
Elementary and Secondary schools [17 p. 6], BI can bring a set of benefits in
educational institutions, which include:
To provide decision-makers with the meaningful information on what is
working and what is not in education processes according to student attendance,
grades, test scores, observations, disciplinary actions, and more;
Efficiently examine performance over time at multiple levels: student, class,
grade level, school, and district.

23
Easily aggregate and disaggregate data, compare disparate data, and produce
customized reports, providing more detailed and insightful information through
the data analysis process (Figure 8).
Figure 7 - Self-Service BI application [18 p. 5]
Figure 8 - Massachusetts DW - clarifying questions through the data analysis
process [17 p. 6].

24
3.5 Key Performance Indicators (KPI)
The objectives of key performance indicators (KPI) are to better evaluate
organizations current business conditions and to help in planning the future. KPIs are
used to measure business progress toward organization strategy and goals. Each KPI is
a high summarized measure which is used in upper level of decision making. Decision
makers define long term goals based on organizations strategy and mission which are
not often changed. KPIs definition takes into account detailed goals and measures,
which will reflect organizations most vital aspects. Measures represent a status
indicator, showing whether these measures are within an expectable range [10 p. 19]. In
the case of an educational institution, KPI could be: students‟ online subscription,
accommodation occupancy rate, student‟s accommodation satisfaction, alimentation
service, among others.
Key Performance Indicators (KPIs) are frequently used in dashboard reports in
order to improve strategic and decision making activities. A Business Intelligence
system can provide organizations with digital dashboard reports which are used to help
executives and decision makers to make decisions better and faster [19 p. 3]. It enables
decision makers to establish measures and criteria that are used to monitor and evaluate
all business processes at a single glance in all level of the organization. Dashboards are
based on Key Performance Indicators (KPI) measures and can include business values,
goals, status and trends [20 p. 212]. Business intelligence usually gives the capability to
create dashboard reports which are composed with KPIs components using visual
graphical images such as stop light, gauges and other symbols. Dashboards reports
provide the necessary status information about business trends at a single glance. Using
dashboards in decision making activities, decision makers are able to evaluate
organizations health and correct problems on time. Dashboard reports are also useful to
determine how the organization moves towards specified goals. Figure 9 shows a digital
dashboard report example, where we can see values, goals, status and trends of KPIs.
All processes which influence organizations businesses could be captured in
dashboards. This feature distinguishes dashboards from other reports as an effective
management tool for measuring, evaluating and monitoring all organization levels in
order to compare performance with defined goals. The KPIs types depend on the nature
of the organization and organization‟s strategy.

25
Figure 9 - Digital Dashboard report
3.6 Operational Database
Operational databases are used to store daily transactional data during business
processes. The usage of operational database systems allows the management of data in
an organized manner. Operational databases are also called transactional databases or
Online Transactional Processes (OLTP). According to Larson [10 p. 26], “OLTP
systems are embedded into the applications and front users are able to manage their data
by inserting, editing, deleting, updating, filtering, summarizing and reporting”.
There are several kind of databases such as row oriented, column oriented,
object oriented, among others. From them, row oriented relational database
management systems (RDBMS) are mostly used in applications to support OLTP,
which are data source systems for BI tools and data warehouses [21 p. 13].
In databases, similar and logically connected data are grouped into subjects
called data entities or tables. These data entities/tables have relationships between them,
which form the relationship model, that‟s why these systems are called Relational
Databases Management systems (RDMS).
In RDBMS tables consists of a set of attributes [22 p. 25] also called fields,
which defines what kind of data can be stored. The data which is stored in the fields are
called tuples or records. Table must have a unique name and fields have a name and
type, where type specifies what type of data can be stored and name gives a way of
accessing. Each table must have a primary key that identifies each record. The
relationships between tables can be established using reference keys. Reference key
means that a table has a Foreign Key [22 p. 315] that is a field or a combination of
fields whose values match a primary key of another table.

26
Figure 10 represents an example of a relational model of OLTP system. We
have four data entities - Class, Student, Presence and Lesson that are related to each
other. Table Class has one attribute Class_id, which is the Primary Key. Tables Student
and table Lesson are related to table Class using Reference key.
Figure 10 - Relational Database Model [23]
Database systems have data query tools that use SQL (Standard Query
Language), and are used to retrieve information from databases using the relational
model of the databases [22 p. 20]. With Data Query Tool we can manipulate data from
databases in order to retrieve appropriate information, make summary of data, get
reports, edit, delete, update and transfer data into other database systems.
3.7 Data Warehouse systems
“A data warehouse is a subject-oriented, integrated, time variant, non-volatile
collection of data that serves as a physical implementation of a decision support data
model and stores the information on which an enterprise needs to make strategic
decisions” [24 p. 2].
Data Warehouse (DW) platform consist of hardware servers, operational
systems, database management systems and storage infrastructure [25 p. 6]. Data

27
Warehouses concepts can be used in any kind of business fields. They can be used in
manufacturing, educational institutions, tourism industry, among others.
OLTP systems are used as data sources for data warehouses (DW). The
objective of a DW is to collect and integrate all data across different systems and
locations and locate them into one source. From the transactional databases we can store
large volume of data in a DW, in a central, manageable, analytical, governable location,
from where we can get summary reports, which will help to support decision making
processes [26 p. 33]. Allocating the data into a DW from multiple data sources is the
result of integration process, with the purpose to have accurate information in a timely
manner.
Data warehouse models includes business entities like customer, product,
finances and functions like sales, supply chain, operations, which represent whole
enterprise performance. The data which will be stored in DW will be historical, read-
only data.
The process of storing data from transactional databases into a data warehouse is
called ETL process, which means Extract, Transfer and Load [10 p. 30]. ETL process
has the objective to collect data from diverse sources and to aggregate it into a dataset to
provide DW with complete, trusted data [27 p. 9].
A data warehouse consists of dimension tables and fact tables. In dimension
tables data is stored by subject. Fact tables are connected to dimension tables from
where they take quantitative/qualitative values. For example students name, address and
phone number could be stored in students dimension table. From dimension tables, data
are populated into fact tables and measures are calculated.
A measure, also called a fact, is a numeric quantity which expresses some
characteristic of organizations performance. The information that this quantity
represents is used to support or assess the performance and decision making of an
organization [10 pp. 30-31].
Numerical measurements are stored in fact tables which are taken from the
intersection of dimension tables [28 p. 12]. For example, students‟ subscription number
across schools, locations and time could be a numerical measure in fact table, where
schools, location and time are intersection (dimensions).

28
The creation of a data warehouse is a preparation step in order to use business
intelligence systems. To analyze data, it is better to run BI systems over DW than over
OLTP systems. The reason is that the use of a DW allows to have complete, integrated
and historical information and at the same time, the system is independent from
transactional processes. In fact, if we use a transactional database to analyze the data
whilst there are a lot of transactions, there is the possibility that the system will halt and
overload.
The most usual process to create a DW system is to use a database system such
as Relational Database Management System (RDBMS). To create a data warehouse
there is two possible data models: Star and Snowflake models. They are based on
relational database concepts and are composed of dimension and fact tables. In star
model each dimensional table is directly connected to fact tables. Figure 11 is an
illustration of DW star model.
Figure 11 - Data Warehouse Star Model [29 p. 19]
On the other hand, snowflake model is based on hierarchies. “A Hierarchy
is a structure made up to two or more levels of related dimensions. A dimension
from the next at an upper level of the hierarchy completely contains one or more
dimensions lower level of the hierarchy” [10 p. 35]. In Snowflake model each level
of a hierarchy is stored in a separate dimension table and they are connected to fact

29
tables thought the up hierarchy dimensional tables. Figure 12 illustrates a DW
snowflake model.
Figure 12 - Data Warehouse Snow Flake Model [29 p. 20]
The use of a data warehouse gives the opportunity to deliver solutions quickly,
and allows enterprises to be mature and be ready to provide data for new solutions.
With extended, growing and customized capability, DW allows to develop multiple new
BI solutions and be mature to answer new type of business demands in the future [25 p.
8]. In fact, according to Massachusetts Department of Elementary & Secondary Schools
[17 p. 5], Data Warehouse can bring a lot of benefits to educational institutions, like:
Time saving in making decisions;
Being able to access real time information on time in order to improve
educational performances;
Data warehouse can be used to aggregate and disaggregate data and produce
customized reports;
Integration and transformation capability to allocate all data about educational
processes in one common place for future use.
Historical perspective.

30
3.8 Online Analytical Process (OLAP)
BI application offers analysis services tools to analyze business data. This
process is called Online Analysis processes (OLAP). OLAP tool use a cube structure,
being data extracted from data warehouse and loaded in cube. OLAP has multiple
features such as Key Performance Indicators to monitor business processes,
Multidimensional Expression (MDX) to get analyzed information for reports and
Unified Dimensional Model (UDM) which enables to slice-dice and get summarized
information.
After the execution of data integration process, which loads data into a DW, it is
possible to apply OLAP tool to analyze integrated data. To analyze data, OLAP uses
multi-dimensional data cubes retrieving information from measures, dimensions,
hierarchies and cubes [10 p. 39].
OLAP cube consists of cells which store summarized data called measures.
Dimensions divide a cube into sections. Each tuple in OLAP cube is associated to
hierarchies. Hierarchies are dimension levels which are also defined in cube [10 p. 284].
Figure 13 illustrates an example of a data cube.
Figure 13 - A data cube example.
In OLAP cube it is possible to calculate measures and navigate through the cube
using MDX expressions and functions. Calculation can involve a number of different
fields from different tables. In OLAP calculations are performed using
Multidimensional Expression language (MDX). For example, in OLAP, KPI could be
developed using MDX expressions for dashboards reports, which could be used to

31
calculate the KPI values, goals, current status and trends in order to compare values
with business rules.
OLAP tool gives the ability to use several useful operations such as:
Roll-up - taking the current data objects and doing further grouping by one of
the dimensions;
Drill-down - The drill-down operation is the opposite of roll-up. It navigates
from less detail data to more details;
The slice operation performs a selection on one dimension of the given cube,
resulting is a sub-cube;
The dice operations define a sub-cube by performing a selection of one or more
dimensions;
Pivot (Rotate) - Pivot is a visualization operation that rotates the data axes in
view in order to provide an alternative presentation of the data. It allows
visualization of the other side of the dice.
3.9 BI Reports
The main purpose of BI tools is to deliver reports to decision makers. All the
strike of BI is to create high quality reports in a timely manner. BI reporting service
enables the distribution of reports throughout the organization in a timely manner using
Information Technologies (IT). Reporting service are composed by multiple programs,
has series of services, web applications and databases, that work together in order to
create a report management environment. BI uses data marts from the analysis service
(shown in Figure 14) to develop web based or local reports. Analysis service allows to
access data with external applications to develop reports that could be used in different
applications like spreadsheets. BI report services allow to provide users with reports in
most appropriate formats, since it is in general possible to produce different kind of
report formats such as HTML, PDF, TIF, among others.
Reports can be constructed using SQL (Query relational database), MDX (Query
Multidimensional Databases) and DMX (Query for Data Mining). These queries are
used to extract data from defined sources and to provide these data to reports. Once the
report is developed, it can be deployed in a report server. End-users can interact with

32
reporting servers indirectly through the use of Web Services. Reporting server responds
to web services requests to deliver the report. Delivered reports from BI systems usually
give the ability to execute operations like drill down to access detailed information if
needed. It is common, that the delivered BI reports use a web-based environment, which
gives the possibility to make the reports available in one common place, so that end-
users are able to subscribe and access reports from a website. It is also possible to share
reports through the network service. BI reports could also be subscribed and be emailed
to users.
Figure 14 - BI Report Service [30]
3.10 Business Intelligence Vendors
Nowadays there are many BI tools available on the market, which are successfully
used by enterprises and companies to support decision making activities. Below we
present a list of some BI tool vendors:
Microsoft SQL Server 2005 http://www.microsoft.com/sqlserver/2005/en/us/
Pentaho Business Intelligence Suite, http://www.pentaho.com/
Jaspersoft Business Intelligence (BI) Software , http://www.jaspersoft.com/,
http://jasperforge.org
Balanced Insight , http://www.balancedinsight.com/
BIReady , http://www.biready.com/
Kalido, http://www.kalido.com/
Tableau software, http://www.tableausoftware.com/

33
WhereScape , http://www.wherescape.com/home/home.aspx
IBM Cognos, http://www-01.ibm.com/software/data/cognos/
Endeca , http://www.endeca.com/
Sap Netweaver BW, http://www.sap.com/index.epx
Attivio, http://www.attivio.com/
Composite software, http://www.compositesw.com/
LogiXML, http://www.logixml.com/, http://www.freereporting.com/,
http://software.logixml.eu/
Zoho Reports, http://www.zoho.com/reports/lp/business-intelligence-software-
online.html
Oracle Business Intelligence 11g, http://www.oracle.com/
http://www.oracle.com/oms/businessintelligence11g/index.html
Maia Intelligence, http://www.maia-intelligence.com/
SAS, http://www.sas.com/
Teradata, http://www.teradata.com
Talend, http://www.talend.com/
UC4 Software, www.uc4.com
Microstrategy, http://www.microstrategy.com/

34

35
4. Chapter 4 - BI System Implementation in
IPVC
4.1 Introduction
The Polytechnic Institute of Viana do Castelo (IPVC) has implemented its
Quality Management System (QMS) in 2009 in order to perform its daily work in an
organized manner in terms of decision making tasks as well as to perform the
costumers‟ services. The implemented QMS covers twenty-four processes of its
departments. On the other hand, IPVC decision makers have the necessity to achieve
quick access to integrated information about all processes that can be used to support
decision making activities. Traditionally, IPVC managers based their decisions and
tasks to evaluate schools work (in special services) and to be able to monitor in a timely
manner all processes, which will help to act and improve educational processes on time
if they discover that the processes state do not align with defined strategies and goals.
For this purpose the decision makers of the IPVC have defined a set of Key
Performance Indicators (KPI), which will represent the state of each process. The
possibility to obtain KPIs will permit to decision maker persons to be able to control
and manage the services performance. To support these needs and answer to IPVC
decision makers requirements, we apply a business intelligence application over IPVC
QMS. The objective is to use Business Intelligence application to increase productivity
of work and to improve and optimize processes in IPVC.
In this project we want to study, explore and implement a business intelligence
environment for Quality Management system of Polytechnic Institute of Viana do
Castelo in order to help and to support decision making activities in the institution. We
implement IPVC BI project with SQL Server 2005 technologies to answer to the QMS
Key Performance Indicators requirements. Through the use of BI tool, we develop an
educational data warehouse (EDW) in SQL Server Database with the purpose to
integrate data of all twenty four processes. As the data about IPVC processes were
spread in different locations, sources and systems, it was vital to allocate all data into a
single data repository to integrate all internal and external processes information into
one source. Then we were able to analyse the information from EDW with OLAP tool

36
using Analysis Service, and finally we developed KPI reports to monitor and evaluate
IPVC processes and support decision making activities.
In order to develop this project we choose to use Microsoft SQL Server 2005
software, which is considered a modern analytical BI tool and a growing data
warehousing platform [31]. SQL Server 2005 has all the components which are
necessary to develop BI projects in a single application. It allows to integrate data using
Integration Service, to analyze data using Analysis Service and to develop reports using
Reporting Service. All these services are located in a single user friendly application
that SQL Server 2005 provides. SQL Server 2005 components have close relationship
to each other so that when changes occur in one component, they are reflected in all
dependant components. In this project we also decide to try to use another BI tool to
deliver the reports to decision makers. We choose to use Tableau software to be able to
develop next generation BI reports. With Tableau BI tool we connect to analysis service
cubes in order to get data source and to develop high quality reports with a high level of
interactivity enabling users to easily navigate and explore information.
4.2 IPVC and Quality Management System
The IPVC has implemented a QMS that covers the activities of seven
organization units that includes schools, Social Service and Central Service. As an
Educational Institution the IPVC provides opportunities for quality training in the
human, cultural, scientific and technical sectors through its five schools [32]:
Escola Superior de Educação (ESE) - Teacher Training College
Escola Superior Agrária (ESA) - Agricultural College
Escola Superior de Tecnologia e Gestão (ESTG)– School of Technology and
Management
Escola Superior de Enfermagem (ESEnf)– School of Nursing
Escola Superior de Ciências Empresariais (ESCE) – School of Business Studies
The IPVC Quality Management Systems (IPVC – QMS 2009) [32] complies
with ISO 9000 certification standard requirements and covers the following units
process [32]: Academic Service, Environment, Health and Safety, Alimentation,
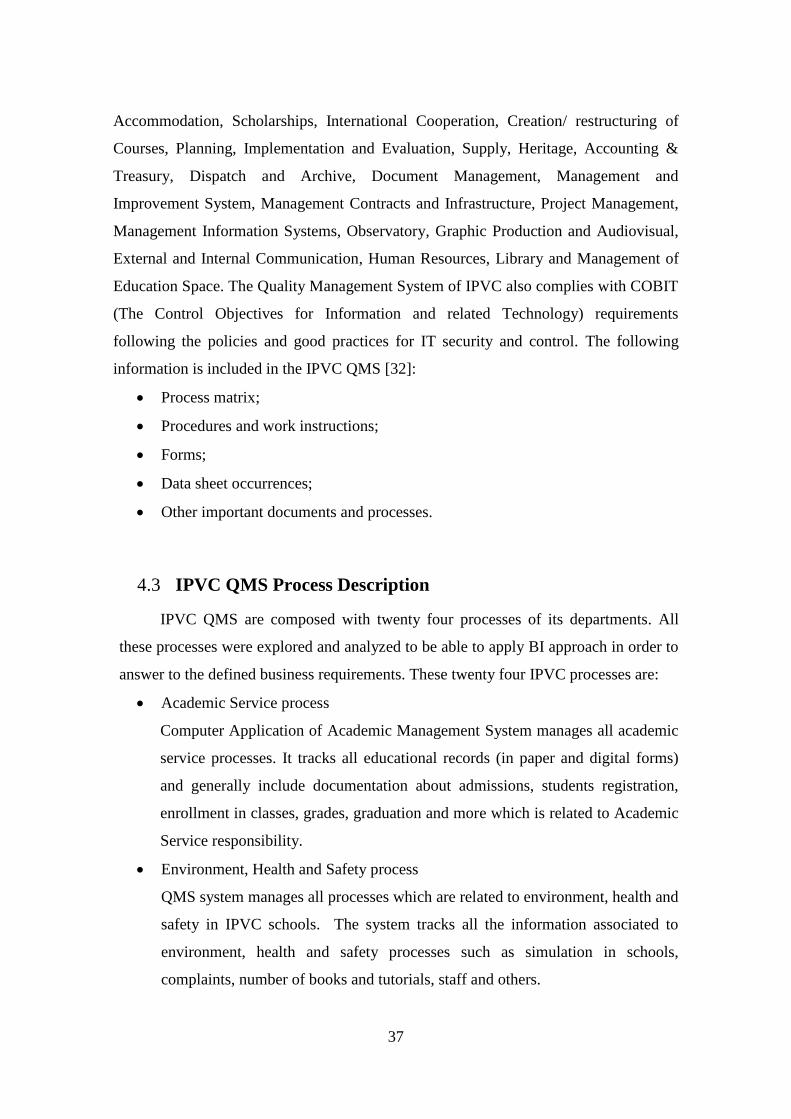
37
Accommodation, Scholarships, International Cooperation, Creation/ restructuring of
Courses, Planning, Implementation and Evaluation, Supply, Heritage, Accounting &
Treasury, Dispatch and Archive, Document Management, Management and
Improvement System, Management Contracts and Infrastructure, Project Management,
Management Information Systems, Observatory, Graphic Production and Audiovisual,
External and Internal Communication, Human Resources, Library and Management of
Education Space. The Quality Management System of IPVC also complies with COBIT
(The Control Objectives for Information and related Technology) requirements
following the policies and good practices for IT security and control. The following
information is included in the IPVC QMS [32]:
Process matrix;
Procedures and work instructions;
Forms;
Data sheet occurrences;
Other important documents and processes.
4.3 IPVC QMS Process Description
IPVC QMS are composed with twenty four processes of its departments. All
these processes were explored and analyzed to be able to apply BI approach in order to
answer to the defined business requirements. These twenty four IPVC processes are:
Academic Service process
Computer Application of Academic Management System manages all academic
service processes. It tracks all educational records (in paper and digital forms)
and generally include documentation about admissions, students registration,
enrollment in classes, grades, graduation and more which is related to Academic
Service responsibility.
Environment, Health and Safety process
QMS system manages all processes which are related to environment, health and
safety in IPVC schools. The system tracks all the information associated to
environment, health and safety processes such as simulation in schools,
complaints, number of books and tutorials, staff and others.

38
Social Service sub process – Alimentation
QMS manages all processes which are related to alimentation process in IPVC
schools, the system records information about student enrollment in alimentation
system and food orders, food supplement and other services which are done
during the alimentation process.
Social Service sub process – Accommodation
Academic accommodation service is a process which is composed by a sequence
of tasks related to accommodation processes. The system manages the following
accommodation services: booking rooms, maintain accommodation environment
for customers (students, teachers, and other institute member)-and satisfy
accommodated persons.
Social service sub process – Scholarship
Social Service system manages scholarship processes and records all the
information related to scholarship. System records the following processes:
scholarship interviews, responds, improvements, denials and others which are
related to getting scholarship.
International Cooperation process
IPVC QMS manages all processes related to International Cooperation which
includes establishment of protocols and agreements with partners, sending and
receiving students and teachers, scholarship transfers and other information
which is related with international cooperation processes.
Process of Course Creation / Restructuring
Process of course creation and restructuring is being managed by QMS of IPVC
in order to simplify work during schedule restructuring and course planning. The
process includes: proposal and restructure of courses, course validations and
other information which is related with course creation and restructuring
process.
Formation process – Planning
IPVC QMS manages schools‟ planning process which is related to application
fees, submissions, schedules preparations, planning of programs and proposals
to produce and also includes other tasks which are associated with IPVC
planning process.

39
Formation process – Implementation and Evaluation
Implementation and Evaluation process in IPVC schools is managed by QMS of
IPVC. They use QMS to perform their task such as evaluation of teaching
activities, report submission, conducting surveys, grade mobility, and other
activities to evaluate IPVC schools work.
Economic and Financial Management – Supply process
In IPVC schools economic and financial department uses QMS to manage
supply process in schools. It helps to integrate business partners to achieve new
level of efficiency and productivity. QMS tracks all information which is related
to supply process: supply producers, supply fees, stocks management, materials,
proposals, supplier‟s contracts/breaks and more.
Economic and Financial Management – Heritage process
QMS of IPVC manages heritage processes in schools by tracking the
information into the system about conferences which is held in schools, storing
information about physically existing assets, documented and undocumented
goods, preparing heritage documentations and others related to this process.
Economic and Financial Management -Accounting & Treasury
QMS of IPVC manages accounting and treasury processes in schools. It tracks
all information about changes in budgets, monitor- purchased software‟s in
schools and analyzes revenues and commitments.
Information Management – Dispatch process
QMS of IPVC manages dispatch process of IPVC schools and tracks
information about complaints done by telephone or in person.
Information Management – Document Management process
QMS manages document management process and tracks information related to
compliance with regulatory requirements in schools.
Management and Improvement System
QMS of IPVC manages IS management and improvement process. It tracks
information such as identified occurrences, performed and planned systems
audits, achievement of quality, questioners and satisfactions, among others.
Management contracts and Infrastructure process

40
QMS helps to manage the work in schools which is related to management
contract and infrastructure in schools. QMS tracks information about planned
and executed tours, schedules and more.
Project Management process
QMS performs all work which is related to project management process in IPVC
schools. System tracks all the information related to project management
performance, planed/undertaken activities, execution and reprogramming of
applications, funded and approved IT project.
Management Information systems
QMS of IPVC manages processes of Management Information Systems in IPVC
schools by tracking the following information: requested and inadequate
conducted trainings, occurrences of application server software, time of
components recovery, incidents types, backups, critical data and much more
which is relating to management information system process.
Observatory process
QMS of IPVC manages observatory process in schools and records information
about validated and invalidated questioners, companies and institutions surveys
and other information related to IPVC schools observatory process.
Promotion and Image - Graphics Production and Audiovisual process
QMS of IPVC is used during graphics production and audiovisual process. It
records the information which is related to this process such as recording
information of studies complaints, submission of complaints and works
conducted across the schools and courses.
Promotion and Image - External and Internal Communication
QMS of IPVC manages external and internal communication processes in
schools. QMS records the information related to this process such as disclosure
of achievements, approvals, proposals, satisfaction, trainings offered,
consultations/portals details, publications and other information related to
external and internal communications in schools.
Human Resources process

41
QMS of IPVC manages human resources process in schools. It records
information about dossiers of individuals, employee‟s details, training hours and
more which is required by human resources process.
Library Process
Library process is about helping students, faculty and staff by understanding
their needs and providing books and catalog of online available resources
offered by library systems. Library process has Student registration service for
borrowing and returning books, and to register complaints. They also have
internal processes between the libraries, to exchange resources and enhance their
work in order to increase the satisfaction of library customers.
Education Technical Resources - Education Spaces Management process
IPVC Quality Management systems is used to perform management of
educational spaces in schools by recording level of satisfaction during
questionnaires, requests for spaces, capacity of spaces and other information
which is related to management of education spaces.
4.4 Using Agile BI methodology
Business requirements are consistently changing in global market and it is
difficult to predict what business requirements will come tomorrow [33]. Therefore
business persons do not know what business needs that they will have tomorrow. They
only know what they want today. Even if they know what they want, they often change
their minds. In this case, there is an advantage to apply an agile methodology (reacting
quickly on changes) in BI development.
The Agile BI methodology consists of five life cycle implementation steps: story
conference, task plans, development, sprint demo and retrospective [34 p. 9]. These
steps are iterative and helpful in project implementation. The advantages of this
methodology are:
Understanding correctly business requirements;
Appropriate respond to changes;
Simplicity;
Satisfy early and continuous delivery of valuable software;

42
Least effort and delivery of the project in a short time.
In the context of this project we decide to use an agile methodology, by the fact
that other methodologies in general are inappropriate when requirements change quickly
and BI projects do not work well when using standard software development lifecycle
[34]. The option to use Agile BI methodology was very useful and helpful to start the
project implementation effectively and to make the development process simple.
For the development of this BI project, we divided implementation tasks into
five steps, which were frame in time boxes as suggested by TDWI‟s (The Data
Warehouse Institution) webinar - “Developing an Agile BI Environment” [34]. IPVC BI
project processes were developed and deployed through the execution of the five steps
defined in methodology (story of conference, task plans, development, sprint demo and
retrospective), which were panned and scheduled in time. Figure 15 illustrates the IPVC
BI project agile methodology steps.
In order to implement the BI system, the first step was to investigate and explore
IPVC schools‟ twenty four processes to understand KPI requirements. The KPI
requirements were a starting point to decide how data warehouse should be modeled
and this modeling was done in a top-down approach. So, KPIs were a guideline which
was used as a source for the implementation of the project.
Following the Agile BI methodology, we start from the story of conference step.
We get the requirements (KPI list) of the twenty-four processes. The completion of this
step took a lot more time than originally planned as we faced some problems and
difficulties to get and understand KPI requirements list from QMS managers. Then, we
chose three processes from KPIs requirements list: 1. Academic Service process; 2.
Environmental, Health and Safety process; 3. Alimentation process.
In the task plan step we define technical tasks and its plans on the paper to
implement the chosen processes. According to the three process KPIs list, we define star
models (dimensions and fact tables) to implement the DW. Then we establish task plans
to implement the project and answer the business requirements. In the execution of this
step, we faced some problems to clarify the defined KPI requirements that were
sometimes general and ambiguous, due to difficulties to get access to right persons in
QMS department. For that reason Task Plan step took a lot of time to define fact tables,
measures, dimension tables and relationships between them for each process in order to

43
Time Boxes
Time Boxes
Time Boxes
Time Boxes
Time Boxes
be able to calculate defined KPIs. After this step, we were able to create our DW model
in the development step.
`
Figure 15 - BI Agile Methodology Life Cycle (adapted from [34])
In the development step we began to develop and deploy our project with the
selected BI Tool. Our task plan document was used as a guideline in this step. We also
made self monitoring of our work. Following the task plans we construct the DW and
develop and deploy BI application. We use OLAP tool to generate the multidimensional
structure materialized as a cube according to the defined measures and calculations that
are used to answer the KPI questions. Next we develop reports in Microsoft Excel and
web based environment to deliver them to decision makers.
In sprint demo step, we prepared a demo version of our project in order to
present results to QMS managers. This demo version was used to allow users to check
and validate if results are acceptable and what they really require and need. To support
the validation process we create a validation document, which includes the KPI
requirements, DW model, report in Microsoft Excel format with charts and web based
reports. At the same time, in this step, we evaluate performed work during our
development cycle in order to optimize next processes. The evaluation of project
development cycle was helpful to perform next lifecycle processes more effectively.
Story of Conference
Task Plans
Development
Sprint Demo
Retrospective
Get Project
Requirements
IPVC KPI

44
It is noteworthy that the used methodology considers one day of work to present
and validate the demo version, but in our case iterations for validation took more than
two or three weeks. Indeed, as the project was not coming from top managers, there
were difficulties to execute some steps that require the availability of managers to
participate in working sessions.
Finally, in retrospective step we evaluate the correctness on how our last
development cycle went, in order to improve next processes lifecycles and we began the
next important business KPI requirements and start the lifecycle again.
Following this “Agile BI” methodology we develop and deploy all twenty four
processes of IPVC schools. Unfortunately we were not able to validate all twenty four
processes. We could validate only some of the processes. In fact, during the
implementation of this project, we faced several difficulties that hampered the
development of the final BI system, namely:
General and ambiguous KPI requirements list which have created difficulties in
the definition of DW;
Communications problems – There was some difficulties to communicate with
QMS persons in English in order to clarify KPIs;
Time – We have to implement the project in a short time period;
Limited human resources - The project was very huge and complex to be fully
implemented by one person;
Availability problems – The IT project was not requested from the top
managers, which had resulted in difficulties to be able to schedule meetings with
QMS person;
In particular decision makers have not been directly involved in the project
development cycle, which created difficulties to execute the validation process.
4.5 Selected BI Tools
To implement the IPVC BI project we choose SQL Server 2005. The selection
of SQL Server 2005 was based on several reasons. First, SQL Server 2005 meets the
needs and requirements to develop the project. Second, considering that most of
technological solutions implemented in IPVC are based on Microsoft technologies, this

45
option can facilitate the use of SQL Server and its integration in IPVC information
system. Finally, this option was also due to time limitation for the execution of the
project and considering that it was more important to focus on having a final solutions
rather than in testing capabilities of different solutions.
Microsoft SQL Server 2005 provides all aspects of Business Intelligence and has
the following services [10]:
Integration Service – known as Data Transformation Service (DTS). It has the
ability to integrate all information across the organizations units into one source
(Data Warehouse) in timely manner.
Online Analytical process (OLAP). It is the tool which is used to analyze data to
make reports. OLAP provides aggregate functions such as count, sum,
minimum, and maximum, among others to develop appropriate measure groups
in OLAP cube.
KPI (Key Performance Indicators). This tool is used in OLAP cubes to develop
digital dashboard reports, which will help decision makers to evaluate and
monitor organization processes faster and support decision making activities.
KPI could be classified in different status levels which can be, for example, very
good, good, fair, bad or very bad. To classify indicators, the limits for each
status level should be defined, in order to be able to identify business conditions
at a single glance on digital dashboard.
Multidimensional Expression (MDX) queries and scripts are used to get
information from analysis services cubes and allow to make calculations, get
measures and to develop reports.
Unified Dimensional Model (UDM) allows to slice and dice and summarize
information by demand and to present information in a meaningful manner.
Data mining tools are used to find and present patterns and behaviors, which
might not otherwise be found in the data.
Reporting Service and Microsoft Business Intelligence accelerators are used to
facilitate the delivery of information to decision makers through the entire
organization. In SQL Server 2005, report services are created using business
intelligence development studio and Visual Studio 2005 tools.

46
During our research we attended The Data Warehousing Institute (TDWI)5
webinars that introduced participants to various next generation BI systems and
solutions. From the various solutions that demonstrate a number of interesting features,
we consider that it could be advantageous to analyze the possibility to use Tableau
software reporting solution in IPVC, since Tableau software offers a set of features that
seems to be useful to be used in order to improve and enhance this project. Furthermore,
Tableau software was selected as winner of 2010 CODiE Awards for “Best Software
Development Solution" [35]. With Tableau it is possible to access all major data sources
including text files, Excel, Access, SQL Server, SQL Server Analysis Services, Oracle,
DB2, MySQL, PostgresSQL, Firebird, Netezza, Intesystems Cache, Hyperion Essbase,
Teredata and Vertica [36]. Furthermore, Tableau allows to integrate multiple databases.
Through the connection to different data sources we are able to develop different kind
of graphical reports that Tableau software provides. These reports are very dynamic,
allowing users to make operations such as new calculations, filtering, grouping and
accessing the data, which gives “self-service” opportunity to deliver BI reports and
reduce IT staff involvement. In fact, using the Tableau software, users are able to use
self-service functionalities to develop new kind of measures for the reports without IT
person‟s involvement. On the other hand, Tableau software does not provide
instruments to develop data warehouses, but it is oriented to access all major kind of
data and to deliver very high quality reports. For that reason the use of SQL Server 2005
reveals to be a good solution to make data integration and data warehousing to integrate
all data, while Tableau can be used to develop advanced reports to support decision
making activities. Tableau reports could be published in Power Point, PDF and in other
applications format or in web format using Tableau Server service, where end-users
could get extremely dynamic reports.
4.6 Implementation
To develop this project, we had to execute a set of steps for each QMS process
in order to implement a solution that will respond to the KPI requirements defined by
QMS managers. In the following sections, we present a description of the steps that
should be executed to deliver KPI reports to decision makers.
5 http://tdwi.org/

47
4.6.1. Data Source
In order to implement this project we should have access to three sources of
information: data of IPVC Quality Management System (QMS), forms and the KPI
requirements list. Lamentably, for reasons beyond the project we were unable to get
data from IPVC QMS. Due to this fact and in order to be able to execute the project, we
rely on the Key Performance Indicators (KPI) requirements. In order to overcome the
unavailability of data to develop the project, we decide to generate some random data to
populate the data warehouse with the objective to validate our implementation.
4.6.2 Educational Data Warehouse (EDW)
The development of the project has resulted in the definition and creation of an
educational data warehouse model of the twenty-four processes. Figure 16 presents a
partial view of IPVC DW model which is prepared to store data of IPVC processes.
Figure 16 - IPVC Schools Data Warehouse Model
This DW will be used to create cubes with the OLAP tool for further analyzing
and report delivering. The IPVC DW is composed by 79 fact tables and 108 dimension
tables. Because of this huge number of data entities and relations between tables
(dimension tables and fact tables), we decide to divide and present the final DW model
into smaller models corresponding to each 24 processes in order to facilitate the

48
presentation of our work and to demonstrate how KPI requirements have been
answered. Each DW model is represented with all dimensions tables which are involved
in each process in order to facilitate the interpretation of each model. However in the
final EDW model, there exists only one table for each dimension, like, for example time
dimension, student dimension, among others.
4.6.3. ETL (Extract, Load, Transform) process
After we define and construct the DW model considering the KPI requirements,
it is necessary to load data from IPVC QMS into DW in order to do calculations and
support KPI requirements. For this purpose, we should perform Data Integration (DI)
process, which includes ETL (Extract, Load and Transform) tasks. However, as referred
before, we were unable to have access to data sources of QMS. As it was not possible to
get data source of the processes from IPVC schools and in order to validate our work,
we generate random data in Microsoft Excel to be loaded in EDW. However we
consider that this situation does not invalidate the developed work, as project objectives
was to develop a decision support system for IPVC, and it will be possible in the future
to create the ETL process to load data from IPVC QMS data sources. Nevertheless, for
the purpose of our work, we have analyzed the steps that are involved in the creation of
an ETL process using SQL Server Integration Service (SSIS) tool (Figure 17). SSIS is a
graphical tool that can facilitate the definition of an ETL process. Traditionally data
integration process involves the following steps:
Extraction of Data
In order to build ETL process the first step involves the extraction of data from
the data source. Data extraction process involves the identification and selection
of data for transformation. The data selection task is used to access data for
selection purpose establishing a connection to databases or files. The SSIS tool
is used to establish a connection to data sources and extract data for the
transformation purpose. In order to make data selection, when it is necessary to
select data from various tables at one time, we need to define a SQL-Query
command to access several entities taking into account relationship between data
sources. After the connection to data sources is successfully established we can

49
make data selection. It could be done using SSIS package item in Data Control
Tab.
Transformation of Data
Selected attributes must comply with DW requirements and be suitable,
otherwise data will not be delivered to data warehouse and destination errors
will occur. The transformation step involves operations like the conversion
between data types of different databases systems used in data sources and DW.
Load of Data
After data is transformed into required format, we can load data into data
repository.
Figure 17 represents a possible ETL process for academic service using the
SSIS tool of SQL Server, allowing to define all steps involved in a ETL process to load
data to the DW.
Figure 17 - Example of Academic Service ETL process
4.6.4 Online Analytical processes (OLAP) Tool
After data is loaded into Data Warehouse, we move data into OLAP cubes to
analyze information and develop reports. With OLAP tool we can easily store the data
SSIS Data Flow Item
(Extract Data)
SSIS Data Flow Item
(Transformation Data)
SSIS Data Flow Item
(Load Data)
Data Source
Connection
(MS Excel)
Data
Destination
Connection
(IPVC DW)
Package Structure
(Excel Source, Derived
Column, SQL Server
Destination)

50
into cubes. It gives the opportunity to construct cubes based on dimension tables, fact
tables and to build hierarchies with multiple levels. In some applications, OLAP tools
(for example Microsoft Visual Studio used in this project) include a cube designer
which allows to define dimensions (used to summarize values) and measures (the values
to be aggregated) to generate the multidimensional structure. These tools permit to
define general aggregations functions such as sum, count and average to define
measures, or to define more complex functions using MDX commands. Figure 18
presents an example of the cube designer interface with the definition of measures and
dimensions in the case Academic Service process.
Figure 18 - Cube structure interface
In order to support some of the KPI requirements we need to make additional
calculations using MDX expressions. In this case we can create a calculated member,
which is similar to creating a computed value. In our project we effectively use
calculation expressions to get specific measures needed for KPI. These calculations are
allocated in the cube cell. Calculated measures are done in the Calculations tab of the
Cube Design tab. For example Figure 19 shows the definition of a measure used to
calculate online subscription rate of students.

51
Figure 19 – Definition of a calculated measure.
4.6.5. Management reports
After creating OLAP cubes, we can use Analysis Service measures to calculate
all KPI in order to develop reports and to support decision makers in decision making
activitites. All the tasks in previous steps were made in order to be able to develop BI
application and to deliver reports to QMS staff. We allocate all processes data
information into a single repository called IPVC Data Warehouse and then we use
OLAP Tool to analyze all the information in data cube. We define all necessary
calculations to answer the KPI requiriments. At this point, it is possible to browse the
cube in the Browser tab of the Cube Designer, that allows to select dimensions and
measures in order to visualize and analyse measures values by drilling into detail from
summary, navigating hierarchies, sorting, ranking, filtering, charting and exporting.
Figure 20 represents browser view to test developed report correctness.
Finally we are able to develop reports. For the purpose of this project, the reports
were developed in two formats: Microsoft Excel and Web. In fact, the QMS managers
perform their work using Microsft Excel application, so it will be advantages for QMS
persons to get the reports about IPVC processes in Microsoft Excel format with charts

52
in their computers. We decide also to provide users with the access to the same reports
using web browsers.
Figure 20 - Web browser tab of the Cube Designer
According to the Agile BI methodology that were used in the implementation life
cycle of our project, we use the reports as a documentation for validation processes. To
interact with end users we present the Microsoft Excel reports and web reports in order
to evaluate the correctnes of reports and to be sure if it is exactly what they require.
Additionally, we implement digital dashboards using KPIs to support business
requirements. BI dashboards are intended to provide decision makers with an overview
of business performance at a glance, using attractive and intuitive visual interface. From
a decision maker„s perspective, dashboards provide a useful way to view data in a
format that is easy to understand and to assimilate for managers.
In that context, we use the KPIs tab of the Cube Designer to define status levels,
in order to be able to see KPI digital dashboard and identify IPVC education processes
conditions at a single glance. Figure 21 represents the definition of KPI digital
dashboards for the first IPVC process of KPI requirements.

53
Figure 21 - KPIs tab on the Cub Design
To configure the KPI tab, we define the goal value to be attained in Goal
Expression. Then the Status Expression is used to determine the current status of the
KPI that will be used to picture status level. For example, in the case of students‟ online
subscription rate, the KPI value should reflect the following status level:
Values greater than 70 percent should get a very good status;
Values greater than 30 percent, but less or equal than 70.00, should get normal
status;
Values less or equal to 30 percent should get bad status.
To apply this status into KPI, we have to define the Status Expression field using
the following Multidimensional Expression (MDX):
Case
when [Measures].[AcademicServiceOnlineSubscriptionRate] > .70
then 1
when [Measures].[AcademicServiceOnlineSubscriptionRate]>.30
and
[Measures].[AcademicServiceOnlineSubscriptionRate]<= .70
then 0
when [Measures].[AcademicServiceOnlineSubscriptionRate] <= .30
then -1
End
After defining the digital dashboard KPI, we can deploy this modification to the
Analysis Service Database in order to be available to users. Figure 22 presents can see
KPI deployment result shown in KPI Browser.

54
Figure 22 - IPVC Digital Dashboard report
4.7 Answering IPVC Business Needs
The top position persons of IPVC schools need to analyze the data available
from IPVC Quality Management systems (IPVC QMS). They would like to have
analytical reports about all IPVC processes. As QMS staff uses Microsoft Excel to
perform their work, they also would like to get BI reports in the same environment. The
final purpose of this project is to implement a system which allows to calculate required
KPIs and to deliver reports. In the following points, we present the business needs, DW
models, OLAP cubes, reports and dashboards developed for the first four IPVC
processes, namely, Academic Service, Environment Health and Safety, Alimentation
and Accommodation. The remaining IPVC processes business needs and DW models
are presented in Appendix B, since we were unable to validate these processes during
the time of development as mentioned previously.
In general, the structure of data warehouse model contemplates a set of
dimension attributes, as well as measures (for example: quantity, sum, and average,
from others). However, in our project, some data warehouse models do not include
measures, as we developed measures inside the cubes to calculate and answer KPI
requirements through the use of functions and MDX expressions.
Academic Service Business Needs
IPVC QMS staff needs to analyze all business processes which are related to
academic service department work. They want to analyze the information across
schools, courses, students, registration types and years and to be able to drill down to

55
the quarter, month and date level. Academic Service KPI requirement includes the
percent of student‟s online subscription (Table 2).
Process Process/
Sub-process Indicator Calculation Formula
Unit of
Measure
Academic
Service
Academic
Service
online
subscriptions
rate
Number of online subscriptions
/ Total number of subscriptions
%
Table 2 - Student online subscription KPI requirement
To answer this KPI requirement, we define the star model of academic service
process illustrated in Figure 23, which is composed of a fact table and its connections to
dimension tables. The model includes dimensions about students, schools, time,
courses, locations and students registration type.
Figure 23 – Star model of student‟s online subscription of academic service process
To define the cube measures, we use count function from OLAP environment to
get a measure (Fact Academic Service Count) that corresponds to the total number of
students‟ subscription. Using this measure we are able to calculate students‟ online
subscription rate applying the following MDX command:

56
Calculation name: AcademicServiceOnlineSubscriptionRate
MDX Expression: ([Measures].[Fact Academic Service Count],[Dim
Registration Type].[Registration Name].&[Online])/[Measures].[Fact Academic
Service Count]
Figure 24 presents the defined measures and dimensions for OLAP cube.
Figure 24 - OLAP cube of students online subscription of academic service process
After the definition of the cube, we produce a set of reports. Figure 25 presents
an academic service report, which answers academic service process KPI requirements
– “Students Online Subscription”. The report is in Microsoft Excel format and includes
the following column fields: school name, course name, time and academic online
service subscription rate. With this report QMS person can see the student‟s online
subscription rate in academic service by year, school and courses. Furthermore, QMS
persons can also use drill down techniques and see the information in more detail if
needed.
Figure 25 - Microsoft Excel report of student‟s online subscription

57
Figure 26 presents a graphical chart of students‟ online subscription rate of
academic service, where QMS person can visualize students‟ online subscription rate by
school and courses.
Figure 26 - Chart report of students‟ online subscription
Environment, Health and Safety
In relation to Environment, Health and Safety (EHS) managers are interested in
analyzing the information in IPVC schools related to simulacra, complaints and
manuals. The first defined KPI requirement of EHS process is related with the number
of simulacra in IPVC (Table 3).
Process Process/
Sub-process Indicator Calculation Formula
Unit of
Measure
Environment,
Health and
Safety
Environment,
Health and
Safety
Simulacra
indicator
Number of simulacra
performed per year Number
Table 3 - Simulacra KPI requirement
Figure 27 presents the defined star model for EHS simulacra process, which is
composed of one fact table and its connections to four dimension tables that include
employee, schools, time and simulacra type (for example: water or fire).

58
Figure 27 – Star model of simulacra indicator of EHS process
The measure defined (Fact EHS Simulation Count) in this case is delivered
using the count function that corresponds to the total number of simulacra.
Based on the defined cube, we create a simulacra report, which answers EHS
process KPI requirements – “number of simulacra” (Figure 28). The Microsoft Excel
report has column fields that include school name, year, simulation type and EHS
simulacra number. With this Microsoft Excel report, QMS person can see the performed
simulacra in IPVC by schools, simulation type and year. Furthermore, QMS persons can
also use drill down techniques and see the information in more detail if needed.
Figure 28 - Microsoft Excel report of EHS simulacra indicator

59
Figure 29 presents a graphical chart of simulacra number by type and schools,
from where QMS persons can easily analyze EHS process in IPVC and see EHS
simulacra number by school and simulation type. QMS persons can also use drill down
techniques and see the information in more detail. This chart can be useful to answer
questions such as how many simulacra have been performed in each school by
simulation type and year.
Figure 29 - Chart report of EHS simulacra indicator
Figure 30 presents a web format report of EHS simulacra process in IPVC. QMS
persons can consult the EHS simulacra number by school, simulation type, year and
quarter. Besides, web report allows end users to use drill down techniques and see the
information in more detail if needed.
Figure 30 - Web report of EHS simulacra indicator

60
Another KPI requirement for EHS process is about complaints number and it is
presented in Table 4.
Process Process/
Sub-process Indicator Calculation Formula
Unit of
Measure
Environment,
Health and
Safety
Environment,
Health and
Safety
Number of
complaints
Number of complaints
per time levels Number
Table 4 - EHS complaints KPI requirement
Figure 31 presents the defined star model of EHS complaints process, which is
composed of a fact table and its connections to dimension tables that include complaints
type, schools and time.
Figure 31 – Star model of complaints number of EHS process.
We develop the number of complaints measure (Fact EHS Complaints count)
using the count function inside the cube, which allows to count all the records in fact
table. With the count function we are able to get all complaints number by each schools
and time levels.
Figure 32 presents a report with the number of complaints in Microsoft Excel
format. The report includes columns fields such as school name, complaints type and
year. Furthermore, QMS persons can also use drill down techniques and see the
information in more detail.

61
Figure 32 - Microsoft Excel report of EHS complaints number
Figure 33 presents a bar chart of complaints number in schools, where users can
see what type of complaints exist in each school by years.
Figure 33 - Chart report of EHS complaints number

62
Figure 34 presents a web format report of EHS number of complaint in IPVC.
QMS persons can analyse EHS complaints number by school, year, quarter and month,
in order to identify the services that have more complaints.
Figure 34 - Web report of EHS complaints number
Finally, Table 5 presents the manuals KPI requirements, which is the last defined
requirement for the environment, health and safety process.
Process Process/
Sub-process Indicator Calculation Formula
Unit of
Measure
Environment,
Health and
Safety
Environment,
Health and
Safety
Manuals
indicator
Number of Proposals /
Number of Manuals Number
Table 5 - EHS number of manuals KPI requirement
The star model of EHS manuals is presented in Figure 35. The model includes
dimensions for school, time and material type.
Figure 35 – Star model of manuals indicator of EHS process

63
In order to answer this KPI requirement, we develop a measure to get the
number of manuals and proposals using the count function inside the cube. To calculate
EHS manuals indicator we define the following MDX command:
Measure Name: Manuals indicators
MDX Expression: ([Measures].[Fact EHS Materials Count],[Dim EHS Material
Type].[EHS Material Type].&[Proposals])/([Measures].[Fact EHS Materials
Count],[Dim EHS Material Type].[EHS Material Type].&[Manual])
Figure 36 presents a report in Microsoft Excel with the number of manuals,
proposals and manuals indicator value by school and year. QMS staff can see the list of
manuals and proposals that are available in EHS process across schools by years and
months.
Figure 36 - Microsoft Excel report of EHS manuals indicator
Figure 37 presents a graphical chart report of manuals KPI, from where QMS
person can have a graphical view of the number of manuals, proposals and manuals
indicators.
Figure 38 presents a web format report of manual KPI. QMS person can see
EHS materials number by school and time level. Additionally, web report allows end
users to use drill down techniques and see the information in more detail.

64
Figure 37 - Chart report of EHS manuals indicators
Figure 38 - Web report of EHS manuals indicator
Social Service - Alimentation
IPVC QMS staffs need to analyze data processes which are related to
alimentation processes in IPVC schools. They would like to analyze the information

65
about bars and canteens across the schools and time. For this purpose QMS managers
have defined the KPI requirements. Table 6 presents the KPI requirement related to
average cost of alimentation.
Process Process/
Sub-process Indicator
Calculation Formula Unit of
Measure
Social
Service Alimentation Average Cost Average cost by product Number
Table 6 - Alimentation average cost KPI requirement
In order to answer KPI average cost requirement, we define a star model for
alimentation process (Figure 39), that includes two fact tables in order to store
information about alimentation cost and served products.
Figure 39 – Star model of average cost of alimentation process
To calculate average cost, we develop a measure (Fact Alimentation Served
Count) to get served products using the count function and a measure (Total Price Sum)
to get the total price of products using the sum function on measure TotalPrice of
alimentation cost fact table. Using these measures, we define the following calculated
measure to answer KPI requirements:
Measure Name: Average_cost

66
MDX Expression: [Measures].[Total Price Sum]/[Measures].[Fact Alimentation
Served Count]
Figure 40 illustrates a report in Microsoft Excel format that presents average
costs by year, origin type, food type, school name and food price. With this report QMS
person can see food price in IPVC by schools, food and time period.
Figure 40 - Microsoft Excel report of alimentation average cost
Figure 41 presents a bar chart report of alimentation cost by school, food type
year and month, where it is possible to use drill down techniques and see the
information in more detail.
Figure 41 - Chart report of alimentation average cost

67
The second KPI requirement of alimentation process is related to the percentage
of students that use canteens‟ service (Table 7).
Process Process/
Sub-process Indicator
Calculation Formula Unit of
Measure
Social
Service
Alimentation % of users in
canteens
Number of served meals /
Number of enrolled students %
Table 7 - Percentage of users in canteens KPI requirement
Figure 42 presents the star model created to get the percentage of users in
canteens. The model includes fact tables with enrolled students in IPVC and served
meals in canteens. The dimensions in the model are schools, time, food type, students
and origin type.
Figure 42 – Star model of percentage of users in canteens of alimentation process.
To answer this KPI requirement, we develop two measures using the count
function: one to determine the number of enrolled students (Fact IPVCstudents Count)
and another to get the number of served meals (Fact Alimentation Served Count). Using
these measures we are able to calculate the percentage of users that have meals at
canteens through the definition of a calculated measure:

68
Measure name: UsersInCanteen
Expression: [Measures].[Fact Alimentation Served Count]/[Measures].[Fact
IPVCstudents Count]
Figure 43 presents a report with the percentage of users of alimentation services,
which is in Microsoft Excel format and includes the following column fields: school
name, time level and percentage of users in canteens.
Figure 43 - Microsoft Excel Report of alimentation users‟ percentage in canteen
Figure 44 presents an example of a chart report with the percentage of users in
canteens by school and by time level.
Figure 44 - Chart report of alimentation users‟ percentage in canteen

69
The third KPI requirement of alimentation process is the average level of users‟
satisfaction in canteens and bars (Table 8).
Process Process/
Sub-process Indicator
Calculation Formula Unit of
Measure
Social
Service
Alimentation Average level of
satisfaction in
Canteens and bars
∑ satisfaction level /
number of responses
obtained
Inquiry
scale
Table 8 - Average level of satisfaction KPI requirement
Figure 45 represents the star model of alimentation satisfaction level, which is
composed of a fact table and its connections to dimension tables. The model includes
the following dimensions: schools, time, satisfaction level, origin type and students.
Figure 45 – Star model of average satisfaction of alimentation process
To answer this KPI requirement, we use the count and sum functions. With
count function we develop measure (Fact Alimentation Satisfaction Count) to get
number of responses and with sum function we develop measure (Satisfaction Value) to
get sum of satisfaction values. In order to calculate average satisfaction level of canteen
and bars and answer KPI requirement we apply following MDX command:
Measure name: AVG_SatisfactionLevel
MDX Expression: [Measures].[Satisfaction Value]/[Measures].[Fact
Alimentation Satisfaction Count]

70
Figure 46 presents alimentation satisfaction level in that includes following column
fields: school name, year, origin type and average satisfaction level. Figure 47
represents charts report of alimentation satisfaction levels in schools.
Figure 46 - Microsoft Excel report of alimentation average satisfaction level
Figure 47 - Chart report of alimentation average satisfaction level

71
Social Service - Accommodation process
IPVC QMS staff has defined KPI to analyze services, which are related to
accommodation process. The KPI list includes the occupancy rate of residences, the
variation of housed students in residences and users‟ satisfaction.
The first KPI requirement is about occupancy rate of residences (Table 9).
Process Process/ Sub-
process Indicator
Calculation Formula Unit of
Measure
Social
Service Accommodation
Occupancy rate of
residences
Number of housed
students / total number
of beds
%
Table 9 - Occupancy rate of residences KPI requirement
To answer occupancy rate KPI requirement, we define the star model of
accommodation occupancy process, which is illustrated in Figure 48.
Figure 48 – Star model of occupancy rate of accommodation process
In order to calculate occupancy rate and answer KPI requirements we have to
define the following measures:

72
The total number of beds in residences (Number Of Available Beds) using the
sum function on fact table measure NumberOfAvailableBeds;
The number of housed students (Fact Accommodation Occupancy Count) using
the count function;
The occupancy rate (AccommodationOccupancyRate) using the following MDX
expression: [Measures].[Fact Accommodation Occupancy Count] /
[Measures].[Number Of Available Beds]
Figure 49 presents a report in Microsoft Excel format that permits to visualize
accommodation occupancy by residence name and year. Furthermore, QMS persons can
also use drill down techniques and see the information in more detail. Figure 50
presents a bar chart report of accommodation occupancy rate in IPVC.
Figure 49 - Microsoft Excel report of accommodation occupancy rate
Figure 50 - Chart report of accommodation occupancy rate

73
Table 10 presents the second KPI requirement of IPVC accommodation process
related to the variation of housed students.
Process Process/ Sub-
process Indicator
Unit of
Measure
Calculation Formula
Social
Service Accommodation
Homologous variation
of housed students %
Number of housed
students in year n /
Number of housed
students in year n-1
Table 10 - Housed students‟ variation KPI requirements
To answer homologous variation of housed students KPI requirement, we use
the fact table of accommodation occupancy table presented in Figure 48. In this case,
we have to use parallel period function, which can be used to return a member from a
prior period in the same relative position as a specified member [1 p. 310]. Using this
function, we define a calculated measure using a MDX expression as follows:
Measure name: AccommodationVariation
MDX Expression: ([Measures].[Fact Accommodation Occupancy Count]/
((ParallelPeriod([Dim Time].[Year - Quarter - Month - TimeDate].[Year],1,
[Dim Time].[Year - Quarter - Month - TimeDate].currentmember),
[Measures].[Fact Accommodation Occupancy Count]))) -1)
Figure 51 presents the accommodation variation rate which answers KPI
requirements. The report is presented in Microsoft Excel format and allows to analyse
variation rate by residence name and year. The variation rate of housed students can
also be presented using a chart as illustrated in Figure 52.
Figure 51 - Microsoft Excel report of accommodation variation rate

74
Figure 52 - Chart report of accommodation variation rate
Table 11 presents the third KPI requirement for IPVC accommodation process
which is related to users‟ satisfaction.
Process Process/ Sub-
process Indicator
Calculation Formula Unit of
Measure
Social
Service Accommodation
Satisfaction
level
∑ (classification for
question x weighting) /
number of responses
%
Table 11 - Accommodation satisfaction level KPI requirement
For this indicator, we define the star model of accommodation satisfaction level
as illustrated in Figure 53, which includes a fact table and dimensions related to
customers, schools, time, and questions asked to users.
Figure 53 – Star model of satisfaction level of accommodation process.

75
In order to calculate accommodation satisfaction level to answer KPI
requirement, we define a calculated measure (AccommodationSatisfactionRate) using
the following expression:
[Measures].[Classification Weighted]/[Measures].[Question Weight]
Figure 54 presents an accommodation satisfaction report in Microsoft Excel
format with the values of accommodation satisfaction level by residence and time
levels. Figure 55 presents the same report using a graphical chart.
Figure 54 - Microsoft Excel report of accommodation satisfaction
Figure 55 - Chart report of accommodation satisfaction

76
4.8 Key Performance Indicators (KPI) in Dashboard Report
As we can observe the developed solution gives the ability to create reports that
allows the QMS managers to analyze services performance through the visualization of
KPIs in different ways. This type of report gives a set of dynamic tools to analyse data,
like drilling into detail from summary, navigating hierarchies, sorting, ranking, filtering,
charting and exporting. This tool offers a great independence in the way that users
interact with the information facilitating the support decision making activities.
On the order hand, BI solutions usually include the capacity to create dashboards
for decision makers. BI dashboards are intended to provide decision makers with an
overview of business status at a single glance, using appealing and intuitive graphical
interface that can be used with a few simple clicks of the mouse. From a decision
maker„s point of view, dashboards provide a effective and simple approach to view data
and information using components such as single metrics, graphical trend analysis,
capacity gauges, geographical maps and variance comparisons, which are presented in a
format that is easy to understand and use by managers [37].
As previously mentioned, SQL Server 2005 offers the possibility to create KPI
digital dashboards. In this project, we create an example of a dashboard for some of the
KPI requirements. In this sense, we define the limits for each status level that is used to
picture status level and deploy KPI dashboard. Figure 56 presents the digital dashboard
created with KPI value, goal and status for academic service online subscriptions,
alimentation cost, alimentation experience, alimentation satisfaction level, EHS number
of manuals, EHS number of complaints, EHS number of simulacra, accommodation
variation, accommodation occupancy rate and accommodation satisfaction level.
In the context of this project, we have decided to experiment a different solution
in order to create dashboards with the objective to provide decision makers with
different types of functionalities in terms of KPI visualization. As mentioned
previously, we select the Tableau software which gives a set of functionalities to
provide interactive data visualizations, as well as dashboards and reports. Through the
use of this software, it is possible to connect SQL Server Analysis Service cube and
create the structure of dashboards to present KPI using reports and charts. Figure 57
illustrates an example developed in this project that presents KPI values using different
type of presentation.

77
Figure 56 - IPVC digital dashboard report
Figure 57 - Dashboard report with Tableau Software

78

79
5. Chapter 5 - Conclusions and Future Work
5.1 Conclusion
The main objective of this project was to develop a Decision Support System
(DSS) for Quality Management System (QMS) departments in a High Educational
Institution, in particular in the Polytechnic Institute of Viana do Castelo. In the context
of our project, we studied and explored Business Intelligence (BI) systems and the
benefits that can bring to educational institutions. In general, BI is a group of software
programs and technologies that gives opportunity to gather an increasing data from
business operations, store them in a single data repository for analyzing and delivering
real time reports in order to support the decision making activities in the organization.
One of the sources that BI can use to get business information could be from QMS.
QMS allows the definition of a set of processual and organizational documentation in
order to guide and achieve high levels of efficiency, improve the business processes
performance and the internal and external quality of the services provided. On the other
hand, QMS can be a valuable source of information to deliver Key Performance
Indicators (KPI) for decision makers to support the task to control and manage the
services performance. In the case of IPVC, a set of KPIs have been defined by
stakeholders to control, evaluate, monitor and improve business processes. For this
reason, we consider that BI solution can be a valuable and necessary solution to support
business needs that will enable to provide KPI reports and gives opportunity to measure
effectiveness of business performances in all departments.
In the context of project “Key Performance Indicators in a High Educational
Institutions: A Business Intelligence Approach”, we focused on the development of a BI
systems solution in order to support the analyses of the IPVC processes performance. In
this context we implemented Key Performance Indicators reports for the QMS staff in
order to make available needed information, as well as to assist decision maker persons
to perform their work and to increase the analysis and decision making activities.
To achieve these goals, we select BI system SQL Server 2005 tool in order
realize our expected results. We apply agile BI methodology and divide BI
implementation lifecycle process into five steps: Story of Conference, Task Plans,

80
Development, Sprint Demo and Retrospective [34]. Following the Agile methodology
framework we have performed the following main tasks: gather, collect and analyze
KPI requirements, define star models, define dimensions and measures, develop
Educational Data Warehouse (EDW) and OLAP interface, develop reports, and finally,
present demo version of BI project to end users with the purpose of validation.
During the implementation of the project a top down approach was used. Our
starting point was the IPVC schools Key Performance Indicators (KPI) requirements
and forms. With these requirements we define and built an Educational Data Warehouse
(EDW) to prepare an environment to allocate all schools operational data into one
source. The developed IPVC EDW enables QMS person to access needed information
in real time and get reports. It will give advantage to IPVC in better management and
improvement of educational quality and processes. With BI Online Analytical Processes
tool (OLAP) we analyze all the data and make calculations to get measures in order to
support the KPI requirements. Then we were able to provide end-users with reports in
Microsoft Excel programs and web browsers.
One of the main advantages that this project brings to IPVC is data warehousing,
where all processes are materialized into one data source from where IPVC can access
all kind of data depending on the business requirements. Using the DW, QMS persons
can access KPI state at a single glance at all level of IPVC which will help to evaluate,
control and monitor all processes. As a result, data warehousing gives huge benefits to
IPVC, by the fact that it allows to achieve a level of maturity that gives the opportunity
to be ready to answer to new requirements and implement multiple BI projects in the
organization. In this context, the existence of DW will help organizations to
concentrate, focus and deliver more time to develop BI reports, which gives opportunity
to be in forward against competitors. In the case of IPVC BI project, developed DW
allows to apply next generation BI tool in order to deliver advanced reports in a very
short time for IPVC staff. For this purpose we use Tableau Software to deliver dynamic
reports which gives opportunity to explore reports and manipulate the data more
efficiently and effectively.
This project was the first attempt to apply Business Intelligence system in IPVC
QMS schools. The developed project brings a list of valuable benefits to IPVC,
namely:

81
Allocate all Institute processes data into a single repository Data Warehouse. It
gives the ability to access the information related to the Institute and deliver the
reports for decision makers;
IPVC Data Warehouse has historical perspective and gives the opportunities
develop customized reports.
Monitor and evaluate predefined Key Performance Indicators (KPI) and assess
the state of education performances in a very short time.
Decision makers are provided with reports about KPI in timely manner. They
will not lose time searching information to perform their work and they will
more concentrate to improve the quality and services.
Decision makers of IPVC can use BI tool successfully to evaluate and monitor
all activities and processes at a single glance and, like that, prescribe timely
actions for the improvement.
Ability to deliver new IT solutions quickly. It allows IPVC to be mature and be
ready to quickly develop different kind of BI projects in the future.
Finally, we would like to mention that, during the implementation process, we
faced some problems that hampered the project execution, that are mainly related with
the fact that this project was not required by top managers of IPVC. For that reason, we
encountered several difficulties, namely, to get and understand IPVC KPI requirements
that was sometimes imprecise and ambiguous, to access data sources of QMS system,
and to access and schedule meetings with the right persons in order clarify KPI
requirements and validate processes. For that reason, we have developed DW models
and generated reports for all processes but we were able to validate only four processes.
However we handle to overcome these problems and we develop a first implementation
of a BI DSS for IPVC, considering that the results of this project are a valid contribution
for the provision of tools to support decision makers of IPVC.
The result of our project shows the advantages and benefits that integration of BI
applications and QMS can bring to IPVC, contributing to the provision of tools to
support management and decision making activities. The developed decision support
system could simplify the IPVC work and it will help decision persons to make timely
decisions based on real time information in order to improve educational processes.

82
5.2 Future work
In the frame of this thesis work we focused in developing a BI system in order to
support the KPI requirements for the IPVC schools. However there are some issues that
could be the subject for future work, namely:
Complete the validation of all processes;
Improve business layers, to improve the reports and increase decision makers‟
satisfaction.
Expend and improve the decision support system by applying data mining techniques to
discover interesting patterns inside the institute in order to predict future trends and to
plan institution work in a better way.

83
6. Bibliography
1. Forrester Consulting. Learn Business Intelligence, Why And How Enterprises Are
Moving To Self-Service Business Intelligence. October 2, 2009.
2. Boris Evelson. Agile BI Out of the Box. s.l. : Forrester Consulting, April 22, 2010.
3. International Organization for Standardization (ISO) . General information available
on: http://www.iso.org/iso/support/faqs/faqs_general_information_on_iso.htm.
February 4, 2010.
4. S.R. Strich, Peresident and CEO of Westinghouse Electric Company. Westinghouse
Electric Company Quality Management System,2002. Available soruce:
http://www.westinghousenuclear.com/Our_Company/Quality_Management_System/doc
s/E6_qms.pdf. accessed date: May 15, 2010.
5. (ISO), International Organization for Standardization. ISO official web site
www.ISO.org, Selection and use of the ISO 9000 family of standards,
http://www.iso.org/iso/iso_9000_selection_and_use-2009.pdf. 2009.
6. Sai Global, ISO 9001 Quality Management System. Available soruce:
http://www.qmi.com/information_center/literature/9001brochure.pdf. Accecced on:
May 25, 2010.
7. International, Standards Australia. The Construction Industry Guide to ISO 9001:2000.
2001.
8. International Organization for Standardization, Introduction to the ISO 9001. Auditing
Practices Group, available soruce: http://isotc.iso.org/livelink/livelink/fetch/-
8835176/8835194/3541460/APG-Introduction.doc.pdf?nodeid=3553375&vernum=-2.
5 June 2009.
9. Department of Trade and Industry. Available source:
http://www.businessballs.com/dtiresources/quality_management_systems_QMS.pdf. 15
May, 2010.
10. Larson Brian. Delivering Business Intelligence with Microsoft SQL Server 2005. s.l. :
McGraw-Hill/Osborne, 2006.
11. David Loshin, Knowledge Integrity, Inc. Enhancing Enterprise Data Warehouse
Reliability Using Master Data Management. September 22, 2010.
12. Benefits of Automating Data Warehousing, available soruce: http://www.uc4.com. uc4
Software. 7 June, 2010.
13. Arnth-Jensen, Niels. Applied Data Mining for Business Intelligence. November 2006.
14. OAKWOOD, Analysis of Court Data in the State of Tennessee. Available soruce:
http://www.youtube.com/watch?v=-j5J7lXav7Y. 19 December, 2006.
15. David Wells, Infocentric. Next-Generation Business Intelligence. September 29, 2010.
16. Wayne Eckerson, Director, TDWI Research. Webinar - When Search and BI Collide.
August 25, 2010.
17. Education, Massachusetts Department of Elementary and Secondary. Introduction to
the Data Warehouse, Version 2.0, available on:
http://www.doe.mass.edu/infoservices/dw/DW101.pdf. September 2008.

84
18. Boris Evelson and Matthew Brown, Forrester Research, Inc. Search + BI = Unified
Information Access. May 5, 2008.
19. Elazar C. Harel, University of California, San Diego. Digital Dashboards: Driving
Higher Education Decisions, available soruce:
http://net.educause.edu/ir/library/pdf/ERB0319.pdf. September 16, 2003.
20. Read Jackobson, Staicla Misler,Hitachi Consulting. Microsoft SQL Server 2005 step by
step. 2006.
21. Endeca, A Forrester Consulting Thought Leadership Paper Commissioned By. Agile BI
-Best Practice For Breaking Through The BI Backlog. April 2010.
22. Hector Garcia-Molina, Jeffrey D. Ullman, Jennifer Widom. Database Systems:The
Complete Book , Department of Computer Science Stanford University, Prentice
HallUpper Saddle River. New Jersey 07458 : 1998.
23. Alves, Miguel Bento. SQL- Structure Query Language, IPVC Institute. Viana do
Castelo : s.n., 2010.
24. M.G.N.A.S. Fernando and G.N. Wikramanayake, University of Colombo School of
Computing. Application of Data Warehousing & Data Mining to Exploitation for
Supporting the Planning of Higher Education System in Sri Lanka, available on:
http://www.cmb.ac.lk/academic/institutes/nilis/reports/gihan.pdf. 10 July, 2010.
25. Philip Russom, Senior Manager - TDWI Research, Lawrence Weber, Lawrence Weber,
Product Strategy and Marketing Manager, IBM. Data Warehouse Packages: Quick,
Mature, and Extensible. September 28, 2010.
26. Inmon, W.H. Building the Data Warehouse, second edition, The Data Warehouse
Environment. 1996.
27. Philip Russom- Senior Manager, TDWI Research. Trusted Data for BI:Integrating Data
for Success. September 30, 2010.
28. Inmon, Ralph Kimball forward by W.H. The Data Warehouse toolkit, Practicla
Techniques for Building Dimentional Data Warehouses. 27 August : s.n., 1995.
29. Miguel Bento Alves. Data Warehouse modeling. 2008-2009.
30. Software, BIReady. Available source: http://www.biready.com/. 5 August, 2010.
31. William McKnight, SVP Data Warehousing, Conversion Services International.
Choosing Microsoft SQL Server 2005 for Data Warehousing. December 2006.
32. Jorge Ribeiro. Information System to support Quality Management Systems: a case
study in a Portuguese high educational institution, School of Technology and
Management, Viana do Castelo Polytechnic Institute. 2010.
33. A Forrester Consulting Thought Leadership Paper Commissioned By. Agile BI - Best
Practice For Breaking Through The BI Backlog. Endeca. April 2010.
34. Paul Kautza, Wayne Eckerson, TDWI Research. Developing Agile BI Environment: The
Insider’s Track to TDWI World Conference. August 2010.
35. Tableau Software. Avalilable on: http://www.tableausoftware.com/business-
intelligence-dashboards. 17 October, 2010.
36. Tableau Software. Avalilable on: http://www.tableausoftware.com/products/tour. 26
October, 2010.
37. Hall, O. P. Using Dashboard-Based Business Intelligence Systems - An approach to
improving business performance, Graziadio Bussiness Report – A Journal of Relevant
Information and Analysis, http://gbr.pepperdine.edu/034/bis.html. 2003, Volume 6,
Issue 4.

85
Appendix A– Current standards from ISO/TC
176 and its subcommittees

86

87
Appendix B – IPVC business needs and DW
models
B.1. Introduction
In the frame of this project we had access to the Key Performance Indicators
(KPI) list to develop the BI application. In general, IT projects development life cycle
requires intensive interaction with business managers to define and specify the
requirements in order to understand the business needs. As it is frequent in this kind of
projects, the provided requirements were ambiguous, so we need to get explanations
from QMS personnel. For this purpose, during the project implementation process, we
would have to schedule a set of meetings in order to understand KPI requirements.
However, QMS managers were unavailable to schedule those meetings to clarify the
requirements or the scheduled meetings were not enough to understand some processes.
For that reason, we decide to interpret the business needs using other sources, such as
internet, interviews with front office personnel and teachers from other universities. As
QMS managers do not had time to validate all processes, we present the processes that
we have developed, being only presented the models.
B.2. Implementation process
In this appendix we present a set of multi-dimensional data-models created in
this project. The option to present models in appendix is due to the fact that QMS
managers do not had time to validate processes and were not involved intensely in agile
methodology steps during the BI project implementation. Since we were not able to
validate all processes, for the reason already stated in this document, we choose an
approach that includes the study of the KPI requirements of some processes. Based on
the document provided by QMS staff, we studied KPI requirements and try to
understand information requirements in order to develop multi-dimensional model to
support these requirements. However, there is several information, in particular the
defined measures, for which we were unable to understand purposes as they were
defined in KPI requirements list. Nevertheless, we manage to define some data models
to support the information requirements. In the future perspective, when it will be
possible to perform the validation of processes for KPI, the developed models will be a

88
good starting point to do the calculation and easily change formulas to get new kind of
measures or to improve the defined measures.
In this context, we present in the next section we present the business needs, KPI
requirement, star models and measures developed in this project in order to answer the
KPI requirements list. For each KPI, we will present the definition as it was listed on
the KPI requirement document. We ignored measures that we did not have a minimum
understanding of its meaning. Finally, we would like to underline one more time that in
this appendix we present the KPI with any kind of validation.
B.3. IPVC Business Needs
Social Service - Scholarship
IPVC QMS staff has needs to analyze all processes which are related to
scholarships in IPVC schools. They are interested in analyzing the information about
interviews and visits to students applying for scholarships, as well as users‟ satisfaction
related to provided services.
Table 1 presents IPVC Scholarship process KPI requirements list provided by
QMS managers.
Process Process/
Sub-process Indicator
Calculation Formula Unit of
Measure
Social
Service
Scholarships Percentage of
interview
conducted for
students applying
for scholarship of
1st year and 1
st
enrollment
Number of interviews /
Number of students
applying for scholarship
of 1st year and 1
st
enrollment
%
Social
Service
Scholarships Percentage of
domiciliary visits
to students
applying for
scholarship of 1st
year and 1st
enrollment
Number of home visits /
Number of students
applying for scholarship
of 1st year and 1
st
enrollment
%
Table 1 - Scholarship interviews and domiciliary visits KPI requirements.
To answer the first two KPI requirements shown above, we define a star model
for scholarship process as illustrated in Figure 1, which is composed of fact table and

89
dimension tables which includes schools, time, students, courses, course year and
enrollment number. The fields withInterview and withHomeVisit of fact table will have
a value of zero or one indicating, respectively, if it has been conducted an interview or
made a domiciliary visit to the student or not.
Figure 58 – Star model of scholarship interviews and domiciliary visits.
To answer KPI requirements we define the following measure:
Percentage of interview conducted for students applying for scholarship of 1st year
and 1st enrollment:
Measure name: IntervStudents
Expression: ([Measures].[With Interview],[Dim Course Year].[Course
Year].&[1st],[Dim Enrollment Number].[Enrollment
Number].&[1st])/([Measures].[Fact Scholarship Apply Count],[Dim Course
Year].[Course Year].&[1st],[Dim Enrollment Number].[Enrollment
Number].&[1st])
Percentage of domiciliary visits to students applying for scholarship of 1st year and
1st enrollment:
Measure name: DomVisitsStudents

90
Expression: ([Measures].[With Home Visit],[Dim Course Year 1].[Course
Year].&[1st],[Dim Enrollment Number].[Enrollment
Number].&[1st])/([Measures].[Fact Scholarship Apply Count],[Dim Course Year
1].[Course Year].&[1st],[Dim Enrollment Number].[Enrollment Number].&[1st])

87
Appendix A – IPVC business needs and DW
models
B.1. Introduction
In the frame of this project we had access to the Key Performance Indicators (KPI) list to
develop the BI application. In general, IT projects development life cycle requires intensive
interaction with business managers to define and specify the requirements in order to understand
the business needs. As it is frequent in this kind of projects, the provided requirements were
ambiguous, so we need to get explanations from QMS personnel. For this purpose, during the
project implementation process, it was necessary to schedule a set of meetings in order to
understand KPI requirements. However, QMS managers were unavailable to schedule those
meetings to clarify the requirements or the scheduled meetings were not enough to understand
some processes. For that reason, we decided to interpret the business needs using other sources,
such as internet, interviews with front office personnel and teachers from other universities. As
QMS managers do not had time to validate all processes, we present the processes that we have
developed, being only presented the models.
B.2. Implementation process
In this appendix we present a set of multi-dimensional data-models created in this project.
The option to present models in appendix is due to the fact that QMS managers do not had time
to validate processes and were not involved intensely in agile methodology steps during the BI
project implementation. Since we were not able to validate all processes, for the reason already
stated in this document, we choose an approach that includes the study of the KPI requirements
of some processes. Based on the document provided by QMS staff, we studied KPI requirements
and try to understand information requirements in order to develop multi-dimensional model to
support these requirements. However, there was several information, in particular the defined
measures, for which we were unable to understand purposes as they were defined in KPI
requirements list. Nevertheless, we managed to define some data models to support the
information requirements. In the future, when it will be possible to perform the validation of

88
processes for KPI, the developed models will be a good starting point to do the calculation and
easily change formulas to get new kind of measures or to improve the defined measures.
In this context, we present in the next section the business needs, KPI requirement, star
models and measures developed in this project in order to answer the KPI requirements list. For
each KPI, we will present the definition as it was listed on the KPI requirement document. We
ignored measures that we did not have a minimum understanding of its meaning. Finally, we
would like to underline one more time that in this appendix we present the models defined for
KPI with any kind of validation.
B.3. IPVC business needs
Social Service - Scholarship
IPVC QMS staff has needs to analyze all processes which are related to scholarships in
IPVC schools. They are interested in analyzing the information about interviews and visits to
students applying for scholarships, as well as users’ satisfaction related to provided services.
Table 1 presents IPVC Scholarship process KPI requirements list provided by QMS
managers.
Process Process/
Sub-process Indicator
Calculation Formula Unit of
Measure
Social
Service
Scholarships Percentage of
interview conducted
for students
applying for
scholarship of 1st
year and 1st
enrollment
Number of interviews /
Number of students applying
for scholarship of 1st year and
1st enrollment
%
Social
Service
Scholarships Percentage of
domiciliary visits to
students applying
for scholarship of
1st year and 1
st
enrollment
Number of home visits /
Number of students applying
for scholarship of 1st year and
1st enrollment
%
Table 1 - Scholarship interviews and domiciliary visits KPI requirements.
To answer the first two KPI requirements shown above, we define a star model for
scholarship process as illustrated in Figure 1, which is composed of a fact table and dimension

89
tables which includes schools, time, students, courses, course year and enrollment number. The
fields withInterview and withHomeVisit of fact table will have a value of zero or one indicating,
respectively, if it has been conducted an interview or made a domiciliary visit to the student or
not.
Figure 1 – Star model of scholarship interviews and domiciliary visits.
To answer KPI requirements we define the following measure:
Percentage of interview conducted for students applying for scholarship of 1st year and 1st
enrollment:
Measure name: IntervStudents
Expression: ([Measures].[With Interview],[Dim Course Year].[Course Year].&[1st],[Dim
Enrollment Number].[Enrollment Number].&[1st])/([Measures].[Fact Scholarship Apply
Count],[Dim Course Year].[Course Year].&[1st],[Dim Enrollment Number].[Enrollment
Number].&[1st])
Percentage of domiciliary visits to students applying for scholarship of 1st year and 1st
enrollment:
Measure name: DomVisitsStudents

90
Expression: ([Measures].[With Home Visit],[Dim Course Year 1].[Course Year].&[1st],[Dim
Enrollment Number].[Enrollment Number].&[1st])/([Measures].[Fact Scholarship Apply
Count],[Dim Course Year 1].[Course Year].&[1st],[Dim Enrollment Number].[Enrollment
Number].&[1st])
Another KPI requirement of scholarships process is related to users’ satisfaction (Table 2)
Process Process/
Sub-process Indicator
Calculation Formula Unit of
Measure
Social
Service
Scholarships Average level of
satisfaction of
scholarship services
∑ (question rating x weighting)
/ number of response
Inquiry
scale
Table 2 - Scholarships satisfaction KPI requirement.
To answer the last KPI requirements of scholarship process, we define the star model
illustrated in Figure 2, which is composed of a fact table to register satisfaction levels and
dimension tables, which includes schools, time, students, course, and scholarship satisfaction
type.
Figure 2 - Star model scholarship satisfaction process
For this KPI, we define a calculated measure to determine the average level of
satisfaction of scholarship services using the following formula:
Calculated measure name: AVGsatisfactionArea
MDX expression: [Measures].[Question Weighted]/[Measures].[Weighting]

91
International Cooperation
IPVC QMS staff has needs to analyze international cooperation department’s work in
IPVC schools. They need to be able to analyze the information about partnerships, agreements,
protocols and student, teacher and non-teacher mobility.
Table 3 represents IPVC International cooperation mobility KPI requirement.
Process Process/
Sub-process Indicator
Calculation Formula Unit of
Measure
International
Cooperation
International
Cooperation Teachers
Mobility
Variation of number of
teachers sent per year %
Variation of number of
teachers received per year %
International
Cooperation
International
Cooperation Students
Mobility
Variation of number of
students sent per year %
Variation of number of
incoming students per year %
International
Cooperation
International
Cooperation Non-
teachers
Mobility
Variation of number of non-
teachers sent per year %
Variation of number of non-
teachers received per year %
Table 3 - International cooperation mobility KPI requirements
Figure 3 presents the fact table created to store information about mobility of teachers,
students and non-teachers and dimension tables about schools, time, courses, mobility type (sent
or received) and group type (teacher, student or non-teacher).
Figure 3 – Star model of international mobility.

92
To answer KPI requirements we define the following measure:
Variation of number of teachers sent per year:
Measure name: NumberTeachersSent
Expression: ([Measures].[FactIntMobility Count],[Dim Group
Type].[GroupName].&[Teacher], [Dim Mobility Type].[Mobility Name].&[Sent])
Measure name: VarNumberTeachersSent
Expression: ([Measures].[NumberTeachersSent]/(ParallelPeriod([Dim Time].[Year].[Year],
1, [Dim Time].[Year].currentmember), [Measures].[NumberTeachersSent]))-1
Variation of number of teachers received per year:
Measure name: NumberTeachersReceived
Expression: ([Measures].[FactIntMobility Count],[Dim Group
Type].[GroupName].&[Teacher], [Dim Mobility Type].[Mobility Name].&[Received])
Measure name: VarNumberTeachersReceived
Expression: ([Measures].[NumberTeachersReceived]/(ParallelPeriod([Dim
Time].[Year].[Year], 1, [Dim Time].[Year].currentmember),
[Measures].[NumberTeachersReceived]))-1
Variation of number of students sent per year:
Measure name: NumberStudentsSent
Expression: ([Measures].[FactIntMobility Count],[Dim Group
Type].[GroupName].&[Student], [Dim Mobility Type].[Mobility Name].&[Sent])
Measure name: VarNumberStudentsSent
Expression: ([Measures].[NumberStudentsSent]/(ParallelPeriod([Dim Time].[Year].[Year],
1, [Dim Time].[Year].currentmember), [Measures].[NumberStudentsSent]))-1
Variation of number of students received per year:
Measure name: NumberStudentsReceived
Expression: ([Measures].[FactIntMobility Count],[Dim Group
Type].[GroupName].&[Student], [Dim Mobility Type].[Mobility Name].&[Received])
Measure name: VarNumberStudentsReceived

93
Expression: ([Measures].[NumberStudentsReceived]/(ParallelPeriod([Dim
Time].[Year].[Year], 1, [Dim Time].[Year].currentmember),
[Measures].[NumberStudentsReceived]))-1
Variation of number of non-teachers sent per year:
Measure name: NumberNTeachersSent
Expression: ([Measures].[FactIntMobility Count],[Dim Group Type].[GroupName].&[Non-
teacher], [Dim Mobility Type].[Mobility Name].&[Sent])
Measure name: VarNumberNTeachersSent
Expression: ([Measures].[NumberNTeachersSent]/(ParallelPeriod([Dim Time].[Year].[Year],
1, [Dim Time].[Year].currentmember), [Measures].[NumberNTeachersSent]))-1
Variation of number of non-teachers received per year:
Measure name: NumberNTeachersReceived
Expression: ([Measures].[FactIntMobility Count],[Dim Group Type].[GroupName].&[Non-
teacher], [Dim Mobility Type].[Mobility Name].&[Received])
Measure name: VarNumberNTeachersReceived
Expression: ([Measures].[NumberNTeachersReceived]/(ParallelPeriod([Dim
Time].[Year].[Year], 1, [Dim Time].[Year].currentmember),
[Measures].[NumberNTeachersReceived]))-1
Table 4 presents IPVC International cooperation partnerships KPI requirement.
Process Process/
Sub-process Indicator
Calculation Formula Unit of
Measure
International
Cooperation
International
Cooperation Partnerships
Number of protocols/365 %
Number of mobility
agreements (established and
renewed) per year/365
%
Table 4 - International Cooperation partners KPI requirement
Figure 4 represents fact table of international cooperation protocols and its connections to
dimension tables. We have the following dimensions: schools, time, agreement type, partners
and protocol types.

94
Figure 4 – Star model of International cooperation protocols
To answer KPI, we define the following measure:
MDX command
Calculated measure name: ProtocolRate (Partners)
MDX code: [Measures].[Fact Int Coop Protocols Count]/365
Calculated measure name: AgreementRate (Partners)
MDX code: ([Measures].[Fact Int Coop Protocols Count],[Dim Agreement
Type].[All])/365
Creation and Restructuring of Courses
IPVC QMS staff would like to analyze courses creation and restructuring process in
schools. They need to begin analyze the information in schools about proposed and restructured
of courses in each semester.
Table 5 represents creation restructuring of courses KPI requirement.
Process Process/
Sub-process Indicator
Calculation Formula Unit of
Measure
Creation /
restructuring
of Courses
Creation /
restructuring
of Courses
Proposed
courses or
restructuring
of the 1st
Cycle
Number of Courses Validated
IPVC / Number of courses
offered or restructured
%
Proposed
courses or
restructured
2nd Cycle
Number of 2nd Cycle Courses
Validated IPVC / Number of
courses offered or restructured
%

95
Restructuring
of Courses in
Operation 1st
Cycle
Number of courses restructured
1st cycle / functioning course
number
%
Table 5 – Creation restructuring of courses KPI requirements
Figure 5 presents fact table of course functioning course and its connections to dimension
tables. We have the following dimensions: schools, time, courses and courses cycles.
Figure 5 – Star model of functioning courses
Figure 6 represents fact table of course offers and its connections to dimension tables. In
we have the following dimensions: schools, time, courses and courses cycles.
Figure 6 – Star model of functioning course Offer
Figure 7 represents fact tables of restructured courses and its connections to dimension
tables. We have following dimensions: schools, time, courses and courses cycles.

96
Figure 7 - Star model of courses restructure
Figure 8 represents fact table of validated courses and its connections to dimension tables.
We have the following dimensions: schools, time, courses, course years and courses cycles.
Figure 8 - Star model of courses validation
Formation – Planning
IPVC QMS staff would like to analyze all work which is related to formation planning
processes in IPVC schools.
Table 6 presents a planning of formation KPI requirement.
Process Process/
Sub-process Indicator
Calculation Formula Unit of
Measure
Formation Planning Application fee of
needs # delivered / # expected %
Fee schedules # Schedules prepared / # %

97
prepared hours required
Rate of submission of
evaluation schedule
# Calendars made / total #
calendars %
Application fee for the
programs of Un.
Curriculum
# Programs produced /
total # programs %
Number of proposals # Proposals Number
Table 6 – Formation planning KPI requirements
Figure 9 represents Star model of planning application fee and its connections to
dimension tables. We have the following dimensions: schools, time, courses and planning types.
Figure 9 - Star model of planning application fee
Figure 10 presents the fact table of scheduling and its connections to the dimension
tables. We have the following dimensions: schools, time, courses, hour required, planning types
which are related to formation planning processes.
Figure 10 - Star model of scheduling

98
Figure 11 represents fact table of planning proposals and its connections to the dimension
tables. We have the following dimensions: schools, time, and courses which are related to
formation planning processes.
Figure 11 – Star model of Proposals
Figure 12 represents the fact table of planning programs and its connections to the
dimension tables. We have the following dimensions: schools, time, and courses.
Figure 12 - Star model of planning programs
Figure 13 represents the fact table of planning calendar and its connections to the
dimension tables.
Figure 13 - Star model of planning calendar

99
Formation – Implementation and Evaluation
IPVC QMS staff has needs to analyze formation implementation and evaluation process
in schools. They need to get reports and then to be able drilling down to the year, quarter and
month and date levels.
Table 7 represents creation restructuring of courses KPI requirement.
Process Process/ Sub-
process Indicator
Calculation
Formula
Unit of
Measure
Formation Implementation
and Evaluation
Rate of availability of briefs
(summary).
%
Compliance %
Rate of release of Number of from
teaching activity
%
Compliance %
Rate of submission of the report of
the PA at the end of school year
%
Compliance %
Satisfaction survey of students in
quality
% Of
positive
responses
%
Launch rate of the Number of
Internships / Clinical Training /
IPP
%
Compliance %
Launch rate of grade in mobility %
Compliance %
Degree of student satisfaction in
the quality survey (course)
% Of
positive
responses
%
Entrega do Relatório da Direcção
de Curso
%
Compliance %
Table 7 – Implementation and evaluation process KPI requirements
Figure 14 represents the fact table of formation brief evaluation and its connections to the
dimension tables. We have the following dimensions: schools, time, evaluation type and
evaluation result.

100
Figure 14 - Star model of brief evaluation
Figure 15 represents fact table of evaluation teaching implementation and its connections
to the dimension tables. We have the following dimensions: schools, time, evaluation result,
courses and teachers.
Figure 15 - Star model of evaluation teaching implementation
Figure 16 represents the fact table of Evaluation PA and its connections to the dimension
tables. We have the following dimensions: schools, time, evaluation result, students and courses
which are related to formation implementation and planning processes.

101
Figure 16 - Star model of evaluation PA
Figure 17 represents the fact table of grades evaluation and its connections to the
dimension tables. We have the following dimensions: schools, time, evaluation result, students,
teacher, courses and course year.
Figure 17 - Star model of grades evaluation
Figure 18 represents the fact table of launch evaluation and its connections to the
dimension tables. We have the following dimensions: schools, time, evaluation result, evaluation
type, students and courses.

102
Figure 18 - Star model of evaluation launch
Figure 19 represents the fact table of students’ evaluation and its connections to the
dimension tables. We have the following dimensions: schools, time, evaluation result, students,
courses and course years.
Figure 19 - Star model of student’s evaluation
Figure 20 presents the fact table of degree evaluation and its connections to the dimension
tables. We have the following dimensions: schools, time, evaluation result, students, and courses
which are related to formation implementation and planning processes.

103
Figure 20 - Star model evaluation degree
Economic and Financial Management - Supply
IPVC QMS staff has needs to analyze economic and financial department supply
management process. They are interested in analyzing all the information about proposed dates,
periods of tenders, stock breaks and more.
Table 8 represents supply process KPI requirement.
Process
Process/
Sub-
process
Indicator
Calculation Formula Unit of
Measure
Economic and
financial
management
Supply Average time to
perform the
procedures
Date of approval of the
procedure - proposed date of
employment - period of
tender
Days
Fee Defaults
Total demerits / Total
supplies or months of
employment
%
Supplier Rating Classification "B" class %
Classification "C" class %
Break stocks Number of Breaks Number
Table 8 – Supply process KPI requirements
Figure 21 presents the fact table of supply procedures and its connections to the
dimension tables. We have the following dimensions: schools, time, procedure types and stock.

104
Figure 21 - Star model of supply fee
Figure 22 represents the fact table supply fee and its connections to the dimension tables.
We have the following dimensions: time, tender types, employee and supply process status.
Figure 22 - Star model of supply fee
Figure 23 represents the fact table of supply contracts breaks and its connections to the
dimension tables. We have the following dimensions: time, tender types, employee and supply
process status.

105
Figure 23 - Star model of supply breaks
Economic and Financial Management – Heritage
IPVC QMS staff would like to analyze in economic and financial department Heritage
process. They are interested in analyzing information about existing physical of assets,
conducted conferences, documentation of goods.
Table 9 presents heritage process KPI requirement.
Process
Process/
Sub-
process
Indicator
Calculation Formula Unit of
Measure
Economic and
financial
management
Heritage Number of Existing
Assets Physically,
undocumented
Conducting periodic
conferences Number
Number of
documented goods
and Number of found
Conducting periodic
conferences Number
Table 9 – Heritage process KPI requirements
Figure 24 represents the fact table of heritage and its connections to the dimension tables.
We have the following dimensions: time, heritage types, document types and school.

106
Figure 24 - Star model of heritage
Economic and Financial Management - Accounting and Treasury
IPVC QMS staff would like to analyze in economic and financial department Accounting
and Treasury process. They are interested in analyzing information about budgets and budgets
changing, software’s releases.
Table 10 presents accounting and treasury process KPI requirement.
Process
Process/
Sub-
process
Indicator
Calculation Formula Unit of
Measure
Economic and
financial
management
Accountin
g &
Treasury
Number of changes
between budget lines Number of changes
Number/
Month
Timeliness of the
register on the
Software SIGO
Releases out of time Number
Budgetary Analysis
Revenue Collected -
Commitments
undertaken
Number
Table 10 – Accounting and treasury process KPI requirements
Figure 25 represents the fact table of account changing and its connections to the
dimension tables. We have the following dimensions: schools, time, budgets name and budget
lines.

107
Figure 25 – Star model of account change
Figure 26 represents the fact table of accounting releases and its connections to the
dimension tables. We have the following dimensions: schools, time, release status, software’s
and release type’s lines.
Figure 26 - Star model of accounting releases
Figure 27 presents the fact table of accounting budget and its connections to the
dimension tables. We have the following dimensions: schools, time, and budget revenues,
analysis and names.

108
Figure 27 - Star model of accounting budget
Information Management – Dispatch and Archive
IPVC QMS staff would like to analyze in department of information and management the
Dispatch and Archive process. They are interested in analyzing information which is related to
customer’s complaints.
Table 11 represents accounting and treasury process KPI requirement.
Process
Process/
Sub-
process
Indicator
Calculation Formula Unit of
Measure
Information
Management
Dispatch
and
Archive
Number of
complaints related to
telephone and face-
Care
records of incidents /
complaints book Number
Table 11 – Accounting and treasury process KPI requirements
Figure 28 represents the fact table of dispatch/archive and its connections to the dimension
tables. We have the following dimensions: schools, time, compliance record types and
complaints.

109
Figure 28 - Star model of Dispatch/Archive
Information Management - Document Management
IPVC QMS staff would like to analyze Document Management process. They are
interested in analyzing information related to regulatory complaints.
Table 11 represents accounting and treasury process KPI requirement.
Process
Process/
Sub-
process
Indicator
Calculation Formula Unit of
Measure
INFORMATION
MANAGEMENT
Document
Manageme
nt
Compliance with
regulatory
requirements (4.2.3
and 4.2.4)
Number of non-
compliances Number
Table 12 – Accounting and treasury process KPI requirements
Figure 29 represents the fact table of document management and its connections to the
dimension tables. We have the following dimensions: schools, time, and compliance variety
which.

110
Figure 29 – Star model of document management
Management and improvement of system
IPVC QMS staff would like to analyze system improvement management process. They
are interested in analyzing information about systems treatments, compliances with the annual
program of audits, quality achievements and assessment satisfactions.
Table 13 represents accounting and treasury process KPI requirement.
Process Process/
Sub-process Indicator
Calculation Formula Unit of
Measure
Management
and
improvement
of system
Document
Management Treatment
occurrences
Number of Occurrences
identified - Number of
Occurrences treated
Number
Compliance with the
annual program of
audits
(Number of audits /
Number of audits
planned) X 100
%
Process indicators in
targets
(Paragraph indicators
within the targets /
indicators total Number
of ) x 100
%
Achievement of
quality objectives
(Number of
achievements / Number
of total goals) x 100
%
Assessment
Questionnaire
Employee
Satisfaction
weighted average index
of satisfaction
Inquiry
scale
Student satisfaction
rating-quality
education (school)
% Of positive responses %
Table 13 – Accounting and treasury process KPI requirements

111
Figure 30 represents the fact table of system treatment result and its connections to the
dimension tables. We have the following dimensions: schools, occurrence type, treatment status,
software, data type and date.
Figure 30 - Star model of system treatment result
Figure 31 represents the fact table of system compliances and its connections to the
dimension tables. We have the following dimensions: schools, time, audit status, software, ISO
type and audit Type.
Figure 31 - Star model of system compliances

112
Figure 32 represents the fact table of indicator and its connections to the dimension
tables. In dimensions tables are stored all information about schools, indicators, time and
process.
Figure 32 - Star model of indicator
Figure 33 represents the fact table of system achievements and its connections to the
dimension tables. In dimensions tables are stored all information about schools, achievements,
time and software’s which are related to management improvement system process.
Figure 33 - Star model of system achievement
Figure 34 represents the Fact Fact15SEmployeeSatisfuction table and its connections to
the dimension tables. In dimensions tables are stored all information about time, schools,

113
satisfaction, process and software’s which are related to Management Improvement System
process.
Figure 34 - Star model of Fact15SEmployeeSatisfuction
Figure 35 represents the fact table of schools satisfaction and its connections to the
dimension tables. We have the following dimensions: schools, courses, satisfaction Type, time
and students.
Figure 35 - Star model of schools satisfaction

114
Management contracts and infrastructure
IPVC QMS staff would like to analyze management contracts and infrastructure process.
They are interested analyzing information about systems treatments, compliances with the annual
program of audits, quality achievements and assessment satisfactions.
Table 14 presents accounting and treasury process KPI requirement.
Process Process/
Sub-
process
Indicator Calculation Formula Unit of
Measure
INFORMATION
MANAGEMENT
Manageme
nt
contracts
and
Infrastruct
ure
Detours Planned /
Executed
Number of maintenance
Number of t performed /
Number of planned
maintenance
%
more Jobs than the
scheduled
value of work to be
deducted from most of
the work unless / value of
the initial proposal
%
Failure of Time Delays attributed to the
executor / execution time %
Table 14 – Management contracts and infrastructure KPI requirements
Figure 36 represents the fact table of constructs detours and its connections to the
dimension tables. We have the following dimensions: schools, employee, time and management
statuses.
Figure 36 - Star model Contracts Detours.

115
Figure 37 represents the fact table of contractor jobs and its connections to the dimension
tables. We have the following dimensions: schools, time jobs type and schedule statuses which
are related to Management contracts and infrastructure process.
Figure 37 - Star model of contractor jobs
Figure 38 represents the Fact table and its connections to the dimension tables. In
dimensions tables are stored all information about schools, time delay reasons and execution
time, which are related to management contracts and infrastructure process.
Figure 38 – Star model of Failure
Project Management
IPVC QMS staff would like to analyze project management process. They are interested
in analyzing information about implementation of applications, schedules, plans and undertaken
activities.

116
Table 15 presents project management process KPI requirement.
Process Process/
Sub-
process
Indicator Calculation
Formula
Unit of
Measure
INFORMATION
MANAGEMENT
Project
manageme
nt
Physical implementation
rate (value obtained from
the last application for
external entities approved
reprogramming)
Activities undertaken
/ planned activities
(schedule)
%
Financial execution rate Financing run /
Funding approved %
Table 15 – Project management KPI requirements
Figure 39 represents the fact table of undertaken activities and its connections to the
dimension tables. We have the following dimensions: schools, time applications and schedules.
Figure 39 - Star model of undertaken activities
Figure 40 represents the fact table of projects finances and its connections to the
dimension tables. We have the following dimensions: schools, time applications and finances
which are related to project management process.

117
Figure 40 – Star model of projects finances
Management information systems
IPVC QMS staff would like to analyze management information systems process. They
are interesting analyzing information about conducted trainings, information systems
occurrences, backups and tests.
Table 16 presents management information system KPI requirement.
Process Process/
Sub-process
Indicator Calculation
Formula
Unit of
Measure
Management
Information
Systems
Management
Information
Systems
Number of requests for
support from users caused
by their inadequate
training
Number
Number of occurrences
per annual application
server software that
caused breaks in
operation
Number of
occurrences per
annual application
server software that
caused breaks in
operation
Number
Average time (days)
answer to the recovery
component of the tech
Number of logical
infrastructure without
purchasing components
Average between the
date of the
occurrence of
computer failure and
date of incident
resolution
computerized
Number
of Days
Rate of incidents that
require support on site
(outside the Computer
(Total number of
incidents that require
support local / Total
%

118
Services) of the
occurrence
incidents) * 100
Event rate resolved and
finalized the
responsibility of
Computer Services
(Occurrences
resolved and
completed / finalized
Total occurrences) *
100
%
Rate of incidents
reopened
(Total number of
incidents reopened /
Total incidents) * 100
%
Rate backups of critical
data (defined by the
policy of backups)
(Number of backups
of critical data / Total
data critical) * 100
%
Rate tests successful
backups of data from
Information Systems
(Number of tests
performed backups /
Total number of
backups made) * 100
%
Table 16 – Management information systems KPI requirements
Figure 41 represents the fact table of IS trainings and its connections to the dimension
tables. We have the following dimensions: schools, time training types and software’s.
Figure 41 - Star model of IS trainings
Figure 42 represents the fact table of IS occurrences and its connections to the dimension
tables. We have the following dimensions: schools, time occurrences type, occurrences events
and software’s.

119
Figure 42 - Star model of IS occurrences
Figure 43 represents the fact table of IS incidents and its connections to the dimension
tables. We have the following dimensions: schools, time, incidents and applications.
Figure 43 - Star model of IS incidents
Figure 44 represents the fact table of IS backups and its connections to the dimension
tables. We have the following dimensions: schools, time critical levels, backup types and
applications which are related to management information systems process.

120
Figure 44 - Star model of IS backups
Observatory
IPVC QMS staff would like to analyze Observatory process. They are interested in
analyzing information about conducted questioners and surveys.
Table 17 represents accounting and treasury process KPI requirement.
Process Process/ Sub-
process Indicator
Calculation Formula Unit of
Measure
Observatory Observatory Rate Answers to the
Questionnaire for
Assessment of Quality
of Teaching and
Organic unit
(Number of validated
questionnaires / Total
number of students) *
100
%
Inquiry companies and
institutions in the
region
Number of companies
and institutions surveyed
/ Total number of
companies and
institutions in the region
%
Response Rate to
Questionnaires to staff,
by organizational unit
(Number of validated
questionnaires / Total
number of employees) *
100
%
Table 17 – Observatory KPI requirements

121
Figure 45 represents the fact table of teaching and its connections to the dimension tables.
We have the following dimensions: schools, time, students, teachers and courses.
Figure 45 - Star model of teaching
Figure 46 represents the fact table of observing inquiry and its connections to the
dimension tables. We have the following dimensions: locations, time and organization variety.
Figure 46 - Star model of inquiry
Figure 47 represents the fact table of questioners and its connections to the dimension
tables. We have the following dimensions: questioner status, time, location and observation type
which are related to Observatory process.

122
Figure 47 - Star model of questioners
Figure 48 represents the fact table of questioner responds and its connections to the
dimension tables. We have the following dimensions: question responds, organization variety,
question status and time which are related to Observatory process.
Figure 48 - Star model of Question Responds
Promotion and Image – Graphics Production and Audiovisual
IPVC QMS staff would like to analyze graphics promotion and audiovisual process. They
are interested analyzing information about compliance works and submitted complaints.

123
Table 18 represents Graphics production and audiovisual process KPI requirement.
Process Process/
Sub-process Indicator
Calculation Formula Unit of
Measure
PROMOTI
ON AND
IMAGE
Graphics
production
and
audiovisual
Rate of work
performed in
accordance
(Number of studies
conducted in compliance /
total number of works)
records
Rate complaint
submitted
(Number of studies
conducted in compliance /
total number of works)
complaints
register
Table 18 – Graphics production and audiovisual KPI requirements
Figure 49 represents the fact table of graphics production and its connections to the
dimension tables. We have the following dimensions: time, schools, company types, study types,
complaint, and students.
Figure 49 - Start model of graphical production
Promotion and Image – External and Internal Communication
IPVC QMS staff would like to analyze External and Internal Communication process. They
are interested in analyzing information about achievements, opportunities, proposals approvals
and implementation, degree satisfaction, conducted training completeness, consultations and
portals visits.

124
Table 19 represents External and internal communication KPI requirement.
Process Process/
Sub-process Indicator
Calculation Formula Unit of
Measure
PROMOTI
ON AND
IMAGE
Graphics
production
and
audiovisual
Opportunity Disclosure Number of achievements /
Number of Opportunities %
Number of approved
proposals
Number of approvals /
Number of proposals %
Number of proposals
implemented
Number of proposals used
/ Number of approvals %
Satisfaction degree User surveys (%) %
Completeness
Number of demand
training offer different
Public
%
Number of
consultations / visits
Portal
Number of visits daily and
annual average
Number/D
ay
Number of Publications
and Communications
(Student Guide,
Revised IPVC, Getting
Home)
Number of Publications
Executed %
Table 19 – External and internal communication KPI requirements
Figure 50 represents the fact table of disclosure and its connections to the dimension
tables. We have the following dimensions: disclosure type, communication type, schools and
time.
Figure 50 - Star model of disclosure

125
Figure 51 represents the fact table of proposals and its connections to the dimension
tables. We have the following dimensions: proposals, improvements, schools, times and
organization varieties.
Figure 51 - Star model of proposals
Figure 52 represents the fact table of proposals implementation and its connections to the
dimension tables. We have the following dimensions: schools, time, proposals, approves and
proposals usages.
Figure 52 - Star model of proposals implementation
Figure 53 represents the fact table of communication satisfaction and its connections to
the dimension tables. In dimensions tables are stored all information about schools, time,

126
questioner satisfaction and questioner types which are related to external and internal
communication process.
Figure 53 - Star model of communication satisfaction
Figure 54 represents the Fact Fact21Completeness table and its connections to the
dimension tables. In dimensions tables are stored all information about schools, time,
completeness types, trainings and organization varieties which are related to external and internal
communication process.
Figure 54 - Star model of Fact21completeness
Figure 55 represents the fact table of portal visits and its connections to the dimension
tables. We have the following dimensions: schools, time, completeness types, trainings and
organization varieties.

127
Figure 55 - Star model of visits portals
Figure 56 represents the fact tables of publications and its connections to the dimension
tables. We have the following dimensions: schools, time, publication type and publication status.
Figure 56 - Star model and publications
Human Resources
IPVC QMS staff would like to analyze Human Resources process. They are interested in
analyzing information about individuals’ cases, conducted training hours, trainings pans, training
efficiency and absentness rate.

128
Table 20 presents human resources KPI requirement.
Process Process/
Sub-process Indicator
Calculation Formula Unit of
Measure
Human
Resources
Human
Resources Individual cases full
rate
Number of complete
dossiers / Number of
employees
%
Average number of
hours of training per
employee
Number of training hours /
Number of employees Hours
Coverage rate of the
training plan
(Number of employees
covered by the training
plan / Total number of
employees)
%
Efficacy rate of training
(Effective Number of
shares / Total Number of
training)
%
Absenteeism Rate
(Number of . of hours of
absence / Total Number of
hours worked)
%
Table 20 – Human resources KPI requirements
Figure 57 presents the fact tables of dossiers and its connections to the dimension tables.
We have the following dimensions: schools, time, employee, dossiers completeness and
individuals’ type.
Figure 57 - Star model of Fact22HRDosiers

129
Figure 58 represents the fact table of HR trainings and its connections to the dimension
tables. We have the following dimensions: employee, trainings, training hours, date, training
types, training status, training coverage’s and hour absence.
Figure 58 - Star model of HR Trainings
Educational Technical Resources - Library
IPVC QMS staff would like to analyze Library process in schools. They are interested in
analyzing information about borrowing books, internal library loans and customers complaints.
Table 21 presents library KPI requirement.
Process
Process/
Sub-
process
Indicator
Calculation Formula Unit of
Measure
Educational
technical
resources
Library Number of Register
(MFN) made in the
database per year
Number of of registrations
in database Number
Number of loans / year Number of loans made Number
Number of Interlibrary
Loan / year
Number of requested
loans - Number of Loan
Number of t met
Number

130
Number of complaints /
year
Number of complaints
received Number
Table 21 – Library KPI requirements
Figure 59 represents the fact table of library and its connections to the dimension tables.
We have the following dimensions: date, books, books MFN numbers, students, courses and
schools.
Figure 59 - Star model of library
Figure 60 represents the fact table of complaints in libraries and its connections to the
dimension tables. We have the following dimensions: date, schools, libraries, customers and
complaints.

131
Figure 60 – Star model of complaints
Figure 61 represents the fact table of internal libraries process and its connections to the
dimension tables. We have the following dimensions: date, Libraries, schools and books which
are related to library process.
Figure 61 - Star model of internal libraries process
Educational technical resources - Management Education Spaces
IPVC QMS staff would like to analyze Management Education Spaces process in
schools.

132
Table 22 presents library KPI requirement.
Process
Process/
Sub-
process
Indicator
Calculation Formula Unit of
Measure
Educational
technical
resources
Managem
ent
Education
al Spaces
Satisfaction of users
AVERAGE (listing
questionnaire) number
Satisfaction Index
Requests
Percentage of the total of
requests
%
Utilization rate of
Spaces % (Over max capacity) %
Table 22 – Library KPI requirements
Figure 62 represents the fact table of education space and its connections to the
dimension tables. We have the following dimensions: date, request types, capacities, schools,
courses, labs, teachers, and books.
Figure 62 - Star model of education space

133
Figure 63 represents the fact table of space questioners and its connections to the
dimension tables. We have the following dimensions: date, schools, questioner satisfactions,
capacities, teachers and questioners filled status.
Figure 63 - Star model of space questioners