Key MAP Reports and Resources - NWEAinfo.nwea.org/rs/nwea/images/MAP-Focused-on-Growth.pdfKey MAP...
41
Focused on Growth: Key MAP Reports and Resources NWEA Webinar
Transcript of Key MAP Reports and Resources - NWEAinfo.nwea.org/rs/nwea/images/MAP-Focused-on-Growth.pdfKey MAP...

Focused on Growth: Key MAP Reports and Resources
NWEA Webinar

Our mission: Partnering to help all kids learn®
Our purpose: Growth and improvement of learning
2

In this session: Key outcomes
• Define key concepts• Identify MAP reports and tools to examine growth• Understand the benefits and considerations of
MAP resources• Learn how to apply MAP growth resources in your
setting

In this session: Focused on Growth
• Part 1: Analyzing Growth – Student and Class• Part 2: Analyzing Growth – Grade and School• Part 3: Understanding Growth – Context Matters• Part 4: Professional Development and Instructional
Resources

Defining: Student Growth
Beginning of Year
End of YearTest Event 1 Test Event 2
Student Growth

Defining: Assessment Literacy
Data Literacy
Demonstrate data literacy
Assessment Quality
Know how to create or select
high-quality assessments
IntegrateKnow how to
integrate assessment
practices and results into
action
CommunicateKnow how to communicate
accurately about student
learning
Assessment-literate educators:
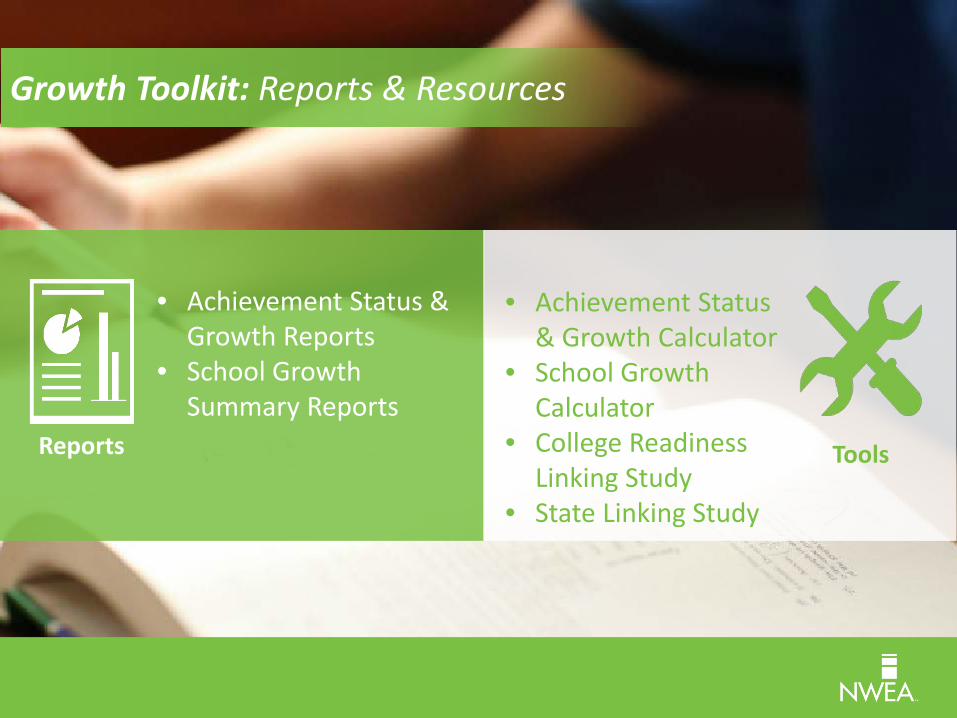
Growth Toolkit: Reports & Resources
Reports
• Achievement Status & Growth Reports
• School Growth Summary Reports
Tools
• Achievement Status & Growth Calculator
• School Growth Calculator
• College Readiness Linking Study
• State Linking Study

Analyzing Growth – Student and Class
Key Reports

Analyzing Growth – Student and Class

Analyzing Growth – Student and Class
Analyzing Growth – Student and Class
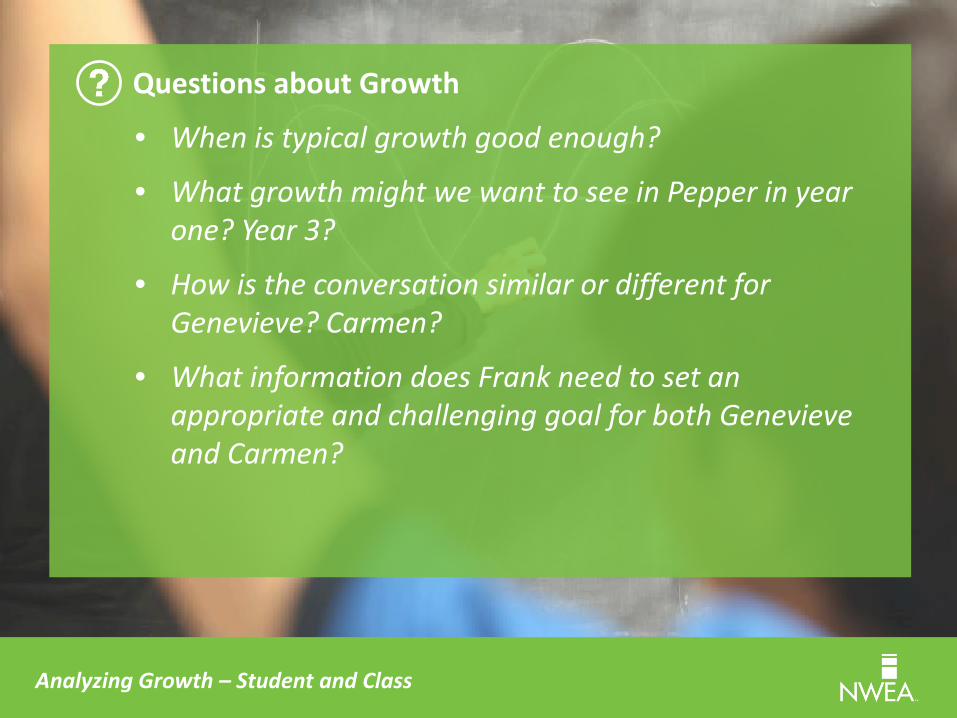
Questions about Growth
• When is typical growth good enough?
• What growth might we want to see in Pepper in year one? Year 3?
• How is the conversation similar or different for Genevieve? Carmen?
• What information does Frank need to set an appropriate and challenging goal for both Genevieve and Carmen?

Analyzing Growth – Student and Class
Key Resources
What is it?Achievement Status & Growth Calculator
Where is it?“Norms Study Resources” in both Web-Based MAP and Client-Server MAP
What does it do?• Predict data in a “what if” scenario
for both growth and status norms• Use for small groups and individual
students

Analyzing Growth – Student and Class
ASG Calculator
Projected growth from ASG fall to spring • Pepper 5 RIT• Carmen 4 RIT• Genevieve 2 RIT
What if?• Pepper grew 10 RIT?• Carmen grew 8 RIT?• Genevieve grew 4 RIT?

Analyzing Growth – Student and Class
• Percentile rank for growth
• Percentile rank for achievement
• Conditional growthindex

Accessing the calculators in Web-based

Accessing the calculators in Client-server

Analyzing Growth – Student and Class
Key Metrics: Explained
Where is it found?Achievement Status and Growth Report
What does it mean?The percent of students in a class who met or exceeded their projected RIT score on Test Event 2. Projections come from NWEA growth norms and are based on the student’s grade level and RIT score in Test Event 1.

Analyzing Growth – Student and Class
Key Metrics: Explained
Percent of Students who Metor Exceeded their
Projected RIT
Example
72%
The Metric Benefits• Percent of students who
are “on track”
• Could be compared to predetermined benchmark
• Could use prior data to set targets

Analyzing Growth – Student and Class
Key Metrics: Explained
Items to Consider• “Typical” is 50-55% of
students
• Different academic and demographic distributions of students by class
• Factors outside a teacher’s control (i.e. SES, ELL)
Percent of Students who Metor Exceeded their
Projected RIT
Example
72%
The Metric

Analyzing Growth – Student and Class
Key Metrics: Explained
Where is it found?The Achievement Status and Growth Report
What does it mean?This percentage reflects the cumulative sum of actual growth experienced by all the students in a class compared to the cumulative sum of the projected growth for all students in the class.

Analyzing Growth – Student and Class
Key Metrics: Explained
Overall Percentage of Projected RIT Met or Exceeded
Example
233.8%
The Metric Benefits• How much growth a group
of students have shown relative to growth projection
• Could be compared to a predetermined benchmark
• Could use prior data to set percentage target

Analyzing Growth – Student and Class
Key Metrics: Explained
Some Things to Consider• No current context for
what is considered “typical” at the classroom, grade, or school level
• Can be heavily influenced by outliers
• Factors outside a teacher’s control (i.e. SES, ELL)
Overall Percentage of Projected RIT Met or Exceeded
Example
233.8%
The Metric

Analyzing Growth – Grade and School
Key Reports

Key Resources
What is it?School Norms Calculator
Where is it?In the “Norms Study Resources” in both Web-Based MAP and Client-Server MAP
What does it do?Allows you to compare the performance of grade levels in your school to the performance of the same grade levels across the country
Analyzing Growth – Grade and School

Analyzing Growth – Grade and School

Key Metrics: Explained
Percentile Ranks for Growth (School
Level)
Example
71Percentile
The Metric Where is it found?School Norms Calculator
What does it mean?Compared to other grade levels around the country from the NWEA growth norms, the percentile rank of the growth experienced by your grade level
Analyzing Growth – Grade and School

Key Metrics: Explained
Percentile Ranks for Growth (School
Level)
Example
71Percentile
The Metric Benefits• Reflects changes over
measured period
• Places in context of grades across the country
• Considers starting achievement level
• Set future growth goals based on prior data
Analyzing Growth – Grade and School

Key Metrics: Explained
Percentile Ranks for Growth (School
Level)
Example
71Percentile
The Metric Some Things to Consider• Does not consider other
unique factors
• Norming information at the grade level
Analyzing Growth – Grade and School

Notes on Calculators
• Available in Destination PD™
• Can only use one at a time
Analyzing Growth – Grade and School

Understanding Growth – Context Matters
Understanding Context
Norms State Linking Studies
College and Career Readiness

Understanding Growth – Context Matters
Norms
Student
Student Norms• % of students who meet
or exceed their projected RIT
• Overall percentage of projected RIT met or exceeded
• Percentile ranks for growth (student level)
• Percentile ranks for achievement (student level)
• Conditional growth index
School
School Norms• Percentile ranks for
growth (grade level)• Percentile ranks for
achievement (grade level)

Understanding Growth – Context Matters
College and Career Readiness
College Readiness Linking Study
What is it?• Research study conducted
by NWEA• Provides MAP correlations
to ACT®• Contains ‘projected’ scores
Who is it for?• Students• Teachers• Administrators

Understanding Growth – Context Matters

Understanding Growth – Context Matters
ACT Reading Benchmark: 21MAP Cut Score: 237MAP Percentile: 77
Class: 218Pepper: 187Carmen: 210Genevieve: 236

Understanding Growth – Context Matters
State Linking Studies
State Linking Study
What is it?• Research studies conducted by
NWEA• Provides MAP correlations to
state assessment• Contains ‘cut scores’
Considerations• Percentiles vary by grade level• Not available for all states• Cut scores may or may not be
above normative data• Future studies for PARCC or SBAC

community.nwea.org
PD: Online Options
Professional Development and Instructional Resources

destinationpd.nwea.org
PD: Online Options
Professional Development and Instructional Resources
Recommended Courses• Growth Tools for MAP
WB/CS• Dynamic Reporting Suite• Linking Studies for MAP

PD: Face-to-Face Options
Professional Development and Instructional Resources
• Workshops (MAP Foundation Series)– Focusing on Growth workshop– Informing Instruction workshop (New & Improved Feb 15)
• Data Coaching Services– Consider these themes; customize with your facilitator:
• Culture of Data Use• Data Conversations• Goal-Focused Planning• Assessment Program Alignment

Instructional Resources
Professional Development and Instructional Resources
• The Learning Continuum (Web-Based)• RITtoResource.org• MAP to Khan Academy

3 Questions to Consider
1. Why are you measuring growth?2. What criteria will you use to know if
students are making appropriate or adequate growth?
3. Which resources will help you set growth goals?

Learn More:Contact your
Account Manager at 503-624-1951
Or visitNWEA.org/growth
Thank you!