KEY FINDINGS FROM THE SECOND THANH HOA BAMBOO...
39
KEY FINDINGS FROM THE SECOND THANH HOA BAMBOO SURVEY Second Prosperity Initiative Impact Assessment Report Bob Baulch, John Marsh, Nguyễn Bùi Linh, Nguyễn Hoàng Trung and Vũ Hoàng Linh Hanoi, Viet Nam November 2009
Transcript of KEY FINDINGS FROM THE SECOND THANH HOA BAMBOO...

KEY FINDINGS FROM THE SECOND THANH HOA BAMBOO SURVEY
Second Prosperity Initiative Impact Assessment Report
Bob Baulch, John Marsh, Nguyễn Bùi Linh, Nguyễn Hoàng Trung and Vũ Hoàng Linh
Hanoi, Viet Nam November 2009

2
Abstract This report examines the impact of the industrial bamboo subsector on three upland districts in northwest Thanh Hoa based on a panel survey of 210 farm households and 110 bamboo traders. Of the total of 95,000 hectares of luong bamboo (Dendrocalamus barbatus) supplying the emerging northern Viet Nam industrial bamboo cluster, approximately 43,000 hectares (46%) are located in these three districts. Over fourth‐fifths of surveyed households cultivated luong, with two‐thirds of these households harvesting culms at least once a year. We find that poverty (measured using the new international poverty line of $1.25/day) in the three districts fell from 61% to 55% between 2006 and 2008. During this time, poverty fell by 8 percentage points among households engaged in cultivating, processing or trading luong but remained unchanged for households without luong incomes. Matched difference‐in‐difference estimates show that household incomes were approximately $231 an annum higher among households with luong than without incomes from luong. If luong yields increase to 13 tons per hectare from their current level of around 6 tons/ha while prices increase to half of the Chinese moso bamboo prices ($50/ton), the percentage of people living on less than $1.25/day will fall from 49% in 2008 to 33% in 2015. This translates into just over 62,000 people leaving extreme poverty or almost $4 million more in the hands of poor people. Projected reductions in poverty due to luong incomes are even more dramatic if the higher international poverty line of $2/day is used.

3
CONTENTS Abstract .................................................................................................................. 2 Introduction............................................................................................................ 4 Overview of the Study Area and the Luong Value Chain in Northern Viet Nam ....... 4 A Note on Attribution ................................................................................................6 Description of Survey Instruments and Other Data Sources.....................................7 Household Characteristics and Livelihoods .............................................................11 Bamboo Cultivation and Harvesting ........................................................................15 Structure, Conduct and Performance of the Luong Value Chain ............................17 Changes in Income and Poverty, 2006‐2008 ...........................................................23 The Impact of Participation in the Luong Value Chain on Farmer Incomes ............28 The Poverty Reduction Potential of Industrial Bamboo ..........................................32
Summary and Conclusions .....................................................................................35 References .............................................................................................................36
FIGURES
Figure 1: Location of Households ..................................................................................9 Figure 2: Location of Collector and Trader Households/Establishments ....................10 Figure 3: Ranking of the Economic Importance of Activities and Crops .....................12 Figure 4: Lorenz Curves for Land .................................................................................14 Figure 5: Number of Culms Harvested and Sold Per Hectare, 2008............................16 Figure 6: Bamboo Farmer’s Problems and Constraints ...............................................17 Figure 7: Year When Bamboo Purchasing Started.......................................................18 Figure 8: Year of Establishment of Bamboo Processing Firms in Thanh Hoa ..............18 Figure 9: Prices Received by Farmers for Luong, 2008 ................................................20 Figure 10: Processor’s Culm Purchases Prices in North‐West Thanh Hoa ..................22 Figure 11: Bamboo Collectors and Traders Problems and Constraints .......................23 Figure 12: Sources of Income in 2006 and 2008..........................................................25 Figure 13: Cumulative Distributions of Per Capita Incomes, 2006 and 2008 .............26 Figure 14: Cumulative Distribution Functions for Per Capita Incomes .......................27 Figure 15: The Poverty Gap and Sources of Incomes for the $1.25/day Poor ............28 Figure 16: Actual and Projected Per Capita Incomes for 2008, 2015 and 2020..........33
TABLES Table 1: Tracking of Households in the 2009 Resurvey .................................................8 Table 2: Demographic Characteristics of Survey Households, 2008 ...........................11 Table 3: Primary Occupations of Workers ...................................................................11 Table 4: Gross Margins (VND millions) per Hectare and Family Labour Day, 2008 ....13 Table 5: Means of Transportation of Harvested Culms ..............................................19 Table 6: Hedonic Price Regression...............................................................................21 Table 7: Probit Regression for Luong Incomes ..........................................................30 Table 8: Single and Double‐Difference Impacts of Participation in the Luong Value Chain ............................................................................................................................31 Table 9: Poverty Projections for 2015 and 2020 .........................................................34

4
Introduction The bamboo sector as it occurs in various parts of the world comprises 3 subsectors, namely edible bamboo shoots, bamboo handicrafts and industrial bamboo (Marsh and Smith, 2007). Within a contiguous group of provinces in northern Viet Nam and extending across the border into Houaphanh in Lao PDR, an industrial bamboo cluster with high potential for poverty reduction is emerging. Luong (Dendrocalamus barbatus), a premium bamboo species for industrial processing terms, is one of the five major commercial species groups supplying this emerging cluster (Marsh and Ngo 2009). This study’s purpose is to understand the contribution of the luong value chain of this emerging industrial bamboo cluster to poverty reduction.1 Specifically, this report examines the impact of the industrial bamboo subsector on three poor luong producing upland districts in northwest Thanh Hoa. Of the total of 95,000 hectares of luong supplying the emerging northern Viet Nam industrial bamboo cluster, approximately 43,000 hectares (46%) are located in these three districts. Prosperity Initiative (PI) has been working in these districts since late 2005. We analyse the changes that have occurred in these districts between 2006, the year considered by the first Thanh Hoa Impact Assessment Report, and 2008. The results presented are based on a panel survey of around 200 households conducted in spring 2007 and spring 2009 and concurrent interviews with more than 100 traders. Information from a census of bamboo businesses throughout Viet Nam conducted in the first half of 2008 together with PI’s own in‐depth knowledge of the bamboo industry are also utilised. In autumn 2009, it is planned to conduct further qualitative interviews with a subsample of women and men drawn from the panel households, plus selected traders and processors. The report is structured as follows. The next section provides an overview of the study area and the luong value chain in northern Viet Nam. Section 3 describes the survey instruments and other data sources used. The next two sections describe the salient characteristics of the surveyed households, their land and other resources, together with their luong cultivation and harvesting practices. This is followed by an analysis of the structure, conduct and performance of the luong value chain. We then turn to considering the impact of the bamboo market on farmer incomes and poverty, first using descriptive statistics and then using difference‐in‐difference matching. The final section contains projections of the likely poverty reduction impact under different future luong pricing scenarios.
Overview of the Study Area and the Luong Value Chain in Northern Viet Nam
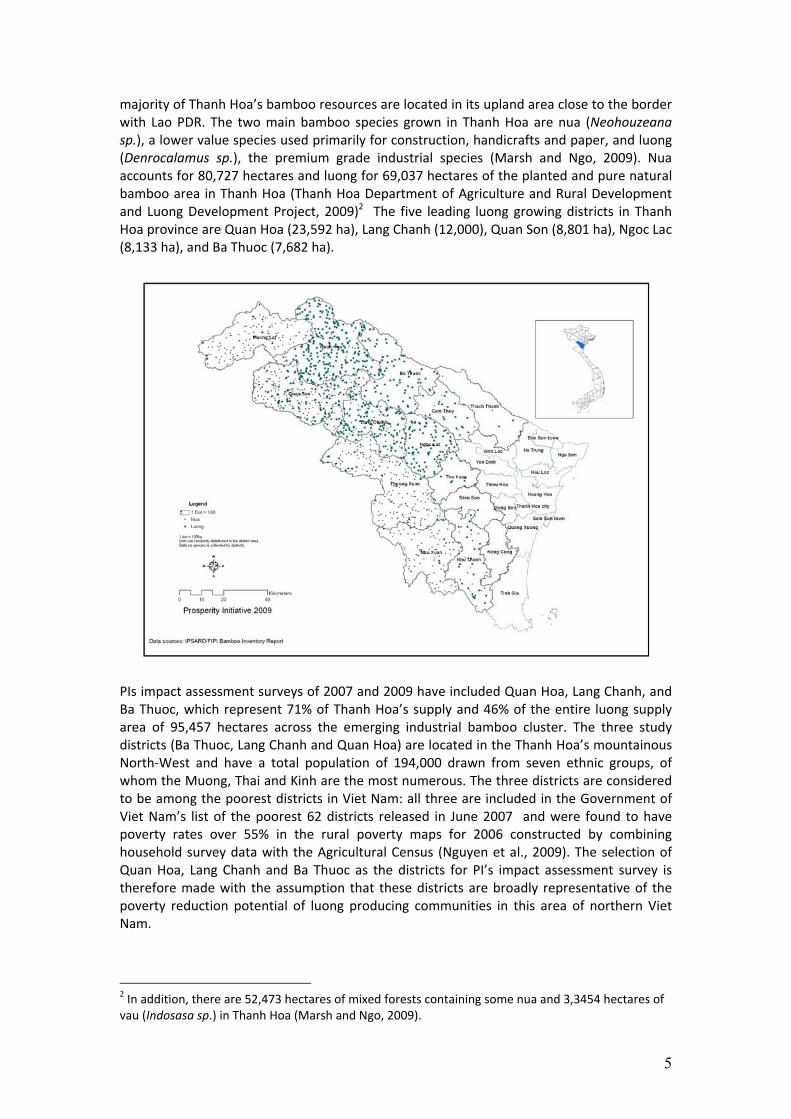
Thanh Hoa is located in Viet Nam’s North Central Coast region with a population estimated at 3,400,239 in April 2009. It is Viet Nam’s third most populous province after Ho Chi Minh and Hanoi (GSO, 2009). It has a total land area of 11,136 km2 and comprises 24 administrative districts, spread between coastal, midland and upland areas (Map 1). The
1 While there are also supply and processing linkages between the bamboo handicraft subsector and the industrial bamboo supply chain and small amounts of bamboo shoot related activity, they are not the focus of this report.
5
majority of Thanh Hoa’s bamboo resources are located in its upland area close to the border with Lao PDR. The two main bamboo species grown in Thanh Hoa are nua (Neohouzeana sp.), a lower value species used primarily for construction, handicrafts and paper, and luong (Denrocalamus sp.), the premium grade industrial species (Marsh and Ngo, 2009). Nua accounts for 80,727 hectares and luong for 69,037 hectares of the planted and pure natural bamboo area in Thanh Hoa (Thanh Hoa Department of Agriculture and Rural Development and Luong Development Project, 2009)2 The five leading luong growing districts in Thanh Hoa province are Quan Hoa (23,592 ha), Lang Chanh (12,000), Quan Son (8,801 ha), Ngoc Lac (8,133 ha), and Ba Thuoc (7,682 ha).
PIs impact assessment surveys of 2007 and 2009 have included Quan Hoa, Lang Chanh, and Ba Thuoc, which represent 71% of Thanh Hoa’s supply and 46% of the entire luong supply area of 95,457 hectares across the emerging industrial bamboo cluster. The three study districts (Ba Thuoc, Lang Chanh and Quan Hoa) are located in the Thanh Hoa’s mountainous North‐West and have a total population of 194,000 drawn from seven ethnic groups, of whom the Muong, Thai and Kinh are the most numerous. The three districts are considered to be among the poorest districts in Viet Nam: all three are included in the Government of Viet Nam’s list of the poorest 62 districts released in June 2007 and were found to have poverty rates over 55% in the rural poverty maps for 2006 constructed by combining household survey data with the Agricultural Census (Nguyen et al., 2009). The selection of Quan Hoa, Lang Chanh and Ba Thuoc as the districts for PI’s impact assessment survey is therefore made with the assumption that these districts are broadly representative of the poverty reduction potential of luong producing communities in this area of northern Viet Nam.
2 In addition, there are 52,473 hectares of mixed forests containing some nua and 3,3454 hectares of vau (Indosasa sp.) in Thanh Hoa (Marsh and Ngo, 2009).

6
These districts contain approximately 46% of the luong area in northern Viet Nam. Along with the neighbouring provinces of Hoa Binh, Nghe An, Son La, Phu Tho, Yen Bai in Viet Nam and Houaphanh in Lao PDR, and industrial bamboo processors in the Red River Delta, they are areas of significant supply for the northern Viet Nam’s emerging industrial bamboo cluster (Marsh and Ngo, 2009). Of the 104 industrial bamboo processing firms operating in 2008 in the emerging cluster, 61 are located in Thanh Hoa, of which 20 have been established since 2006. PI’s work in these districts of Thanh Hoa stems from the 2006 Oxfam Hong Kong and IFC/MPDF funded Bamboo Sector Feasibility Study (the Feasibility Study) 3 which identified and analysed the three subsectors of industrial bamboo, handicrafts and edible shoots and concluded that there was very strong potential for the three Mekong countries of Viet Nam, Lao PDR and Cambodia to increase their share of the large and growing global bamboo market (Oxfam Hong Kong, 2006). Using a value chain approach, the Feasibility Study demonstrated the potential for the Mekong countries to build a competitive bamboo industry and reduce poverty at scale by increasing farmer incomes, raw material utilization and value‐added through the introduction of pre‐processing workshops and other supply chain innovations. Much of this analysis drew on lessons learned from the highly successful Anji industrial bamboo cluster in China (Ruiz‐Perez et al., 2004). Relevant features of this benchmark industry include the structural interdependence of pre‐processors and end processors; high levels of raw material utilisation maximisation; substantial shares of higher value bamboo products (e.g., laminated flooring and panels plus furniture); and maximisation of the value of by products (top sections, sawdust, nodes and other residues) that result from industrial bamboo processing. The Anji case demonstrates the potential for high overall industrial bamboo subsector productivity which underpins competition for raw material and the resulting increases in bamboo producer prices. It is such increases in the bamboo producer prices which are of the most interest from the poverty reduction point of view. Within Viet Nam, pressed bamboo technologies have also been recently identified as offering a simpler option for achieving industrial system productivity and therefore a potential solution to poverty reduction. This is due to the high utilisation rates provided by pressed bamboo’s vertically integrated processing model (Prosperity Initiative, 2009a). Following the Feasibility Study, PI and its partners established the Mekong Bamboo Consortium in 2007 (simplified to Mekong Bamboo in 2008) to support the development of the bamboo industry in the Mekong sub region (comprising Viet Nam, Lao PDR and Cambodia). The work of Mekong Bamboo and its antecedents has included research and information generation, networking and information sharing and supporting the emergence of new businesses, both through technical advice and supporting policy formulation at the provincial and national levels. A Note on Attribution: This study attempts to attribute the effects of luong bamboo as one component of a portfolio of smallholder strategies on poverty reduction. However, the task of attributing specific project interventions to poverty related outcomes is technically challenging and results chains are not yet reliably established for luong or any other aspect of the bamboo industries in the Mekong sub region. Accordingly, attribution of poverty reduction impact specifically to the work of PI is not made here. Instead, the attribution of poverty reduction outcomes should flow to the many 3 Prosperity Initiative (PI) originated from an Oxfam Hong Kong project . PI was registered as a new independent organisation in 2007, effectively expanding the bamboo project established under Oxfam Hong Kong.

7
government and development agencies and private firms who have been involved with luong within Thanh Hoa and its neighbouring provinces, where a new vigor to support the industry has emerged in recent years. Work on the supply side helping producers in the luong supply chain includes contributions from district and provincial governments and research institutes, Research and Technological Exchange Group (GRET), International Development Enterprises (IDE), Center for International Studies and Cooperation (CECI), UK Department for International Development (DFID), Care, United Nations Development Programme (UNDP), World Vision, Netherlands Development Organisation (SNV), Prosperity Initiative (PI), International Finance Corporation (IFC), Hadeva, Luong Development Project (LDP), Oxfam Hong Kong (OHK) and others. Work on the market demand side assisting lead and catalytic firms invest in new operations, and buyers to access suppliers includes work by the provinces, IFC, PI, Vietnam Handicraft Research and Promotion Center (HRPC), Hawa and others. A range of donors also should be credited including SDC, Irish Aid (IA), MAE, Asian Development Bank (ADB), Oxfam Great Britain (OGB), Oxfam America (OA) and others. Whichever attribution analysis is favoured, much credit should be attributed to the government originators and supporters of the luong initiative many decades ago in the northern provinces of Viet Nam. Furthermore, credit for luong plantations in Houaphanh province should also be attributed to the friendship programme between Thanh Hoa and Houaphanh, which initiated the current plantations there. The analysis of impact assessment is therefore carried out with due recognition of the long and committed work by the sample of the many public and development agencies listed above4.
Description of Survey Instruments and Other Data Sources In order to provide a baseline against which the development of the luong value chain could be assessed, a survey of farmers, collectors and traders was carried out in March and April 2007. The survey was designed and analysed by PI and carried out by a small team of nine interviewers drawn from two NGOs (HADEVA and GRET) with experience of working in these areas. Two‐hundred and ten households, 66 collectors and 16 traders were interviewed as part of this baseline survey. In addition, 7 qualitative interviews were carried out in July 2007. The sampling for the survey involved a two‐stage cluster sample in which 29 communes were selected using probability proportionate to size, and then seven households were randomly selected within each commune.5 While the vast majority of households selected cultivated bamboo (mostly luong), around a quarter of them did not, and a few earned the majority of their income outside agriculture. The collector and trader surveys in 2007 involved a survey of all known bamboo collectors and traders in the 29 communes. A resurvey in the same communes was carried out between 14 March and 14 May 2009. The survey aimed to revisit all the households interviewed in the previous survey plus any households that had formed from them, together with the collectors and traders to whom they sold. The survey team consisted of six individuals from the three local NGOs (HADEVA, LDP, and Agrica). Four of the 2009 survey team, including the field supervisor, had also worked on the 2007 survey.
4 The authors apologise to any organisations who have unintentionally been omitted from this list. 5 One commune (Ban Cong in Ba Thuoc district) with a large population was split into two, and a double sample of households taken in this commune, because the number of households within it was more than twice the PPS sampling interval. See Annex 2 of the first Thanh Hoa Bamboo Impact Assessment Report for further details of the sampling design.
8
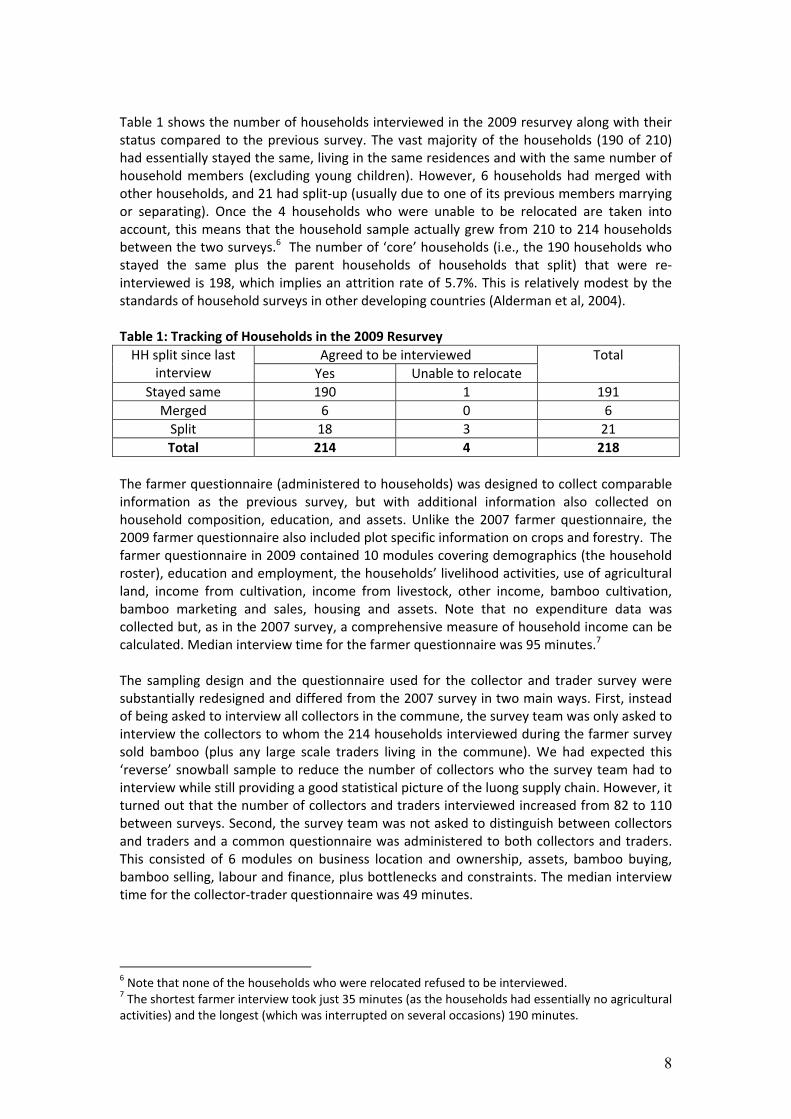
Table 1 shows the number of households interviewed in the 2009 resurvey along with their status compared to the previous survey. The vast majority of the households (190 of 210) had essentially stayed the same, living in the same residences and with the same number of household members (excluding young children). However, 6 households had merged with other households, and 21 had split‐up (usually due to one of its previous members marrying or separating). Once the 4 households who were unable to be relocated are taken into account, this means that the household sample actually grew from 210 to 214 households between the two surveys.6 The number of ‘core’ households (i.e., the 190 households who stayed the same plus the parent households of households that split) that were re‐interviewed is 198, which implies an attrition rate of 5.7%. This is relatively modest by the standards of household surveys in other developing countries (Alderman et al, 2004). Table 1: Tracking of Households in the 2009 Resurvey
Agreed to be interviewed HH split since last interview Yes Unable to relocate
Total
Stayed same 190 1 191 Merged 6 0 6 Split 18 3 21 Total 214 4 218
The farmer questionnaire (administered to households) was designed to collect comparable information as the previous survey, but with additional information also collected on household composition, education, and assets. Unlike the 2007 farmer questionnaire, the 2009 farmer questionnaire also included plot specific information on crops and forestry. The farmer questionnaire in 2009 contained 10 modules covering demographics (the household roster), education and employment, the households’ livelihood activities, use of agricultural land, income from cultivation, income from livestock, other income, bamboo cultivation, bamboo marketing and sales, housing and assets. Note that no expenditure data was collected but, as in the 2007 survey, a comprehensive measure of household income can be calculated. Median interview time for the farmer questionnaire was 95 minutes.7 The sampling design and the questionnaire used for the collector and trader survey were substantially redesigned and differed from the 2007 survey in two main ways. First, instead of being asked to interview all collectors in the commune, the survey team was only asked to interview the collectors to whom the 214 households interviewed during the farmer survey sold bamboo (plus any large scale traders living in the commune). We had expected this ‘reverse’ snowball sample to reduce the number of collectors who the survey team had to interview while still providing a good statistical picture of the luong supply chain. However, it turned out that the number of collectors and traders interviewed increased from 82 to 110 between surveys. Second, the survey team was not asked to distinguish between collectors and traders and a common questionnaire was administered to both collectors and traders. This consisted of 6 modules on business location and ownership, assets, bamboo buying, bamboo selling, labour and finance, plus bottlenecks and constraints. The median interview time for the collector‐trader questionnaire was 49 minutes.
6 Note that none of the households who were relocated refused to be interviewed. 7 The shortest farmer interview took just 35 minutes (as the households had essentially no agricultural activities) and the longest (which was interrupted on several occasions) 190 minutes.

9
In contrast to the 2007 survey, GPS (geographic position system) coordinates of all surveyed households, and collectors/traders were collected during the 2009 survey using handheld Garmin GPS72 units. This enables the location of all the surveyed households, collectors and traders to be plotted. As can be seen from Figure 1 on the next page, most of the households interviewed were located some distance away from the major roads often along secondary roads or rivers. In contrast, Figure 2 shows that collectors and traders tend to be concentrated much more along the major roads, although several dusters of collectors (shown by orange squares) and a few traders (shown by the red triangles) are located away from major roads (though again usually on secondary roads and rivers). This reflects the bulky nature of bamboo culms as a products and their impact on the luong value chain, which is further analysed in Section 5 below. The mean and median distance from farmers’ houses to the nearest collector or trader was 1284 and 880 metres respectively. Figure 1: Location of Households

10
Figure 2: Location of Collector and Trader Households/Establishments
To collect basic information about the communities in which the survey was conducted, a short commune questionnaire was also administered in 2009. This consisted of 5 modules concerning the population and administrative status of the commune, its infrastructure, natural resources and involvement in bamboo economic activities. The final module of the commune questionnaire collected information on the local price and units of sale for 45 agricultural products and agricultural inputs.8 GPS coordinates were recorded for the main facilities (agricultural extension centres, health clinic, and schools) in each of the survey commune. Finally, in addition to the farmer and collector/trader surveys, the latter sections of this report also make use of the bamboo business census, which was a survey of all major bamboo processing enterprises (including handicrafts and shoots) in Viet Nam conducted for PI by HADEVA and HRPC between May and August 2008. The bamboo business database involved interviews with 272 bamboo enterprises, 61 of whom were located in Thanh Hoa. In addition to collecting information on these enterprises’ locations, main products and markets (which are publically available in an on‐line directory at www.mekongbamboo.org), the questionnaire used for the census also collected information of the species and volumes of processed bamboo, specifications of the machinery used, and approximate information on employment and capital of the bamboo businesses interviewed. Although some smaller bamboo businesses were excluded in our first execution of the census, we are confident that
8 These are used for valuing agricultural outputs and inputs that are entirely consumed within the household.

11
all major existing bamboo businesses in Thanh Hoa and nearby provinces are captured in the Bamboo Business Database. PI intends to upgrade and repeat the bamboo business census in 2010. Household Characteristics and Livelihoods In this section, we provide an overview of the basic demographic and occupation characteristics of the surveyed households and communes. We first examine household demographics before moving on to household livelihoods and land holding patterns. The information presented is taken from both the farmer and the commune questionnaires of the Thanh Hoa resurvey. Table 2 shows the demographic characteristics of the 214 households interviewed in the resurvey. Average household size was around 5 people, of whom three people are workers and two are dependents. The average age of household heads, 97% of whom were male, was around 43 years. 73% of household heads had completed primary schooling and 43% had also completed lower secondary school. Furthermore, 95% of primary school age children (97% of boys and 94% of girls) were attending school at the time of the resurvey. Over 90% of households come from the ethnic minorities, divided fairly evenly between the Muong and the Thai, with the remainder coming from the Kinh (mainstream Vietnamese) ethnic group. Table 2: Demographic Characteristics of Survey Households, 2008
Variable Mean Median Minimum Maximum Household size 4.9 5 1 11 Number of workers 3.2 3 0 7 Age of head (years) 42.8 43 20 75 Female head 2.8% Ethnicity of Head Muong 46.4% Thai 44.5% Kinh 9.1% Dependency ratio 0.3 0.333 0 1
Almost 9 out of (89%) of the household workers (aged from 15 to 60 years old) stated that their main occupation was agriculture, with about 1 in every 40 or 50 workers being primarily employed in the processing or sales and services sectors (Table 3). Furthermore, all but 8 households cultivated at least some land, while 96% of them also raised livestock, and 83% had incomes from forestry (including bamboo). Agriculture therefore remains the mainstay of the economy in the study communes. Table 3: Primary Occupations of Workers
% of workers whose main job is: Unskilled agriculture 89.3 Food/leather/textiles/wood processing 2.5 Unskilled sales & services 2.2 Unskilled construction 1.1 Education‐teaching 1.0 Other (inc government and health) 3.9
12
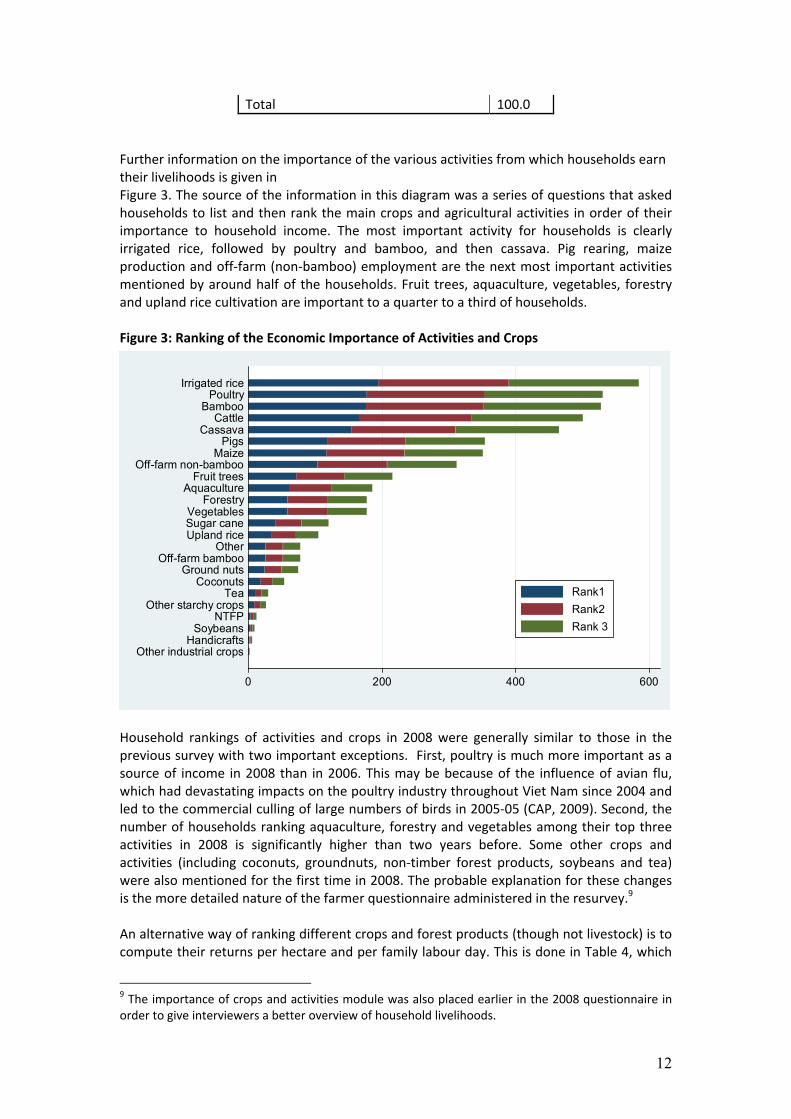
Total 100.0 Further information on the importance of the various activities from which households earn their livelihoods is given in Figure 3. The source of the information in this diagram was a series of questions that asked households to list and then rank the main crops and agricultural activities in order of their importance to household income. The most important activity for households is clearly irrigated rice, followed by poultry and bamboo, and then cassava. Pig rearing, maize production and off‐farm (non‐bamboo) employment are the next most important activities mentioned by around half of the households. Fruit trees, aquaculture, vegetables, forestry and upland rice cultivation are important to a quarter to a third of households. Figure 3: Ranking of the Economic Importance of Activities and Crops
0 200 400 600
Other industrial cropsHandicrafts
SoybeansNTFP
Other starchy cropsTea
CoconutsGround nuts
Off-farm bambooOther
Upland riceSugar caneVegetables
ForestryAquaculture
Fruit treesOff-farm non-bamboo
MaizePigs
CassavaCattle
BambooPoultry
Irrigated rice
Rank1Rank2Rank 3
Household rankings of activities and crops in 2008 were generally similar to those in the previous survey with two important exceptions. First, poultry is much more important as a source of income in 2008 than in 2006. This may be because of the influence of avian flu, which had devastating impacts on the poultry industry throughout Viet Nam since 2004 and led to the commercial culling of large numbers of birds in 2005‐05 (CAP, 2009). Second, the number of households ranking aquaculture, forestry and vegetables among their top three activities in 2008 is significantly higher than two years before. Some other crops and activities (including coconuts, groundnuts, non‐timber forest products, soybeans and tea) were also mentioned for the first time in 2008. The probable explanation for these changes is the more detailed nature of the farmer questionnaire administered in the resurvey.9 An alternative way of ranking different crops and forest products (though not livestock) is to compute their returns per hectare and per family labour day. This is done in Table 4, which
9 The importance of crops and activities module was also placed earlier in the 2008 questionnaire in order to give interviewers a better overview of household livelihoods.

13
shows the gross margins for the most commonly grown crops and forest products in the Thanh Hoa resurvey.10 The crops with the highest returns per hectare of land are sugar cane, glutinous and ordinary irrigated rice (with median gross margins of VND 13 and VND 9.9 million per hectare). However, the product with the highest return per family labour day is bamboo (VND 98,200 per day) followed by glutinous rice and sugar cane (VND 54,700 and VND 47,700 per day respectively). This contrast is due to the relatively low labour requirements that bamboo requires once it is established. Table 4: Gross Margins (VND millions) per Hectare and Family Labour Day, 2008
Per hectare Per family labour day Crop
N Mean Median Mean Median
Ordinary rice (irrigated) 178 11.234 9.856 0.0535 0.0438
Cassava/manioc 153 6.631 5.333 0.027 0.02
Bamboo 140 3.898 2.364 0.1451 0.0982
Maize/corn 117 6.812 4.5 0.0392 0.0279
Glutinous rice (irrigated) 73 13.653 9.875 0.0603 0.0547
Vegetables 46 7.54 3.833 0.0159 0.0139 Upland rice (non‐irrigated) 36 2.072 0.354 0.0097 0.0018
Sugar cane 34 16.132 13 0.0635 0.0477
Peanuts 21 4.088 3.28 0.0262 0.025 Comparing the returns to bamboo, rice and sugarcane directly is, however, questionable as most rice and sugarcane is typically grown on flat, midland plots while bamboo is grown on sloping, upland plots. Among the competing upland crops, cassava and maize have a return per land that is approximately twice as high as bamboo. But bamboo’s gross margin per labour day is 4 to 5 times higher than those for cassava and maize. These rankings of crop returns are similar to those found in the previous survey even though nominal cassava, rice and maize prices were much higher in 2008 than 2006. Given the overwhelming importance of agriculture and forestry to most households’ livelihoods, it is also important to understand households’ access to land in the study communes. As in many parts of northern Viet Nam, following the 1993 Land Law, formerly collectively owned land was allocated to households in the mid to late 1990s (Brandt, 2006). As part of the revolutionary heartland, land reallocation in Thanh Hoa probably happened earlier and in a more egalitarian fashion than in other northern provinces, especially the Northern Uplands. However, this also means that there has been more time for land use rights to be exchanged or transferred and land inequality to develop in Thanh Hoa than in most other provinces. In 2009, the resurvey asked much more detailed plot specific questions on land ownership than the 2007 farmer survey. This shows that the median number of land plots allocated to
10 Gross margins are a simple tool used by agricultural economists to describe the returns to different crops and are calculated using the formula: Gross Margin = Revenue – Variable Production Costs, where revenue includes the value of both sales and own production and costs are the costs associated with the use of all variable factors of production excluding family labour. Gross margins treat fixed assets (such as farm buildings or machinery) as ‘sunk costs’ and therefore avoid the complicated issues that often arise about the pricing and depreciation of these assets.
14
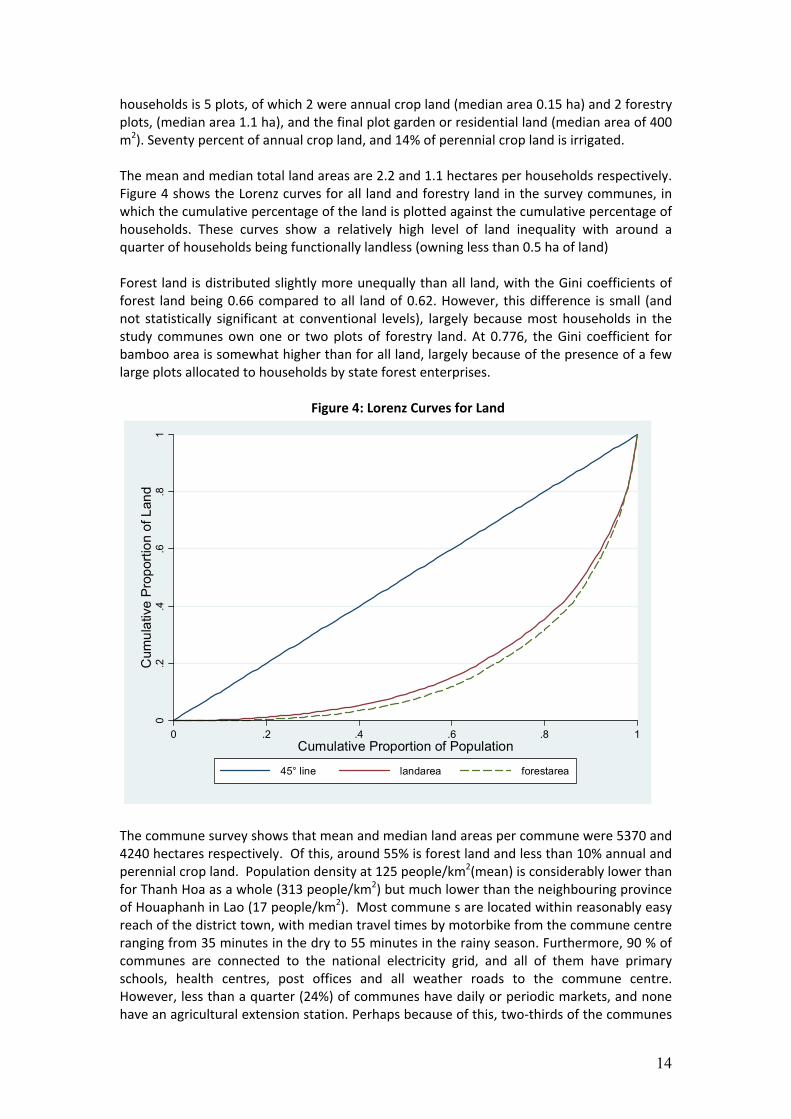
households is 5 plots, of which 2 were annual crop land (median area 0.15 ha) and 2 forestry plots, (median area 1.1 ha), and the final plot garden or residential land (median area of 400 m2). Seventy percent of annual crop land, and 14% of perennial crop land is irrigated. The mean and median total land areas are 2.2 and 1.1 hectares per households respectively. Figure 4 shows the Lorenz curves for all land and forestry land in the survey communes, in which the cumulative percentage of the land is plotted against the cumulative percentage of households. These curves show a relatively high level of land inequality with around a quarter of households being functionally landless (owning less than 0.5 ha of land) Forest land is distributed slightly more unequally than all land, with the Gini coefficients of forest land being 0.66 compared to all land of 0.62. However, this difference is small (and not statistically significant at conventional levels), largely because most households in the study communes own one or two plots of forestry land. At 0.776, the Gini coefficient for bamboo area is somewhat higher than for all land, largely because of the presence of a few large plots allocated to households by state forest enterprises.
Figure 4: Lorenz Curves for Land
0.2
.4.6
.81
Cum
ulat
ive
Pro
porti
on o
f Lan
d
0 .2 .4 .6 .8 1Cumulative Proportion of Population
45° line landarea forestarea
The commune survey shows that mean and median land areas per commune were 5370 and 4240 hectares respectively. Of this, around 55% is forest land and less than 10% annual and perennial crop land. Population density at 125 people/km2(mean) is considerably lower than for Thanh Hoa as a whole (313 people/km2) but much lower than the neighbouring province of Houaphanh in Lao (17 people/km2). Most commune s are located within reasonably easy reach of the district town, with median travel times by motorbike from the commune centre ranging from 35 minutes in the dry to 55 minutes in the rainy season. Furthermore, 90 % of communes are connected to the national electricity grid, and all of them have primary schools, health centres, post offices and all weather roads to the commune centre. However, less than a quarter (24%) of communes have daily or periodic markets, and none have an agricultural extension station. Perhaps because of this, two‐thirds of the communes

15
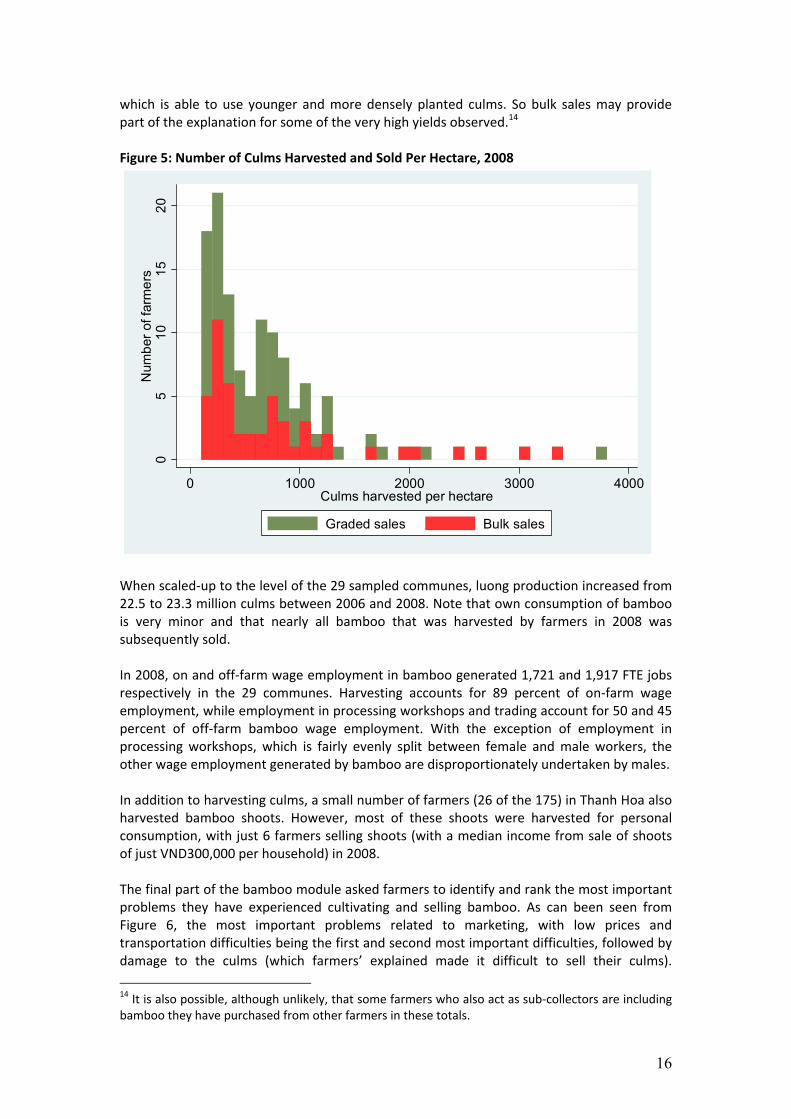
are administratively classified as being in extremely difficult (vung 3) regions, and over four‐fifths (83%) belong to the target communes of the National Targeted Program for Poverty Reduction (Program 143/243). Bamboo Cultivation and Harvesting This section focuses on bamboo cultivation and harvesting in north‐west Thanh Hoa. Of the 214 households interviewed in the 2008 resurvey, 175 stated that they cultivated bamboo, with 165 of these households selling some bamboo culms. The total area of individual bamboo land in 2008 in the 29 communes is estimated to be 23,117 hectares, of which 20,913 hectares is established bamboo (planted before 2006) and 2,204 hectares is newly planted bamboo (planted after 2006). Eighty‐seven percent of households had individual land use rights certificates for the bamboo land they cultivated, with another 2.2% holding collective land use rights certificates.11 Luong is the main species of bamboo cultivated; 98.5% of all bamboo area cultivated is luong. The other bamboo species grown include buong (Dendrocalmamus pachystachys) and gai (Bambusa sp.) with 4 and 1 plot respectively. Buong, Dien, and Mai (all Dendrocalmamus sp.) are often cultivated and sold alongside luong. These species are similar in morphology although luong is straighter and favoured for processing into high value laminated products. That bamboo from only 1 plot of the entire survey was not luong or a luong substitute means that the survey results relate principally to the luong value chain and its effect on poverty reduction. Over four‐fifths (84%) of farmers stated that they harvested bamboo at least once a year, with just over 30% harvesting bamboo on a quarterly or monthly basis. Figure 5 shows the number of luong culms harvested per hectare. In 2008, 165 farmers harvested luong, and their mean and median yields were 506.7 and 285.7 culms per hectare. These yields are well below the estimated sustainable yield of around 600 culms per hectare12, suggesting that planted bamboo resources are significantly under‐utilised on most plots. However, as in the 2006 survey, there are a number of farmers (40 in 2008) who stated they are harvesting significantly more than the sustainable yield. We have investigated all these observations thoroughly and do not find any of these are due to data entry or other errors.13 However, we do notice a significant association between households reporting that they harvested more than 1500 culms per hectare and bulk sales (that is sales of ungraded culms for a single price). Many of such sales are to the construction industry,
11 Note that the percentage of bamboo area under individual land use rights certificates is even higher (93%), followed by land held under collective land use rights certificates, rental contracts or land allocated by state forest enterprises (each accounting for about 1% of total bamboo area). However, almost 4% of bamboo area in the survey communes is still cultivated on an informal basis. 12 Marsh and Ngo (2009, p32) report that this figure of 600culms/ha is based primarily on the recommendation by Pham Hong Giang et al (2005) of harvesting 30% of culms with an average production density of 10 to 12 culms per clump and 200 clumps per hectare. So, 30% of 2000 to 2400 culms is 600 – 720 culms, of which the lower range is quoted . With the current average culm size being between grade B and grade C, a conservative average weight of 22.5kg is assumed. This gives 600 culms by 22.5kg culm = 13.5 t/ha.. 13 In addition, and in contrast to the 2006 survey, we know that the bamboo species involved is definitely luong and that clear cutting of the plot was not involved in the 2008 survey.
16
which is able to use younger and more densely planted culms. So bulk sales may provide part of the explanation for some of the very high yields observed.14 Figure 5: Number of Culms Harvested and Sold Per Hectare, 2008
05
1015
20N
umbe
r of f
arm
ers
0 1000 2000 3000 4000Culms harvested per hectare
Graded sales Bulk sales
When scaled‐up to the level of the 29 sampled communes, luong production increased from 22.5 to 23.3 million culms between 2006 and 2008. Note that own consumption of bamboo is very minor and that nearly all bamboo that was harvested by farmers in 2008 was subsequently sold.
In 2008, on and off‐farm wage employment in bamboo generated 1,721 and 1,917 FTE jobs respectively in the 29 communes. Harvesting accounts for 89 percent of on‐farm wage employment, while employment in processing workshops and trading account for 50 and 45 percent of off‐farm bamboo wage employment. With the exception of employment in processing workshops, which is fairly evenly split between female and male workers, the other wage employment generated by bamboo are disproportionately undertaken by males.
In addition to harvesting culms, a small number of farmers (26 of the 175) in Thanh Hoa also harvested bamboo shoots. However, most of these shoots were harvested for personal consumption, with just 6 farmers selling shoots (with a median income from sale of shoots of just VND300,000 per household) in 2008. The final part of the bamboo module asked farmers to identify and rank the most important problems they have experienced cultivating and selling bamboo. As can been seen from Figure 6, the most important problems related to marketing, with low prices and transportation difficulties being the first and second most important difficulties, followed by damage to the culms (which farmers’ explained made it difficult to sell their culms).
14 It is also possible, although unlikely, that some farmers who also act as sub‐collectors are including bamboo they have purchased from other farmers in these totals.

17
Problems with cultivation techniques were mentioned much less frequently, with the remainder of categories each accounting for just a handful of farmers. Figure 6: Bamboo Farmer’s Problems and Constraints
Structure, Conduct and Performance of the Luong Value Chain This section examines the structure, conduct and performance of the luong value chain in north‐west Thanh Hoa. In our 29 study communes, there were 251 bamboo collectors‐traders and 17 bamboo processing workshops operating at the time of the resurvey.15 Of these, 110 collectors‐traders were interviewed as part of the 2009 survey, while all 17 processing workshops were interviewed as part of the 2008 bamboo business survey. In addition, we have data on another 13 processing workshops operating in other communes in the study districts from the bamboo business survey. We also know that traders from outside Thanh Hoa frequently come to the three districts to purchase bamboo (primarily for the use in construction, handicrafts, and the paper and pulp industry) but it is impossible at present to know how many of these long‐distance traders there are. However, Marsh and Ngo (2009) estimate that 77% of the 1.1 million tons of luong traded in North‐West Vietnam are used for ‘construction and other low value uses’, much of which will be purchased and resold by long‐distance traders. The histograms in Figure 7 and Figure 8 show that there has been a steady growth in the number of collectors‐traders and processors operating in the Thanh Hoa since the early 1990. The number of collectors‐traders started growing four to five years earlier than the number of processors, suggesting that much of the initial growth in the sub‐sector was due
15 In contrast to the 2006 survey, we did not draw a firm distinction between bamboo collectors and traders (based on whether or not their owned their own truck) in the 2008 survey. In practice, the functions and scale of collector‐traders with and without trucks overlap substantially.
0 100 200 300
CAPITAL
WEATHER
LABOR: few workers in household
OTHER
QUALITY: low,dead bamboo
SEEDLINGS
CULTIVATION: techniques,fertilizer
DAMAGE: buffaloes,insects, people
TRANSPORTATION: distance,roads
PRICE: low,unstable,few buyers
rank1 rank2 rank3

18
to demand from outside the province. With the establishment of more processing workshops and pre‐processors in the mid 2000s, local demand for bamboo culms, in particular luong, has grown. Of the 122,385 culms sold by the surveyed farmers in 2008, 82% were purchased by collectors, traders or processors based in the same commune that the bamboo was grown. Nonetheless, only 11 of the 29 study communes had processing workshops located within them. Figure 7: Year When Bamboo Purchasing Started
05
1015
Num
ber o
f Col
lect
ors-
Trad
ers
1990 1995 2000 2005 2010Year Bamboo Purchasing Started
Figure 8: Year of Establishment of Bamboo Processing Firms in Thanh Hoa
05
10N
umbe
r of P
roce
ssor
s
1990 1995 2000 2005 2010Year Bamboo Processing Started
Annex 1 provides a map of the location of the collectors, traders and processors included in our sample. Most are located along national or provincial roads, many of which run adjacent

19
to major rivers. So farmers can use both roads and rivers to transport their bamboo culms to the point of sale. However, as shown in Table 5 below, the overwhelming majority (87%) of farmers reported that their main means of transporting culms to the point of sale was carrying them on the shoulder. A combination of carrying culms to the nearest river and then floating them to the point of sale are also used by about 8% of farmers. For plots that were some distance from sellers, animal drawn carts and boats were used. Table 5: Means of Transportation of Harvested Culms Means of transport Number of Farmers Percent Carried on shoulder 143 87.20 Carry then float 14 8.46 Cart 5 3.05 Boat 1 0.61 Cart then float 1 0.61 Total 164 100.00 A small number of collectors‐traders interviewed owned trucks, boats or other means of transport. Just 16 of the 110 collectors‐traders interviewed owned trucks with 12 more owning carts, and 4 owning trailers. The vast majority of local collectors‐traders are therefore reliant on others (typically processing workshops or long distance traders with trucks) to collect the bamboo they purchase. Most bamboo culms that are bought and sold in north‐west Thanh Hoa are traded at the roadside. Just over three‐quarters (77%) of the culms sold by the surveyed farmers in 2008 were sold at the roadside, while 81% of collectors and traders surveyed reported purchasing culms at the roadside. Buyers’ premises were the next most common location of exchange: with 17% of the farmers delivering culms to buyers and 14% of collectors‐traders reporting purchases at their premises. Another 5% of culms were sold (cut) in the field, with the remainder of sales occur at farmer’s homes. Higher grade culms (Phao and Grades 1 to 2) were found more likely to be delivered to the buyers’ premises than the lower Grades 4 and 5, while the few bulk sales (1%) that occurred were in the field. Very few sales of non‐luong species were reported. Despite the dominance of roadside sales, the vast majority (72.5%) of collectors and traders, make payments in advance for the bamboo they buy, with the remainder (28.5%) of purchases being cash on delivery. This suggests that the majority of culms are initially sold to collectors‐traders located within the same communes as the bamboo is grown. Although some spot purchases of culms from farmers are made along the roadside, the numerous long‐distance traders who come to Thanh Hoa tend to purchases culms from local collectors‐traders with whom they have established relations. This is confirmed by the fact that 85% of on‐sales to traders occurred at the sellers’ premise, with 62% of these sales being made on a cash or delivery basis. In contrast, most on sales to processors occur at their premises with 78% of these being on cash terms. Collector‐trader margins (the difference between the price at which they buy and sell culms) are typically just VND 500 to 1000 per culm, although in a few cases margins of up to VND 4,000 per culms were recorded. The narrowness of margins, combined with payments in advance to farmers, indicates a general tightness in the supply of bamboo culms, which is confirmed by interviews with processors, who occasionally have to stop processing for a few weeks due to a lack of bamboo. This suggests that farmers are in a relatively strong position when negotiating the prices they receive for luong.
20
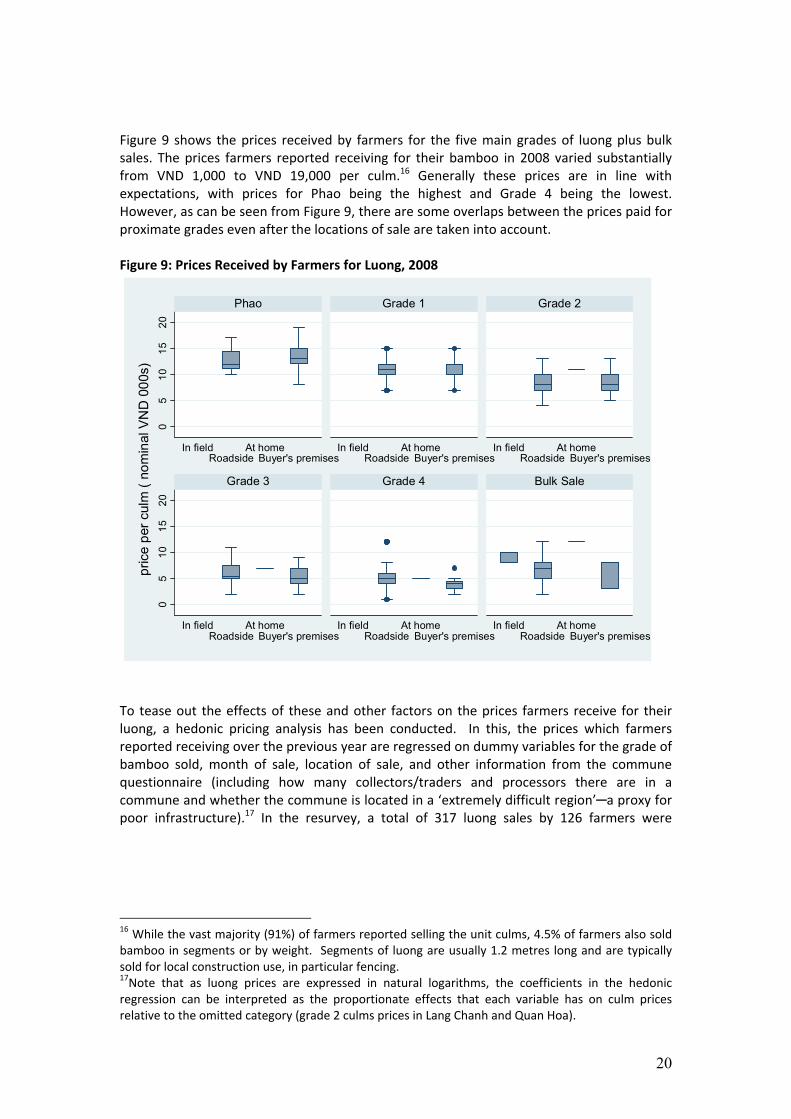
Figure 9 shows the prices received by farmers for the five main grades of luong plus bulk sales. The prices farmers reported receiving for their bamboo in 2008 varied substantially from VND 1,000 to VND 19,000 per culm.16 Generally these prices are in line with expectations, with prices for Phao being the highest and Grade 4 being the lowest. However, as can be seen from Figure 9, there are some overlaps between the prices paid for proximate grades even after the locations of sale are taken into account. Figure 9: Prices Received by Farmers for Luong, 2008
05
1015
200
510
1520
In fieldRoadside
At homeBuyer's premises
In fieldRoadside
At homeBuyer's premises
In fieldRoadside
At homeBuyer's premises
In fieldRoadside
At homeBuyer's premises
In fieldRoadside
At homeBuyer's premises
In fieldRoadside
At homeBuyer's premises
Phao Grade 1 Grade 2
Grade 3 Grade 4 Bulk Sale
pric
e pe
r cul
m (
nom
inal
VN
D 0
00s)
To tease out the effects of these and other factors on the prices farmers receive for their luong, a hedonic pricing analysis has been conducted. In this, the prices which farmers reported receiving over the previous year are regressed on dummy variables for the grade of bamboo sold, month of sale, location of sale, and other information from the commune questionnaire (including how many collectors/traders and processors there are in a commune and whether the commune is located in a ‘extremely difficult region’─a proxy for poor infrastructure).17 In the resurvey, a total of 317 luong sales by 126 farmers were
16 While the vast majority (91%) of farmers reported selling the unit culms, 4.5% of farmers also sold bamboo in segments or by weight. Segments of luong are usually 1.2 metres long and are typically sold for local construction use, in particular fencing. 17Note that as luong prices are expressed in natural logarithms, the coefficients in the hedonic regression can be interpreted as the proportionate effects that each variable has on culm prices relative to the omitted category (grade 2 culms prices in Lang Chanh and Quan Hoa).

21
reported between July 2008 and May 2009 in 317 sales, with 40 of these farmers making just one sale over this period.18 The preferred specification of the hedonic price regression is shown in Table 6 below. This shows that (once other relevant factors are controlled for) Phao and Grade 1 luong culm prices are, on average, 46% and 28% higher than those for Grade 2 culms. Grade 3 and 4 culm prices are 40 % and 67% lower than those for Grade 2 while bulk sales are 25% lower. The number of collectors, traders or processors operating in a commune does not have a strong association with the prices farmers receive. However, if there are no collectors (or traders) in a commune, culm prices are on average 14% lower, while if there is a processor in the commune, culm prices are 22% higher. Luong prices are also 25% higher in Ba Thuoc district (than either Quan Hoa or Lang Chanh), but 21% lower if sold during the third quarter of the 2008. Table 6: Hedonic Price Regression
Linear regression on logarithm of culm prices Number of jobs 317 F( 10, 306) 47.19 Prob > F 0 R-squared 0.5797 Root MSE 0.3251
Variable Coef. Robust Std. Err. t P>|t|
Phao 0.460 0.049 9.370 0.000 Grade1 0.281 0.042 6.760 0.000 Grade3 -0.402 0.055 -7.250 0.000 Grade4 -0.671 0.078 -8.570 0.000 Bulk sale -0.250 0.073 -3.420 0.001 No collectors -0.141 0.060 -2.350 0.019 Processor 0.216 0.045 4.800 0.000 Region III -0.065 0.040 -1.610 0.109 Ba Thuoc 0.251 0.057 4.380 0.000 Quarter 3 -0.212 0.054 -3.950 0.000 Constant 1.996 0.051 39.170 0.000
The decline in luong purchases prices in quarter 3 detected in the hedonic price regression is also confirmed by the time series data on leading processors’ culm purchases prices that PI’s partners GRET and LDP have been collecting since June 2006. Figure 10 shows average monthly culm purchase prices paid by leading processors in Quan Hoa district since June 2006.
18 Note also that no culm sales were reported for June 2008, and very few sales in either April or May of that year. This is partly due to the onset of the bamboo shooting season (during which few culms are harvested) and partly due to the retrospective nature of the resurvey’s pricing questions.

22
Figure 10: Processor’s Culm Purchases Prices in North‐West Thanh Hoa
0
5
10
15
20
25
Jun-0
6
Aug-06
Oct-06
Dec-06
Feb-07
Apr-07
Jun-0
7
Aug-07
Oct-07
Dec-07
Feb-08
Apr-08
Jun-0
8
Aug-08
Oct-08
Dec-08
Feb-09
Apr-09
Jun-0
9
Aug-09
Phao
A
B
C
Source: GRET‐LDP price monitoring reports
Although culms prices have been quite variable over this three year period, and fell sharply in the third and fourth quarters of 2008, they have started rising again more recently.19 As can be seen from the 12 month moving averages that also plotted on this graph, the general trend in nominal culm prices is upward, with Phao prices rising by 33% and Grade A prices rising by 29% over the last two years. However, these are nominal luong prices which do not adjust for the level of inflation. As the rate of inflation calculated from the national consumer price index during these years was 32.5%, this means that culm prices have remained more or less constant in real terms over the last two years. It is also important to note that the variability of culm prices over this period is comparable, and in some cases, less than that of other major agricultural commodities produced in north‐west Thanh Hoa. For example, in the first two quarters of 2007, ordinary rice and maize prices rose by 57 % and 52% in Thanh Hoa as a whole. To conclude this section, we examine the problems and constraints which collectors and traders of luong experience. The 2009 open‐ended survey included questions to traders and collectors about the problems and constraints they faced in buying and selling bamboo. These open ended questions were post‐coded and their responses tabulated. Figure 11 shows that difficulties with capital (often associated with advances to farmers) and transportation difficulties are the most important problems encountered by collectors and traders. Comparing Figure 11 with Figure 6 at the end of the previous section, it is interesting to note that while collectors‐traders and farmers’ rankings differ, both groups mention transportation difficulties and low or unstable prices among their top five problems and constraints. Along with the other analysis in this section, this suggests that despite its recent development, the luong value chain in north‐west Thanh Hoa is still in need of expansion and deepening.
19 The reasons for the sharp decline in luong purchase prices in the second half of 2008 include seasonal factors, the knock‐on effects of the global economic recession, and reduced Taiwanese demand for votive paper (which is made from bamboo).

23
Figure 11: Bamboo Collectors and Traders Problems and Constraints
0 50 100 150 200 250
LABOR: few workers in household, age of workers
OTHER: communication
STORAGE: no place, difficult to access
WEATHER: Rainny season, Storms
MARKET: small, unstable output
PRICE: low, unstable
BAMBOO VOLUME: falling, seasonal, unstable
COMPETITION: too many traders, processors
TRANSPORTATION: distance,roads,means
CAPITAL: Low, advances to farmers, loans
Rank1 Rank2
Rank3
Changes in Income and Poverty, 2006‐2008 This section of the report analyses the changes in incomes and poverty that occurred in our survey communes in between 2006 and 2008. Using a comparable measure of real per capita household incomes for both years, we first analyse the changes in the sources of incomes that have occurred for the entire population. Using newly available international poverty lines, we then analyse changes in incomes and poverty levels both for the entire population for people with and without luong.20 Finally, we analyse how the various sources of income that households have contributed to the poverty gap and the income shortfall of the poor. The concept and terms used to describe income from bamboo into the household is important to clarify for the following section. The previous section established that in essence all bamboo related incomes are luong incomes by virtue of the point that luong accounts for virtually all bamboo sales, and therefore all waged employment both off farm and on farm are most likely associated with luong. For this section, the term luong incomes will be used to cover all bamboo related incomes. Further to this point, households with some form of luong income are termed households with luong incomes while the remainder are called households without luong incomes.
20 Note that, as in the previous Impact Assessment Report, households with bamboo incomes includes both households that earn incomes from cultivating and selling bamboo and those that earn incomes from other activities (such as trading bamboo or working in processing workshops or harvesting bamboo on households’ land). Households with bamboo land that is not harvested and no other incomes from bamboo are included in the without bamboo income category.

24
Before proceeding with this analysis, a brief explanation should be given about how both real per capita incomes and the poverty lines used in this analysis were calculated. The 2008 Thanh Hoa Resurvey instruments allows for more comprehensive measurement of farmer incomes (in particular, crop and other incomes) than the original 2006 survey. So, to compare how farmers’ incomes and poverty levels changed between these two years, we have computed a comparable income aggregate which includes the same items in both years. For each year, we have calculated four sources of household income (for crops, livestock, bamboo and other incomes), which are then summed, deflated, and divided by household size to give our welfare measure: real per capita incomes. The poverty line used in our analysis are the PPP $1.25 and $2.00 per person per day international poverty lines calculated by the World Bank using household survey data from 116 countries together with the results of the 2005 International Comparisons Project (Ravallion et al., 2008). It should be noted that these poverty lines are expressed in 2005 Purchasing Power Parity (PPP) dollars and are equal to VND 3.94 million VND 6.31 million per person per year in real 2008 terms.21 We have chosen to use these international poverty lines rather than the national poverty lines used in the previous Impact Assessment Report for two reasons. First, the international poverty lines have recently been updated by the World Bank and provide the most commonly accepted way of making international poverty comparisons (along with monitoring of the Millennium Development Goals Goal 1). Those with incomes (or expenditures of less than PPP $1.25/day are usually regarded as extremely poor, while those living between PPP $1.25 and 2.00/day as moderately poor (Chen and Ravallion, 2008). Second, the national poverty line of VND 2.4 million (equivalent to VND 200,000 per person per month) in rural areas used in PI’s previous Impact Assessment Report is now seriously out of date and is in the process of being updated by the Ministry of Labour Invalids and Social Affairs.22 Ultimately, however, it must be recognised that the choice of poverty line is an art rather than a science and that poverty rates will tend to be unstable whenever large numbers of peoples’ incomes (or expenditures) are close to it—as is the case in Thanh Hoa. Figure 12 shows how the four components of per capita incomes grew between 2006 and 2008. Each component of income has experienced growth, with mean crop incomes growing by 51.9%, livestock incomes by 28.6% ;luong incomes by 11.5% and other incomes by 16.0%. However, in median terms (which exclude the effect of outliers and probably give a better representation of the position of the typical farmer), crop and livestock incomes have grown by 33.3% and 33.7%, other incomes by 28.7% while luong incomes have fallen by 26.1%. Overall per capita incomes have grown by 25.4% in mean terms and by 8.1% in median terms.
21 We are grateful to Shaohua Chen of the World Bank’s Development Economic Research Group for providing us with the 2008 VND equivalent of the $1.25/day poverty line. 22 The same is also true of the expenditure‐based poverty line used for analysing poverty using the Viet Nam Household Living Standard Survey, which are based on inflating a poverty line first calculated in 1993 by the Consumer Price Index with a further adjustment for regional price differences.

25
Figure 12: Sources of Income in 2006 and 2008
02
46
2006 2008
Crops LivestockLuong Other
Mea
n P
er C
apita
Inco
me,
200
8 V
ND
mill
ions
Figure 13: Cumulative Distributions of Per Capita Incomes, 2006 and 2008
$1.25/daypoverty line
$2/day poverty line
0.2
.4.6
.81
Pro
porti
on o
f Pop
ulat
ion
0 5 10 15 20Per Capita Income (real 2008 VND millions)
2006 2008
is a cumulative distribution plot of (total) comparable per capita incomes in 2006 and 2008. This
26
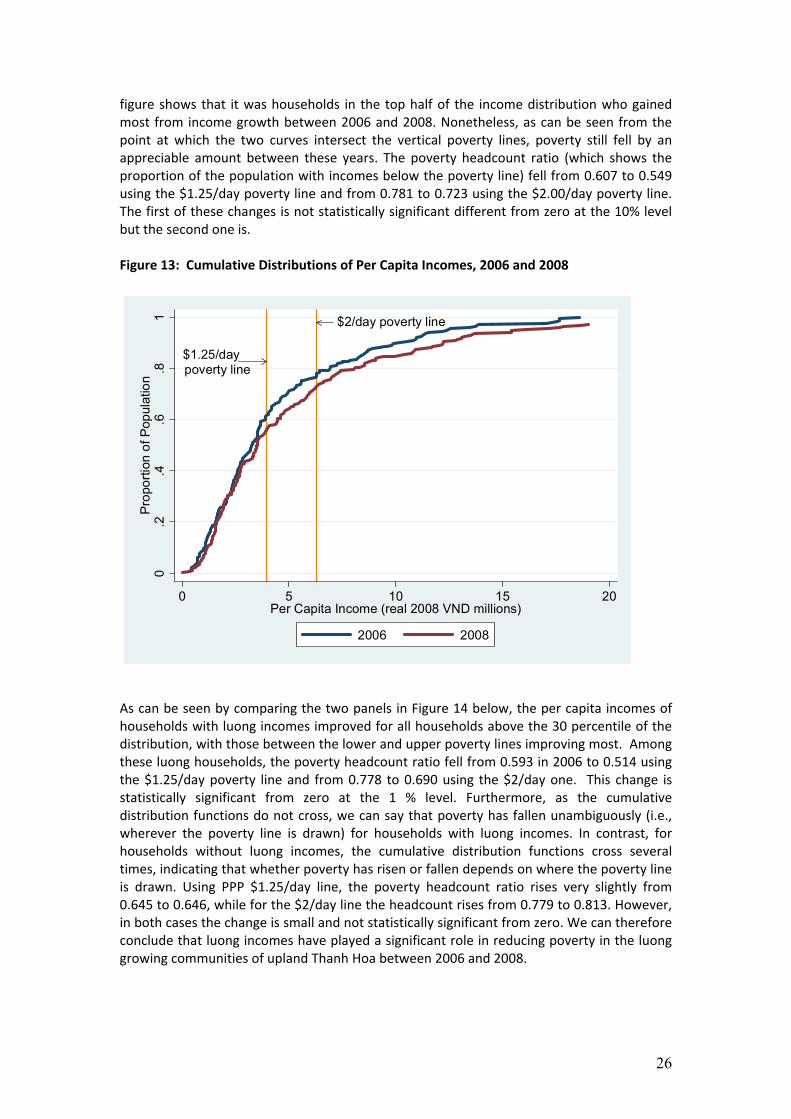
figure shows that it was households in the top half of the income distribution who gained most from income growth between 2006 and 2008. Nonetheless, as can be seen from the point at which the two curves intersect the vertical poverty lines, poverty still fell by an appreciable amount between these years. The poverty headcount ratio (which shows the proportion of the population with incomes below the poverty line) fell from 0.607 to 0.549 using the $1.25/day poverty line and from 0.781 to 0.723 using the $2.00/day poverty line. The first of these changes is not statistically significant different from zero at the 10% level but the second one is. Figure 13: Cumulative Distributions of Per Capita Incomes, 2006 and 2008
$1.25/daypoverty line
$2/day poverty line
0.2
.4.6
.81
Pro
porti
on o
f Pop
ulat
ion
0 5 10 15 20Per Capita Income (real 2008 VND millions)
2006 2008
As can be seen by comparing the two panels in Figure 14 below, the per capita incomes of households with luong incomes improved for all households above the 30 percentile of the distribution, with those between the lower and upper poverty lines improving most. Among these luong households, the poverty headcount ratio fell from 0.593 in 2006 to 0.514 using the $1.25/day poverty line and from 0.778 to 0.690 using the $2/day one. This change is statistically significant from zero at the 1 % level. Furthermore, as the cumulative distribution functions do not cross, we can say that poverty has fallen unambiguously (i.e., wherever the poverty line is drawn) for households with luong incomes. In contrast, for households without luong incomes, the cumulative distribution functions cross several times, indicating that whether poverty has risen or fallen depends on where the poverty line is drawn. Using PPP $1.25/day line, the poverty headcount ratio rises very slightly from 0.645 to 0.646, while for the $2/day line the headcount rises from 0.779 to 0.813. However, in both cases the change is small and not statistically significant from zero. We can therefore conclude that luong incomes have played a significant role in reducing poverty in the luong growing communities of upland Thanh Hoa between 2006 and 2008.

27
Figure 14: Cumulative Distribution Functions for Per Capita Incomes for Households with and without Luong Incomes, 2006 and 2008
$1.25/daypoverty line
$2/day poverty line0
.2.4
.6.8
1P
ropo
rtion
of P
opul
atio
n
0 5 10 15 20Per Capita Income (real 2008 VND millions)
2006 2008
Households with Luong Incomes
$1.25/daypoverty line
$2/day poverty line
0.2
.4.6
.81
Pro
porti
on o
f Pop
ulat
ion
0 5 10 15 20Per Capita Income (real 2008 VND millions)
2006 2008
Households without Luong Incomes
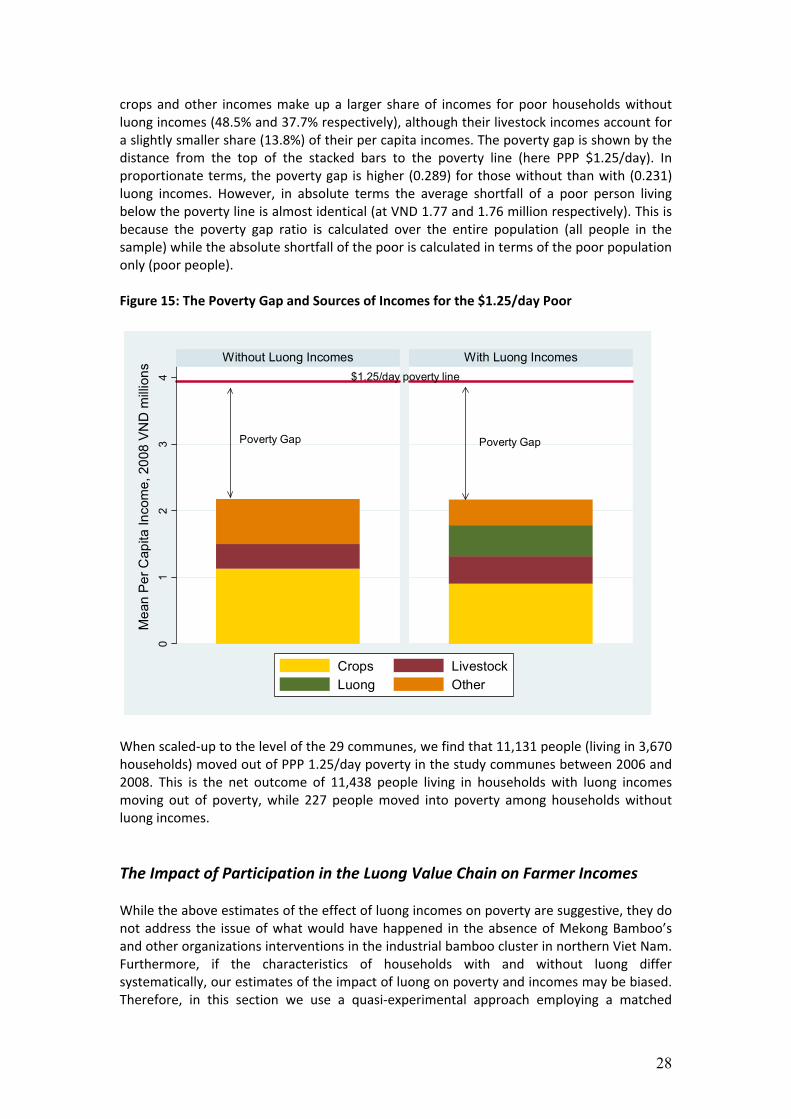
To examine this in more detail, we analyse the sources of the per capita incomes of the poor in 2008. We also examine an alternative measure of poverty, the poverty gap─which shows the average income shortfall of the poor from the poverty line. Figure 15 shows that luong incomes make up almost one‐fifth (19.9%) of total incomes for poor luong households, with crops making‐up 38.3%, other incomes 25% and livestock 16.3%. As would be expected,
28
crops and other incomes make up a larger share of incomes for poor households without luong incomes (48.5% and 37.7% respectively), although their livestock incomes account for a slightly smaller share (13.8%) of their per capita incomes. The poverty gap is shown by the distance from the top of the stacked bars to the poverty line (here PPP $1.25/day). In proportionate terms, the poverty gap is higher (0.289) for those without than with (0.231) luong incomes. However, in absolute terms the average shortfall of a poor person living below the poverty line is almost identical (at VND 1.77 and 1.76 million respectively). This is because the poverty gap ratio is calculated over the entire population (all people in the sample) while the absolute shortfall of the poor is calculated in terms of the poor population only (poor people). Figure 15: The Poverty Gap and Sources of Incomes for the $1.25/day Poor
Poverty Gap
$1.25/day poverty line
Poverty Gap
01
23
4
Without Luong Incomes With Luong Incomes
Crops LivestockLuong Other
Mea
n P
er C
apita
Inco
me,
200
8 V
ND
mill
ions
When scaled‐up to the level of the 29 communes, we find that 11,131 people (living in 3,670 households) moved out of PPP 1.25/day poverty in the study communes between 2006 and 2008. This is the net outcome of 11,438 people living in households with luong incomes moving out of poverty, while 227 people moved into poverty among households without luong incomes. The Impact of Participation in the Luong Value Chain on Farmer Incomes While the above estimates of the effect of luong incomes on poverty are suggestive, they do not address the issue of what would have happened in the absence of Mekong Bamboo’s and other organizations interventions in the industrial bamboo cluster in northern Viet Nam. Furthermore, if the characteristics of households with and without luong differ systematically, our estimates of the impact of luong on poverty and incomes may be biased. Therefore, in this section we use a quasi‐experimental approach employing a matched

29
double‐difference model to estimate the impact of luong on farmer incomes.23 The results confirm that both total and crop incomes are higher among households with luong incomes than those households without them. The essence of the matched double‐difference model is that changes in pre‐ and post‐project outcomes are compared for households or individuals who choose whether or not to participate in an activity (in this case harvesting and selling luong or working in the bamboo sub‐sector). This type of estimator is similar to a standard difference‐in‐difference regression estimator, but reweights households using the probability of their participation in the activity. Matching households with similar probabilities of participation then ensures that households with similar characteristics are compared. The probability of participation is itself estimating using a probit model, with a binary dependent variable for whether or not households have luong incomes in 2008. Covariates in the probit model include household and community characteristics in 2006 and are described below. Ideally, a longer period would be used for this analysis, but 2006 is the earliest date for which we have reliable income and poverty data. Table 7 shows a probit model for whether households have luong incomes. Recall that luong incomes include all incomes that households earn from engagement in the luong value chain, which includes bamboo‐related work for other households and work in bamboo processing workshops as well as sales of luong from households’ own land. The covariates in the model include the household head’s age, ethnicity, sex, and education level, household size, total land cultivated and the ratio of forest land to total land owned by the household. Dummy variables indicating whether the household produces rice and has non‐farm sources of income (such as wages or profits from non‐farm business) are also included. Commune level variables include the number of bamboo collectors in the commune and dummy variables for two of the three districts. All the covariates variables are for 2006, except the bamboo collectors variable and the forest‐to‐total land ratio for which reliable data is only available for 2008.24 The results show that higher ratios of forest to total land areas, higher initial land area and the presence of more bamboo collectors in the commune all increase the probability of a household having luong incomes. Households with Muong ethnicity are more likely to grow luong than the Kinh or Thai groups. In addition, households with non‐farm sources of income (which account for 64 percent of the households in the sample) and households that produce rice (which account for 85 percent of all households in the sample), have a higher probability of selling bamboo than households who do not. Finally, households in Ba Thuoc and Lanh Chanh District are less likely to have luong incomes than those in Quan Hoa (the omitted category).
23 This approach is widely used in the evaluation literature in situations where randomised control trials are infeasible. See Baker (2000) and Heckman et al. (1998). 24 In interpreting this regression, it is important to realise that whether or not a household has land allocated to it does not determine whether not it has luong incomes for several reasons. First, not all forest land is planted with luong. Second, not all households with luong land choose to harvest their luong (because of labour of other constraints). Third, a few (5) households also harvest luong from communal forests. Finally, some households have incomes from working in bamboo workshops or trading bamboo.

30
Table 7: Probit Regression for Luong Incomes
Number of observations 184 LR chi2(13) 100.26 Prob > chi2 0 Log likelihood -56.51 Pseudo R2 0.47
Variable Coef. Std. Err. Z P>z Head's age 0.02 0.02 0.97 0.33 Head's sex -0.94 0.9 -1.04 0.3 Household size 0.07 0.1 0.64 0.52 Head's education level 0.13 0.2 0.66 0.51 Thai -0.1 0.59 -0.16 0.87 Muong 1.2 0.58 2.06** 0.04 Allocated land area 0.1 0.06 1.86* 0.06 Forest area/Total land area 1.23 0.47 2.62** 0.01 Having non-farm income 0.84 0.31 2.69** 0.01 Producing rice 0.83 0.48 1.72* 0.09 Number of bamboo collectors in commune 0.11 0.03 3.68** 0 Ba Thuoc District -1.98 0.52 -3.78** 0 Lang Chanh District -1.35 0.57 -2.35** 0.02 Constant -2.45 1.16 -2.12** 0.03
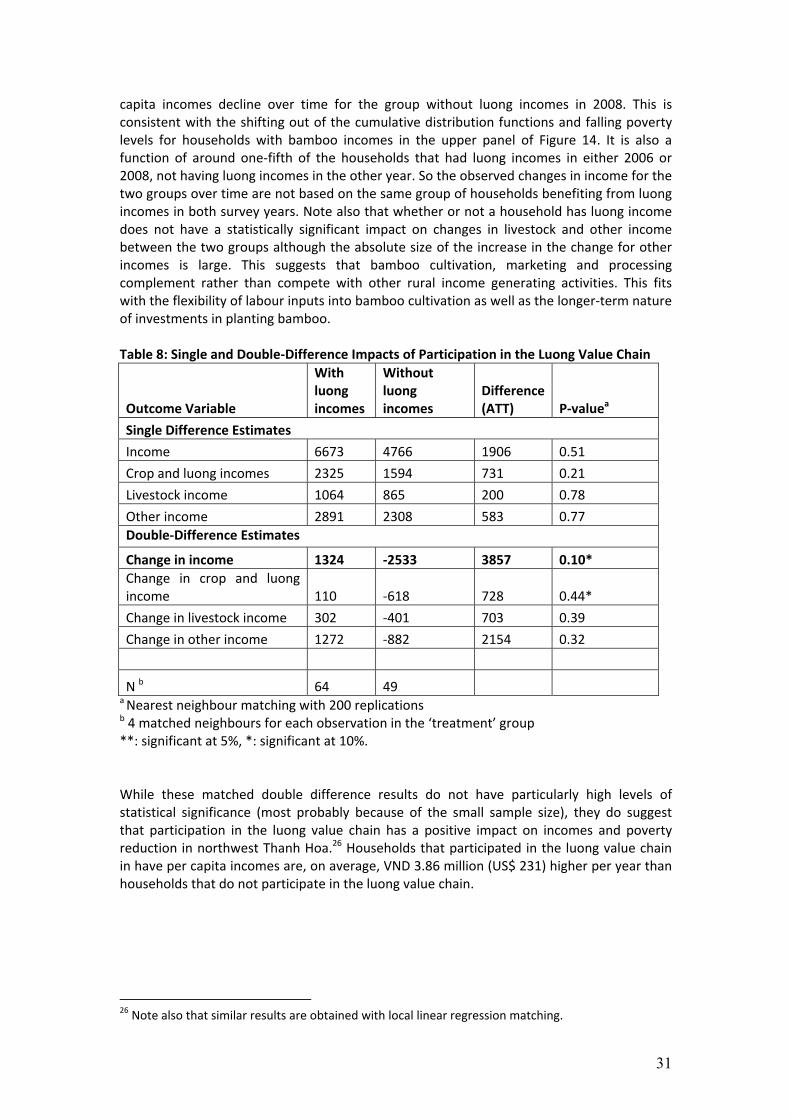
**: significant at 5%, *: significant at 10%. The estimated probabilities (propensity scores) resulting from the probit model in Table 7 were then matched to identify two groups of comparable households which do and do not have luong incomes. The first group with luong incomes contains 64 households, while the second group without luong incomes includes 49 households. A total of 71 households are therefore deemed to be non‐comparable by the matching procedure used (nearest neighbour matching with 200 replications). 25 Table 8 show the single and double‐differenced impacts from a matched sample of 64 and 49 households with and without bamboo incomes. The single difference estimates in the first half of the table show four measures of incomes for the two groups in 2008, while double‐difference estimates in the second half of the table show changes in these incomes between 2006 and 2008 for the two groups. Four different incomes (total income, crop and luong incomes, livestock incomes and other incomes) are compared, all on a per capita basis. The ATT (Average Treatment on the Treated) in the third column show the difference in real per capita incomes between the two groups and provides a key measure of impact. While all the single difference impacts in the first half of the table are positive, none of them are statistically different from zero at conventional levels. In contrast, the double difference estimate of the change in total income per capita is statistically different from zero at the 10 % level. The magnitude of the overall change in total income per capita is VND 3.86 million, which is equivalent to approximately $231 (in 2008 terms). Notice, however, the change in per capita incomes for the group with luong incomes over time is just VND 110,000 while per 25 When matching methods are used, the participating group, though analogy with randomised control trials, is often know as the ‘treatment’ group. However, it is important to realise that households self‐select into the treatment group in this case, and that no treatment is administered at the household level.
31
capita incomes decline over time for the group without luong incomes in 2008. This is consistent with the shifting out of the cumulative distribution functions and falling poverty levels for households with bamboo incomes in the upper panel of Figure 14. It is also a function of around one‐fifth of the households that had luong incomes in either 2006 or 2008, not having luong incomes in the other year. So the observed changes in income for the two groups over time are not based on the same group of households benefiting from luong incomes in both survey years. Note also that whether or not a household has luong income does not have a statistically significant impact on changes in livestock and other income between the two groups although the absolute size of the increase in the change for other incomes is large. This suggests that bamboo cultivation, marketing and processing complement rather than compete with other rural income generating activities. This fits with the flexibility of labour inputs into bamboo cultivation as well as the longer‐term nature of investments in planting bamboo. Table 8: Single and Double‐Difference Impacts of Participation in the Luong Value Chain
Outcome Variable
With luong incomes
Without luong incomes
Difference (ATT) P‐valuea
Single Difference Estimates
Income 6673 4766 1906 0.51
Crop and luong incomes 2325 1594 731 0.21
Livestock income 1064 865 200 0.78
Other income 2891 2308 583 0.77 Double‐Difference Estimates
Change in income 1324 ‐2533 3857 0.10* Change in crop and luong income 110 ‐618 728 0.44*
Change in livestock income 302 ‐401 703 0.39
Change in other income 1272 ‐882 2154 0.32
N b 64 49 a Nearest neighbour matching with 200 replications b 4 matched neighbours for each observation in the ‘treatment’ group **: significant at 5%, *: significant at 10%. While these matched double difference results do not have particularly high levels of statistical significance (most probably because of the small sample size), they do suggest that participation in the luong value chain has a positive impact on incomes and poverty reduction in northwest Thanh Hoa.26 Households that participated in the luong value chain in have per capita incomes are, on average, VND 3.86 million (US$ 231) higher per year than households that do not participate in the luong value chain.
26 Note also that similar results are obtained with local linear regression matching.

32
The Poverty Reduction Potential of Industrial Bamboo To conclude this report, we revise and clarify our previous estimates of the potential poverty reducing impact of industrial bamboo (PI, 2009b) using the 2009 Thanh Hoa resurvey data. Note that these projections include the potential contribution from luong only, which as explained above, is only one of the five commercial species groups relevant to the industrial bamboo sector.27 These poverty reduction projections are based on two key assumptions:
(i) the real prices received for luong in Thanh Hoa increase to half or two‐thirds of the 2008 Anji moso bamboo farmgate price of $100/ton; and;
(ii) all farmers attain a sustainable yield of 600 culms (equivalent to 13 tons) per hectare.28
The poverty lines used in the analysis are the same international poverty lines of PPP $1.25 and $2/day used in the previous analysis of poverty trends, although the income aggregate used is slightly different.29 The projections hold non‐luong sources of incomes (crops, livestock and other incomes) constant, while increasing bamboo incomes in 2015 and 2020 in line with the anticipated price and yield increases. This procedure allows the incremental poverty impact of industrial bamboo on poverty to be identified. Figure 16 demonstrates how rising luong prices and sustainable harvesting move the cumulative distribution of per capita incomes downwards and to the right. Under the assumptions outlined above, per capita incomes increase the most in the region surrounding the $2/day poverty line, although even at $ 1.25/day the increase in incomes is substantial. However, the fact that the curves do not cross shows that poverty will decrease whatever the poverty line and whichever poverty measure is chosen
27 The potential contribution from the other species is discussed in Marsh and Ngo (2009). 28 Although most farmers in our sample were harvesting much less than this in 2008, a few were harvesting more (recall Figure 5), so a few farmers ended up losing income by moving to sustainable production. The effect is, however, relatively minor with the losers comprising around 5% of the winners. 29 To facilitate comparisons between the 2006 and 2008 farmer surveys, the analysis above used a comparable measures of income, which (because of the design of the 2006 farmer surveys) excludes income from agricultural services, aquaculture, sales of wood, and non‐labour luong cultivation costs. These additional components of income costs are included in the ‘best’ measures of household income used for the poverty projections presented in this section.
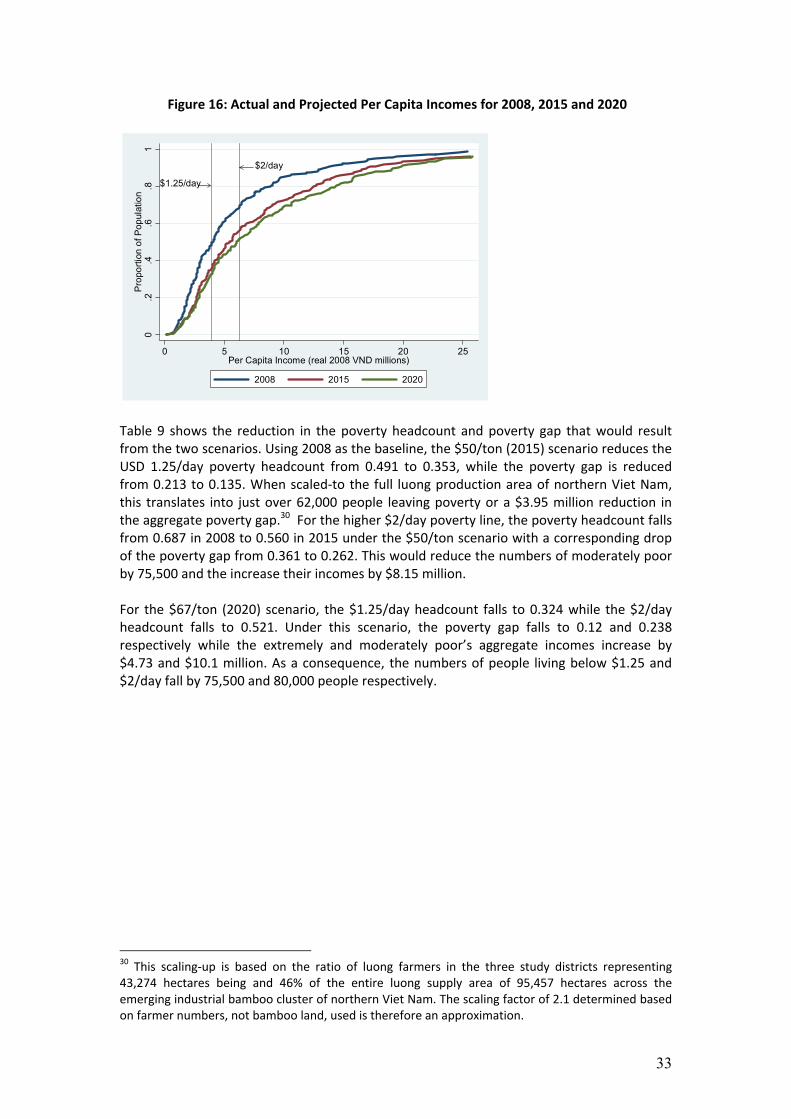
33
Figure 16: Actual and Projected Per Capita Incomes for 2008, 2015 and 2020
$1.25/day
$2/day
0.2
.4.6
.81
Pro
porti
on o
f Pop
ulat
ion
0 5 10 15 20 25Per Capita Income (real 2008 VND millions)
2008 2015 2020
Table 9 shows the reduction in the poverty headcount and poverty gap that would result from the two scenarios. Using 2008 as the baseline, the $50/ton (2015) scenario reduces the USD 1.25/day poverty headcount from 0.491 to 0.353, while the poverty gap is reduced from 0.213 to 0.135. When scaled‐to the full luong production area of northern Viet Nam, this translates into just over 62,000 people leaving poverty or a $3.95 million reduction in the aggregate poverty gap.30 For the higher $2/day poverty line, the poverty headcount falls from 0.687 in 2008 to 0.560 in 2015 under the $50/ton scenario with a corresponding drop of the poverty gap from 0.361 to 0.262. This would reduce the numbers of moderately poor by 75,500 and the increase their incomes by $8.15 million. For the $67/ton (2020) scenario, the $1.25/day headcount falls to 0.324 while the $2/day headcount falls to 0.521. Under this scenario, the poverty gap falls to 0.12 and 0.238 respectively while the extremely and moderately poor’s aggregate incomes increase by $4.73 and $10.1 million. As a consequence, the numbers of people living below $1.25 and $2/day fall by 75,500 and 80,000 people respectively. 30 This scaling‐up is based on the ratio of luong farmers in the three study districts representing 43,274 hectares being and 46% of the entire luong supply area of 95,457 hectares across the emerging industrial bamboo cluster of northern Viet Nam. The scaling factor of 2.1 determined based on farmer numbers, not bamboo land, used is therefore an approximation.

34
Table 9: Poverty Projections for 2015 and 2020 Poverty headcount
Poverty gap
count
aggregate aggregate change
ratio total change ratio VND millions
$ millions $ millions
$1.25/day poverty line 2008 (actual) 0.490 222,726 0 0.213 181,539 10.87 0.00 2015 ($50/ton) 0.353 160,674 62,052 0.136 115,632 6.92 3.95 2020 ($67/ton) 0.324 147,231 75,494 0.120 102,570 6.14 4.73 $2/day poverty line 2008 (actual) 0.697 316,408 0 0.361 493,029 29.52 0.00 2015 ($50/ton) 0.560 254,153 62,255 0.262 356,986 21.38 8.15 2020 ($67/ton) 0.521 236,402 80,006 0.238 324,159 19.41 10.11
Some caveats to these projections should be noted. First, only the effects on income from luong sales arising from higher luong prices are considered. Employment based income increases are not included. Higher levels of luong production would, however, expected to be associated with higher levels of wage employment both on an off farm. Based on our 2008 study, we do not expect the second of these to be very large. Second, the poverty projections above have been made with reference to the 95,000 hectares of luong bamboo across the northern Viet Nam cluster. Given the linkages between luong bamboo and other commercial species and that the total supply base of bamboo in the emerging Northern Viet Nam cluster is in the vicinity of 800,000 ha (more than half of which is pure commercially relevant bamboo forest), the actual potential impact on poverty reduction of a growing bamboo industry is likely to be much more than the earlier estimates made by Prosperity Initiative in 2008 for the industrial bamboo sector (Marsh and Ngo, 2009). Pressed bamboo and other high utilisation, high value technologies with simpler supply chain structures offer great potential in extending poverty reduction to non‐luong areas and species. Third, the emerging cluster of Southern Viet Nam, which draws on a different supply area and parallels the dynamics and potential of the emerging Northern Viet Nam cluster, is not considered. Based on preliminary knowledge of the resource base, the poverty reduction potential will be of a similar scale should this cluster successfully emerge. Over the coming years, as a better understanding of species as a supply base to the industry emerges in both North and South, better estimates of the poverty reduction potential will be developed. For all of these reasons, while these projections show that the poverty reduction potential of industrial bamboo in Viet Nam is substantial, our estimates are deliberately on the conservative side.
35
Summary and Conclusions This report has examined the impact of the industrial bamboo subsector on three poor luong producing upland districts in northwest Thanh Hoa. Of the total of 95,000 hectares of luong supplying the emerging northern Viet Nam industrial bamboo cluster, approximately 43,000 hectares (46%) are located in these three districts. Prosperity Initiative’s second Thanh Hoa survey shows that bamboo is ranked as the third most important economic activity (after irrigated rice and poultry) in these districts. Over fourth‐fifths of surveyed households cultivated luong, with two‐thirds of these households harvesting culms at least once a year and one‐fifth harvesting it on a monthly or quarterly basis. However, median yields of 286 luong culms per hectare are well below the estimated sustainable yield of 600 culms per hectare. The luong value chain in North‐west Thanh Hoa is characterised by a large number of collectors, traders and processors and has been expanding in recent years. Nonetheless, almost half of households surveyed sold their luong to just one buyer, and 9 out of 10 transported their harvest culms to the point of sale by carrying them on their shoulders. Some 82% of buyers only purchased bamboo within their own communes, and less than a quarter of the luong sold is processed into higher value products. An analysis of luong purchase prices shows that they have stable price differentials across grades and are lower when there are no collectors within the commune but higher when a processor exists. Luong prices also tend to be higher in Ba Thuoc district. While nominal luong prices have risen by around 30% in the last two years, this is slower than the price increases for some food commodities and has only just kept up with inflation. Using the new international extreme poverty line of $1.25/day (in 2005 PPP terms), we find that poverty in the three districts has fallen from 61% to 55% between 2006 and 2008. During this time, poverty fell by 8 percentage points among households engaged in cultivating, processing or trading luong while poverty remained unchanged for households without luong incomes. Matched difference‐in‐difference estimates show that household incomes were approximately $231 an annum higher among households with luong than without incomes from luong. Furthermore, these estimates show that livestock and other incomes are similar for households with and without luong incomes, suggesting that it is complementary to other rural income generating activities. Looking to the future, we project the likely impact of increases in luong prices and yields on incomes and poverty in the areas supplying the industrial bamboo cluster in northern Vietnam. If luong yields increase to sustainable levels while prices increase to half of the Chinese moso bamboo prices ($50/ton), the percentage of people living on less than $1.25/day will fall from 49% in 2008 to 33% in 2015. This translates into just over 62,000 people leaving extreme poverty or almost $4 million more in the hands of poor people. Further increases in luong prices to $67/ton (which is still only two‐thirds of the moso prices in Anji, China) would reduce poverty to 32% or another 13,500 people by 2020. Projected reductions in poverty due to luong incomes are even more dramatic if the higher international poverty line of $2/day is used.

36
References Alderman, H., Behrman, J., Kohler, H.P., Maluccio, J. and Watkins, S.C., 2001, ‘Attrition in longitudinal household survey data: some tests for three developing‐country samples’, Demographic Research 5, 79‐124. Baker, J. (2000) Evaluating the Impact of Development Projects on Poverty: A Handbook for Practitioners, Washington, D.C.: World Bank Brandt, L. (2006) ‘Land access, land markets and their distribution implications in rural Viet Nam’, Mimeo, University of Toronto CAP (2009) ‘The socio‐economic impacts of the avian influenza outbreak and control measures on backyard and small scale producers in Viet Nam’, Hanoi: Centre for Agricultural Policy Chen, S. and Ravallion (2008), ‘The developing world is poorer than we thought, but no less successful in the fight against poverty’, Policy Research Working Paper 4703, Washington DC, World Bank. Forest Science Institute of Viet Nam (2008). Report on the Results of Research on Bamboos in Viet Nam. Consultants Report, Prosperity Initiative and FSIV, Hanoi. GSO (2009) The 2009 Population and Housing Census: Implementation and Preliminary Results, Hanoi: Central Population and Housing Census Steering Committee
Heckman, J., H. Ichimura and P. Todd (1998), “Matching as an econometric evaluation estimator,” Review of Economic Studies, 65(2): 261‐294. Marsh, J. and Smith, N. (2007) New bamboo industries and pro‐poor impact: learning from China. Enterprise Development & Microfinance, 18(2/3) Marsh, J. and Ngo, V.H. (2009) ‘The emerging industrial bamboo cluster in northern Viet Nam: impact on upland poverty reduction’, Paper presented to the World Bamboo Congress, Bangkok, Thailand 16‐18 September 2009 Nguyen, H.N. (2006) Bamboos of Viet Nam, Forest Science Institute of Viet Nam (FSIV) and International Plant Genetic Resources Institute (IPGRI), Hanoi: Agricultural Publishing House Nguyen. C.V, Tran, T.N. and van de Weide, R. (2009) Poverty and Inequality in Rural Vietnam: Small Area Estimation using the Vietnam Household Living Standard Survey 2006 and Rural Agriculture and Fishery Census 2006, Hanoi: Institute of Labor and Social Affairs and World Bank Oxfam Hong Kong (2006) Mekong Bamboo: Sector Feasibility Study, Hanoi: Prosperity Initiative (2008) Thanh Hoa Bamboo Impact Assessment Report, Prosperity Initiative, Hanoi

37
Prosperity Initiative (2009a) ‘Pressed Bamboo Block Product Investment Prospectus’, Hanoi: Prosperity Initiative Prosperity Initiative (2009b) ‘Industrial Bamboo in northwest Viet Nam and North East Lao: Practical Steps to Large Scale Poverty Impacts’, Hanoi: Prosperity Initiative Ravallion, M., Chen, S. and Sangruala, P (2008) ‘Dollar a Day Revisited,’ Policy Research Working Paper 4620, Washington DC, World Bank. Ruiz Perez, M., Belcher, B., Maoyi, F., and Xiaosheng, Y. (2004) ‘Looking though the bamboo curtain: an analysis of the changing role of forest and farm incomes in rural livelihoods in China’, International Forestry Review 6(3‐4): 306‐316 Thanh Hoa Department of Agriculture and Rural Development and Luong Development Project (2009). Luong of Thanh Hoa. Hanoi: Agricultural Publishing House

38
Annex 1: The Luong Supply Chain in Thanh Hoa
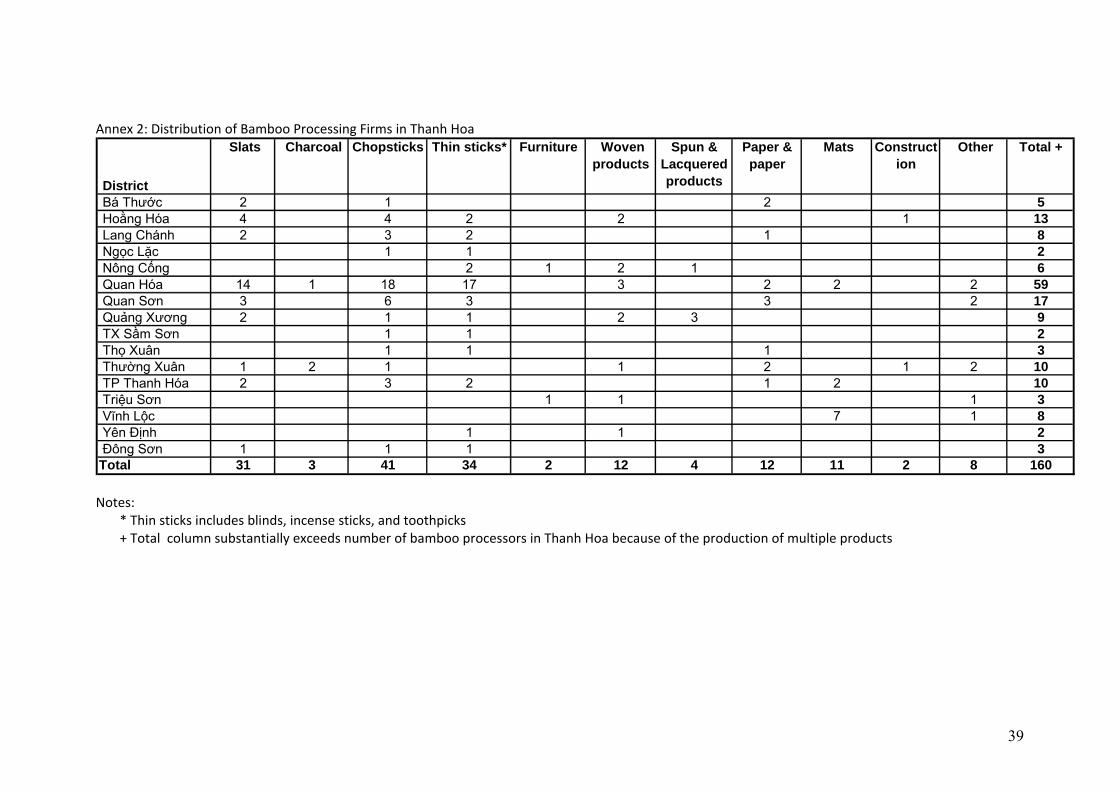
39
Annex 2: Distribution of Bamboo Processing Firms in Thanh Hoa
District
Slats Charcoal Chopsticks Thin sticks* Furniture Woven products
Spun & Lacquered products
Paper & paper
Mats Construction
Other Total +
Bá Thước 2 1 2 5 Hoằng Hóa 4 4 2 2 1 13 Lang Chánh 2 3 2 1 8 Ngọc Lặc 1 1 2 Nông Cống 2 1 2 1 6 Quan Hóa 14 1 18 17 3 2 2 2 59 Quan Sơn 3 6 3 3 2 17 Quảng Xương 2 1 1 2 3 9 TX Sầm Sơn 1 1 2 Thọ Xuân 1 1 1 3 Thường Xuân 1 2 1 1 2 1 2 10 TP Thanh Hóa 2 3 2 1 2 10 Triệu Sơn 1 1 1 3 Vĩnh Lộc 7 1 8 Yên Định 1 1 2 Đông Sơn 1 1 1 3Total 31 3 41 34 2 12 4 12 11 2 8 160 Notes:
* Thin sticks includes blinds, incense sticks, and toothpicks + Total column substantially exceeds number of bamboo processors in Thanh Hoa because of the production of multiple products