Key Features of a Bond
134
173A – January 31, 2007 Stocks, Bonds Overview of Financial Options Accounting for Financial Management (=Financial Statements!)
description
173A – January 31, 2007 Stocks, Bonds Overview of Financial Options Accounting for Financial Management (=Financial Statements!). Key Features of a Bond. 1.Par value: Face amount; paid at maturity. Assume $1,000. - PowerPoint PPT Presentation
Transcript of Key Features of a Bond

173A – January 31, 2007Stocks, Bonds
Overview of Financial OptionsAccounting for Financial Management (=Financial
Statements!)

Key Features of a Bond
1. Par value: Face amount; paid at maturity. Assume $1,000.
2. Coupon interest rate: Stated interest rate. Multiply by par value to get dollars of interest.
Generally fixed.

3. Maturity: Years until bondmust be repaid. Declines.
4. Issue date: Date when bondwas issued.
5. Default risk: Risk that issuer will not make interest or principal payments.

How does adding a call provision affect a bond?
• Issuer can refund if rates decline. That helps the issuer but hurts the investor.
• Therefore, borrowers are willing to pay more, and lenders require more, on callable bonds.
• Most bonds have a deferred call and a declining call premium.
• Let’s look at Bonds on the Internet (assuming access works!)

What’s a sinking fund?
• Provision to pay off a loan over its life rather than all at maturity.
• Similar to amortization on a term loan.• Reduces risk to investor, shortens
average maturity.• But not good for investors if rates
decline after issuance.

1. Call x% at par per year for sinking fund purposes.
2. Buy bonds on open market.
Company would call if rd is below the coupon rate and bond sells at a premium. Use open market purchase if rd is above coupon rate and bond sells at a discount.
Sinking funds are generally handledin 2 ways

Discounted Cash FlowApplies to valuing ALL Financial Assets(Future Cash Flows & Required Rates)
PV =
CF
1+ r ... +
CF
1+r1 n
12
21
CF
rn .
0 1 2 nr
CF1 CFnCF2Value
...
+ ++

• The discount rate (ri) is the opportunity cost of capital, i.e., the rate that could be earned on alternative investments of equal risk.

What’s the value of a 10-year, 10% coupon bond if rd = 10%?
V
rB
d
$100 $1,000
11 10 10 . . . +
$100
1+ r d
100 100
0 1 2 1010%
100 + 1,000V = ?
...
= $90.91 + . . . + $38.55 + $385.54= $1,000.
+++1 r+ d

10 10 100 1000N I/YR PV PMT FV
-1,000
The bond consists of a 10-year, 10% annuity of $100/year plus a $1,000 lump sum at t = 10: Calculator
$ 614.46 385.54
$1,000.00
PV annuity PV maturity value Value of bond
===
INPUTS
OUTPUT

Excel Solution
• In real life, we will most often use Excel
• You can memorize the formula components or calculate them using the “Insert Function”
• Let’s do that for a few bonds on Excel

10 13 100 1000N I/YR PV PMT FV
-837.21
When kd rises, above the coupon rate, the bond’s value falls below par, so it sells at a discount.
What would happen if expected inflation rose by 3%, causing r = 13%?
INPUTS
OUTPUT

What would happen if inflation fell, and rd declined to 7%?
10 7 100 1000N I/YR PV PMT FV
-1,210.71
If coupon rate > rd, price rises above par, and bond sells at a premium.
INPUTS
OUTPUT
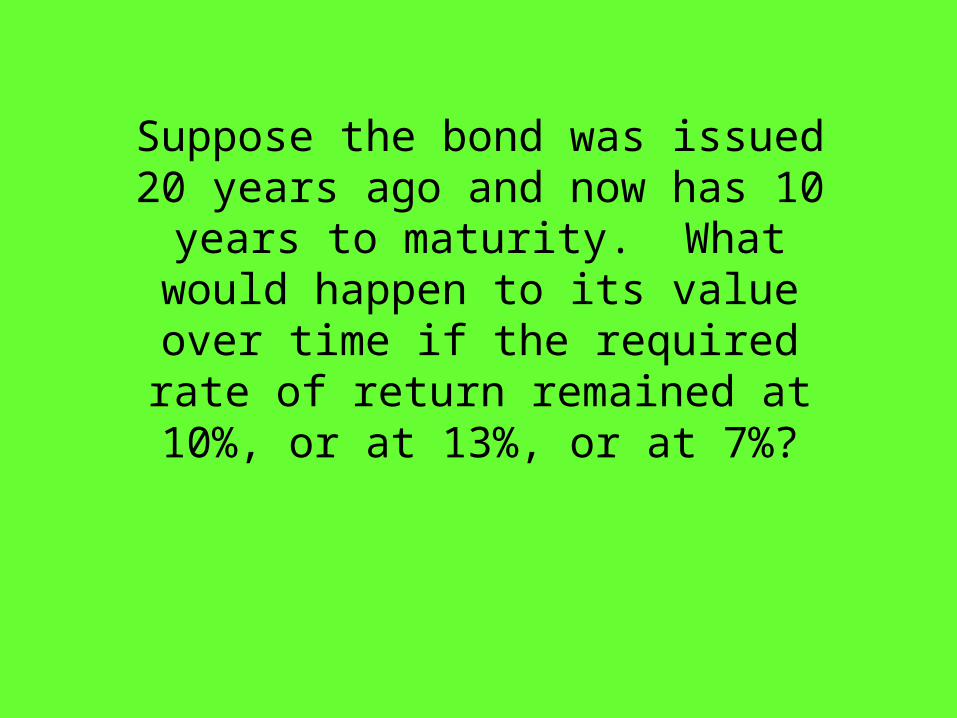
Suppose the bond was issued 20 years ago and now has 10 years to maturity. What would happen to its
value over time if the required rate of return remained at 10%, or at 13%, or
at 7%?

• At maturity, the value of any bond must equal its par value.
• The value of a premium bond would decrease to $1,000.
• The value of a discount bond would increase to $1,000.
• A par bond stays at $1,000 if rd remains constant.

What’s “yield to maturity”?
• YTM is the rate of return earned on a bond held to maturity. Also called “promised yield.”

What’s the YTM on a 10-year, 9% annual coupon, $1,000 par value bond that sells
for $887?
90 90 90
0 1 9 10rd=?
1,000PV1 . . .PV10
PVM
887 Find rd that “works”!
...

10 -887 90 1000N I/YR PV PMT FV
10.91
V
INT
r
M
rB
dN
dN
1 11
... +INT
1+ r d
887
90
1
1000
11 10 10
r rd d
+90
1+r d
,
Find rd = trial and error if manual
+ + + +
++++
INPUTS
OUTPUT
...

• If coupon rate < rd, bond sells at a discount.
• If coupon rate = rd, bond sells at its par value.
• If coupon rate > rd, bond sells at a premium.
• If rd rises, price falls.
• Price = par at maturity.

Find YTM if price were $1,134.20.
10 -1134.2 90 1000N I/YR PV PMT FV
7.08
Sells at a premium. Because coupon = 9% > rd = 7.08%, bond’s value > par.
INPUTS
OUTPUT

Definitions
Current yield =
Capital gains yield =
= YTM = +
Annual coupon pmtCurrent price
Change in priceBeginning price
Exp totalreturn
Exp Curr yld
Exp capgains yld

Find current yield and capital gains yield for a 9%, 10-year bond when the bond
sells for $887 and YTM = 10.91%.
Current yield =
= 0.1015 = 10.15%.
$90 $887

YTM = Current yield + Capital gains yield.
Cap gains yield = YTM - Current yield = 10.91% - 10.15% = 0.76%.
Could also find values in Years 1 and 2,get difference, and divide by value inYear 1. Same answer.

What’s interest rate (or price) risk? Does a 1-year or 10-year 10% bond have more risk?
rd 1-year Change 10-year Change
5% $1,048 $1,386
10% 1,000 4.8% 1,000 38.6%
15% 956 4.4% 749 25.1%
Interest rate risk: Rising rd causes bond’s price to fall. Why???? (Hint TVM)

0
500
1,000
1,500
0% 5% 10% 15%
1-year
10-year
rd
Value

What is reinvestment rate risk?
The risk that CFs will have to be reinvested in the future at lower rates, reducing income.
Illustration: Suppose you just won $500,000 playing the lottery. You’ll invest the money and live off the interest. You buy a 1-year bond with a YTM of 10%.

Year 1 income = $50,000. At year-end get back $500,000 to reinvest.
If rates fall to 3%, income will drop from $50,000 to $15,000. Had you bought 30-year bonds, income would have remained constant.

• Long-term bonds: High interest rate risk, low reinvestment rate risk.
• Short-term bonds: Low interest rate risk, high reinvestment rate risk.
• Nothing is riskless!

Semiannual and Monthly Bonds
1. Multiply years by 2 to get periods = 2n.2. Divide nominal rate by 2 to get periodic rate = rd/2.3. Divide annual INT by 2 to get PMT = INT/2.
1. Multiply years by 12 to get periods = 12n.2. Divide nominal rate by 12 to get periodic rate = rd/12.3. Divide annual INT by 12 to get PMT = INT/12.
Let’s try a few….

You could buy, for $1,000, either a 10%, 10-year, annual payment bond or an equally risky 10%, 10-year semiannual bond. Which would
you prefer?
.

If $1,000 is the proper price for the semiannual bond, what is the proper price for the annual
payment bond? IF you want the yields to be the same

A 10-year, 10% semiannual coupon,$1,000 par value bond is selling for$1,135.90 with an 8% yield to maturity.It can be called after 5 years at $1,050.
What’s the bond’s nominal yield tocall (YTC)?

If you bought bonds, would you be more likely to earn YTM or YTC?

• In general, if a bond sells at a premium, then (1) coupon > rd, so (2) a call is likely.
• So, expect to earn:– YTC on premium bonds.– YTM on par & discount bonds.

Bond Ratings Provide One Measure
of Default Risk
Investment Grade Junk Bonds
Moody’s Aaa Aa A Baa Ba B Caa C
S&P AAA AA A BBB BB B CCC D

What factors affect default risk and bond ratings?
• Financial performance– Debt ratio– Coverage ratios, such as interest
coverage ratio or EBITDA coverage ratio
– Current ratios

• Provisions in the bond contract– Secured versus unsecured debt– Senior versus subordinated debt– Guarantee provisions– Sinking fund provisions– Debt maturity

• Other factors– Earnings stability– Regulatory environment– Potential product liability– Accounting policies

Bankruptcy
• Two main chapters of Federal Bankruptcy Act:– Chapter 11, Reorganization– Chapter 7, Liquidation
• Typically, company wants Chapter 11, creditors may prefer Chapter 7.

• If company can’t meet its obligations, it files under Chapter 11. That stops creditors from foreclosing, taking assets, and shutting down the business.
• Company has 120 days to file a reorganization plan.– Court appoints a “trustee” to supervise
reorganization. – Management usually stays in control.

• Company must demonstrate in its reorganization plan that it is “worth more alive than dead.”
Otherwise, judge will order liquidation under Chapter 7.

• If the company is liquidated, here’s the payment priority:1. Secured creditors from sales of secured
assets.2. Trustee’s costs3. Wages, subject to limits4. Taxes5. Unfunded pension liabilities6. Unsecured creditors7. Preferred stock8. Common stock

• In a liquidation, unsecured creditors generally get zero. This makes them more willing to participate in reorganization even though their claims are greatly scaled back.
• Various groups of creditors vote on the reorganization plan. If both the majority of the creditors and the judge approve, company “emerges” from bankruptcy with lower debts, reduced interest charges, and a chance for success.

• Represents ownership.• Ownership implies control.• Stockholders elect directors.• Directors hire management.• Since managers are “agents” of
shareholders, their goal should be: Maximize stock price (this will be on an exam, guaranteed.
Common Stock: Owners, Directors, and Managers
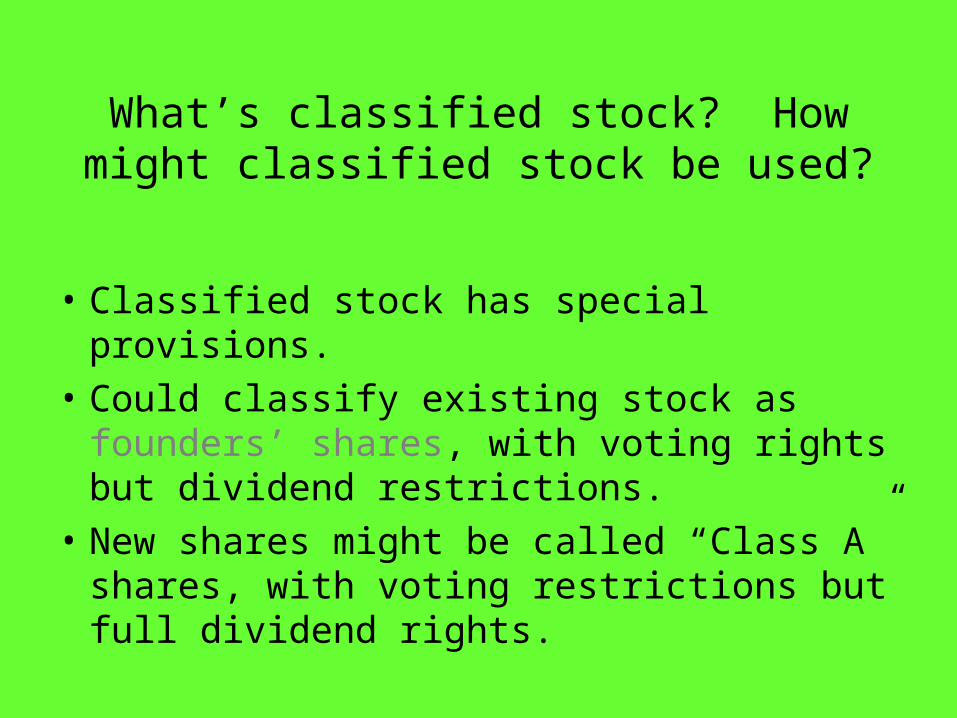
• Classified stock has special provisions.
• Could classify existing stock as founders’ shares, with voting rights but dividend restrictions.
• New shares might be called “Class A” shares, with voting restrictions but full dividend rights.
What’s classified stock? How might classified stock be used?

• The dividends of tracking stock are tied to a particular division, rather than the company as a whole.– Investors can separately value the divisions.– Its easier to compensate division managers
with the tracking stock.
• But tracking stock usually has no voting rights, and the financial disclosure for the division is not as regulated as for the company.
What is tracking stock?

When is a stock sale an initial public offering (IPO)?
What is a seasoned equity offering (SEO) or Secondary offering?

• Dividend growth model – issues!• Using the multiples of comparable firms• Free cash flow method (discounting the
forecasted future free cash flows of the company – time value, again!)
• Other possibilities???
Approaches for Valuing Common Stock

ssss r
D
r
D
r
D
r
DP
1. . .
111ˆ
33
22
11
0
One whose dividends are expected togrow forever at a constant rate, g. How likely is this?
Stock Value = PV of DividendsBut do all companies pay Dividends?
What is a constant growth stock?

For a constant growth stock,
D D gD D gD D gt t
t
1 01
2 02
111
gr
D
gr
gDP
ss
100
1ˆ
If g is constant, then:

What happens if g > rs?
• If rs< g, get negative stock price, which is nonsense.
• We can’t use model unless (1) g rs and (2) g is expected to be constant forever. Because g must be a long-term growth rate, it cannot be rs.
.r requires ˆs
10 g
gr
DP
s

What if we have variable dividends followed by constant growth?

Assume beta = 1.2, rRF = 7%, and RPM = 5%. What is the required rate of return on
the firm’s stock?
rs = rRF + (RPM)bFirm
= 7% + (5%) (1.2)= 13%.
Use the SML to calculate rs:

D0 was $2.00 and g is a constant 6%. Find the expected dividends for the next 3
years, and their PVs. rs = 13%.
0 1
2.2472
2
2.3820
3g=6% 4
1.87611.75991.6508
D0=2.0013%
2.12

What’s the stock’s market value? D0 = 2.00, rs = 13%, g = 6%.
Constant growth model:
gr
D
gr
gDP
ss
100
1ˆ
= = $30.29.0.13 - 0.06
$2.12 $2.12
0.07

What is the stock’s market value one year from now, P1?
• D1 will have been paid, so expected dividends are D2, D3, D4 and so on. Thus,
^
D2
P1 = rs - g
= $2.2427 = $32.100.07

Find the expected dividend yield and capital gains yield during the first year.
Dividend yield = = = 7.0%.$2.12
$30.29
D1
P0
CG Yield = =P1 - P0
^
P0
$32.10 - $30.29
$30.29
= 6.0%.

• Total return = Dividend yield + Capital gains yield.
• Total return = 7% + 6% = 13%.
• Total return = 13% = rs.
• For constant growth stock: Capital gains yield = 6% = g.
Total return during first year

Rearrange model to rate of return form:
.r to ˆ0
1s
10 g
P
D
gr
DP
s
Then, rs = $2.12/$30.29 + 0.06= 0.07 + 0.06 = 13%.
^

What would P0 be if g = 0?
The dividend stream would be a perpetuity.
2.00 2.002.00
0 1 2 3rs=13%
P0 = = = $15.38.PMT
r
$2.00
0.13^

If we have supernormal growth of 30% for 3 years, then a long-run constant
g = 6%, what is P0? r isstill 13%.
• Can no longer use constant growth model.
• However, growth becomes constant after 3 years.
^

Nonconstant growth followed by constantgrowth:
0
2.3009
2.6470
3.0453
46.1135
1 2 3 4rs=13%
54.1067 = P0
g = 30% g = 30% g = 30% g = 6%
D0 = 2.00 2.60 3.38 4.394 4.6576
^
5371.66$06.013.0
6576.4$P̂3
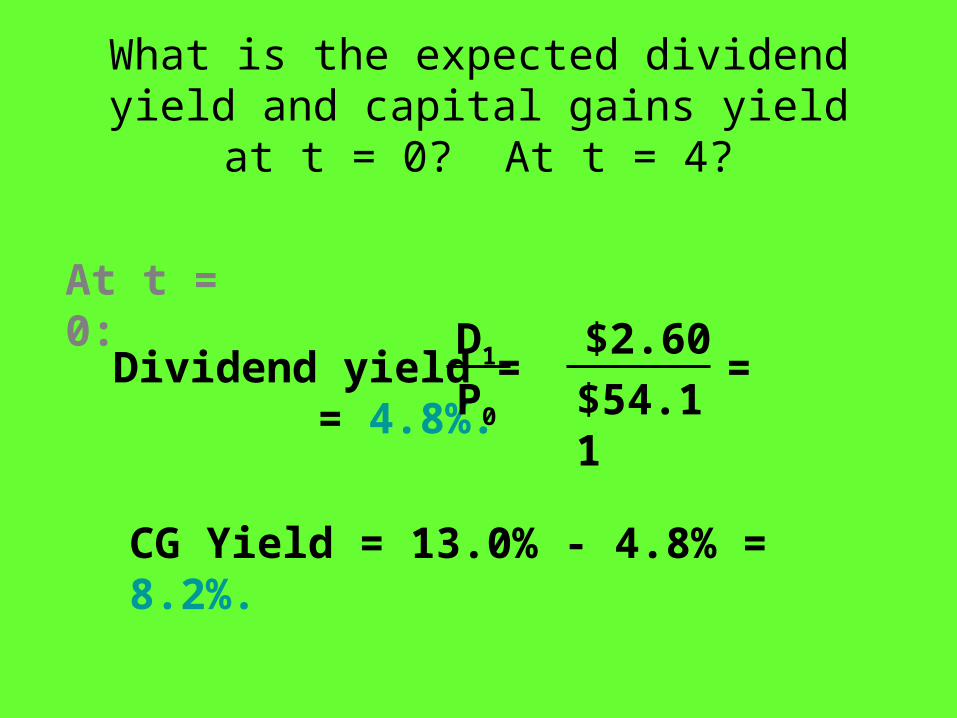
What is the expected dividend yield and capital gains yield at t = 0? At t = 4?
Dividend yield = = = 4.8%.$2.60
$54.11
D1
P0
CG Yield = 13.0% - 4.8% = 8.2%.
At t = 0:

Suppose g = 0 for t = 1 to 3, and then g is a constant 6%. What is P0?
0
1.76991.56631.3861
20.9895
1 2 3 4rs=13%
25.7118
g = 0% g = 0% g = 0% g = 6%
2.00 2.00 2.00 2.12
2.12.
P3 0 0730.2857
^
...

What is dividend yield and capital gains yield at t = 0 and at t = 3?
t = 0:D1
P0
CGY = 13.0% - 7.8% = 5.2%.
2.00$25.72
7.8%.
t = 3: Now have constant growth with g = capital gains yield = 6% and dividend yield = 7%.

If g = -6%, would anyone buy the stock? If so, at what price?
Firm still has earnings and still paysdividends, so P0 > 0:
gr
D
gr
gDP
ss
100
1ˆ
^
= = = $9.89.$2.00(0.94)
0.13 - (-0.06)
$1.88
0.19

What are the annual dividendand capital gains yield?
Capital gains yield = g = -6.0%.
Dividend yield = 13.0% - (-6.0%)= 19.0%.
Both yields are constant over time, with the high dividend yield (19%) offsetting the negative capital gains yield.

• Analysts often use the P/E multiple (the price per share divided by the earnings per share) or the P/CF multiple (price per share divided by cash flow per share, which is the earnings per share plus the dividends per share) to value stocks.
• Example:– Estimate the average P/E ratio of comparable firms.
This is the P/E multiple.– Multiply this average P/E ratio by the expected
earnings of the company to estimate its stock price.
Using the Stock Price Multiples to Estimate Stock Price
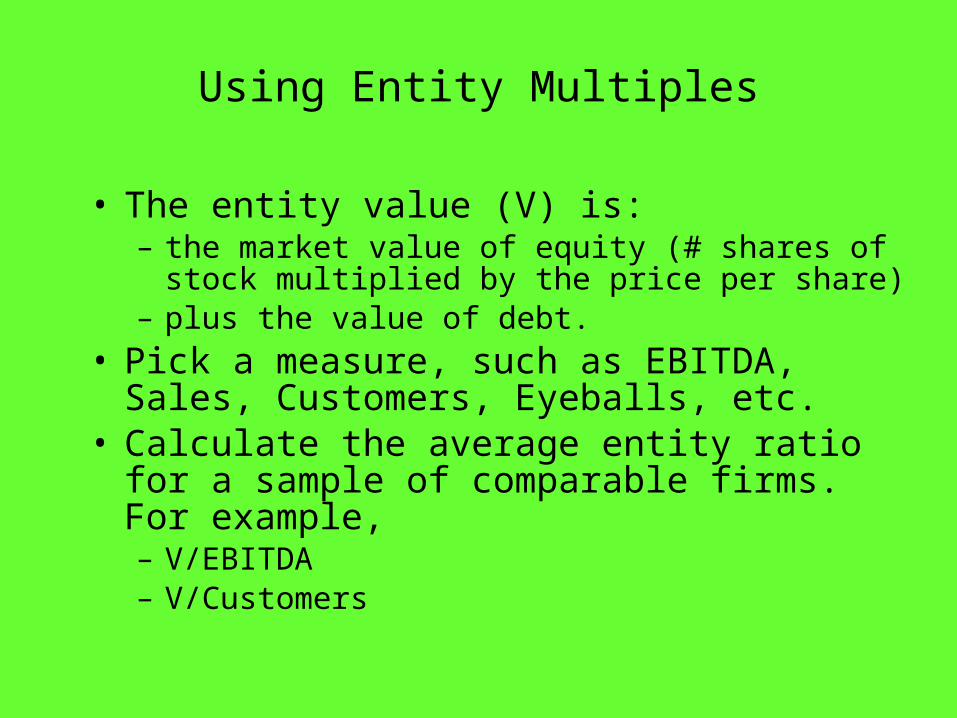
• The entity value (V) is:– the market value of equity (# shares of stock
multiplied by the price per share)– plus the value of debt.
• Pick a measure, such as EBITDA, Sales, Customers, Eyeballs, etc.
• Calculate the average entity ratio for a sample of comparable firms. For example,– V/EBITDA– V/Customers
Using Entity Multiples

• Find the entity value of the firm in question. For example,– Multiply the firm’s sales by the V/Sales multiple.– Multiply the firm’s # of customers by the
V/Customers ratio• The result is the total value of the firm.• Subtract the firm’s debt to get the total value of
equity.• Divide by the number of shares to get the price
per share.
Using Entity Multiples (Continued)

• It is often hard to find comparable firms.• The average ratio for the sample of comparable
firms often has a wide range.– For example, the average P/E ratio might be 20, but
the range could be from 10 to 50. How do you know whether your firm should be compared to the low, average, or high performers?
Problems with Market Multiple Methods

Why are stock prices volatile?
grD
0P
s1
rs = rRF + (RPM)bi could change. Inflation expectations Risk aversion Company risk
g could change.
^

Stock value vs. changes in required rate and growth rate?Let’s use Excel

What is market equilibrium?
^
In equilibrium, stock prices are stable.There is no general tendency for people to buy versus to sell.
The expected price, P, must equal the actual price, P. In other words, the fundamental value must be the same as the price.

In equilibrium, expected returns mustequal required returns:
rs = D1/P0 + g = rs = rRF + (rM - rRF)b.

How is equilibrium established?
If rs = + g > rs, then P0 is “too low.”
If the price is lower than the fundamental value, then the stock is a “bargain.”
Buy orders will exceed sell orders, the price
will be bid up, and D1/P0 falls until
D1/P0 + g = rs = rs.
^
^
D1
P0

Why do stock prices change?
10 gr
DP
i
ri = rRF + (rM - rRF )bi could change. Inflation expectations Risk aversion Company risk
g could change.
^

What’s the Efficient MarketHypothesis (EMH)?
Securities are normally in equilibrium and are “fairly priced.” One cannot “beat the market” except through good luck or inside information.

Markets are generally efficient because:
1. 100,000 or so trained analysts--MBAs, CFAs, and PhDs--work for firms like Fidelity, Merrill, Morgan, and Prudential.
2. These analysts have similar access to data and megabucks to invest.
3. Thus, news is reflected in P0 almost instantaneously.

Preferred Stock
• Hybrid security.
• Similar to bonds in that preferred stockholders receive a fixed dividend which must be paid before dividends can be paid on common stock.
• However, unlike bonds, preferred stock dividends can be omitted without fear of pushing the firm into bankruptcy.

What’s the expected return on preferred stock with Vps = $50 and annual dividend
= $5?
%.0.1010.050$
5$
5$50$
ps
ps
ps
r
rV

What is a real option?
• Real options exist when managers can influence the size and risk of a project’s cash flows by taking different actions during the project’s life in response to changing market conditions.
• Alert managers always look for real options in projects.
• Smarter managers try to create real options.

An option is a contract which gives its holder the right, but not the obligation, to buy (or sell) an asset at some predetermined price within a specified period of time.
As Opposed to: What is a financial option?

• It does not obligate its owner to take any action. It merely gives the owner the right to buy or sell an asset.
• In other words it is NOT a binding contract to buy or sell the asset
What is the single most importantcharacteristic of an option?

• Call option: An option to buy a specified number of shares of a security within some future period.
• Put option: An option to sell a specified number of shares of a security within some future period.
• Exercise (or strike) price: The price stated in the option contract at which the security can be bought or sold.
Option Terminology

• Option price: The market price of the option contract.
• Expiration date: The date the option matures.
• Exercise value: The value of a call option if it were exercised today = Current stock price - Strike price.Note: The exercise value is zero if the stock price is less than the strike price.

• Covered option: A call option written against stock held in an investor’s portfolio.
• Naked (uncovered) option: An option sold without the stock to back it up.
• In-the-money call: A call whose exercise price is less than the current price of the underlying stock.

• Out-of-the-money call: A call option whose exercise price exceeds the current stock price.
• LEAPS: Long-term Equity AnticiPation Securities that are similar to conventional options except that they are long-term options with maturities of up to 2 1/2 years.

So, if you think….
• Price will fall?
• Price will increase?
Is a stop loss order and option?

Exercise price = $25.Stock Price Call Option Price
$25 $ 3.00 30 7.50 35 12.00 40 16.50 45 21.00 50 25.50
Consider the following data:

Create a table which shows (a) stockprice, (b) strike price, (c) exercise
value, (d) option price, and (e) premiumof option price over the exercise value.
Price of Strike Exercise ValueStock (a) Price (b) of Option (a) - (b)$25.00 $25.00 $0.00 30.00 25.00 5.00 35.00 25.00 10.00 40.00 25.00 15.00 45.00 25.00 20.00 50.00 25.00 25.00

Exercise Value Mkt. Price Premium
of Option (c) of Option (d) (d) - (c)
$ 0.00 $ 3.00 $ 3.00
5.00 7.50 2.50
10.00 12.00 2.00
15.00 16.50 1.50
20.00 21.00 1.00
25.00 25.50 0.50

What happens to the premium of the option price over the exercisevalue as the stock price rises?
• The premium of the option price over the exercise value declines as the stock price increases.
• This is due to the declining degree of leverage provided by options as the underlying stock price increases, and the greater loss potential of options at higher option prices.

• The stock underlying the call option provides no dividends during the call option’s life.
• There are no transactions costs for the sale/purchase of either the stock or the option.
• RRF is known and constant during the option’s life.
What are the assumptions of theBlack-Scholes Option Pricing Model?

• Security buyers may borrow any fraction of the purchase price at the short-term risk-free rate.
• No penalty for short selling and sellers receive immediately full cash proceeds at today’s price.
• Call option can be exercised only on its expiration date.
• Security trading takes place in continuous time, and stock prices move randomly in continuous time.

V = P[N(d1)] - Xe -rRFt[N(d2)].
d1 = . t
d2 = d1 - t.
What are the three equations thatmake up the OPM?
ln(P/X) + [rRF + (2/2)]t

• Current stock price: Call option value increases as the current stock price increases.
• Exercise price: As the exercise price increases, a call option’s value decreases.
What impact do the following para-meters have on a call option’s value?

• Option period: As the expiration date is lengthened, a call option’s value increases (more chance of becoming in the money.)
• Risk-free rate: Call option’s value tends to increase as rRF increases (reduces the PV of the exercise price).
• Stock return variance: Option value increases with variance of the underlying stock (more chance of becoming in the money).

How are real options different from financial options?
• Financial options have an underlying asset that is traded--usually a security like a stock.
• A real option has an underlying asset that is not a security--for example a project or a growth opportunity, and it isn’t traded.

• The payoffs for financial options are specified in the contract.
• Real options are “found” or created inside of projects. Their payoffs can be varied.
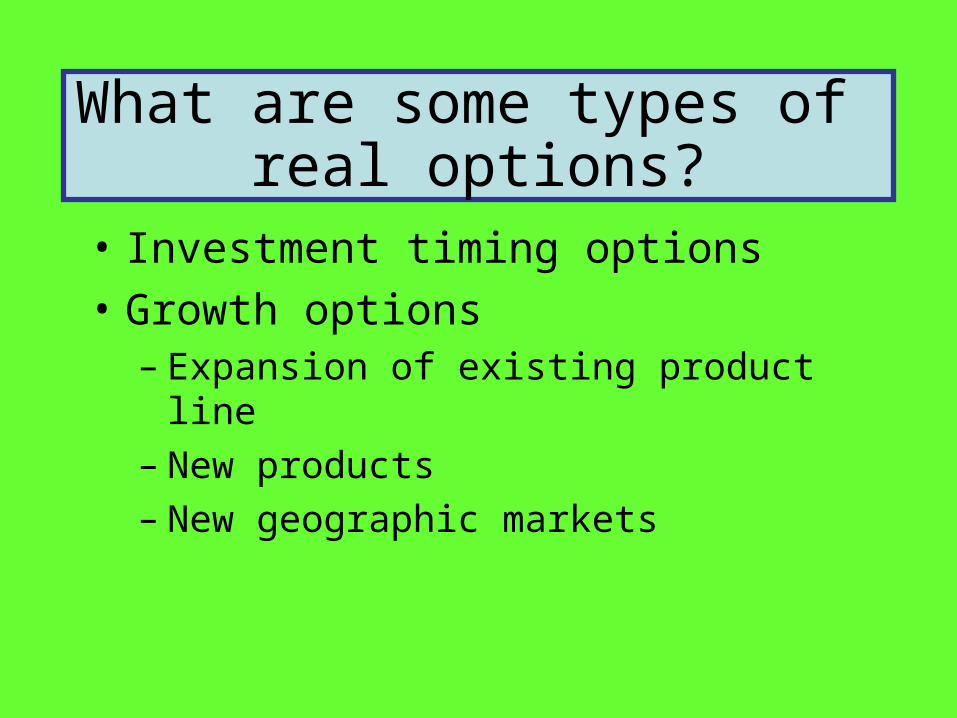
What are some types of real options?
• Investment timing options
• Growth options – Expansion of existing product line– New products– New geographic markets
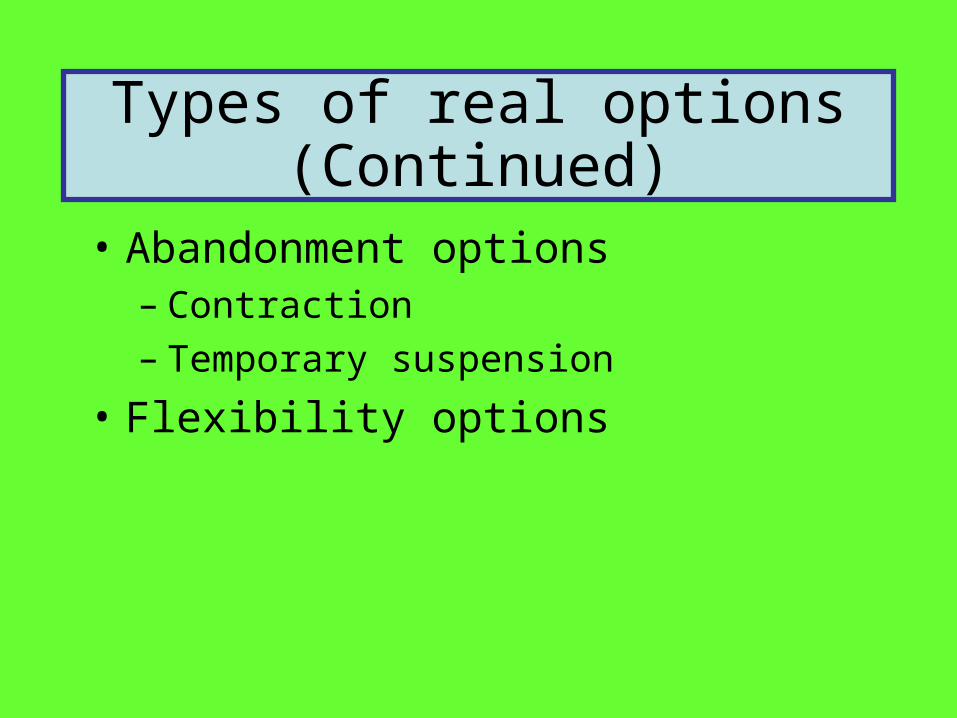
Types of real options (Continued)
• Abandonment options– Contraction– Temporary suspension
• Flexibility options

Five Procedures for ValuingReal Options
1. DCF analysis of expected cash flows, ignoring the option.
2. Qualitative assessment of the real option’s value.
3. Decision tree analysis.
4. Standard model for a corresponding financial option.
5. Financial engineering techniques.

Financial Option Analysis: Inputs
• X = exercise price = cost of implement project = $75 million.
• rRF = risk-free rate = 6%.
• t = time to maturity = 3 years.

Estimating P: First, find the value of future CFs at exercise
year.
Example: $111.91 = $45/1.1 + $45/1.12 + $45/1.13.
Cost PV at Prob.
2003 Prob. 2004 2005 2006 2007 2008 2009 2006 x NPV
$45 $45 $45 $111.91 $33.5730%40% $30 $30 $30 $74.61 $29.8430%
$15 $15 $15 $37.30 $11.19
Future Cash Flows

Now find the expected PV at the current date, 2003.
PV2003=PV of Exp. PV2006 = [(0.3* $111.91) +(0.4*$74.61) +(0.3*$37.3)]/1.13 = $56.05.
PV2003 2004 2005 PV2006
$111.91High
$56.05 Average $74.61Low
$37.30
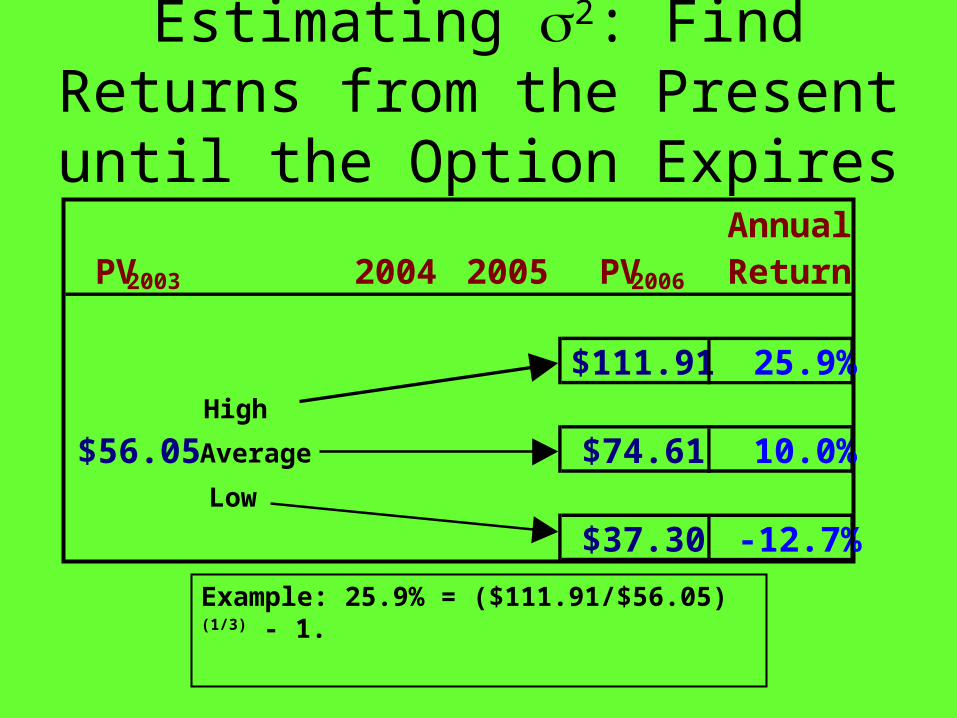
Estimating 2: Find Returns from the Present until the
Option Expires
Example: 25.9% = ($111.91/$56.05)(1/3) - 1.
AnnualPV2003 2004 2005 PV2006 Return
$111.91 25.9%High
$56.05 Average $74.61 10.0%Low
$37.30 -12.7%

Estimating 2 with the Indirect Method
PV2006
$111.91High
Average $74.61Low
$37.30
• From earlier slides, we know the value of the project for each scenario at the expiration date.

E(PV)=.3($111.91)+.4($74.61)+.3($37.3)
E(PV)= $74.61.
Use these scenarios, with their given probabilities, to find the project’s expected
PV and PV.
PV = [.3($111.91-$74.61)2
+ .4($74.61-$74.61)2 + .3($37.30-$74.61)2]1/2
PV = $28.90.

Income Statement2002 2003
Sales 3,432,000 5,834,400 COGS 2,864,000 4,980,000 Other expenses 340,000 720,000 Deprec. 18,900 116,960 Tot. op. costs 3,222,900 5,816,960 EBIT 209,100 17,440 Int. expense 62,500 176,000 EBT 146,600 (158,560)Taxes (40%) 58,640 (63,424)Net income 87,960 (95,136)

What happened to sales and net income?
• Sales increased by over $2.4 million.
• Costs shot up by more than sales.
• Net income was negative.
• However, the firm received a tax refund since it paid taxes of more than $63,424 during the past two years.

Balance Sheet: Assets
2002 2003Cash 9,000 7,282 S-T invest. 48,600 20,000 AR 351,200 632,160 Inventories 715,200 1,287,360 Total CA 1,124,000 1,946,802 Gross FA 491,000 1,202,950 Less: Depr. 146,200 263,160 Net FA 344,800 939,790 Total assets 1,468,800 2,886,592

What effect did the expansion - sales growth - have on the asset section of the
balance sheet?
• Net fixed assets almost tripled in size.
• AR and inventory almost doubled.
• Cash and short-term investments fell.

Statement of Retained Earnings: 2003
Balance of ret. earnings,
12/31/2002 203,768
Add: Net income, 2003 (95,136)
Less: Dividends paid, 2003 (11,000)
Balance of ret. earnings,
12/31/2003 97,632

Balance Sheet: Liabilities & Equity
2002 2003Accts. payable 145,600 324,000 Notes payable 200,000 720,000 Accruals 136,000 284,960 Total CL 481,600 1,328,960 Long-term debt 323,432 1,000,000 Common stock 460,000 460,000 Ret. earnings 203,768 97,632 Total equity 663,768 557,632 Total L&E 1,468,800 2,886,592

What effect did the expansion have on liabilities & equity?
• CL increased as creditors and suppliers “financed” part of the expansion.
• Long-term debt increased to help finance the expansion.
• The company didn’t issue any stock.• Retained earnings fell, due to the year’s
negative net income and dividend payment.

Statement of Cash Flows: 2003
Operating ActivitiesNet Income (95,136)Adjustments: Depreciation 116,960 Change in AR (280,960) Change in inventories(572,160) Change in AP 178,400 Change in accruals 148,960 Net cash provided by ops. (503,936)

Long-Term Investing Activities
Cash used to acquire FA(711,950)
Financing Activities
Change in S-T invest. 28,600
Change in notes payable520,000
Change in long-term debt676,568
Payment of cash dividends (11,000)
Net cash provided by fin. act. 1,214,168

Summary of Statement of CF
Net cash provided by ops. (503,936)
Net cash to acquire FA (711,950)
Net cash provided by fin. act. 1,214,168
Net change in cash (1,718)
Cash at beginning of year 9,000
Cash at end of year 7,282

What can you conclude from the statement of cash flows?
• Net CF from operations = -$503,936, because of negative net income and increases in working capital.
• The firm spent $711,950 on FA. • The firm borrowed heavily and sold
some short-term investments to meet its cash requirements.
• Even after borrowing, the cash account fell by $1,718.
What is free cash flow (FCF)? Why is it important?
• FCF is the amount of cash available from operations for distribution to all investors (including stockholders and debtholders) after making the necessary investments to support operations.
• A company’s value depends upon the amount of FCF it can generate.

What are the five uses of FCF?
1. Pay interest on debt.
2. Pay back principal on debt.
3. Pay dividends.
4. Buy back stock.
5. Buy nonoperating assets (e.g., marketable securities, investments in other companies, etc.)
What are operating current assets?
• Operating current assets are the CA needed to support operations.– Op CA include: cash, inventory, receivables.– Op CA exclude: short-term investments,
because these are not a part of operations.
What are operating current liabilities?
• Operating current liabilities are the CL resulting as a normal part of operations.– Op CL include: accounts payable and
accruals.– Op CA exclude: notes payable, because this
is a source of financing, not a part of operations.

NOWC03 = ($7,282 + $632,160 + $1,287,360)
- ($324,000 + $284,960)
= $1,317,842.
NOWC02 = $793,800.
= -Operating
CAOperating
CLNOWC
What effect did the expansion have on net operating working capital (NOWC)?

What effect did the expansion have on total net operating capital (also just called
operating capital)?
= NOWC + Net fixed assets.
= $1,317,842 + $939,790
= $2,257,632.
= $1,138,600.
Operatingcapital03
Operatingcapital02
Operatingcapital

Did the expansion create additional net operating profit after taxes (NOPAT)?
NOPAT = EBIT(1 - Tax rate)
NOPAT03 = $17,440(1 - 0.4)
= $10,464.
NOPAT02 = $125,460.

What was the free cash flow (FCF)for 2003?
FCF = NOPAT - Net investment in
operating capital
= $10,464 - ($2,257,632 - $1,138,600)
= $10,464 - $1,119,032
= -$1,108,568.
How do you suppose investors reacted?

Return on Invested Capital (ROIC)
ROIC = NOPAT / operating capital
ROIC03 = $10,464 / $2,257,632 = 0.5%.
ROIC02 = 11.0%.

The firm’s cost of capital is 10%. Did the growth add value?
• No. The ROIC of 0.5% is less than the WACC of 10%. Investors did not get the return they require.
• Note: High growth usually causes negative FCF (due to investment in capital), but that’s ok if ROIC > WACC. For example, Home Depot has high growth, negative FCF, but a high ROIC.

Calculate EVA. Assume the cost of capital (WACC) was 10% for both years.
EVA = NOPAT- (WACC)(Capital)
EVA03 = $10,464 - (0.1)($2,257,632)
= $10,464 - $225,763
= -$215,299.
EVA02 = $125,460 - (0.10)($1,138,600)
= $125,460 - $113,860
= $11,600.

Stock Price and Other Data
2002 2003
Stock price $8.50 $2.25
# of shares 100,000 100,000
EPS $0.88 -$0.95
DPS $0.22 $0.11

What is MVA (Market Value Added)?
• MVA = Market Value of the Firm - Book Value of the Firm
• Market Value = (# shares of stock)(price per share) + Value of debt
• Book Value = Total common equity + Value of debt

MVA (Continued)
• If the market value of debt is close to the book value of debt, then MVA is:
MVA = Market value of equity – book value of equity