Key Features - TestEquity€¦ · 89601B/BN-BHJ 802.11ac WLAN Modulation analysis 89601B/BN-B7R...
19
89601B/BN-BHJ 802.11ac WLAN Modulation analysis 89601B/BN-B7R WLAN Modulation Analysis 89601B/BN-B7Z 802.11n WLAN Modulation Analysis 89600B VSA Software Technical Overview Key Features • Support for latest WLAN formats such as 802.11ac • Support for standard-specific bandwidths up to 160 MHz (both in contiguous and non-contiguous mode) • Gather info on and troubleshoot PHY layer performance and errors down to bit level • Analyze up to 4x4 MIMO signals with Option B7Z (802.11n) and Option BHJ (802.11ac) • Gain 20:20 insight: 20 trace displays with 20 markers each, providing multiple views of important signal details
Transcript of Key Features - TestEquity€¦ · 89601B/BN-BHJ 802.11ac WLAN Modulation analysis 89601B/BN-B7R...

89601B/BN-BHJ 802.11ac WLAN Modulation analysis
89601B/BN-B7R WLAN Modulation Analysis
89601B/BN-B7Z 802.11n WLAN Modulation Analysis
89600B VSA Software
Technical Overview
Key Features
• Support for latest WLAN formats such as 802.11ac
• Support for standard-specifi c bandwidths up to 160 MHz (both
in contiguous and non-contiguous mode)
• Gather info on and troubleshoot PHY layer performance and
errors down to bit level
• Analyze up to 4x4 MIMO signals with Option B7Z (802.11n) and
Option BHJ (802.11ac)
• Gain 20:20 insight: 20 trace displays with 20 markers each,
providing multiple views of important signal details

2
Gain greater insight into signals using
the WLAN capabilities of the 89600B
VSA software, providing baseband,
RF and modulation quality measure-
ments for WLAN. Option B7R, the
WLAN modulation analysis option
for the 89600B Series VSA software,
provides spectrum, time, and modula-
tion quality measurements for WLAN
(802.11a/b/g) signals.
Options B7Z and BHJ expand upon
the WLAN modulation analysis
provided by Option B7R to include
802.11n (Option B7Z) and 802.11ac
(Option BHJ). Option B7Z adds an
advanced troubleshooting and evalu-
ation toolset specifi cally designed to
handle the challenge of analyzing an
IEEE 802.11n MIMO signal. Option
BHJ adds the capability to analyze
and troubleshoot next-generation
802.11ac signals.
802.11n and 802.11ac are among
over 70 signal standards and modu-
lation types for which the 89600B
VSA software creates a window into
what’s happening inside your complex
wireless devices. The 89600B tools
provide views of virtually every facet
of a problem, helping you see the
“why?” behind signal problems.
Whether you’re working with emerg-
ing or established standards, the
89600B VSA software helps you see
through the complexity.
Try before you buy!
Download the 89600B software and use it free for 14 days to make measurements with your analysis hardware, or use our recorded demo signals by selecting File > Recall > Recall Demo> 802_11abgj (or 802_11n or 802_11ac) on the software toolbar. Request your free trial license today:
www.agilent.com/find/89600B_trial
WLAN Modulation Analysis
Technology overviewThe IEEE 802.11 WLAN standard
includes several extensions: the
IEEE-802.11a/g and the older
HiperLAN2 standards, both of which
use burst OFDM signals, with either
20 or 40 MHz bandwidth. The IEEE
802.11b standard defi nes a direct
sequence spread spectrum (DSSS)
signal, with complementary code
keying (CCK) modulation, plus an
optional packet binary convolution
code (PBCC) mode, and an optional
shorter preamble.
The 802.11g standard modifi es the
802.11b standard, adding the ability to
use 802.11a OFDM-formatted signals
and an optional 802.11b-compatible
DSSS-OFDM mode, plus other
modifi cations.
An additional extension, the
IEEE 802.11n HT standard, adds the
ability to measure and decode up to
4x4 multiple input, multiple output
(MIMO) WLAN signals for higher
throughput. This 802.11n standard
further supports mixed MIMO and
legacy transmissions for backward
compatibility.
The next-generation 802.11ac
standard will achieve throughputs
approaching 1 GB/s with wider
bandwidths (up to 160 MHz), higher
density modulation formats (up to
256QAM) and up to 8x8 MIMO.
Table of Contents
WLAN Modulation Analysis .......................................................................2
Analysis and Troubleshooting ....................................................................3
Software Features ..........................................................................................8
Key Specifi cations ........................................................................................16
Additional Resources ..................................................................................19
3
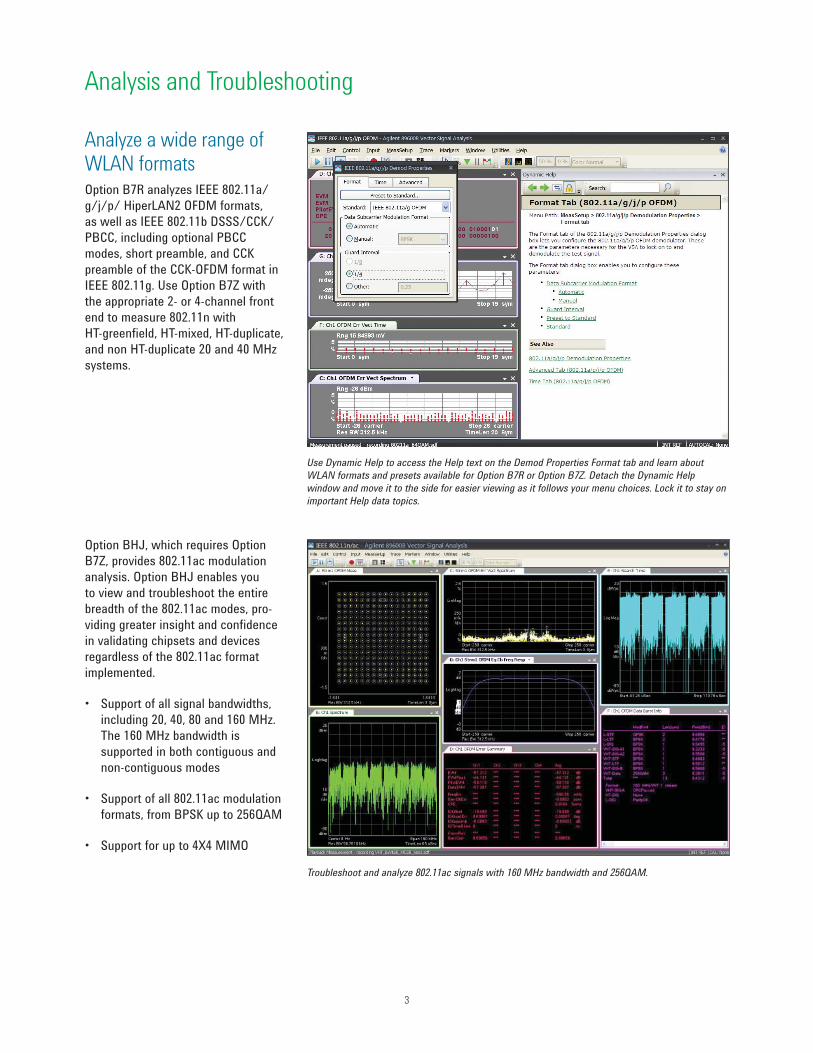
Use Dynamic Help to access the Help text on the Demod Properties Format tab and learn about
WLAN formats and presets available for Option B7R or Option B7Z. Detach the Dynamic Help
window and move it to the side for easier viewing as it follows your menu choices. Lock it to stay on
important Help data topics.
Troubleshoot and analyze 802.11ac signals with 160 MHz bandwidth and 256QAM.
Analysis and Troubleshooting
Analyze a wide range of WLAN formats Option B7R analyzes IEEE 802.11a/
g/j/p/ HiperLAN2 OFDM formats,
as well as IEEE 802.11b DSSS/CCK/
PBCC, including optional PBCC
modes, short preamble, and CCK
preamble of the CCK-OFDM format in
IEEE 802.11g. Use Option B7Z with
the appropriate 2- or 4-channel front
end to measure 802.11n with
HT-greenfi eld, HT-mixed, HT-duplicate,
and non HT-duplicate 20 and 40 MHz
systems.
Option BHJ, which requires Option
B7Z, provides 802.11ac modulation
analysis. Option BHJ enables you
to view and troubleshoot the entire
breadth of the 802.11ac modes, pro-
viding greater insight and confi dence
in validating chipsets and devices
regardless of the 802.11ac format
implemented.
• Support of all signal bandwidths,
including 20, 40, 80 and 160 MHz.
The 160 MHz bandwidth is
supported in both contiguous and
non-contiguous modes
• Support of all 802.11ac modulation
formats, from BPSK up to 256QAM
• Support for up to 4X4 MIMO
4
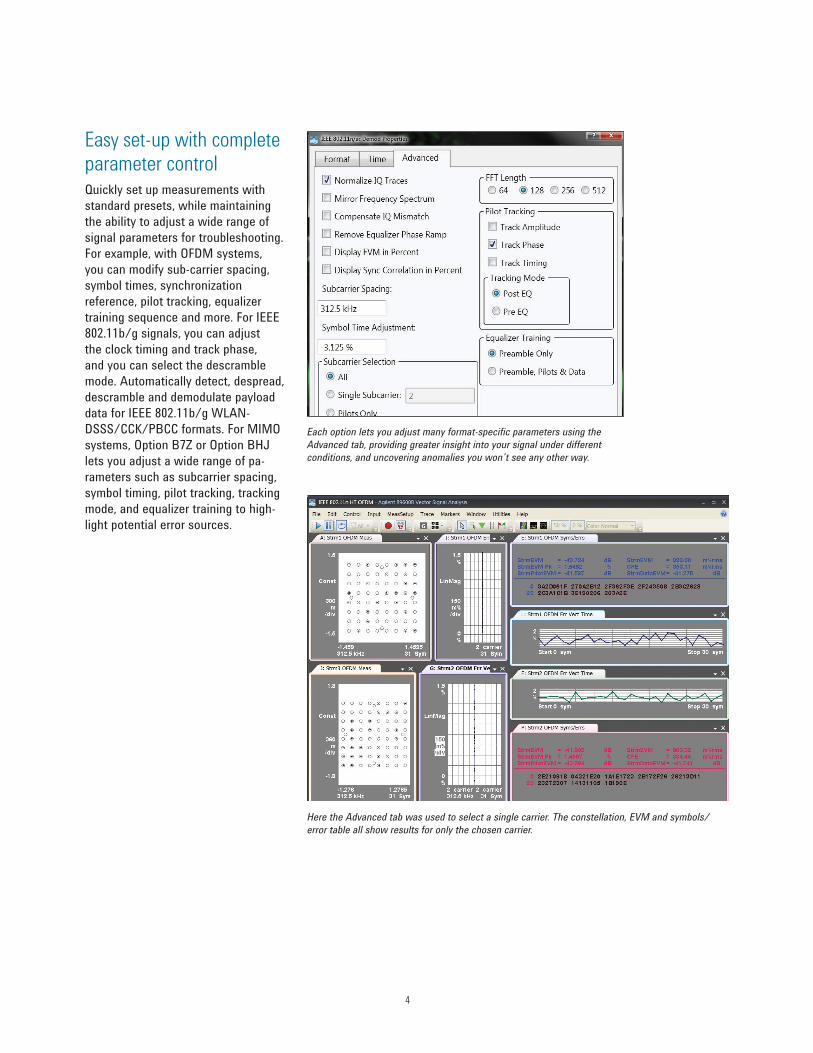
Each option lets you adjust many format-specifi c parameters using the
Advanced tab, providing greater insight into your signal under different
conditions, and uncovering anomalies you won’t see any other way.
Here the Advanced tab was used to select a single carrier. The constellation, EVM and symbols/
error table all show results for only the chosen carrier.
Easy set-up with complete parameter control Quickly set up measurements with
standard presets, while maintaining
the ability to adjust a wide range of
signal parameters for troubleshooting.
For example, with OFDM systems,
you can modify sub-carrier spacing,
symbol times, synchronization
reference, pilot tracking, equalizer
training sequence and more. For IEEE
802.11b/g signals, you can adjust
the clock timing and track phase,
and you can select the descramble
mode. Automatically detect, despread,
descramble and demodulate payload
data for IEEE 802.11b/g WLAN-
DSSS/CCK/PBCC formats. For MIMO
systems, Option B7Z or Option BHJ
lets you adjust a wide range of pa-
rameters such as subcarrier spacing,
symbol timing, pilot tracking, tracking
mode, and equalizer training to high-
light potential error sources.

5
Evaluate modulation quality down to the bit levelMake EVM measurements at the
level needed: overall burst, per
symbol, or per each subcarrier in a
symbol. Examine the symbols and
error table for information on aver-
age EVM, peak EVM and its location,
demodulated bits, detected header
information and more.
For MIMO systems, Option B7Z and
Option BHJ provide detected stream
bits, a MIMO channel matrix, data
burst information, multiple data
streams, cross channel inputs, plus
NxN channel matrix values. Auto-
matically determine spatial mapping
matrix, subcarrier modulation format,
burst length and more. The 89600B MIMO error traces are available for the physical input channels and the logical
streams. Cross channel measurement traces specifi c to MIMO are also available.
View key 802.11ac MIMO parameters such as multiple spectrums, error summary and frequency
response for up to 4 transmit streams simultaneously.

6
Powerful error measure-ments let you look at signal performance in detailError vector spectrum, error vector
time, channel frequency response,
correction, common pilot error per
symbol, and more, are available
for 802.11g formats. Compound
constellation displays let you
determine and display all modulation
formats in the burst. Option B7Z and
Option BHJ add channel, stream, and
cross channel data, providing the most
complete and robust signal and error
characterization in the industry.
The 89600B lets you view up to 20 simultaneous traces, showing data transmitted in the
preambles and headers of the 802.11b/g signal, as well as EVM over frequency and time, IQ errors,
correction spectrum and more. Additional MIMO data is available with Option B7Z.
Option B7Z provides error summary tables, calculated matrix values, and information detected
from the bursts themselves, such as burst structure and HT-SIG info. Scroll bars make accessing
the table data easier.

7
All 3 displays show the spectrum of this WLAN signal recorded using signal capture. Digital
persistence (lower left) highlights the signal’s amplitude behavior over a short time period. The
spectrogram (right) provides information on frequency behavior over time. The cumulative history
(upper left) provides statistical analysis details on the signal’s amplitude and frequency behavior
over very long times.
Troubleshoot with insightful tools Powerful display modes include
cumulative history, spectrogram,
and digital persistence. Use signal
capture to capture and record tran-
sient events, or share the signal for
collaborative analysis with remote
colleagues. Additional tools, like
overlap processing, let you effectively
“slow down” the apparent measure-
ment for more in-depth analysis.

8
Software FeaturesOption B7R 802.11a/b/g
OFDM modulation analysis1
Signal acquisition
Supported standards IEEE 802.11a, HiperLAN2, and IEEE 802.11g (OFDM)
Modulation format BPSK, QPSK, 16QAM, 64QAM (auto detect or manual override)
Search length Maximum values. Actual value hardware dependent.
Minimum Result length + 6 symbol times (24 µs)
Maximum 6,800 symbol times
Result length Auto detect or adjustable from 1 to 1367 symbol times maximum; actual value
hardware dependent.
Triggering Single/continuous, free-run/channel/external
Measurement region Length and offset adjustable within result length
Signal playback
Result length Auto detect or adjustable from 1 to 1,367 symbol times maximum; actual value
hardware dependent.
Capture length
(gap-free analysis at 0%
overlap; at 31.25 MHz span)
Capture length is hardware dependent. See hardware specifi cations for more
information.
Adjustable OFDM format parameters
Single button presets IEEE 802.11a/g/OFDM, HiperLAN2, IEEE 802.11g DSSS-OFDM,
IEEE 802.11a/g turbo mode, IEEE 802.11p DSRC, IEEE 802.11j 10 MHz
Data subcarrier modulation format Automatic, or manual: BPSK, QPSK, 16QAM, 64QAM
Guard interval 1/4, 1/8 (HiperLAN2 only), adjustable between 0 and 1 in 1/64 increments
Adjustable OFDM time parameters
Search length Specifi es the length of time to acquire the input signal (in seconds) over which
pulse search is performed
Result length selection Automatic, manual
Measurement offset Determines the start position of the Measurement Interval with respect to fi rst
Symbol-time within the Result Length
Measurement interval Specifi es the time length of Result Length data that is used for computing and
displaying the trace data results
Advanced OFDM parameters
I-Q normalize Turns normalization on or off
Mirror frequency spectrum Allows correct demodulation of frequency spectrums that are mirrored (fl ipped)
about the center frequency
Sub-carrier spacing Continuously adjustable
Symbol timing adjust Adjustable between 0 and guard interval
Subcarrier selection Analyze all, single, or pilots
Synchronization reference Choose short training sequence or channel estimation sequence
Pilot tracking Track any/all of amplitude, phase, timing
Equalizer training Preamble only, preamble & data
1. Not compatible with all supported hardware.
9
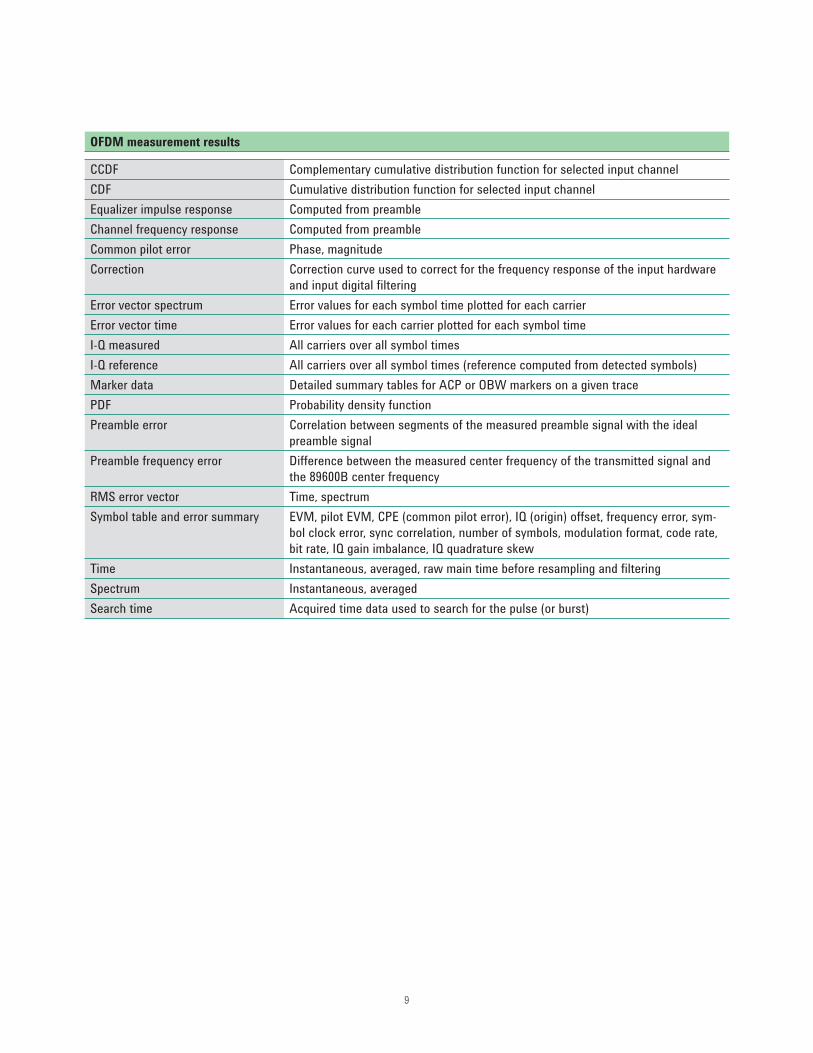
OFDM measurement results
CCDF Complementary cumulative distribution function for selected input channel
CDF Cumulative distribution function for selected input channel
Equalizer impulse response Computed from preamble
Channel frequency response Computed from preamble
Common pilot error Phase, magnitude
Correction Correction curve used to correct for the frequency response of the input hardware
and input digital fi ltering
Error vector spectrum Error values for each symbol time plotted for each carrier
Error vector time Error values for each carrier plotted for each symbol time
I-Q measured All carriers over all symbol times
I-Q reference All carriers over all symbol times (reference computed from detected symbols)
Marker data Detailed summary tables for ACP or OBW markers on a given trace
PDF Probability density function
Preamble error Correlation between segments of the measured preamble signal with the ideal
preamble signal
Preamble frequency error Difference between the measured center frequency of the transmitted signal and
the 89600B center frequency
RMS error vector Time, spectrum
Symbol table and error summary EVM, pilot EVM, CPE (common pilot error), IQ (origin) offset, frequency error, sym-
bol clock error, sync correlation, number of symbols, modulation format, code rate,
bit rate, IQ gain imbalance, IQ quadrature skew
Time Instantaneous, averaged, raw main time before resampling and fi ltering
Spectrum Instantaneous, averaged
Search time Acquired time data used to search for the pulse (or burst)
10
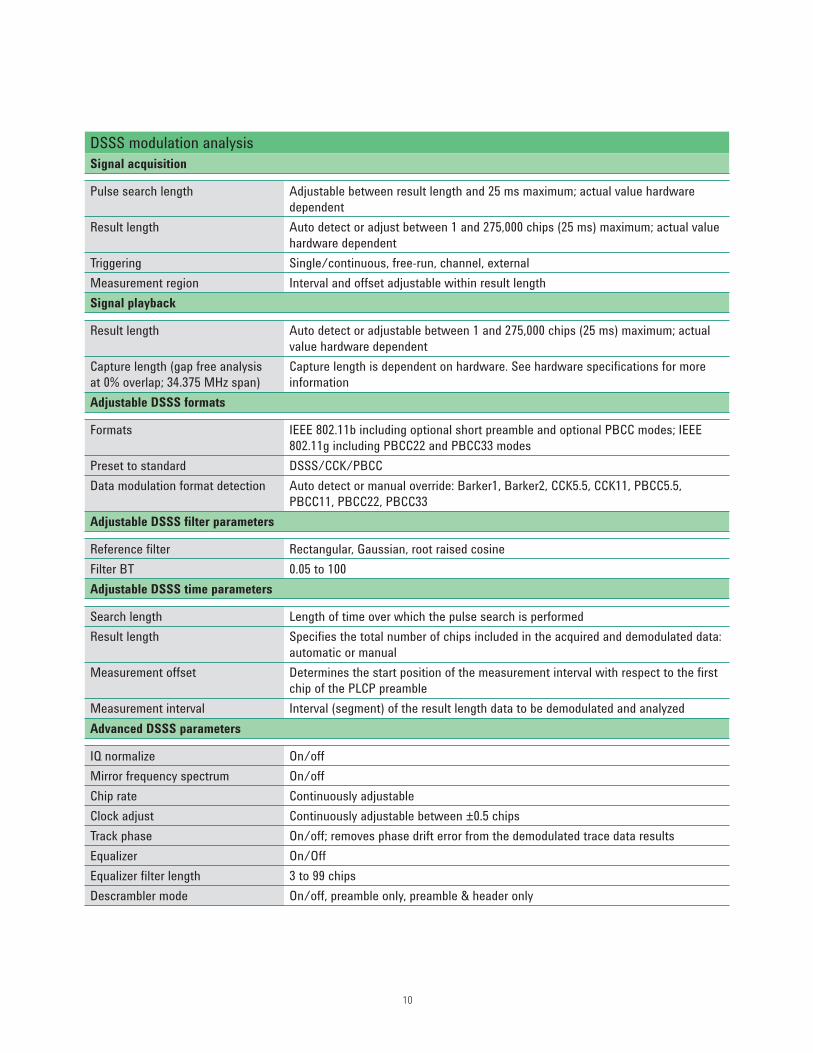
DSSS modulation analysis
Signal acquisition
Pulse search length Adjustable between result length and 25 ms maximum; actual value hardware
dependent
Result length Auto detect or adjust between 1 and 275,000 chips (25 ms) maximum; actual value
hardware dependent
Triggering Single/continuous, free-run, channel, external
Measurement region Interval and offset adjustable within result length
Signal playback
Result length Auto detect or adjustable between 1 and 275,000 chips (25 ms) maximum; actual
value hardware dependent
Capture length (gap free analysis
at 0% overlap; 34.375 MHz span)
Capture length is dependent on hardware. See hardware specifi cations for more
information
Adjustable DSSS formats
Formats IEEE 802.11b including optional short preamble and optional PBCC modes; IEEE
802.11g including PBCC22 and PBCC33 modes
Preset to standard DSSS/CCK/PBCC
Data modulation format detection Auto detect or manual override: Barker1, Barker2, CCK5.5, CCK11, PBCC5.5,
PBCC11, PBCC22, PBCC33
Adjustable DSSS fi lter parameters
Reference fi lter Rectangular, Gaussian, root raised cosine
Filter BT 0.05 to 100
Adjustable DSSS time parameters
Search length Length of time over which the pulse search is performed
Result length Specifi es the total number of chips included in the acquired and demodulated data:
automatic or manual
Measurement offset Determines the start position of the measurement interval with respect to the fi rst
chip of the PLCP preamble
Measurement interval Interval (segment) of the result length data to be demodulated and analyzed
Advanced DSSS parameters
IQ normalize On/off
Mirror frequency spectrum On/off
Chip rate Continuously adjustable
Clock adjust Continuously adjustable between ±0.5 chips
Track phase On/off; removes phase drift error from the demodulated trace data results
Equalizer On/Off
Equalizer fi lter length 3 to 99 chips
Descrambler mode On/off, preamble only, preamble & header only

11
DSSS measurement results
CCDF Complementary cumulative distribution function for selected input channel
CDF Cumulative distribution function for selected input channel
Channel frequency response Frequency response of the channel for which the equalizer is correcting
Correction Correction curve used to correct for the frequency response of the input hardware
and input digital fi ltering
Equalizer impulse response Computed from preamble
Error vector spectrum Error values for each symbol time plotted for each carrier
Error vector time Error values for each carrier plotted for each symbol time
Header symbols 802.11b PLCP Header data bits
Instantaneous error vector spectrum Unaveraged error values for each symbol time plotted for each carrier
Instantaneous IQ measured spectrum Non-averaged IQ measured spectrum trace data
Instantaneous IQ reference spectrum Non-averaged IQ reference spectrum trace data
Instantaneous spectrum Non-averaged spectrum trace data
IQ magnitude error Magnitude error between the I/Q measured and the I/Q reference signals at each
demodulated chip time
IQ measured spectrum Frequency spectrum of the IQ measured time trace data
IQ measured time Demodulated time data results sampled at the chip times
IQ phase error Error between the I/Q measured and the I/Q reference signals at each
demodulated chip time
IQ reference spectrum Frequency spectrum of the IQ reference time trace data
IQ reference time Ideal reference time data generated by the VSA from data acquired from the
measured signal
PDF Probability density function for the selected input channel
Preamble symbols 802.11b PLCP preamble data bits
Raw main time Raw data read from the input hardware or playback fi le
Search time Time-data before pulse search and demodulation
Spectrum Averaged spectrum derived from pre-demodulated time data
Symbol and error table summary IEEE 802.11b 1,000-chip peak EVM, EVM, magnitude error, phase error, IQ offset,
frequency error, sync correlation, burst type, bit rate, number of data octets, data length
Time Time record before digital demodulation and after pulse search
Marker data Detailed summary tables for ACP or OBW markers on a given trace

12
Option B7Z (802.11n modulation analysis) and Option BHJ (802.11ac modulation analysis)
Signal acquisition Note that not all supported hardware is compatible with all bandwidths and channel
confi gurations
Standards supported Option B7Z: IEEE P802.11n HT (20 MHz, 40 MHz)
Option BHJ (requires Option B7Z): 802.11ac (20 Mhz, 40 Mhz, 80 Mhz, 160 Mhz)
Operating modes supported HT-greenfi eld, HT-mixed, Non-HT duplicate, HT duplicate, VHT (only Option BHJ)
Data sub-carrier modulation
formats supported
BPSK, QPSK, 16QAM, 64QAM, 256QAM
Adjustable format parameters
Standard presets 802.11n HT (20 MHz, 40 MHz)/802.11ac (20 MHz, 40 MHz, 80 MHz, 160 MHz in both
contiguous and non-contiguous bands)
Data sub-carrier modulation
detect
Auto-detect, manual override, or read from HT-SIG (Option B7Z)
VHT-SIG (Option BHJ)
Spatial streams supported 1-4, equivalent to the number of channels being analyzed
Spatial streams detect Auto-detect, manual override, or read from HT-SIG
Guard interval 1/8; 1/4; user-settable or detected from HT-SIG
Guard interval detect Auto-detect, manual override, or read from HT-SIG
Channel usage Channel 1 through 4 individually; 2x2; 3x3; 4x4 MIMO
Adjustable time parameters
Search length Adjustable; default 1 ms; minimum must be longer than maximum result length
Result length Number of OFDM data symbols after the preamble to analyze. May be
auto-detected, manually specifi ed, or read from the HT-SIG. Max is 20,000 symbols
Measurement interval Adjustable; must be less than or equal to the maximum result length
Measurement offset Adjustable; specifi es the portion of the result length to analyze and display
Advanced parameters
Compensate IQ mismatch Allows removal of IQ mismatch from EVM calculation so as to better understand EVM
performance for systems where the IQ mismatch may be removed later
IQ normalize On/off; determines whether to normalize IQ meas, IQ ref, error vector time, and error
vector spectrum displays
Mirror frequency spectrum On/off; determines whether to do a frequency inversion before synchronizing and
demodulating signal
Remove equalizer phase ramp Allows visibility of the phase profi le of other channels and data streams that may be
masked by the cyclic delay that is normally applied to the other data streams
Subcarrier spacing Specifi es spacing between OFDM subcarriers, in Hz
Symbol time adjust Allows user-adjust of the symbol timing used when demodulating
Subcarrier select Specifi es which OFDM carriers are analyzed; user can select all, pilots only, or choose
a single subcarrier
Pilot tracking Phase, amplitude, timing
Tracking mode Pre-equalizer, post-equalizer
Equalizer training Train on channel estimation sequence, or channel estimation sequence plus data
FFT length 64/128 (Option B7Z), 64/128/256/512 (Option BHJ)

13
Measurement results
Channel results The following results are available for each input channel
CCDF Complementary cumulative distribution function of the time trace
CDF Cumulative distribution function of the time trace
Correction Shows frequency domain correction applied to the raw measured time data to ensure
that the input hardware has a fl at frequency response
Instantaneous spectrum Frequency spectrum of the current time trace, with no averaging
PDF Probability density function of the time trace
Raw main time Block data acquired by the hardware, before any software time-domain corrections or
any software re-zooming or re-sampling
Search time Shows block of data that was acquired and searched through for an RF burst
Spectrum Frequency spectrum of the time trace, including averaging, if any
Time Block of data detected by pulse search; serves as input to demodulation analysis
Stream results These results are available for each spatial stream
Common pilot error Shows the common pilot error (phase and magnitude), with one point per OFDM symbol
Error vector spectrum Shows the error vector by subcarrier for every OFDM symbol time analyzed
Error vector time Shows the error vector by OFDM symbol time for every subcarrier
IQ measured IQ measured data, with one point per subcarrier per analyzed OFDM symbol time;
includes multiple modulation formats if present
IQ reference IQ reference data, with one point per subcarrier per analyzed OFDM symbol time;
includes multiple modulation formats if present
RMS error vector spectrum RMS averaged error vector, shown with one point per subcarrier, calculated for current
scan only
RMS error vector time RMS averaged error vector, shown with one point per OFDM symbol analyzed
Symbols/Errs Table Shows raw OFDM detected symbols plus error measurements
Stream EVM dB, or %rms
Stream EVM Pk dB, or %rms
Stream Pilot EVM dB
CPE %rms
Stream Data EVM dB
Stream results per channel For each stream, the following traces are available for each channel
Equalizer channel frequency
response
Reciprocal of the equalizer response; one point per subcarrier
Equalizer impulse response Result length = 4 x FFT length
Instantaneous equalizer channel Non-averaged version of the equalizer channel frequency response trace frequency
response

14
Cross channel measurement results The following cross-channel measurements are available
OFDM error summary table Each input channel (1-4) has a column containing the following measurement
results, plus an additional column with averaged data
Frequency error Average, Hz
Symbol clock error Average, ppm
CPE Average, % rms
EVM RMS level of the error vector, averaged overall subcarriers and all analyzed
OFDM symbols; in dB
EVM peak Peak EVM, averaged over all subcarriers and all analyzed OFDM symbols; in dB
Pilot EVM RMS level of the error vector computed just at the pilot subcarriers, averaged
over all OFDM symbols; in dB
Data EVM RMS EVM of just the data subcarriers, averaged overall OFDM symbols; in dB
IQ offset Carrier leakage, as measured during the HT-LTF portion of the preamble;
in unitless power ratio
IQ quadrature error Quadrature skew, in degrees
IQ gain imbalance Ratio of the gain of the in-phase portion of the signal to the gain of the
quadrature phase portion of the signal; in dB
IQ time skew Time difference between the I and Q branches of the signal
Cross power Average of the power level of the err1 terms (leakage of stream 1 into
transmitter 2) , and of the err2 terms (leakage of stream 2 into transmitter 1),
for all subcarriers
Sync correlation 802.11n Multi Mode: L-LTF symbols
802.11n GF: HT-LTF1 symbols (2 symbols)
802.11ac: L-LTF symbols
OFDM data burst info Listing of data burst type and fi elds found in the L-SIG and HT-SIG symbols
(OptionB7Z)
L-SIG, VHG-SIG (Option BHJ)
Symbols detected L-LTF, HT-GF-STF, L-SIG, HT-SIG, HT-STF, HT-LTF, HT-Data, HT-SIG CRC pass/fail
(Option B7Z)
VHT-STF, VHT-LTF, VHT, LSIG, L-STF, L-LTF VHT-SIG A/B (Option BHJ)
Data provided Modulation format, length (in symbols), power (dBm), EVM (dB);
total information for length, power, EVM, format detected, HT-SIG, L-SIG,
VHT-SIG (Option BHJ only)
15
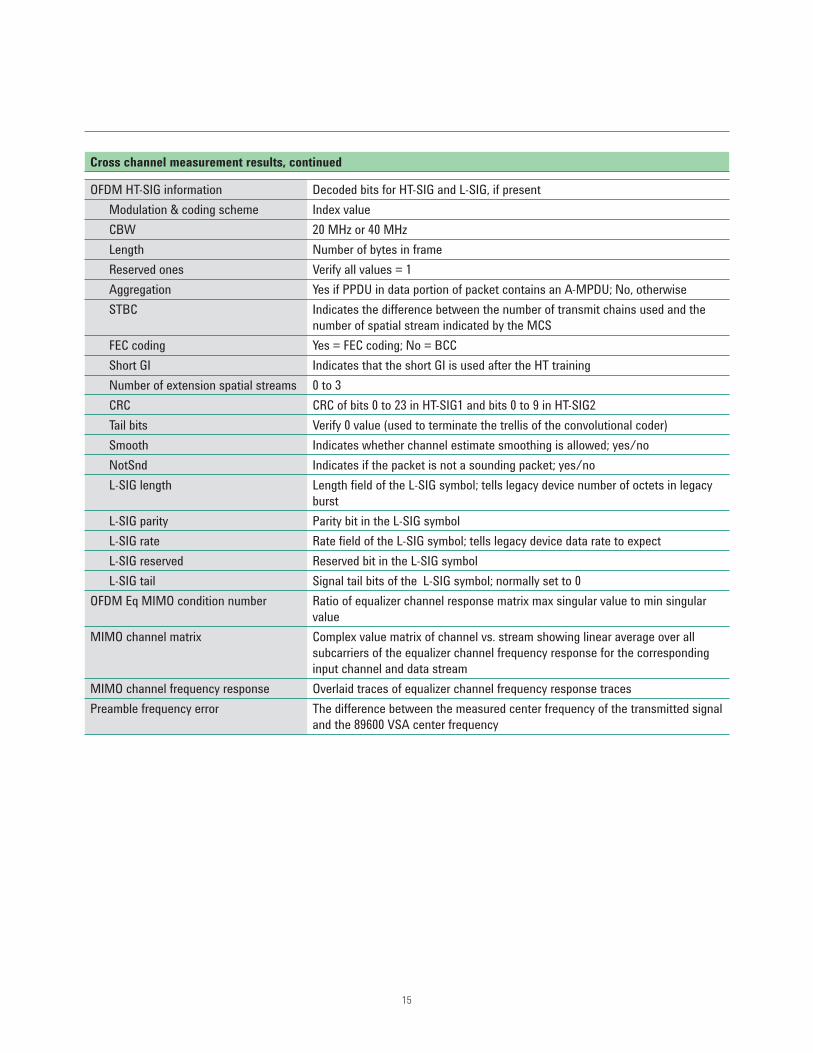
Cross channel measurement results, continued
OFDM HT-SIG information Decoded bits for HT-SIG and L-SIG, if present
Modulation & coding scheme Index value
CBW 20 MHz or 40 MHz
Length Number of bytes in frame
Reserved ones Verify all values = 1
Aggregation Yes if PPDU in data portion of packet contains an A-MPDU; No, otherwise
STBC Indicates the difference between the number of transmit chains used and the
number of spatial stream indicated by the MCS
FEC coding Yes = FEC coding; No = BCC
Short GI Indicates that the short GI is used after the HT training
Number of extension spatial streams 0 to 3
CRC CRC of bits 0 to 23 in HT-SIG1 and bits 0 to 9 in HT-SIG2
Tail bits Verify 0 value (used to terminate the trellis of the convolutional coder)
Smooth Indicates whether channel estimate smoothing is allowed; yes/no
NotSnd Indicates if the packet is not a sounding packet; yes/no
L-SIG length Length fi eld of the L-SIG symbol; tells legacy device number of octets in legacy
burst
L-SIG parity Parity bit in the L-SIG symbol
L-SIG rate Rate fi eld of the L-SIG symbol; tells legacy device data rate to expect
L-SIG reserved Reserved bit in the L-SIG symbol
L-SIG tail Signal tail bits of the L-SIG symbol; normally set to 0
OFDM Eq MIMO condition number Ratio of equalizer channel response matrix max singular value to min singular
value
MIMO channel matrix Complex value matrix of channel vs. stream showing linear average over all
subcarriers of the equalizer channel frequency response for the corresponding
input channel and data stream
MIMO channel frequency response Overlaid traces of equalizer channel frequency response traces
Preamble frequency error The difference between the measured center frequency of the transmitted signal
and the 89600 VSA center frequency

16
This technical overview provides nominal performance specifi cations for the software when making measurements
with the specifi ed platform. Nominal values indicate expected performance, or describe product performance that is
useful in the application of the product, but is not covered by the product warranty.
For a complete list of specifi cations, refer to the measurement platform literature.
Key Specifi cations1
1. Data subject to change
PXA MXA includes Option BBA as noted
EXA with Option B25
IEEE 802.11a/g OFDM
Signal playback
Result length Auto detect or adjustable from 1 to 1367 symbol times
Capture length Gap free analysis at 0%
31.25 MHz span (Option B40) 25 MHz span (Option B25) 25 MHz span
6.7 sec 44 msec
With Option BBA and Option
B25 or S40 (BBIQ only);
6.7 sec IEEE 802.11a/g OFDM,
13.4 sec IEEE 11p DSRC
Accuracy 20 averages, input range ≥ –30 dBm and within 2 dB of full scale,
input range ≥ –20 dBm for freq > 3.6 GHz
Center frequency 2.4 GHz, 5.8 GHz
Residual EVM
Equalizer training =
chan. est. seq. and data
≤ –47 dB ≤ –45 dB ≤ –46 dB
≤ –46 dB (Option B25)
≤ –44 dB (Option BBA)
Equalizer training =
chan. est. seq.
≤ –45 dB ≤ –43 dB ≤ –44 dB
≤ –44 dB (Option B25)
≤ –41 dB (Option BBA)
Frequency error
Carrier spacing 312 kHz
1.4 MHz max, user settable
Lock range ±624 kHz
±2 x sub-carrier spacing
Frequency accuracy ±8 Hz
Option B7R 802.11a/b/gX-Series signal analyzers

17
1. Results also apply to MXA with Option BBA.
PXA MXA includes Option BBA as noted
EXA with Option B25
IEEE 802.11b/g DSSS
Signal playback
Result length Auto detect or adjustable
from 1 to 269,000 chips
(24.4 ms)
Auto detect or adjustable from 1 to 370741 chips (33.7037 ms)
Capture length Gap free analysis at 0%
34.375 MHz span (Option B40) 25 MHz span (Option B25)
6.1 sec 44 msec
Accuracy Total power within 2 dB of full scale
Center frequency 2.4 GHz
Residual EVM ≤ 1.0% ≤ 1.5% 1
≤ 0.5% with equalizer
enabled; all modulation
formats, 10 averages,
reference fi lter = transmits
fi lter = Gaussian with
BT = 0.5
≤ 0.5% 1 with equalizer enabled; reference fi lter = transmit
fi lter = Gaussian with BT = 0.5
Frequency error Relative to frequency standard
Lock range ±2.5 MHz
Frequency accuracy ±8 Hz 1

18
1. Data subject to change
80000, 90000 Series
Models For a complete listing of supported models, see Infi niium Oscilloscopes with 89600B VSA
Software, literature part number 5990-6819EN.
Measurement inputs 1, 2, 3, or 4 channel
Signal playback
Result length Auto-detect or manually adjustable
Capture length Depends on model, memory option, and sampling mode. Infi niium Oscilloscopes with 89600B
VSA Software, literature part number 5990-6819EN.
Accuracy Input range within 2 dB of full scale on all input channels. RMS averaging with average
count = 20. At least 16 data symbols analyzed in each burst. Analyzer span set to default.
Signal BW
20 MHz
(31.25 MHz span)
40 MHz
(62.5 MHz span)
Equalizer training =
chan. est. seq. only
2.4 GHz center frequency
(User rate mode = 10 GHz)
–41 dB –40 dB
5.8 GHz center frequency
(User rate mode = 20 GHz)
–38 dB –37 dB
Equalizer training =
chan. est. seq. and data
2.4 GHz center frequency
(User rate mode = 10 GHz)
–43 dB –42 dB
5.8 GHz center frequency
(User rate mode = 20 GHz)
–41 dB –40 dB
Frequency lock range ±2 x Subcarrier Spacing = ±625 kHz at default subcarrier spacing
Frequency accuracy ±1 kHz
Keep your 89600B VSA up-to-date
With rapidly evolving standards and continu-ous advancements in signal analysis, the 89601BU/BNU software update and sub-scription service offers you the advantage of immediate access to the latest features and enhancements available for the 89600B VSA software.
www.agilent.com/find/89600B_upgradeswww.agilent.com/find/89600B
You can upgrade!
All 89600B options can be added after your initial purchase and are license-key enabled. For more information please refer to
UPGRADE
Option B7Z 802.11n, Option BHJ 802.11acInfi niium oscilloscopes

www.agilent.comAdditional Resources
Literature
89600B Vector Signal Analysis
Software, Brochure,
literature number 5990-6553EN
89600B Vector Signal Analysis
Software, Confi guration Guide,
literature number 5990-6386EN
89600B Opt 200 Basic VSA and
Opt 300 Hardware Connectivity,
Technical Overview, literature
number 5990-6405EN
Agilent 89600 VSA Software Option
B7Z: IEEE 802.11n MIMO Modulation
Analysis, Demo Guide, literature
number 5989-7267EN
Equalization Techniques and OFDM
Troubleshooting for Wireless LANs
(AN 1455), Application Note,
literature number 5988-9440EN
RF Testing of Wireless LAN Products
(AN 1380-1), Application Note,
literature number 5988-3762EN
IEEE 802.11 Wireless LAN PHY Layer
(RF) Operation and Measurement
(AN 1380-2), Application Note,
literature number 5988-5411EN
Making 802.11G Transmitter Measure-
ments (AN 1380-4), Application Note,
literature number 5988-7813EN
Webwww.agilent.com/fi nd/89600B
www.agilent.com/fi nd/WLAN
www.agilent.com/fi nd/MIMO
Microsoft is a U.S. registered trademark of
Microsoft Corporation.
For more information on Agilent Technolo-gies’ products, applications or services, please contact your local Agilent office.
The complete list is available at:
www.agilent.com/find/contactus
AmericasCanada (877) 894 4414 Brazil (11) 4197 3500Mexico 01800 5064 800 United States (800) 829 4444
Asia PacificAustralia 1 800 629 485China 800 810 0189Hong Kong 800 938 693India 1 800 112 929Japan 0120 (421) 345Korea 080 769 0800Malaysia 1 800 888 848Singapore 1 800 375 8100Taiwan 0800 047 866Other AP Countries (65) 375 8100
Europe & Middle EastBelgium 32 (0) 2 404 93 40 Denmark 45 70 13 15 15Finland 358 (0) 10 855 2100France 0825 010 700* *0.125 €/minute
Germany 49 (0) 7031 464 6333 Ireland 1890 924 204Israel 972-3-9288-504/544Italy 39 02 92 60 8484Netherlands 31 (0) 20 547 2111Spain 34 (91) 631 3300Sweden 0200-88 22 55United Kingdom 44 (0) 131 452 0200
For other unlisted Countries: www.agilent.com/find/contactusRevised: June 8, 2011
Product specifications and descriptions in this document subject to change without notice.
© Agilent Technologies, Inc. 2011Published in USA, July 1, 20115990-6389EN
Agilent Advantage Services is committed
to your success throughout your equip-
ment’s lifetime. To keep you competitve,
we continually invest in tools and
processes that speed up calibration and
repair and reduce your cost of ownership.
You can also use Infoline Web Services
to manage equipment and services more
effectively. By sharing our measurement
and service expertise, we help you create
the products that change our world.
www.agilent.com/quality
www.agilent.com/find/advantageservices
Agilent Email Updates
www.agilent.com/find/emailupdates
Get the latest information on the
products and applications you select.
www.lxistandard.org
LAN eXtensions for Instruments puts
the power of Ethernet and the Web
inside your test systems. Agilent is a
founding member of the LXI consortium.
Agilent Channel Partners
www.agilent.com/find/channelpartners
Get the best of both worlds: Agilent’s
measurement expertise and product
breadth, combined with channel
partner convenience.