Kesko’s Strong Transformation Continues
34
Kesko’s Strong Transformation Continues Investor Presentation May 2018 | CFO Jukka Erlund
Transcript of Kesko’s Strong Transformation Continues
Kesko’s Strong Transformation Continues
Investor Presentation May 2018 | CFO Jukka Erlund
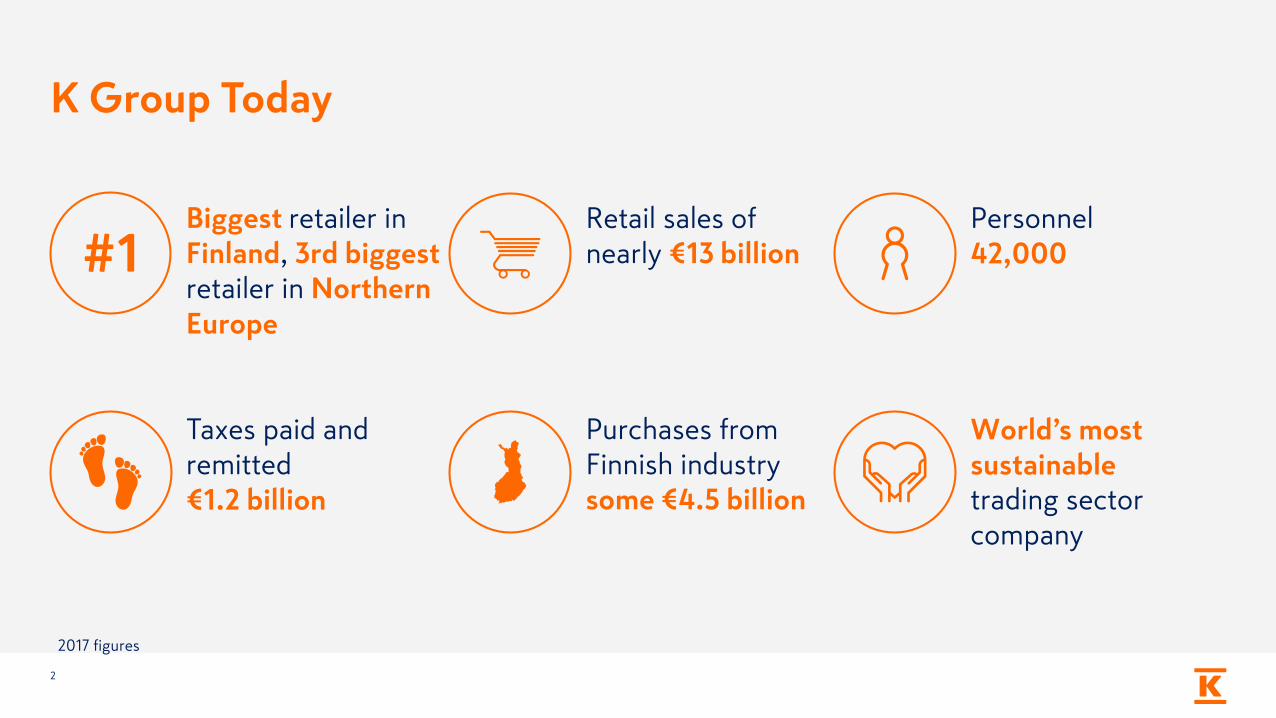
K Group Today
2
#1Biggest retailer in Finland, 3rd biggest retailer in Northern Europe
Retail sales ofnearly €13 billion
World’s most sustainabletrading sector company
Purchases from Finnish industry some €4.5 billion
Personnel 42,000
Taxes paid and remitted €1.2 billion
2017 figures

Growth Opportunities Supported by Megatrends
3
Globalisation – international operators challenge local companies
Digitalisation
Urbanisation, single-person households, ageing population
Increased consumer knowledge and power
Sustainability and strong brands
Climate change

Strategic Transformation Sets Foundation for Growth
4
Transforming K
Strategic focus areas
Tighterfocus
Profitablegrowth
Quality and customer orientation
Best digital services
One unified K
Grocery trade
51%*
• Most customer-oriented and inspiring food stores
• Most extensive and comprehensive food store network in Finland
• Best digital solutions and online store in the trading sector
• Developing retailer entrepreneurship
• Growing Kespro's business
Car trade9%*
• Growing the business in collaboration with Volkswagen Group
• Expanding the service business independent of principals
• Developing a multichannel customer experience
Cornerstones of our strategy for divisions
Building and technical trade40%*
• Profitable growth in selected countries and customer segments
• New customer-focused organisation
• Best digital services for B2B and B2C customers
• Utilising synergy potential
Value
The customer and quality – in everything we do
Vision
We are the customers' preferred choice and the quality leader in the European trading sector
Mission
We create welfare responsibly for all our stakeholders and for the whole society
*) Share of net sales rolling 12 months, Q1/18

Growth Strategy Implementation is Progressing towards More Focused Business Portfolio
5
The core of Kesko's strategy is profitable growth in three strategic areas: the grocery trade, the building and technical trade, and the car trade. The implementation of the growth strategy has proceeded robustly thanks to significant acquisitions and divestments.
Investments in core business operations €1.3 bn, divestments €1.0 bn
03/2015Divestment of Anttila
11/2016Divestmentof Russian grocery trade
06/2017Divestment of K-maatalous
1/2018Divestment of Russian building and home improvement trade
04/2016Acquisition of Suomen Lähikauppa
06/2016Acquisition of Onninen
12/2016Acquisition of AutoCarrera
06/2017Divestment of Asko and Sotka furniture trade
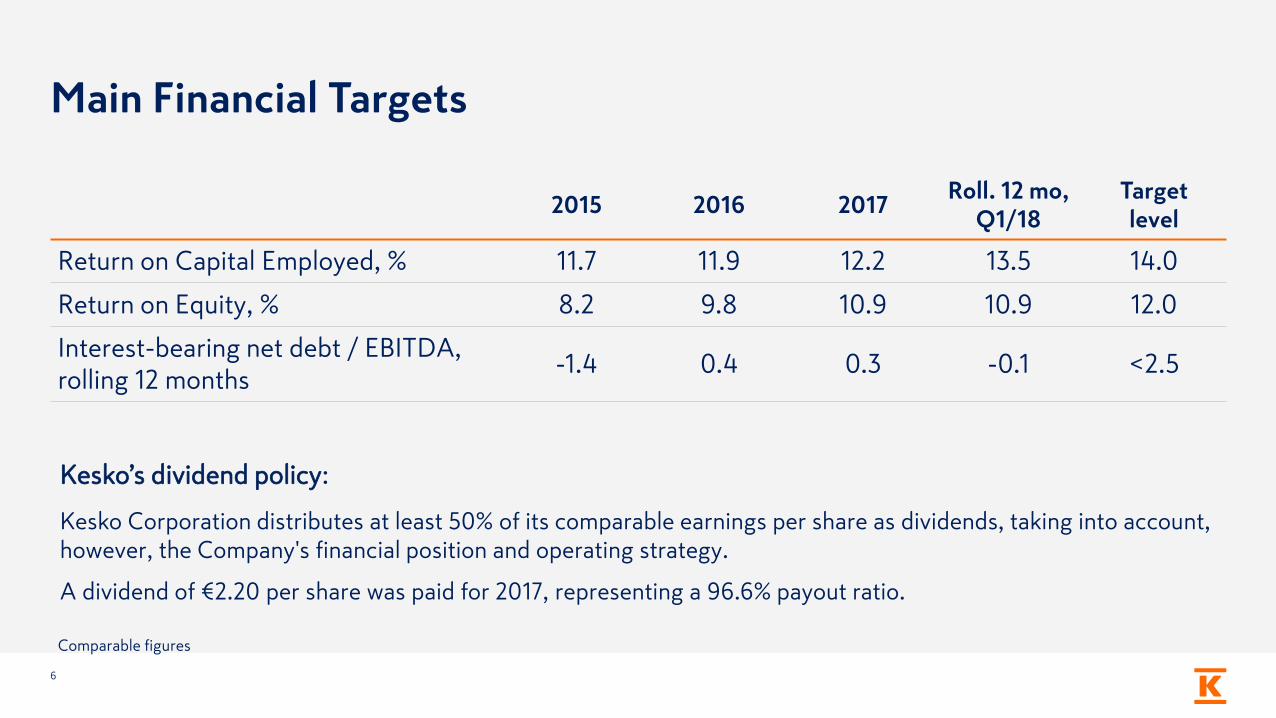
Main Financial Targets
6
2015 2016 2017Roll. 12 mo,
Q1/18 Target level
Return on Capital Employed, % 11.7 11.9 12.2 13.5 14.0
Return on Equity, % 8.2 9.8 10.9 10.9 12.0
Interest-bearing net debt / EBITDA, rolling 12 months
-1.4 0.4 0.3 -0.1 <2.5
Comparable figures
Kesko’s dividend policy:
Kesko Corporation distributes at least 50% of its comparable earnings per share as dividends, taking into account, however, the Company's financial position and operating strategy.
A dividend of €2.20 per share was paid for 2017, representing a 96.6% payout ratio.
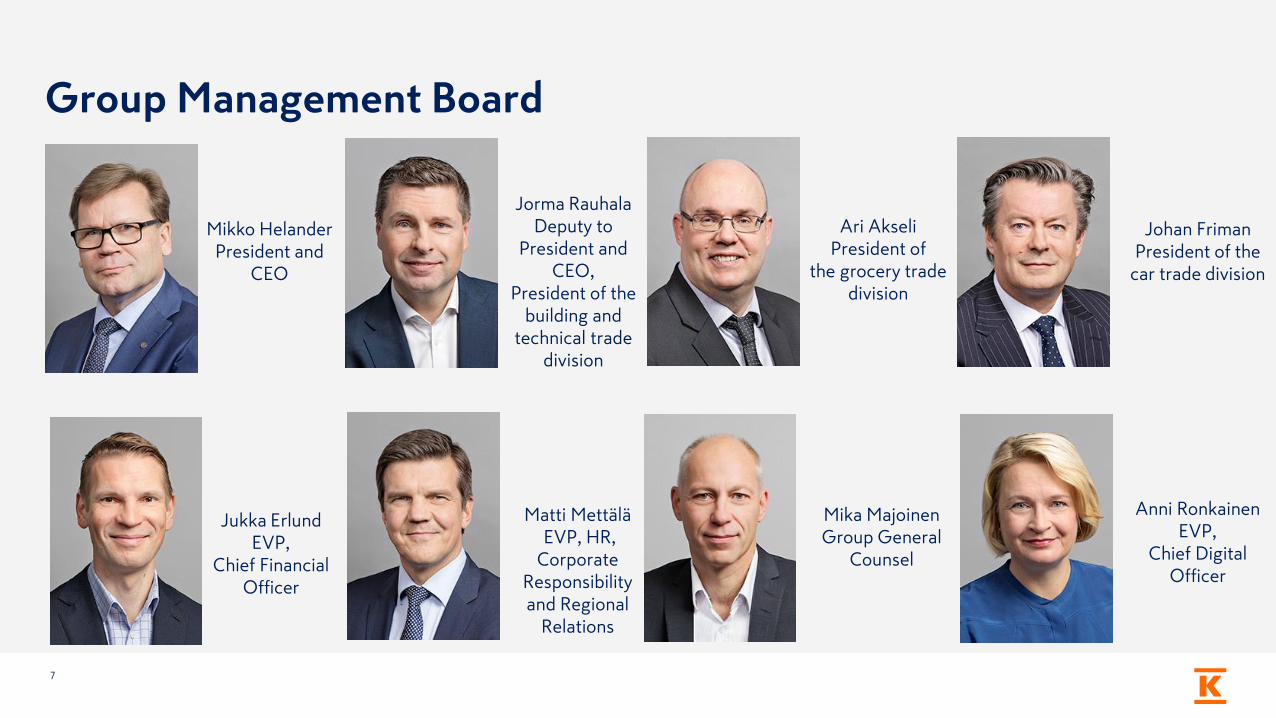
Group Management Board
7
Mikko HelanderPresident and
CEO
Jukka ErlundEVP,
Chief Financial Officer
Johan FrimanPresident of the
car trade division
Ari AkseliPresident of
the grocery trade division
Matti MettäläEVP, HR,
Corporate Responsibility and Regional
Relations
Jorma RauhalaDeputy to
President and CEO,
President of the building and
technical trade division
Anni RonkainenEVP,
Chief Digital Officer
Mika MajoinenGroup General
Counsel

Highlights Q1/2018
Net sales +3.4%, operating profit +27%
and return on capital employed 13.5%
Excellent quarter for the grocery trade
Building and technical trade performed as
planned, operations in Russia divested
Continued strong performance in the car trade
8
Comparable figures, continuing operations
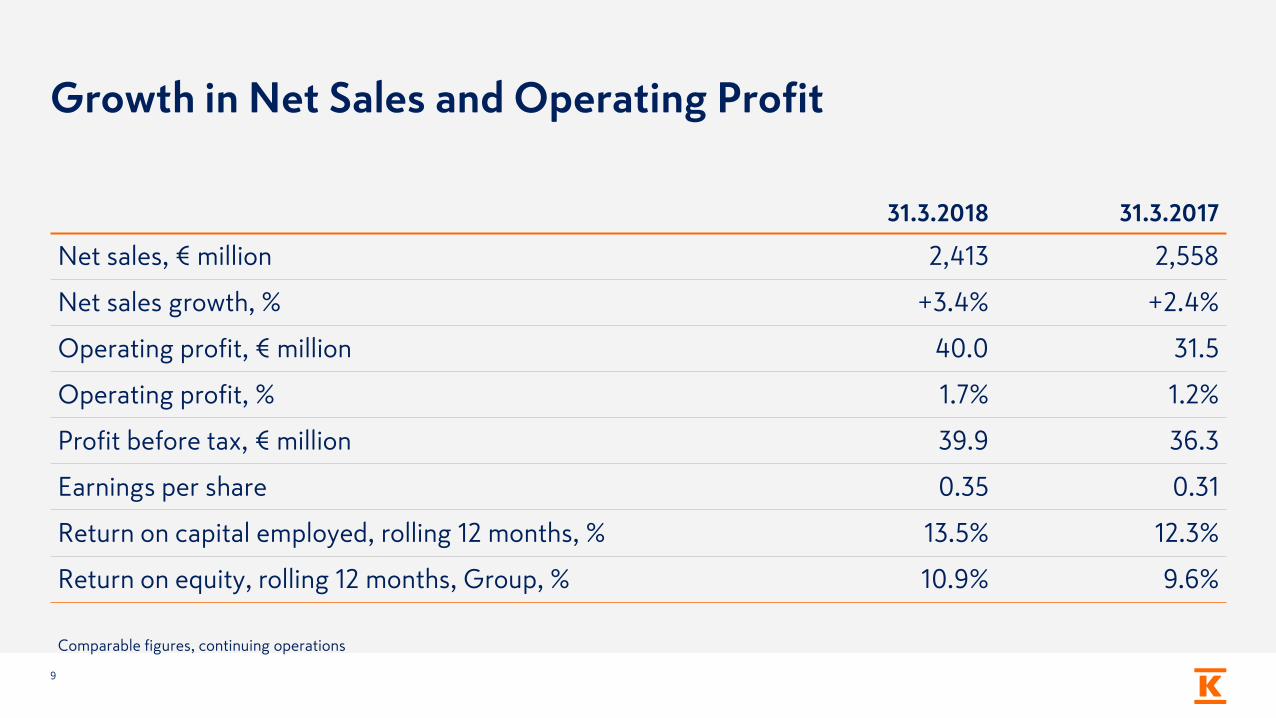
Growth in Net Sales and Operating Profit
9
31.3.2018 31.3.2017
Net sales, € million 2,413 2,558
Net sales growth, % +3.4% +2.4%
Operating profit, € million 40.0 31.5
Operating profit, % 1.7% 1.2%
Profit before tax, € million 39.9 36.3
Earnings per share 0.35 0.31
Return on capital employed, rolling 12 months, % 13.5% 12.3%
Return on equity, rolling 12 months, Group, % 10.9% 9.6%
Comparable figures, continuing operations

Net Sales Q1 comparable growth 3.4%
2,5582,763
2,596 2,5752,413
0
500
1000
1500
2000
2500
3000
3500
4000
Q1/17 Q2/17 Q3/17 Q4/17 Q1/18
10
10,492 10,347
0
2000
4000
6000
8000
10000
12000
2017 Q1/2018
€m €m
Comparable figures, continuing operations
Rolling 12 months
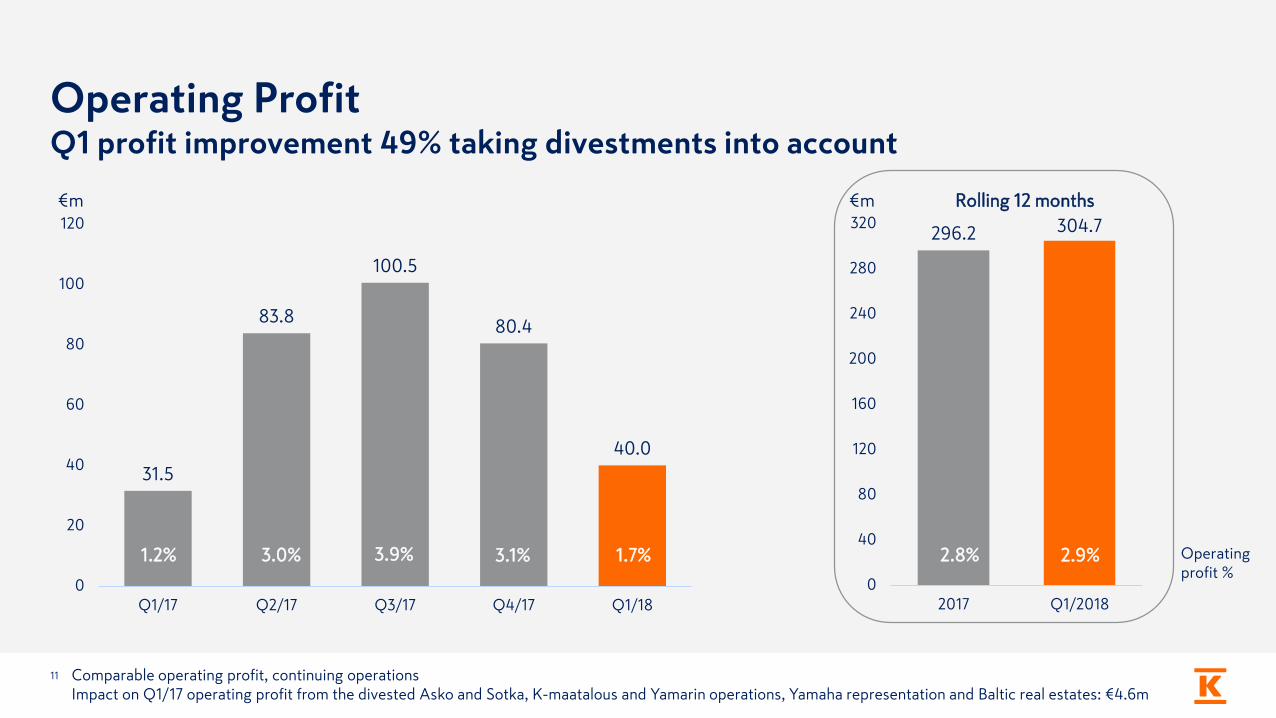
Operating ProfitQ1 profit improvement 49% taking divestments into account
31.5
83.8
100.5
80.4
40.0
0
20
40
60
80
100
120
Q1/17 Q2/17 Q3/17 Q4/17 Q1/18
11
296.2 304.7
0
40
80
120
160
200
240
280
320
2017 Q1/2018
Operating profit %
1.2% 3.0% 3.1% 1.7%3.9% 2.8% 2.9%
€m €m
Comparable operating profit, continuing operationsImpact on Q1/17 operating profit from the divested Asko and Sotka, K-maatalous and Yamarin operations, Yamaha representation and Baltic real estates: €4.6m
Rolling 12 months

Return on Capital Employed 13.5%Comparable, rolling 12 months
20.7
11.5
23.3
12.3
25.9
9.6
21.3
13.5
0
10
20
30
Grocery trade Building and technical trade Car trade Group, continuing operations
Q1/2017 Q1/2018
12
%

Financial Position Strengthened Further
13
31.3.2018 31.3.2017
Group:
Equity ratio, % 49.3 47.4
Liquid assets, € million 599 365
Interest-bearing net debt, € million -59 226
Interest-bearing net debt / EBITDA, rolling 12 months -0.1 0.8
Continuing operations:
Cash flow from operating activities, Q1, € million 39 -48
Capital expenditure, gross, Q1, € million 55 76
Comparable figures
Grocery Trade
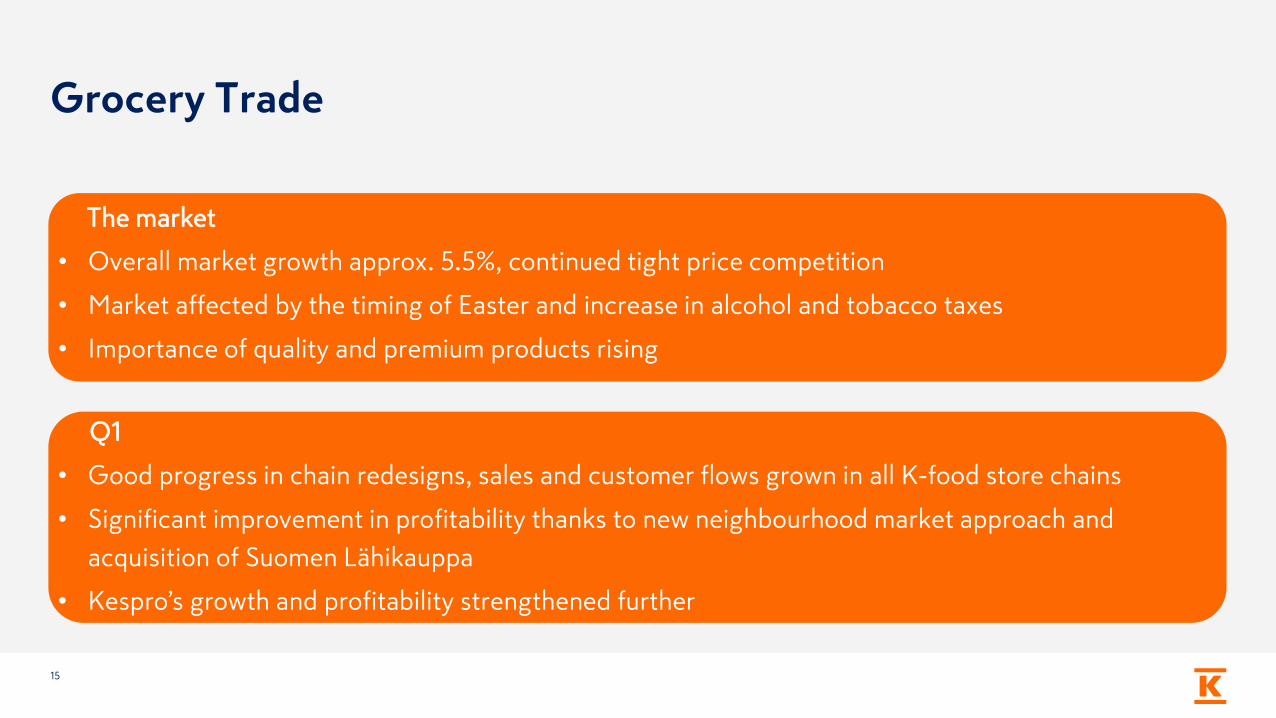
Grocery Trade
Q1
• Good progress in chain redesigns, sales and customer flows grown in all K-food store chains
• Significant improvement in profitability thanks to new neighbourhood market approach and
acquisition of Suomen Lähikauppa
• Kespro’s growth and profitability strengthened further
15
The market
• Overall market growth approx. 5.5%, continued tight price competition
• Market affected by the timing of Easter and increase in alcohol and tobacco taxes
• Importance of quality and premium products rising
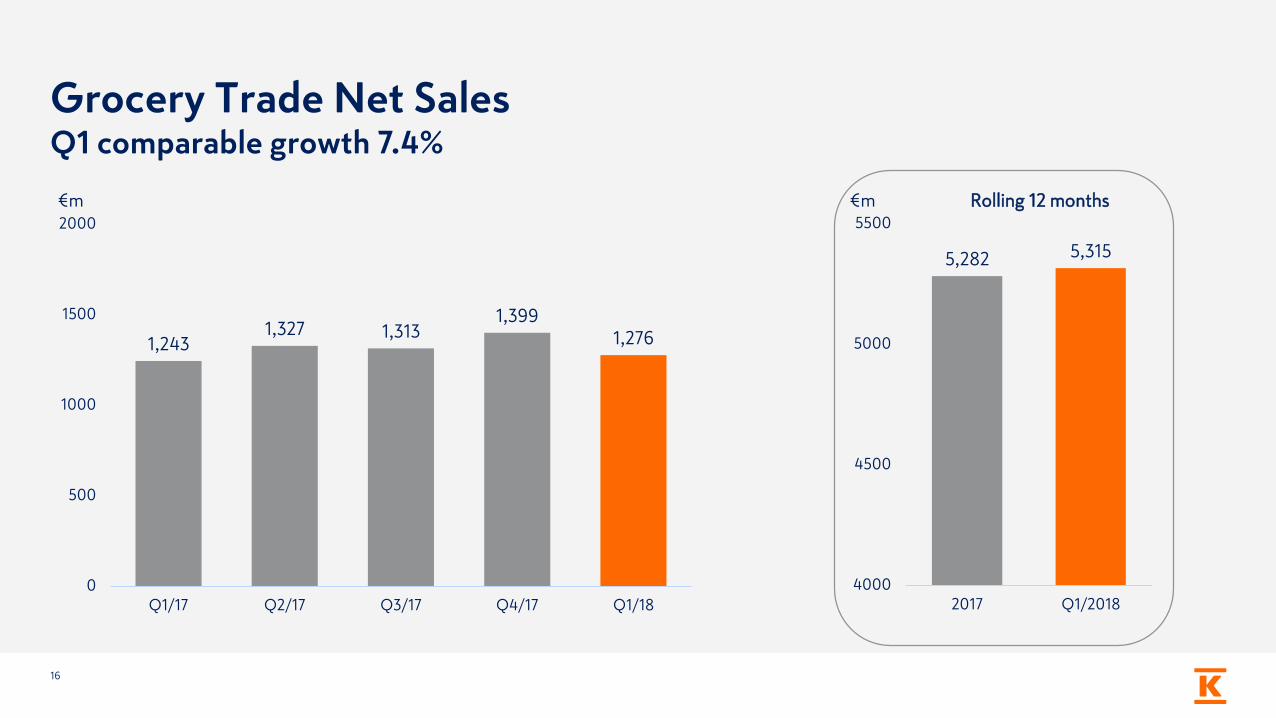
Grocery Trade Net SalesQ1 comparable growth 7.4%
1,2431,327 1,313
1,3991,276
0
500
1000
1500
2000
Q1/17 Q2/17 Q3/17 Q4/17 Q1/18
16
5,282 5,315
4000
4500
5000
5500
2017 Q1/2018
€m €m Rolling 12 months
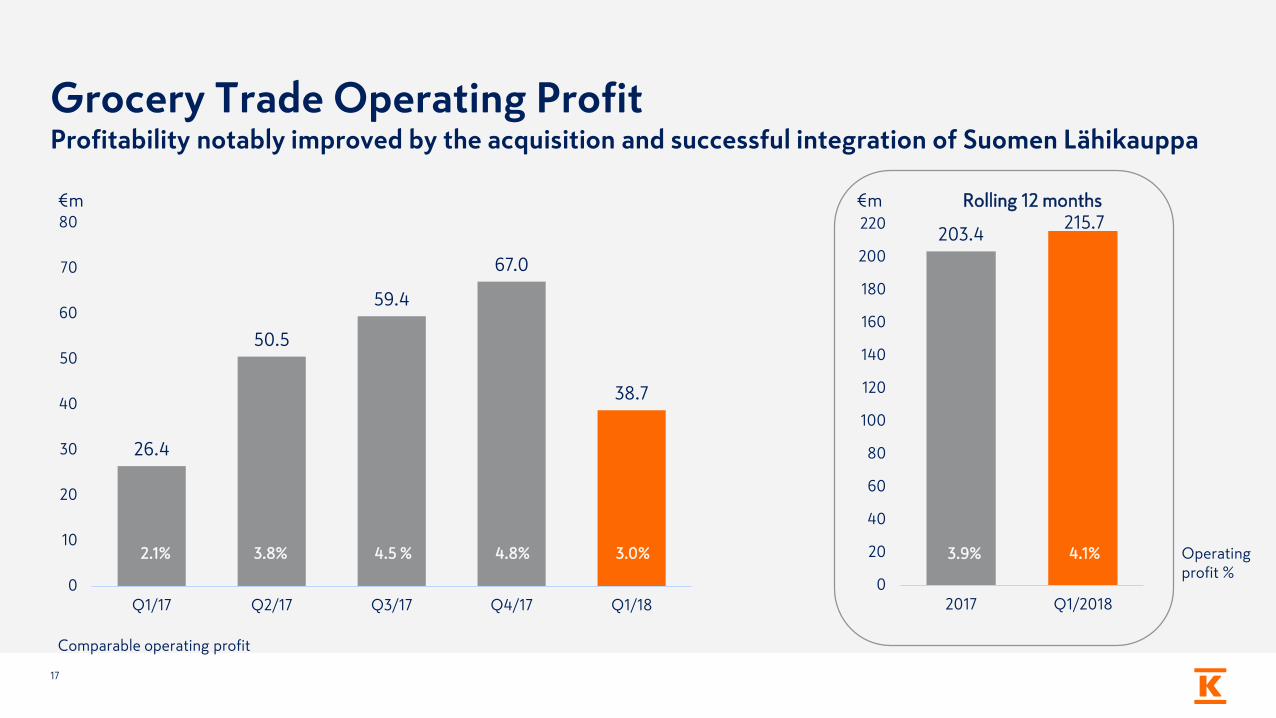
Grocery Trade Operating ProfitProfitability notably improved by the acquisition and successful integration of Suomen Lähikauppa
26.4
50.5
59.4
67.0
38.7
0
10
20
30
40
50
60
70
80
Q1/17 Q2/17 Q3/17 Q4/17 Q1/18
17
203.4215.7
0
20
40
60
80
100
120
140
160
180
200
220
2017 Q1/2018
Operating profit %
2.1% 3.8% 4.5 % 4.8% 3.9% 4.1% 3.0%
€m €m
Comparable operating profit
Rolling 12 months
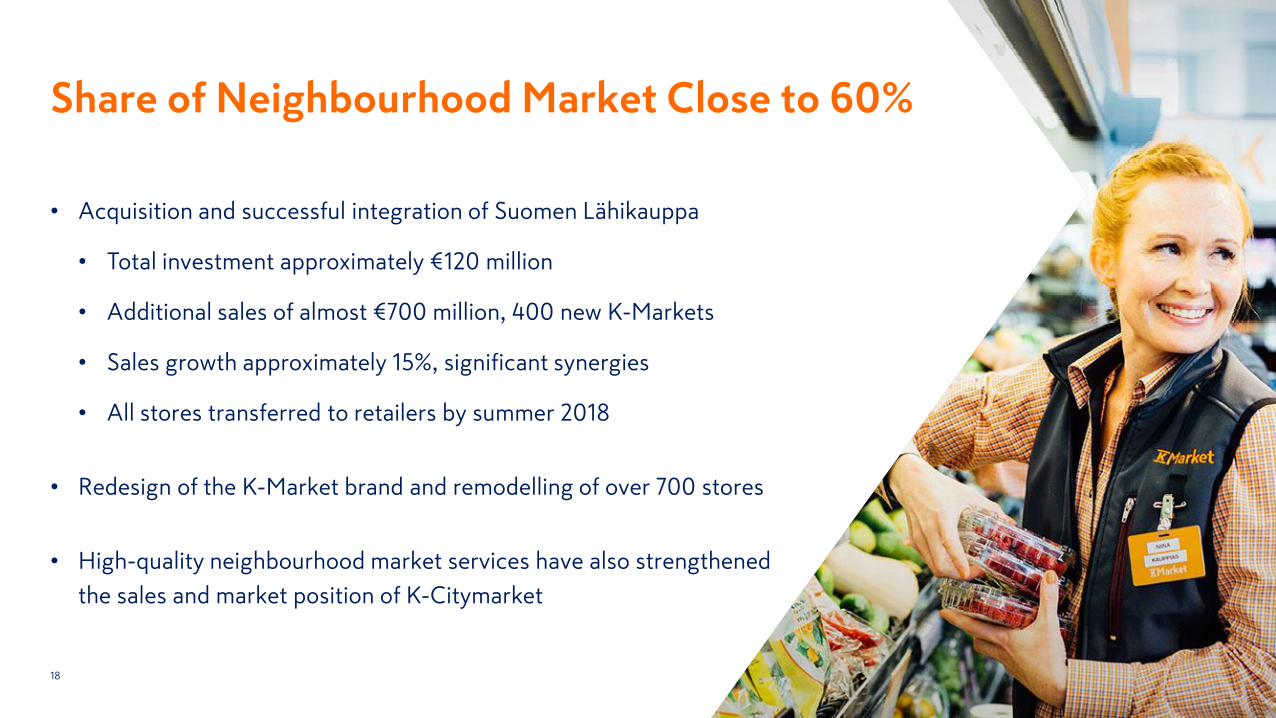
Share of Neighbourhood Market Close to 60%
18
• Acquisition and successful integration of Suomen Lähikauppa
• Total investment approximately €120 million
• Additional sales of almost €700 million, 400 new K-Markets
• Sales growth approximately 15%, significant synergies
• All stores transferred to retailers by summer 2018
• Redesign of the K-Market brand and remodelling of over 700 stores
• High-quality neighbourhood market services have also strengthened
the sales and market position of K-Citymarket

Strong Investment in New Online Food Store
19
• Online food sales growing forcefully
• New online food store service successfully piloted in two K-Citymarkets in the greater
Helsinki region
• Offering K-Citymarkets’ extensive selections
• Efficient deliveries using concentrated K Transport
• Service expanded to Tampere, Turku, Oulu and Kerava
during the spring
• K Group’s online food sales services already reach over 3 million Finns
Building and Technical Trade
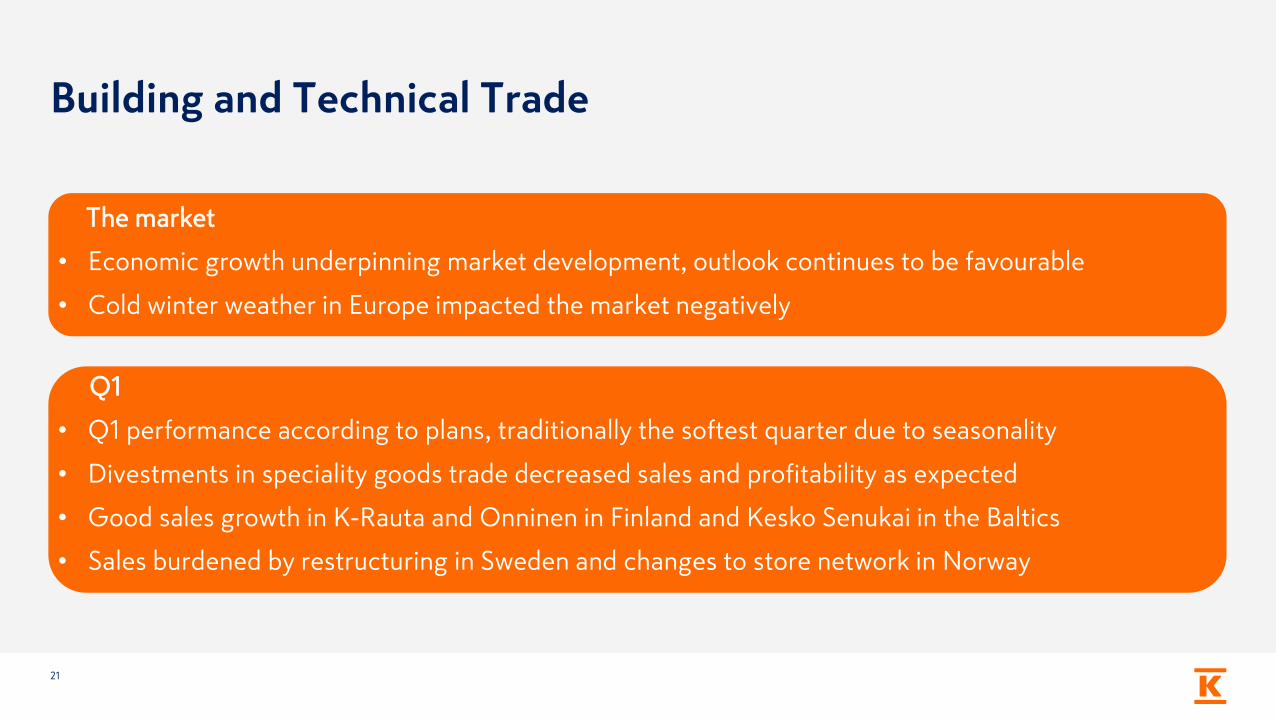
Building and Technical Trade
Q1
• Q1 performance according to plans, traditionally the softest quarter due to seasonality
• Divestments in speciality goods trade decreased sales and profitability as expected
• Good sales growth in K-Rauta and Onninen in Finland and Kesko Senukai in the Baltics
• Sales burdened by restructuring in Sweden and changes to store network in Norway
21
The market
• Economic growth underpinning market development, outlook continues to be favourable
• Cold winter weather in Europe impacted the market negatively
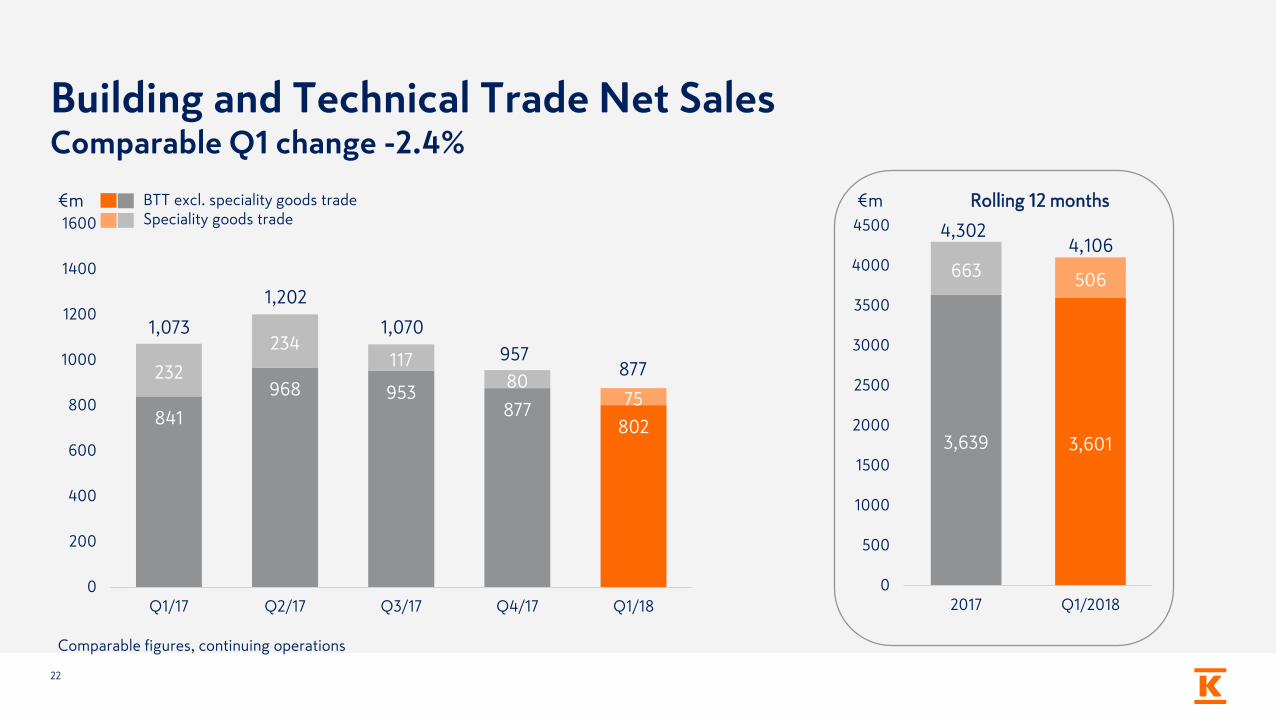
Building and Technical Trade Net SalesComparable Q1 change -2.4%
841
968 953877
802
232
234117
8075
0
200
400
600
800
1000
1200
1400
1600
Q1/17 Q2/17 Q3/17 Q4/17 Q1/18
22
3,639 3,601
663 506
0
500
1000
1500
2000
2500
3000
3500
4000
4500
2017 Q1/2018
4,3024,106
1,073
1,202
1,070
957877
€m €m
Comparable figures, continuing operations
BTT excl. speciality goods tradeSpeciality goods trade
Rolling 12 months
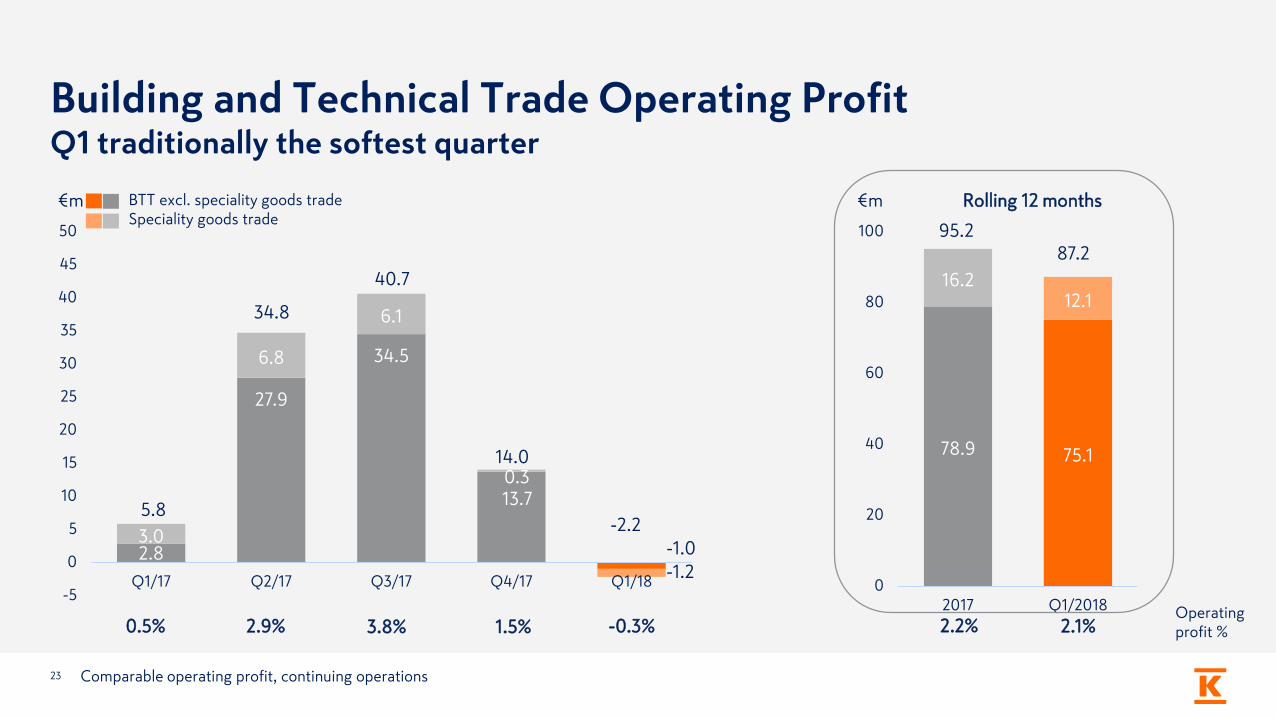
Building and Technical Trade Operating Profit Q1 traditionally the softest quarter
2.8
27.9
34.5
13.7
-1.03.0
6.8
6.1
0.3
-1.2-5
0
5
10
15
20
25
30
35
40
45
50
Q1/17 Q2/17 Q3/17 Q4/17 Q1/18
23
78.9 75.1
16.212.1
0
20
40
60
80
100
2017 Q1/2018 Operating profit % 0.5% 2.9% 3.8% 1.5% -0.3% 2.2% 2.1%
€m €m
Comparable operating profit, continuing operations
BTT excl. speciality goods tradeSpeciality goods trade
5.8
34.8
40.7
14.0
-2.2
95.287.2
Rolling 12 months

Building and Technical Trade Operating Profit Solid operative result, decrease due to divestments and calendar impacts
24
-2.2
5.8
Other changes
-0.2
Q1/18 operating profit
Easter and selling days
-2.6
Divestments
-0.6
Speciality
goods trade
Q1/17 operating profit
-4.6
€m
Comparable operating profit, continuing operationsImpact on Q1/17 operating profit from the divested Asko and Sotka, K-maatalous and Yamarin operations, Yamaha representation and Baltic real estates: €-4.6m

Reshaping Building and Technical Trade –Towards More Profitable Business
25
• New customer-oriented organisation and strong geographical focus
• Good progress in improving Onninen’s profitability
• Ongoing measures in Sweden to restructure and make operations more efficient
• Divestment of Russian operations will improve return on capital employed
• Ongoing measures to improve cost-efficiency of operations and
achieve synergies
Car Trade
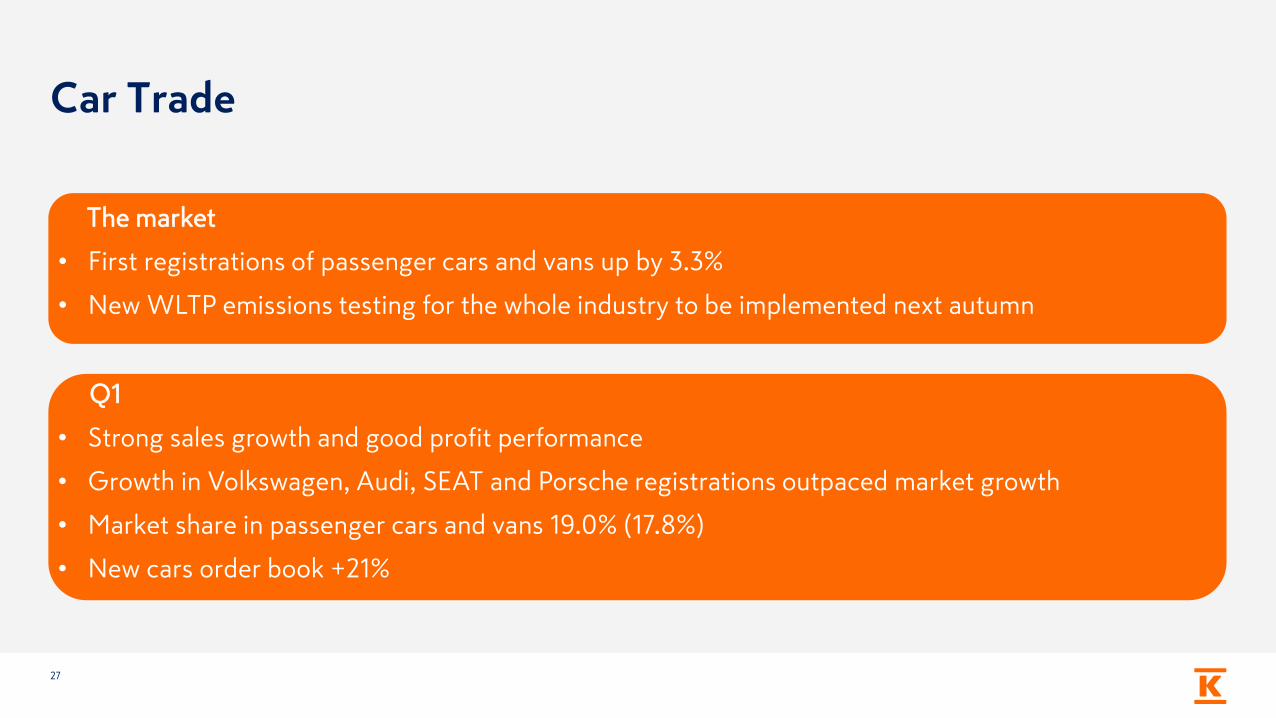
Car Trade
Q1
• Strong sales growth and good profit performance
• Growth in Volkswagen, Audi, SEAT and Porsche registrations outpaced market growth
• Market share in passenger cars and vans 19.0% (17.8%)
• New cars order book +21%
27
The market
• First registrations of passenger cars and vans up by 3.3%
• New WLTP emissions testing for the whole industry to be implemented next autumn
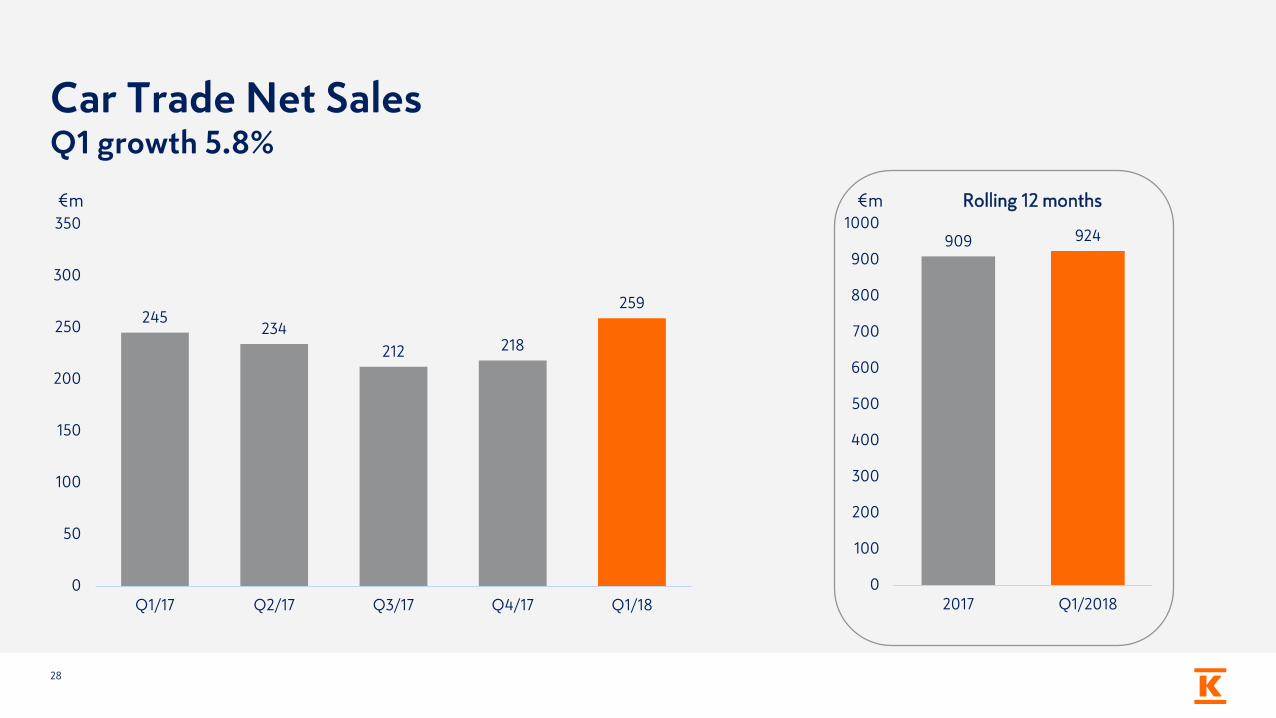
Car Trade Net SalesQ1 growth 5.8%
245234
212 218
259
0
50
100
150
200
250
300
350
Q1/17 Q2/17 Q3/17 Q4/17 Q1/18
28
909 924
0
100
200
300
400
500
600
700
800
900
1000
2017 Q1/2018
€m €m Rolling 12 months

Car Trade Operating Profit Q1 growth 9%
10.0
7.6
8.8
6.7
11.0
0
2
4
6
8
10
12
14
16
Q1/17 Q2/17 Q3/17 Q4/17 Q1/18
29
33.1 34.1
0
5
10
15
20
25
30
35
2017 Q1/2018
Operating profit %
4.1% 3.2% 4.2% 3.1% 4.2% 3.6% 3.7%
€m €m Rolling 12 months
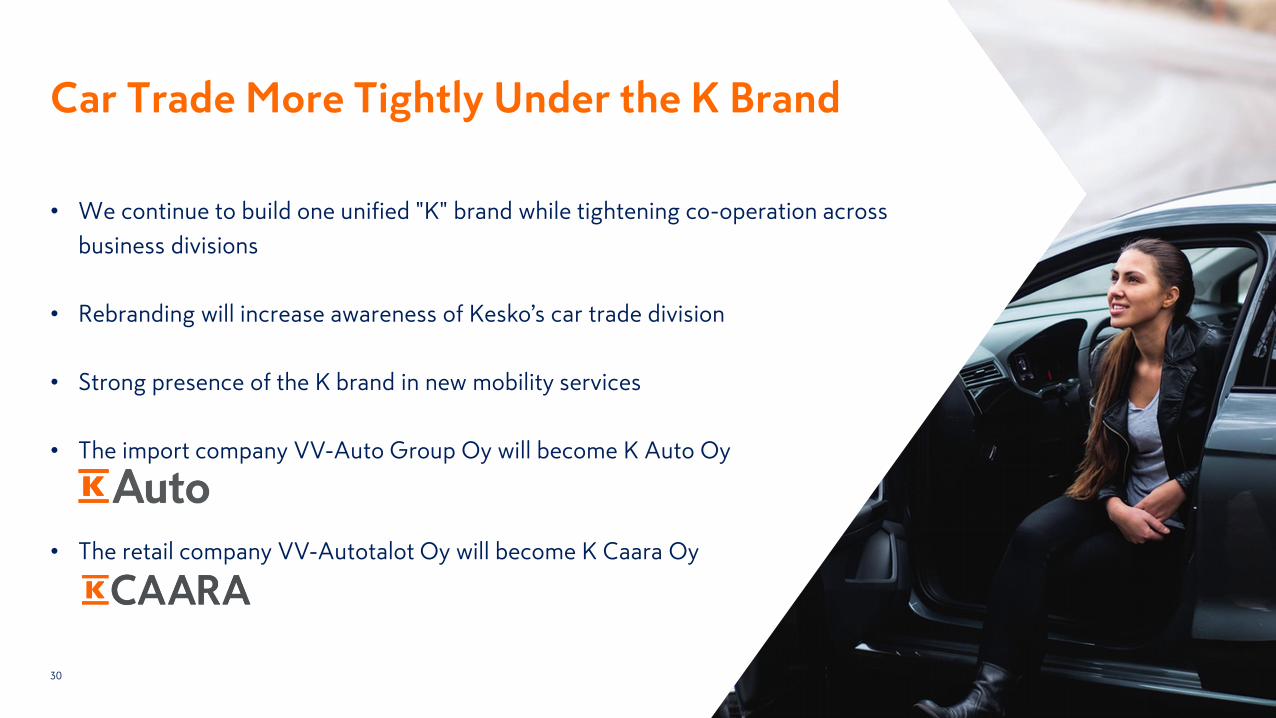
Car Trade More Tightly Under the K Brand
30
• We continue to build one unified "K" brand while tightening co-operation across
business divisions
• Rebranding will increase awareness of Kesko’s car trade division
• Strong presence of the K brand in new mobility services
• The import company VV-Auto Group Oy will become K Auto Oy
• The retail company VV-Autotalot Oy will become K Caara Oy

Outlook
Outlook
32
Estimates for the outlook for the net sales and comparable operating profit for Kesko Group's continuing operations
are given for the 12-month period following the reporting period (4/2018-3/2019) in comparison with the 12 months
preceding the end of the reporting period (4/2017-3/2018).
In comparable terms, the net sales for continuing operations for the next 12 months are expected to exceed the level
of the previous 12 months. Due to divestments and restructuring, net sales for Kesko Group’s continuing operations
for the next 12 months are expected to fall below the level of the previous 12 months. That development results from
the divestments of the K-maatalous agricultural business, the Asko and Sotka furniture trade, the Yamarin boat
business and Kesko's Yamaha representation as well as store closures and the transfer of Suomen Lähikauppa stores
to retailers.
The comparable operating profit for continuing operations for the next 12-month period is expected to exceed the
level of the preceding 12 months. However, investments in store openings and redesigns, in the expansion of logistics
operations, and in digital services will burden profitability during the period. It should also be noted that the operating
profit for the comparison period includes €5.8 million in operating profit from divestments and most of the synergies
obtained from the acquisition of Suomen Lähikauppa.

Upcoming Event:Capital Markets Day19 June 2018