Kerjasama Perdagangan Regional · 2018-05-31 · 1. Teori Dasar Perdagangan & Investasi...
48
Ekonomi Internasional: Sebuah Tinjauan Teori Kiki Verico, Ph.D
Transcript of Kerjasama Perdagangan Regional · 2018-05-31 · 1. Teori Dasar Perdagangan & Investasi...

Ekonomi Internasional: Sebuah Tinjauan Teori
Kiki Verico, Ph.D

Cakupan
1. Teori Dasar Trade & Foreign Direct Investment
2. Globalisasi Ekonomi

1. Teori Dasar Perdagangan & Investasi Internasional
From Mercantilism to: • Adam Smith’s production principle (absolute advantage) • David Ricardo’s specialization (comparative advantage) • Heckscher – Ohlin, Stolper – Samuelson (Factor endowments/Intra Industry)
• Competitive advantage (Specialization of Labour, RnD & Innovation)
• Global Value Chains
• Creative Economy

Trade TheoryAbsolute Advantage(Adam Smith)
MPL=W/P Country
Singapore
Country
Indonesia
Calculator 6 2/6 1 4/1
Batik 2 6/2 4 1/4

Trade TheoryComparative Advantage(David Ricardo)
MPL=W/P Country
Singapore
Country
Indonesia
Calculator 6 5/6 1 4/1
Batik 5 6/5 4 1/4

Trade TheoryComparative Advantage: Wage Effect(David Ricardo)
MPL=W/P Country
Singapore
($30/Hour)
Country
Indonesia
($2/Hour)
Calculator 6 5 1 2
Batik 5 6 4 1/2

Comparative Advantage(David Ricardo): ER effect (If Rupiah Depreciate)
MPL
Opportunity Cost
Country
Singapore ($30)
Country
Indonesia
ER: Rp 10,000/$
(W=Rp 20,000=$2)
Depreciation to
ER:Rp 15,000/$
(W=Rp 20,000=1.3$)
Electronic 6 5 1 2 1.3
Batik 5 6 4 0.5 0.3

Big Mac Index, Economist, 2015

9
Source: “Globalization and Capital Markets,” Maurice Obstfeld and Alan M. Taylor, NBER Conference Paper, May 4-5, 2001, p. 6.
Low
High
Capital Mobility
18801860 1900 1920 1940 1960 1980 2000
•
••
•1880
1900
1914
1860
Gold Standard1880-1914
Capital Mobility
••1960
1971
Bretton Woods1945-1971
•
•1980
2000
Float1971-2000
•1918
•
Interwar, 1914-1945
1929
1925
•1945
•


Source: WDI Data
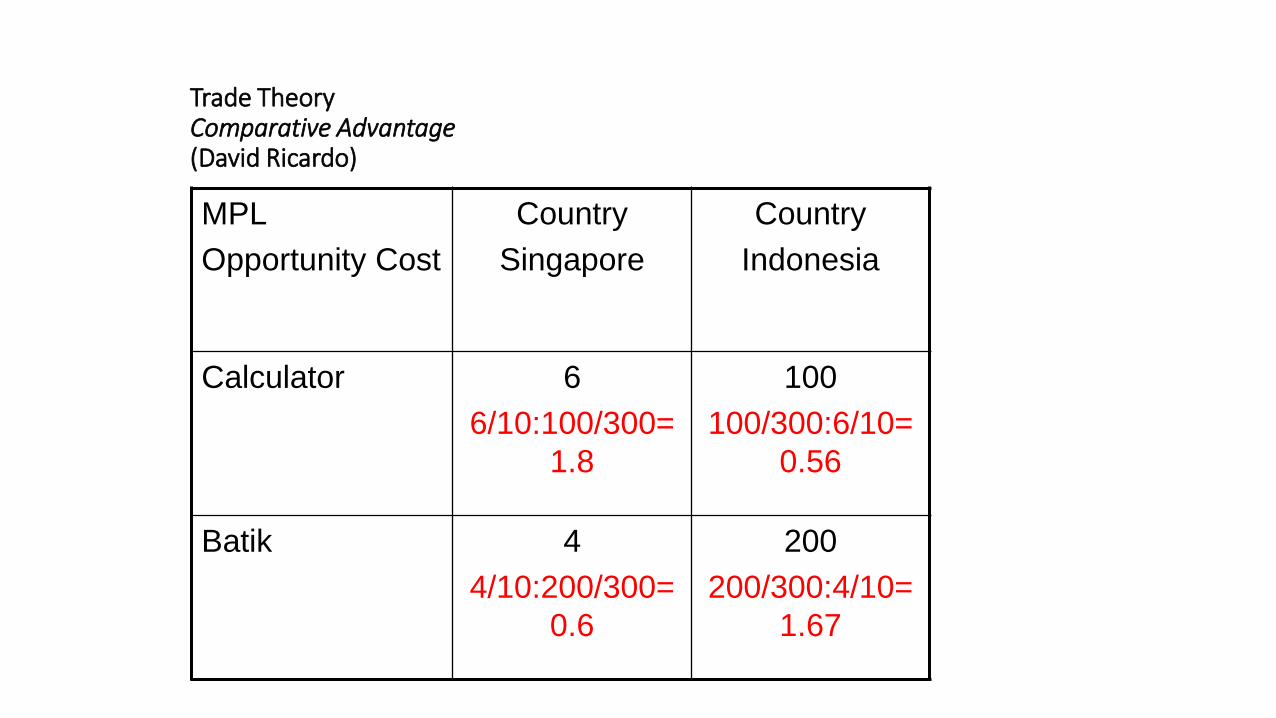
Trade TheoryComparative Advantage(David Ricardo)
MPL
Opportunity Cost
Country
Singapore
Country
Indonesia
Calculator 6
6/10:100/300=
1.8
100
100/300:6/10=
0.56
Batik 4
4/10:200/300=
0.6
200
200/300:4/10=
1.67
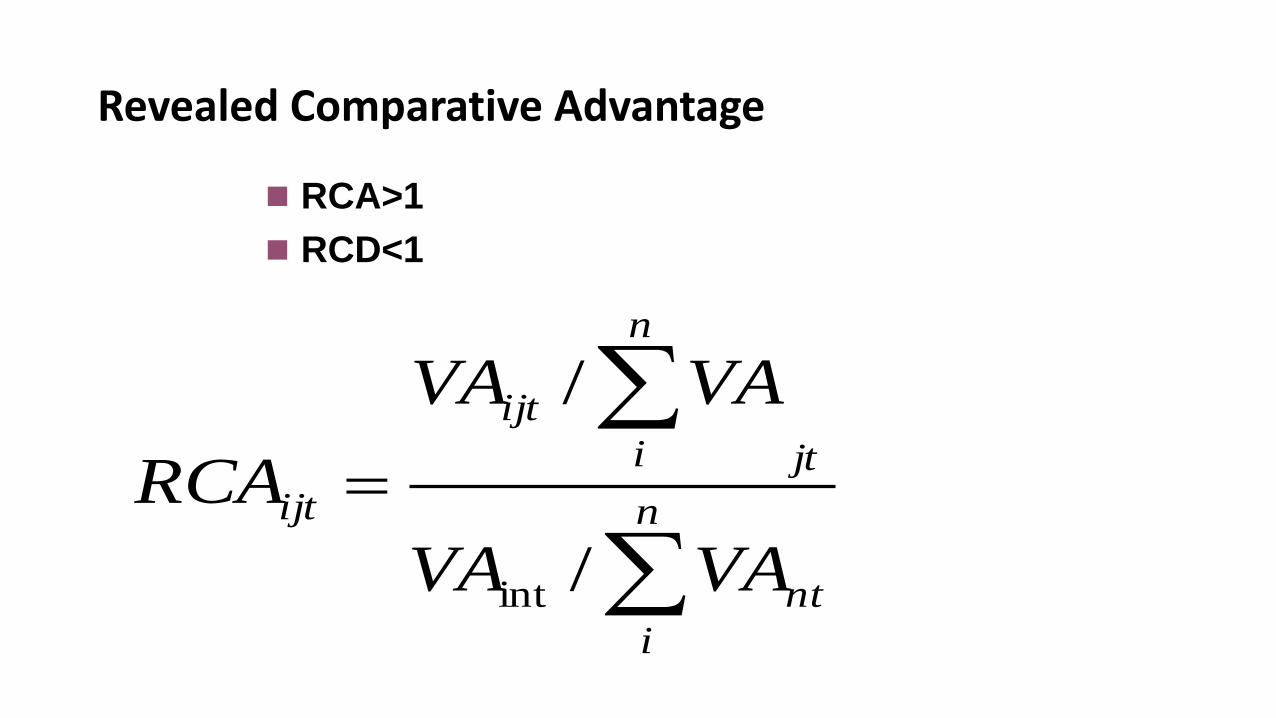
Revealed Comparative Advantage
n
i
nt
jt
n
i
ijt
ijt
VAVA
VAVA
RCA
/
/
int
RCA>1
RCD<1

CMSA
Xit1 – Xit0 = m.Xit0-Xit0 + (mi-m).Xt0 +(Xit1-miXt0)
• Global Factor (Global Share)
• Global Sectoral Factor (Global Commodity Share)
• National Global Factor (National Commodity Share)
CMSA National: National Commodity Share (+ or -)


16

Similar in productivity (Intra Industry Trade)
MPL Country
Singapore
Country
Indonesia
Calculator 6 2
Batik 4 1
18
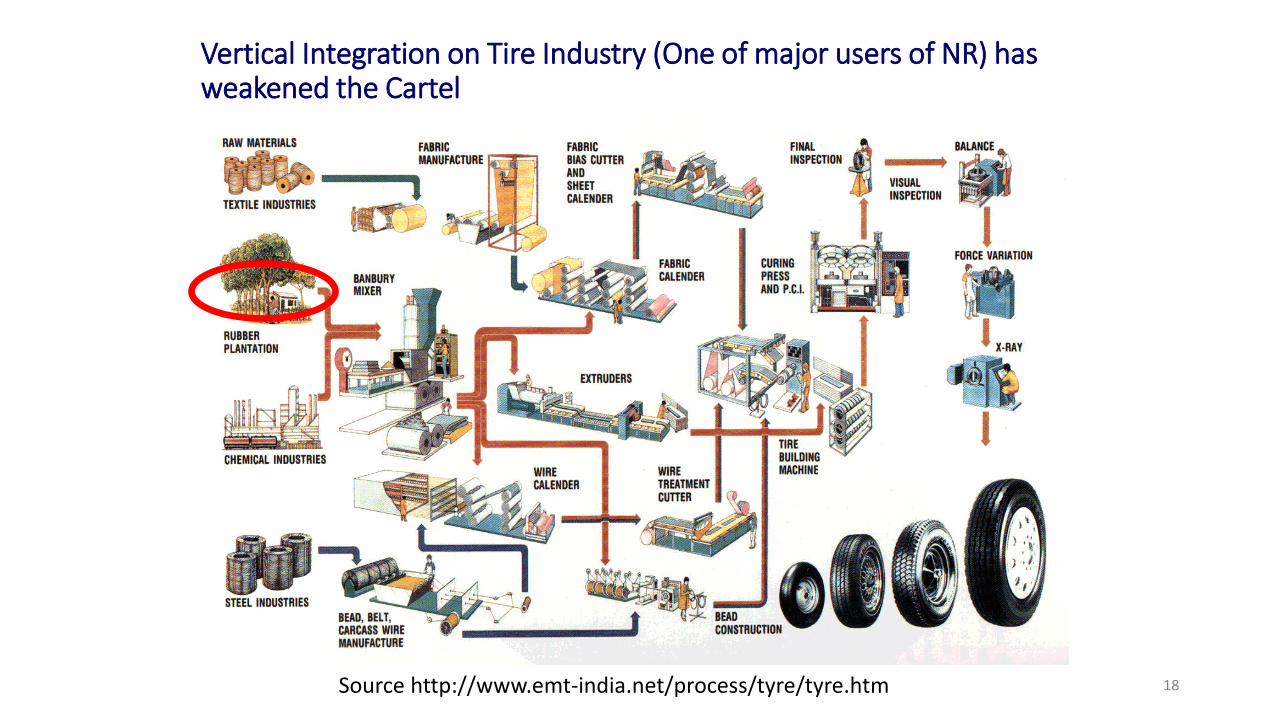
Vertical Integration on Tire Industry (One of major users of NR) has weakened the Cartel
Source http://www.emt-india.net/process/tyre/tyre.htm

Source: Fung Global Institute
Role of Service Sector (GVC = GPC + SS)
70% of TVA (to increase production)45% of Trade (to gain value-added from transaction)

Source: Tim GVCs LPEM based on OECD Data
TPP & Global Value Chains

Source: LPEM, GVC of Indonesia, 2016

Source: LPEM, 2014


iPod (Vertical Integration)
Source: Pyndick, 2009

25
UNCTAD Classification

Pendapatan dan Jumlah Tenaga Kerja antar Region
Region
Revenues (2013, % terhadap total pendapatan industri kreatif)
Tenaga kerja (2013, % terhadap total pekerja industri kreatif)
Asia-Pacific 33 43
Eropa 32 26
Amerika Utara 28 16
Amerika Latin 6 7
Afrika dan Timur Tengah 3 8 Sumber: Cultural times: the first global map of cultural and creative industries, EY, 2015
Pendapatan dan Jumlah Tenaga Kerja pada 11 Subsektor Industri Kreatif di Dunia
Sumber: Cultural times: the first global map of cultural and creative industries, EY, 2015
Sub Sektor Industri Kreatif Revenues
(2013, Miliar USD) Tenaga kerja
(2013, jumlah pekerja)
Televisi 477 3,527,000
Seni Rupa 391 6,732,000
Koran dan Majalah 354 2,865,000
Periklanan 285 1,953,000
Arsitektur 222 1,668,000
Buku 143 3,670,000
Seni Peran 127 3,538,000
Permainan 99 605,000
Perfilman 77 2,484,000
Musik 65 3,979,000
Radio 46 502,000
Total (sebelum penyesuaian terkait double counting)
2285 31,524,000
Total (sesudah penyesuaian terkait double counting)
2253 29,507,000

Nilai Tambah Bruto Ekonomi Kreatif Indonesia Tahun 2010- 2013 Atas Dasar Harga Belaku (Miliar
Rupiah)
No Sub Sektor (Miliar Rupiah) 2013 %
1 Periklanan 3,754.2 0.6%
2 Arsitektur 12,890.9 2.0%
3 Barang Seni 2,001.3 0.3%
4 Kerajinan 92,650.9 14.4%
5 Disain 25,042.7 3.9%
6 Fesyen 181,570.3 28.3%
7 Film, Video & Fotografi 8,401.4 1.3%
8 Permainan Interaktif 4,817.3 0.8%
9 Musik 5,237.1 0.8%
10 Seni Pertunjukan 2,595.3 0.4%
11 Penerbitan & Percetakan 52,037.6 8.1%
12 Layanan Komputer dan Piranti Lunak 10,064.8 1.6%
13 Radio & Televisi 20,340.5 3.2%
14 Riset dan Pengembangan 11,778.5 1.8%
15 Kuliner 208,632.8 32.5%
Total 641,815.6 100% Ket: *) angka sementara, **) angka sangat sementara, ***) angka sangat-sangat sementara Sumber: Badan Pusat Statistik (2013)
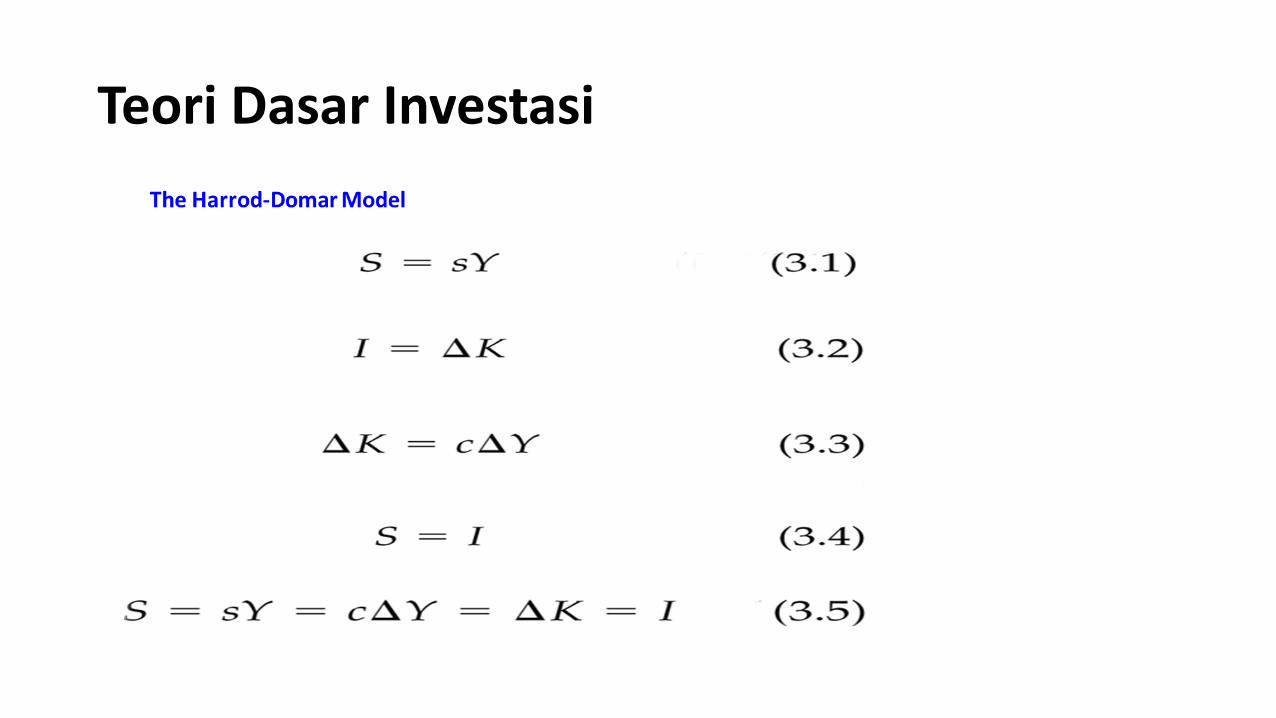
Teori Dasar Investasi

Three types of long-run investment1. Business fixed investment :
businesses’ spending on equipment and structures for use in production.
2. Residential investment :purchases of new housing units (either by occupants or landlords).
3. Inventory investment :the value of the change in inventories of finished goods, materials and supplies, and work in progress.

Trade & FDI Relations
Before government action there were market driven factors
FDI inflows role in Regional Production Network/RPN (Flying Geese Modelof Akamatsu, 1944; Kojima, 1978; Aoki, 1992; Urata, 1993) on ASEAN-5
RPN is behind the Southeast Asia economic integration before the ECBN/guanxi (Wang, 2001) & KPN of Thailand & ASEAN-4 (Cheong, 2011)
FDI inflows stimulate knowledge & education advancement in host-countries (Hejazi & Safarian, 1999) and higher education & political economic stability stimulate FDI inflows (Aggarwal, 2008)
Endogenous relation (Hejazi & Pauly, 2003)
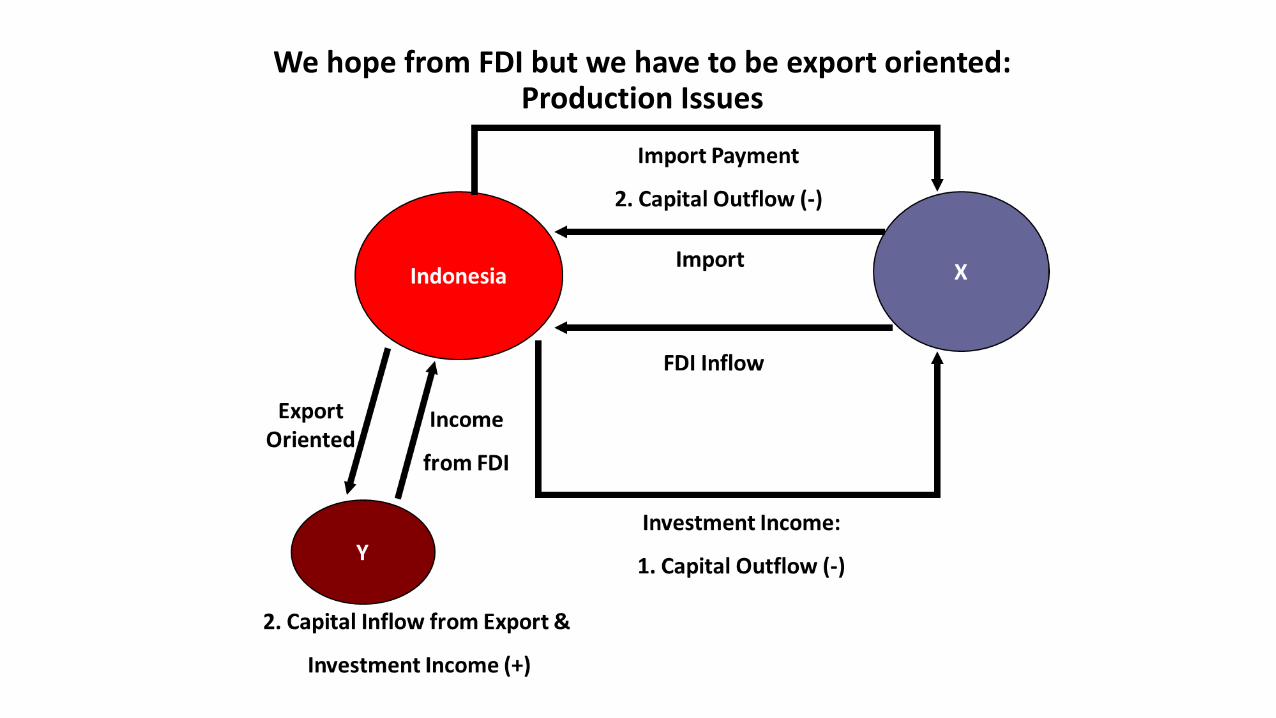
We hope from FDI but we have to be export oriented:Production Issues

Neraca Pembayaran (transaksi bank): Williamson&Lessard
Export Goods & Services a (c+)
Import Goods & Services b (d-)
Trade Balance C
Net Investment Income d (c+/d-)
Debt-Service Payments e (d-)
Net Remittances & transfers f (c+/d-)
Service G
Current Account H
Foreign Direct Investment i (c+/d-)
Private Foreign Loans (-Amortization) j (c+)
Government Foreign Loans (-Amortization) k (c+)
Increase in Foreign Assets of Domestic Bank l (c+)
Short Term Capital Flow m (c+/d-)
Capital Account N
BoP O
Errors/Omissions P
Delta Stock in International Reserve Q

Trade in goods includes items such as
• Manufactured goods
• Semi-finished goods and components
• Energy products
• Raw Materials
• Consumer goods
(i) Durable goods
(ii) Non-durable goods e.g. foods
• Capital goods (e.g. equipment)
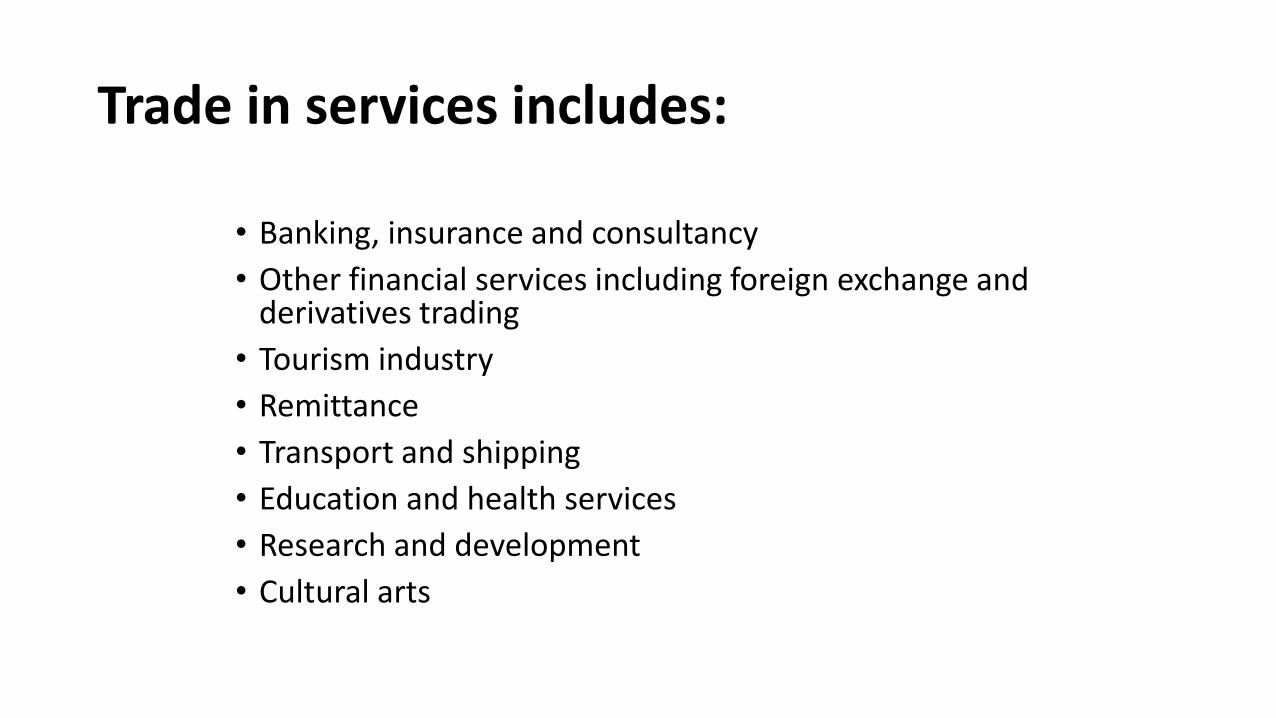
Trade in services includes:
• Banking, insurance and consultancy
• Other financial services including foreign exchange and derivatives trading
• Tourism industry
• Remittance
• Transport and shipping
• Education and health services
• Research and development
• Cultural arts
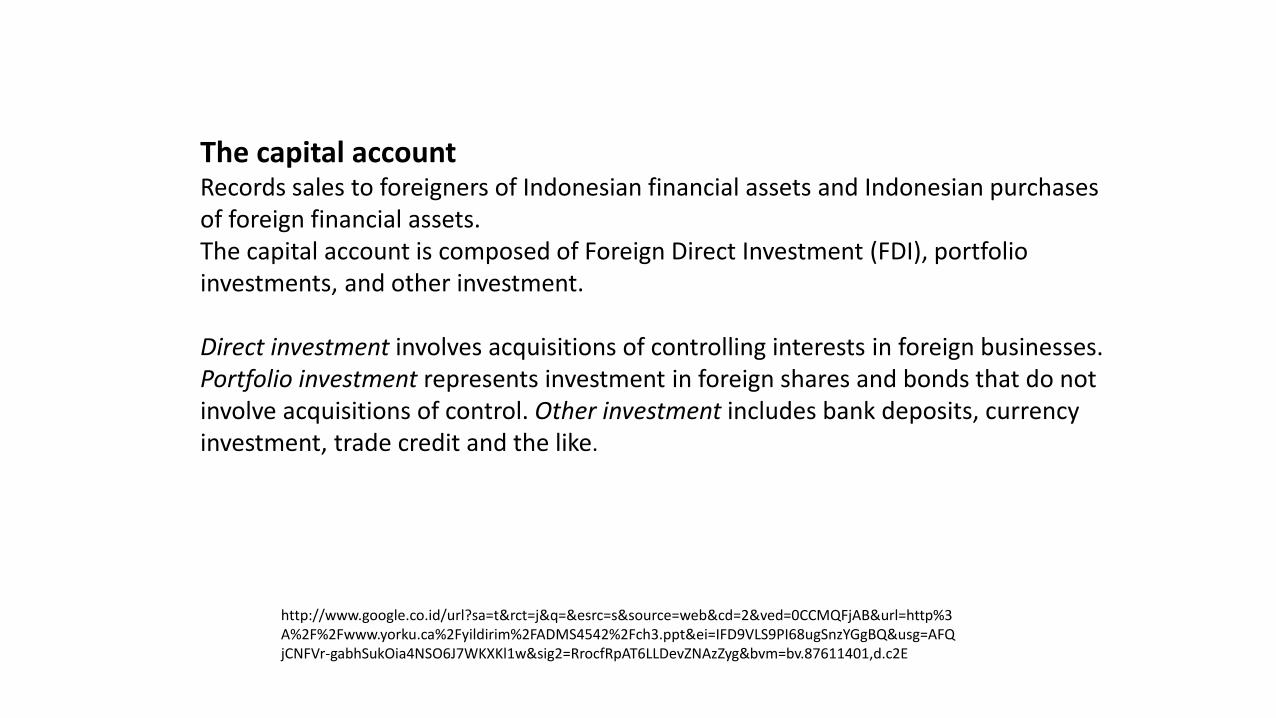
The capital account Records sales to foreigners of Indonesian financial assets and Indonesian purchases of foreign financial assets.The capital account is composed of Foreign Direct Investment (FDI), portfolio investments, and other investment.
Direct investment involves acquisitions of controlling interests in foreign businesses. Portfolio investment represents investment in foreign shares and bonds that do not involve acquisitions of control. Other investment includes bank deposits, currency investment, trade credit and the like.
http://www.google.co.id/url?sa=t&rct=j&q=&esrc=s&source=web&cd=2&ved=0CCMQFjAB&url=http%3A%2F%2Fwww.yorku.ca%2Fyildirim%2FADMS4542%2Fch3.ppt&ei=IFD9VLS9PI68ugSnzYGgBQ&usg=AFQjCNFVr-gabhSukOia4NSO6J7WKXKl1w&sig2=RrocfRpAT6LLDevZNAzZyg&bvm=bv.87611401,d.c2E

The Reserve Account The Reserve Account of BOP records changes in the amount of “official” reserve assets held by the Bank of Indonesia.
Official reserves assets include gold, foreign currencies, SDRs, reserve positions in the IMF.
If a country must make net payment to foreigners because of BOP deficit, the country could either run down its official reserve assets or borrow a new from foreigners.
http://www.google.co.id/url?sa=t&rct=j&q=&esrc=s&source=web&cd=2&ved=0CCMQFjAB&url=http%3A%2F%2Fwww.yorku.ca%2Fyildirim%2FADMS4542%2Fch3.ppt&ei=IFD9VLS9PI68ugSnzYGgBQ&usg=AFQjCNFVr-gabhSukOia4NSO6J7WKXKl1w&sig2=RrocfRpAT6LLDevZNAzZyg&bvm=bv.87611401,d.c2E

2. Globalisasi Ekonomi

Globalization “The process of international integration arising from the interchange of world views, products, ideas, and other aspects of culture. Advances in transportation and telecommunication infrastructure, including the rise of the telegraph and its posterity the internet, are major factors in globalization, generating further interdependence of economic and cultural activities” (Guyford, 1972)
Four waves of globalization:1. Government Led: Colonialization 2. Private (MNCs) Led: Industrial Revolution3. Individual Led: Information Communication Technology (ICT) Revolution4. Machinery Led: Virtual Domination, material less


Perbandingan Pertumbuhan Ekonomi (%): D.Dollar & A.Art,WB Research Paper, March 2001,p.38
Category 1960’s 1970’s 1980’s 1990’s 2000’s
Globalized 1.4 2.9 3.5 5.0 6.0
Non Globalized 2.4 3.3 0.8 1.4 1.5
Sumber:Author’s calculation

Protection and its impact
p
D
S
P(1+t)
PNMS
Qs0 Qs1
P
QLEMSQd1 Qd0
Government
Rent SeekerRent Seeker
Domestic Producer
How Foreign Producer
Respond?
Depends on the type of
protection
(tariff, quota, non-tariff)
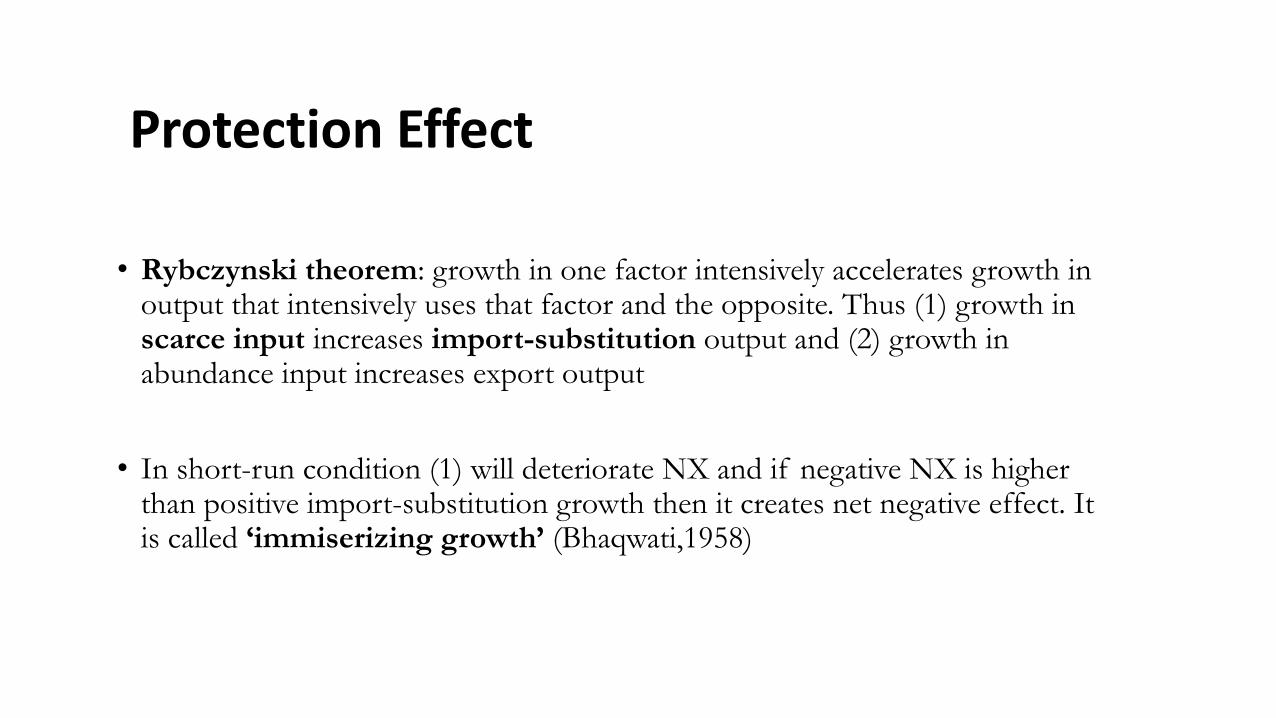
Protection Effect
• Rybczynski theorem: growth in one factor intensively accelerates growth in output that intensively uses that factor and the opposite. Thus (1) growth in scarce input increases import-substitution output and (2) growth in abundance input increases export output
• In short-run condition (1) will deteriorate NX and if negative NX is higher than positive import-substitution growth then it creates net negative effect. It is called ‘immiserizing growth’ (Bhaqwati,1958)
43
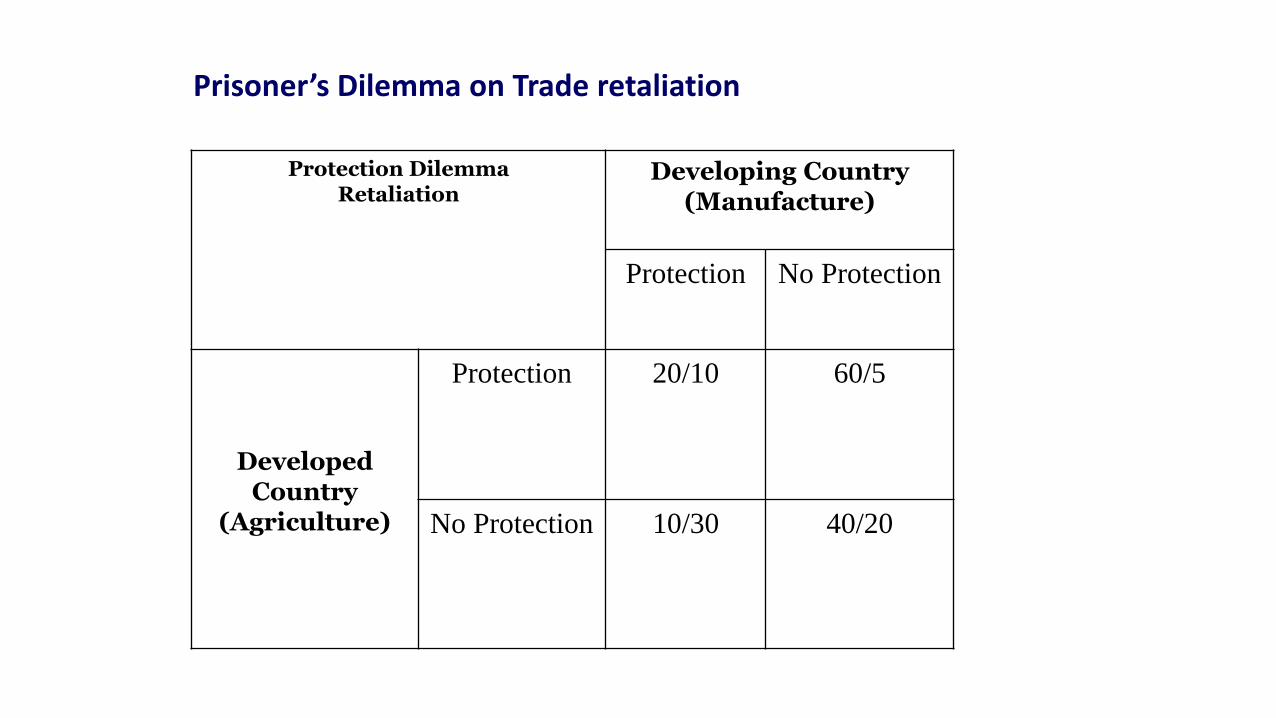
Prisoner’s Dilemma on Trade retaliation
Protection DilemmaRetaliation
Developing Country(Manufacture)
Protection No Protection
Developed Country
(Agriculture)
Protection 20/10 60/5
No Protection 10/30 40/20
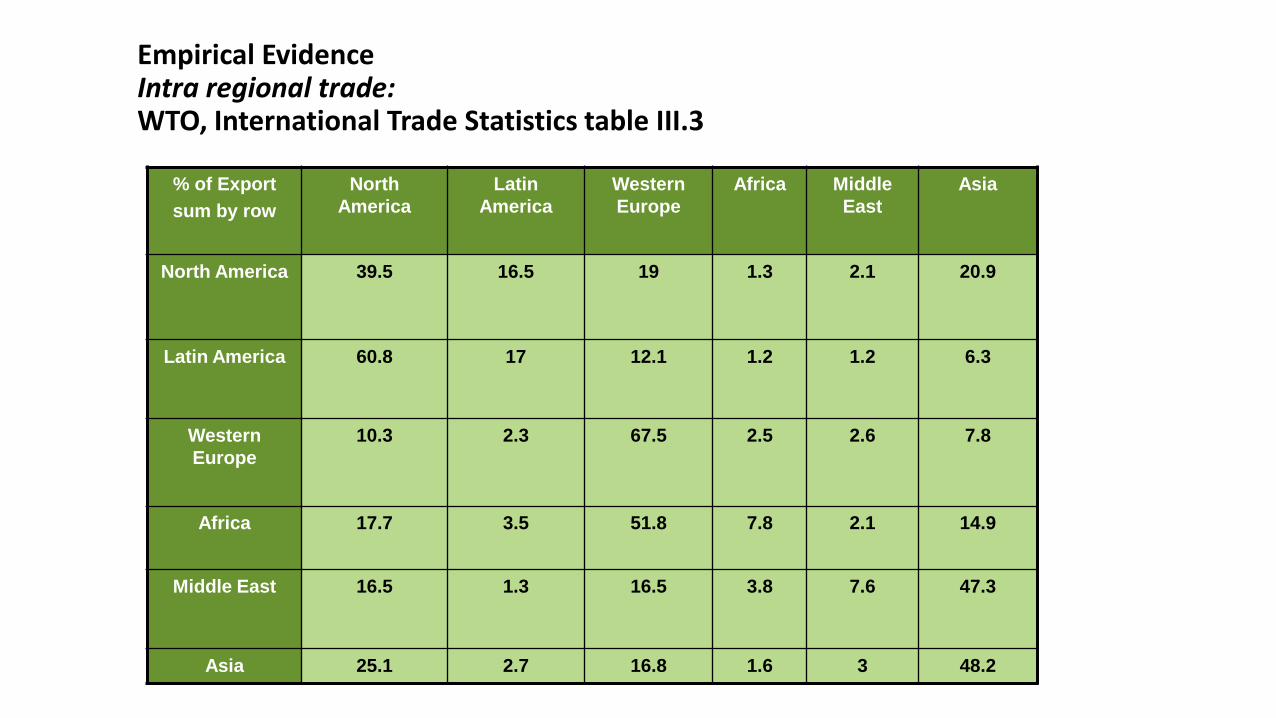
Empirical Evidence Intra regional trade: WTO, International Trade Statistics table III.3
% of Export
sum by row
North
America
Latin
America
Western
Europe
Africa Middle
East
Asia
North America 39.5 16.5 19 1.3 2.1 20.9
Latin America 60.8 17 12.1 1.2 1.2 6.3
Western
Europe
10.3 2.3 67.5 2.5 2.6 7.8
Africa 17.7 3.5 51.8 7.8 2.1 14.9
Middle East 16.5 1.3 16.5 3.8 7.6 47.3
Asia 25.1 2.7 16.8 1.6 3 48.2


47
Regional Economic Integration Theory
SCSMUCMCUFTA
Free Trade Area(1957-1967)Free flows of goods (output market),
Treaty of RomeTreaty of Paris, 1951: ECSC,EURATOM, EPU
Custom Union (1967-1987)Trade Diversion to Investment Creation (transition output & input market)
Economic Community
Common Market(1987-1993)Free flows of capital people (input market)
Single Market (Real Sector Convergence)
Single Monetary Union(1993-1999)Monetary policy union
Treaty of Maastricht,1992 (SGP, EMS to ECB)
Single Currency(1999-2002) Single Currency preparation and exist until now)
Monetary, Single Currency (OCA, ERM)
Source: Verico, Kiki, 2013

Terima KasihLPEM FEUI