Kepler Exercise
21
Kepler Exercise Kepler Exercise Deana Pennington Deana Pennington University of New Mexico University of New Mexico January 9, 2007 January 9, 2007
-
Upload
nora-franco -
Category
Documents
-
view
38 -
download
1
description
Kepler Exercise. Deana Pennington University of New Mexico January 9, 2007. Graphing data. Vegetation biomass test data With EML Without EML. Sevilleta LTER Biomass Plots. Biomass = f(species, cover%, height, season). This Exercise. - PowerPoint PPT Presentation
Transcript of Kepler Exercise

Kepler ExerciseKepler Exercise
Deana PenningtonDeana Pennington
University of New MexicoUniversity of New Mexico
January 9, 2007January 9, 2007
Graphing dataGraphing data
Vegetation biomass test dataVegetation biomass test data
1.1. With EMLWith EML
2.2. Without EMLWithout EML
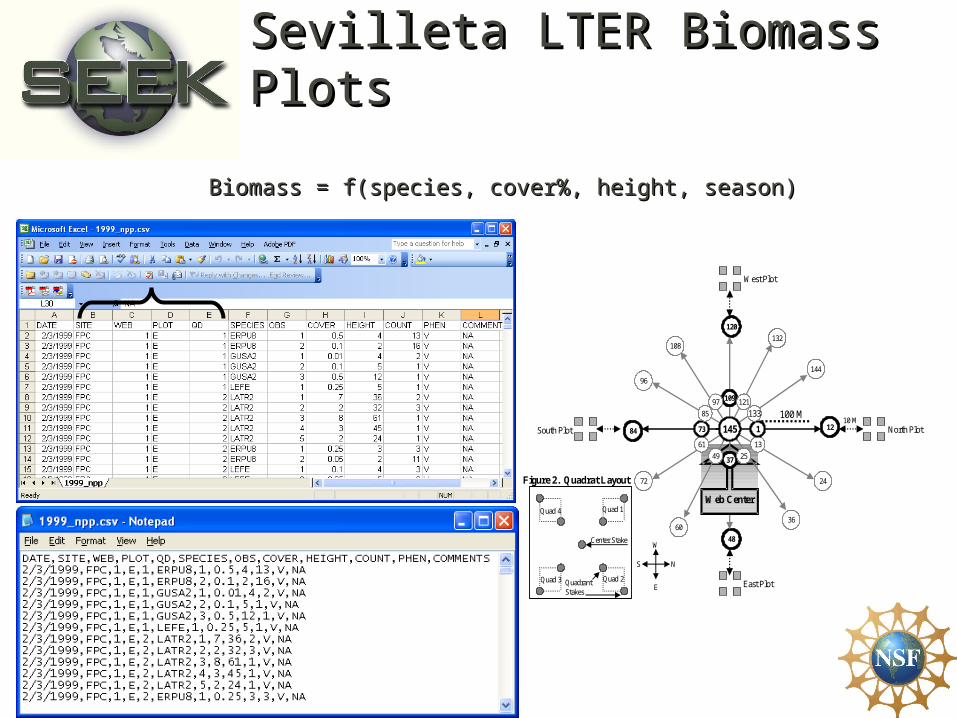
Sevilleta LTER Biomass PlotsSevilleta LTER Biomass Plots
Biomass = f(species, cover%, height, season)Biomass = f(species, cover%, height, season)
48
Web Center
120
12
24
3660
72
84
96
108
144
132
13
145
37 25
61
49
173
109 121
13397
85 100 M10 M
North Plot
East Plot
South Plot
West Plot
Quad 2Quad 3
Quad 1Quad 4
Figure 2. Quadrat Layout
Center Stake
Quadrant Stakes
W
E
NS
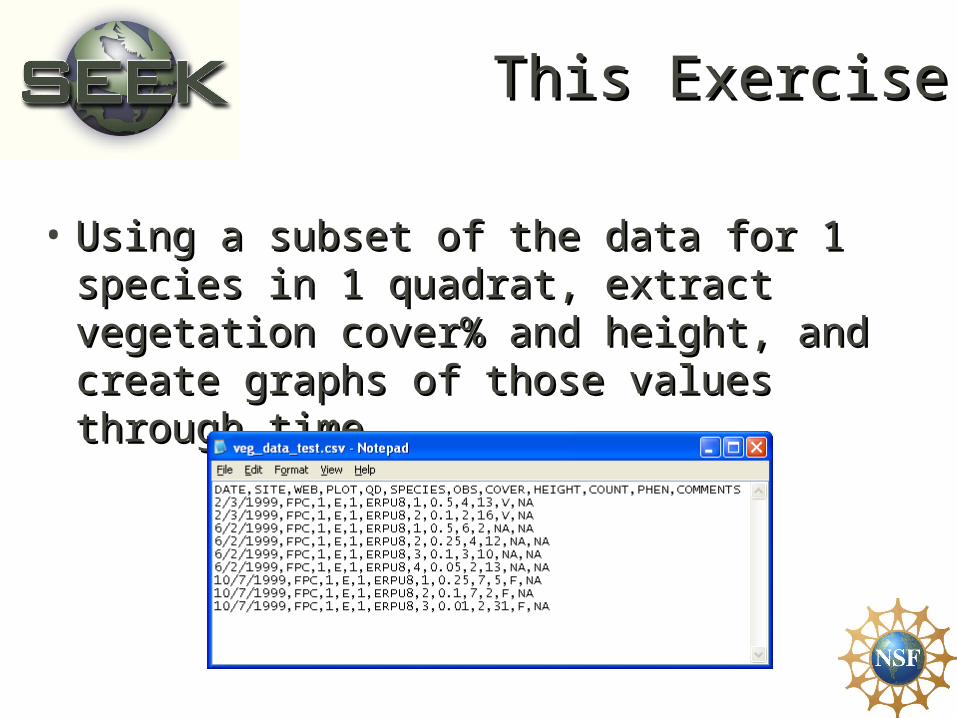
This ExerciseThis Exercise
• Using a subset of the data for 1 species Using a subset of the data for 1 species in 1 quadrat, extract vegetation coverin 1 quadrat, extract vegetation cover% and height, and create graphs of % and height, and create graphs of those values through timethose values through time
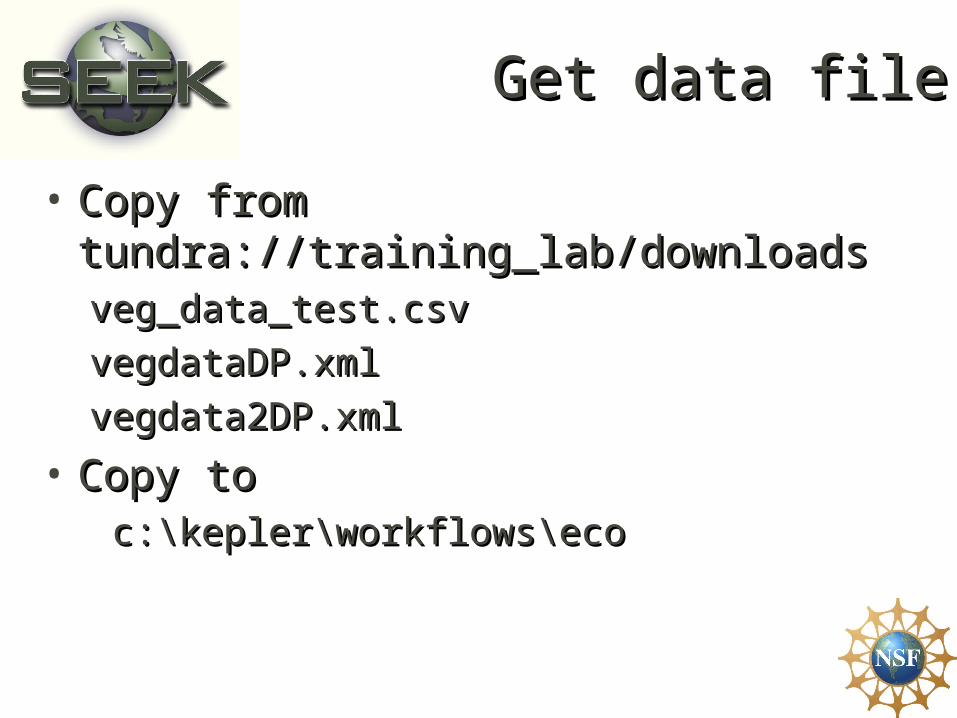
Get data fileGet data file
• Copy from Copy from tundra://training_lab/downloadstundra://training_lab/downloadsveg_data_test.csvveg_data_test.csv
vegdataDP.xml vegdataDP.xml
vegdata2DP.xmlvegdata2DP.xml
• Copy toCopy to c:\kepler\workflows\ecoc:\kepler\workflows\eco
View the end resultView the end result
• Open vegdataDP in keplerOpen vegdataDP in kepler– File->Open->vegdataDP.xmlFile->Open->vegdataDP.xml
• RunRun
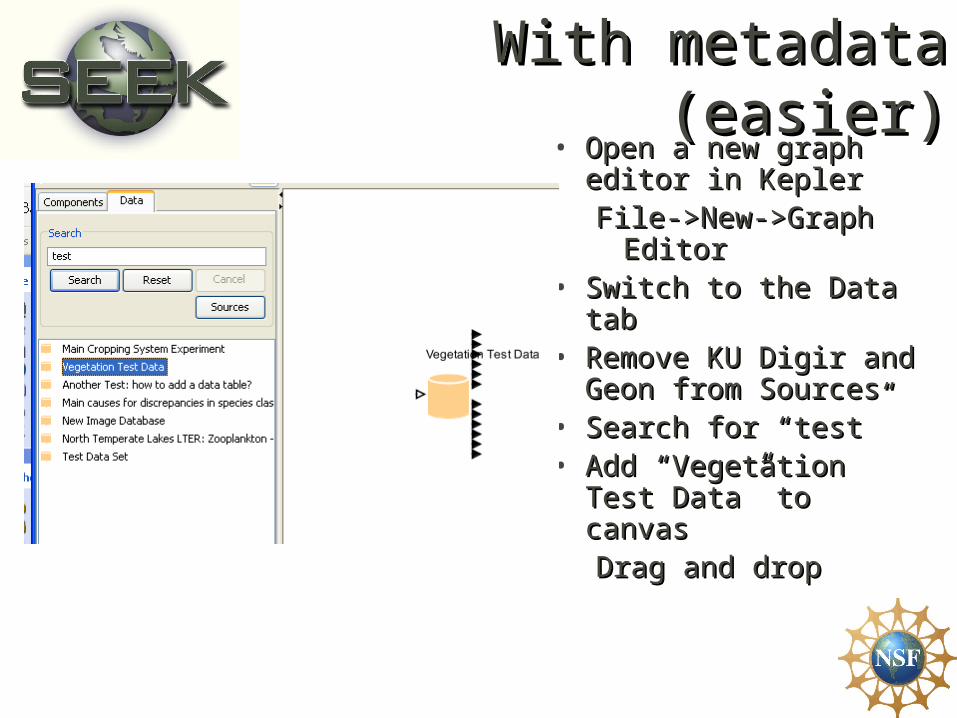
With metadata (easier)With metadata (easier)• Open a new graph Open a new graph
editor in Keplereditor in KeplerFile->New->Graph File->New->Graph
EditorEditor• Switch to the Data Switch to the Data
tabtab• Remove KU Digir and Remove KU Digir and
Geon from SourcesGeon from Sources• Search for “test”Search for “test”• Add “Vegetation Test Add “Vegetation Test
Data” to canvasData” to canvasDrag and dropDrag and drop
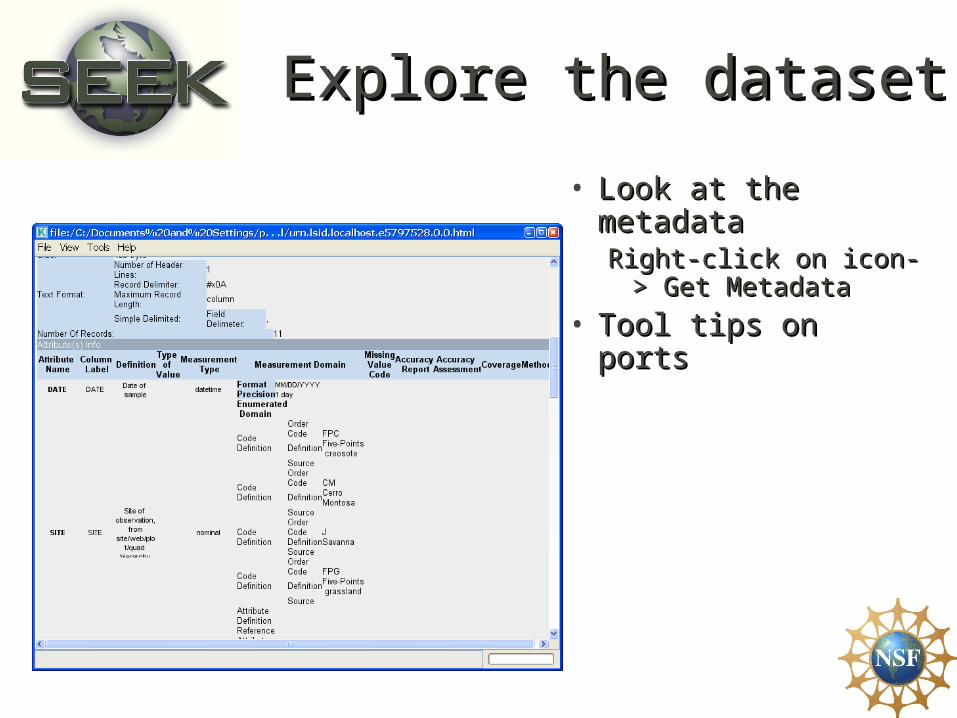
Explore the datasetExplore the dataset
• Look at the Look at the metadatametadataRight-click on icon-Right-click on icon-
> Get Metadata> Get Metadata
• Tool tips on portsTool tips on ports
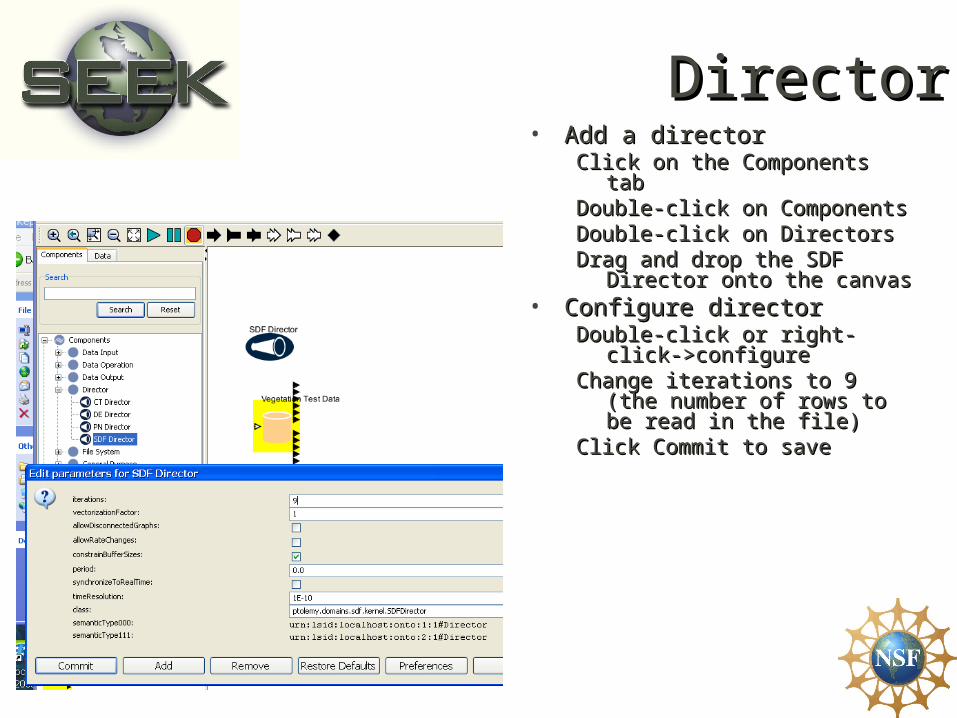
DirectorDirector• Add a directorAdd a director
Click on the Components tabClick on the Components tabDouble-click on ComponentsDouble-click on ComponentsDouble-click on DirectorsDouble-click on DirectorsDrag and drop the SDF Director Drag and drop the SDF Director
onto the canvasonto the canvas• Configure directorConfigure director
Double-click or right-click-Double-click or right-click->configure>configure
Change iterations to 9 (the Change iterations to 9 (the number of rows to be read in number of rows to be read in the file)the file)
Click Commit to saveClick Commit to save
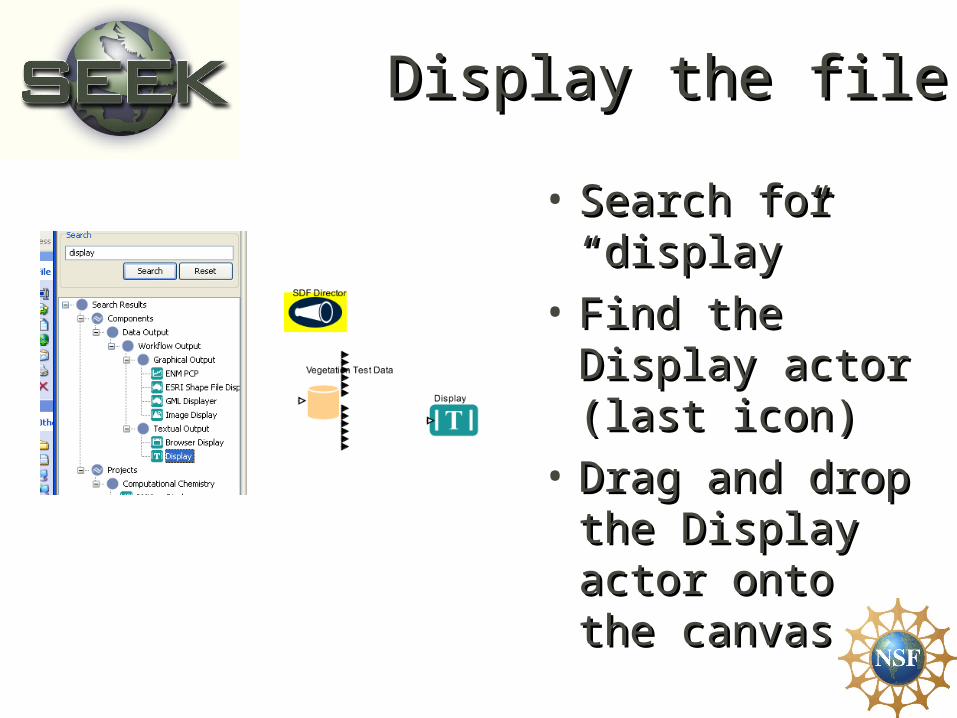
Display the fileDisplay the file
• Search for Search for “display”“display”
• Find the Display Find the Display actor (last icon)actor (last icon)
• Drag and drop Drag and drop the Display the Display actor onto the actor onto the canvas canvas
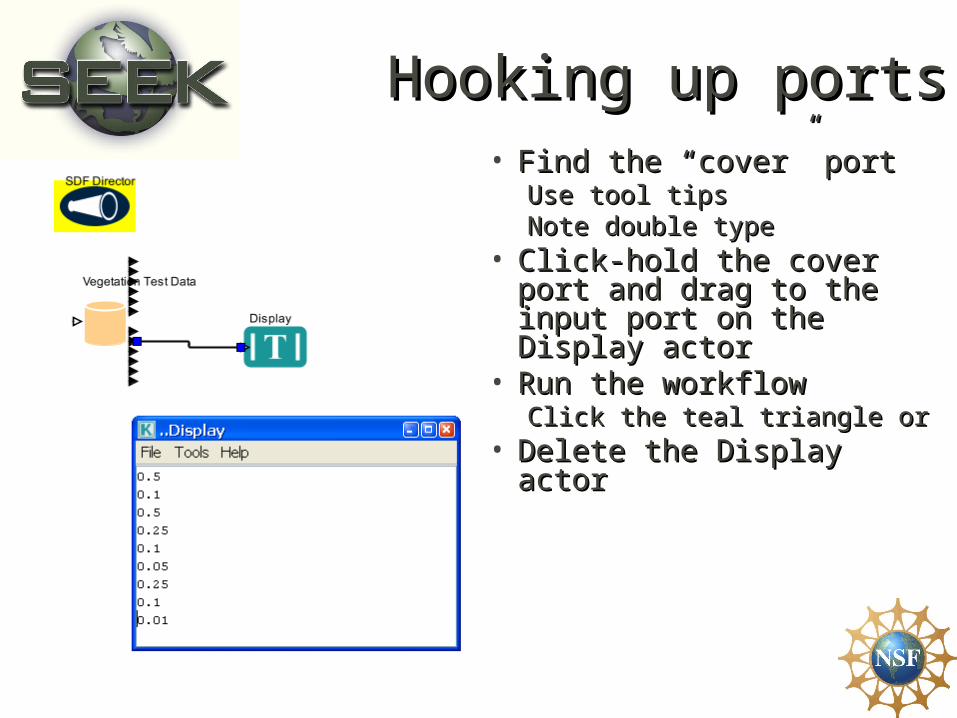
Hooking up portsHooking up ports• Find the “cover” portFind the “cover” port
Use tool tipsUse tool tipsNote double typeNote double type
• Click-hold the cover Click-hold the cover port and drag to the port and drag to the input port on the input port on the Display actorDisplay actor
• Run the workflowRun the workflowClick the teal triangle orClick the teal triangle or
• Delete the Display actorDelete the Display actor
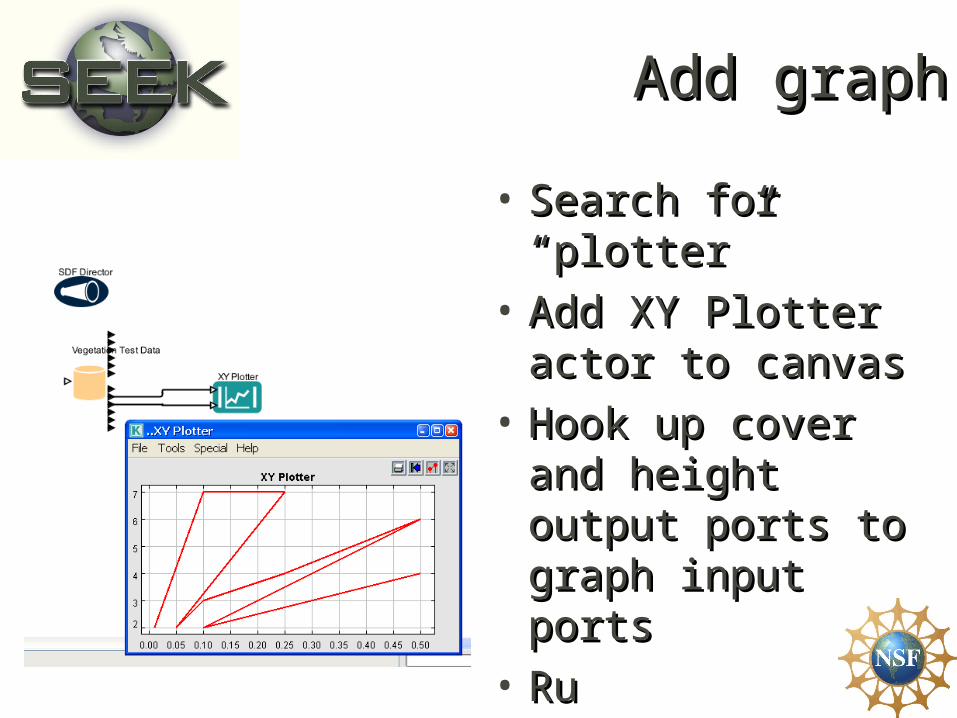
Add graphAdd graph
• Search for Search for “plotter”“plotter”
• Add XY Plotter Add XY Plotter actor to canvasactor to canvas
• Hook up cover Hook up cover and height output and height output ports to graph ports to graph input portsinput ports
• Ru Ru
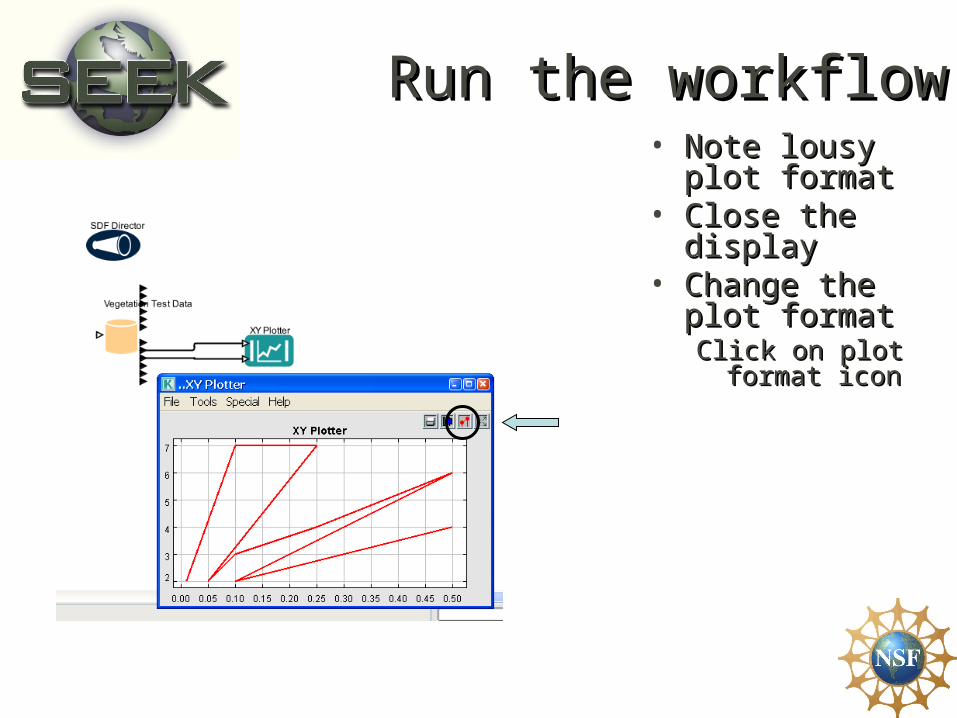
Run the workflowRun the workflow• Note lousy plot Note lousy plot
formatformat• Close the Close the
displaydisplay• Change the Change the
plot formatplot formatClick on plot Click on plot
format iconformat icon
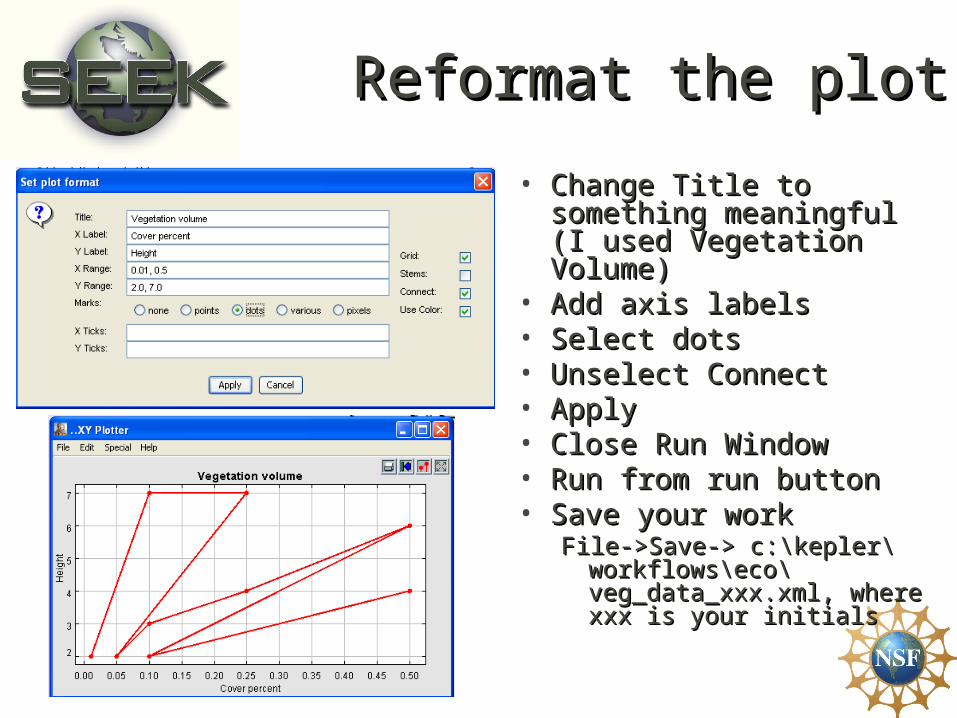
Reformat the plotReformat the plot
• Change Title to Change Title to something meaningful something meaningful (I used Vegetation (I used Vegetation Volume)Volume)
• Add axis labelsAdd axis labels• Select dotsSelect dots• Unselect ConnectUnselect Connect• ApplyApply• Close Run WindowClose Run Window• Run from run buttonRun from run button• Save your workSave your work
File->Save-> c:\kepler\File->Save-> c:\kepler\workflows\eco\workflows\eco\veg_data_xxx.xml, where veg_data_xxx.xml, where xxx is your initialsxxx is your initials
Without EMLWithout EML
• The harder way, without EML-The harder way, without EML-described metadatadescribed metadata

Cheat-look aheadCheat-look ahead
Open vegdata2DP.xml from Kepler->File->Open File-> Open vegdata2DP.xml from Kepler->File->Open File-> [locate file][locate file]
Opens the fileSeparates file into columnsExtract cover and height columnsConverts to decimal numberConverts array to elementsConstructs graphNote: all this would not be necessary if EML used
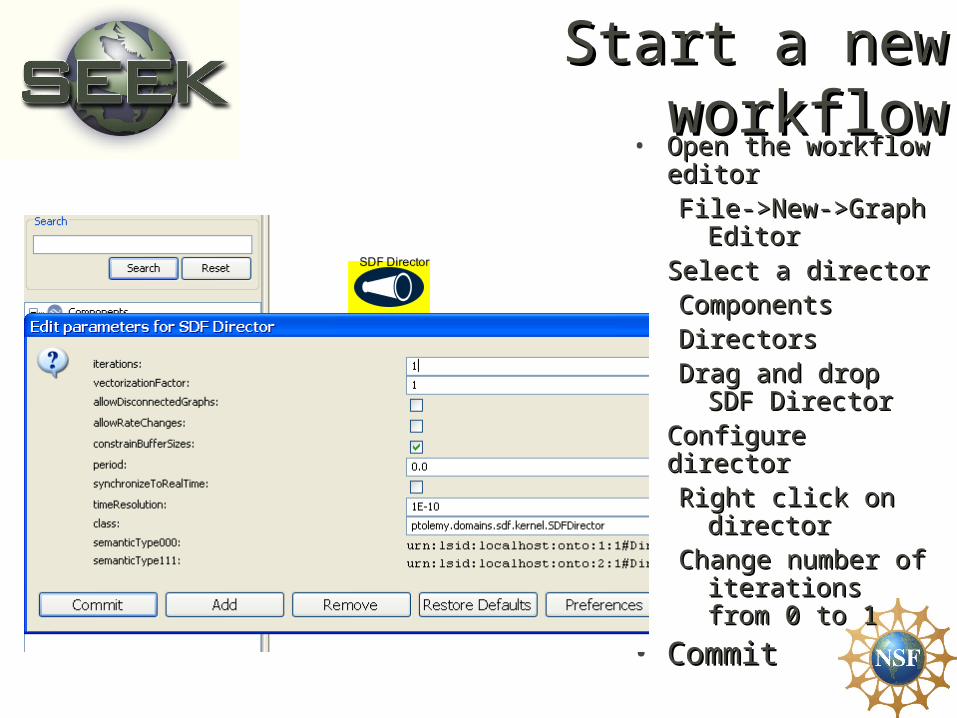
Start a new workflowStart a new workflow• Open the workflow Open the workflow
editoreditorFile->New->Graph File->New->Graph
EditorEditor• Select a directorSelect a director
ComponentsComponentsDirectorsDirectorsDrag and drop Drag and drop
SDF DirectorSDF Director• Configure directorConfigure director
Right click on Right click on directordirector
Change number of Change number of iterations from iterations from 0 to 10 to 1
• CommitCommit
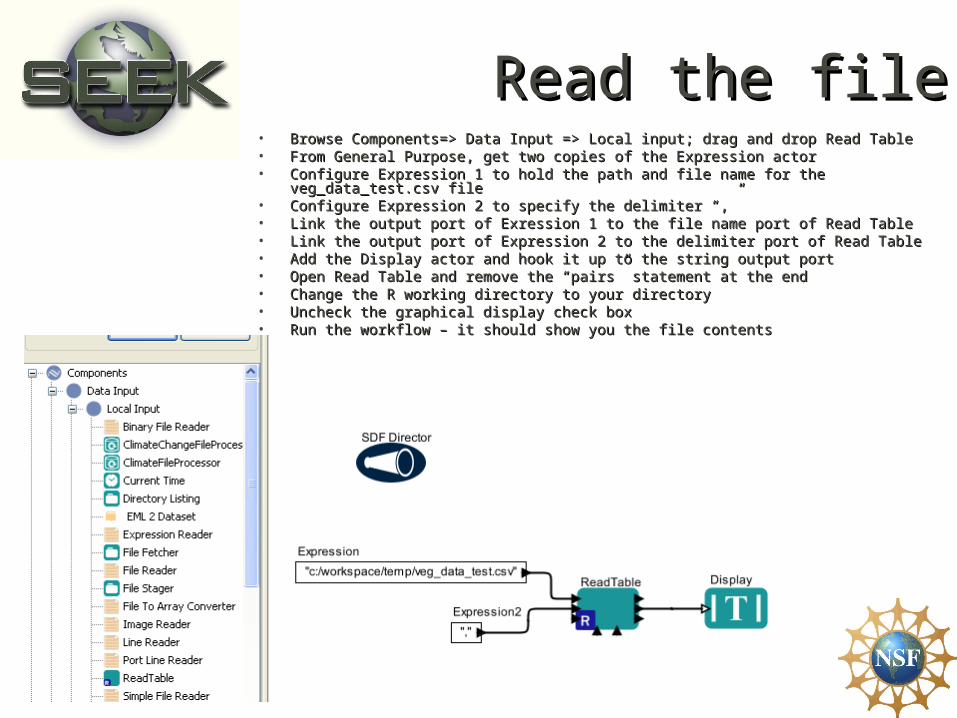
Read the fileRead the file• Browse Components=> Data Input => Local input; drag and drop Read TableBrowse Components=> Data Input => Local input; drag and drop Read Table• From General Purpose, get two copies of the Expression actorFrom General Purpose, get two copies of the Expression actor• Configure Expression 1 to hold the path and file name for the Configure Expression 1 to hold the path and file name for the
veg_data_test.csv fileveg_data_test.csv file• Configure Expression 2 to specify the delimiter “,”Configure Expression 2 to specify the delimiter “,”• Link the output port of Exression 1 to the file name port of Read TableLink the output port of Exression 1 to the file name port of Read Table• Link the output port of Expression 2 to the delimiter port of Read TableLink the output port of Expression 2 to the delimiter port of Read Table• Add the Display actor and hook it up to the string output portAdd the Display actor and hook it up to the string output port• Open Read Table and remove the “pairs” statement at the endOpen Read Table and remove the “pairs” statement at the end• Change the R working directory to your directoryChange the R working directory to your directory• Uncheck the graphical display check boxUncheck the graphical display check box• Run the workflow – it should show you the file contents Run the workflow – it should show you the file contents
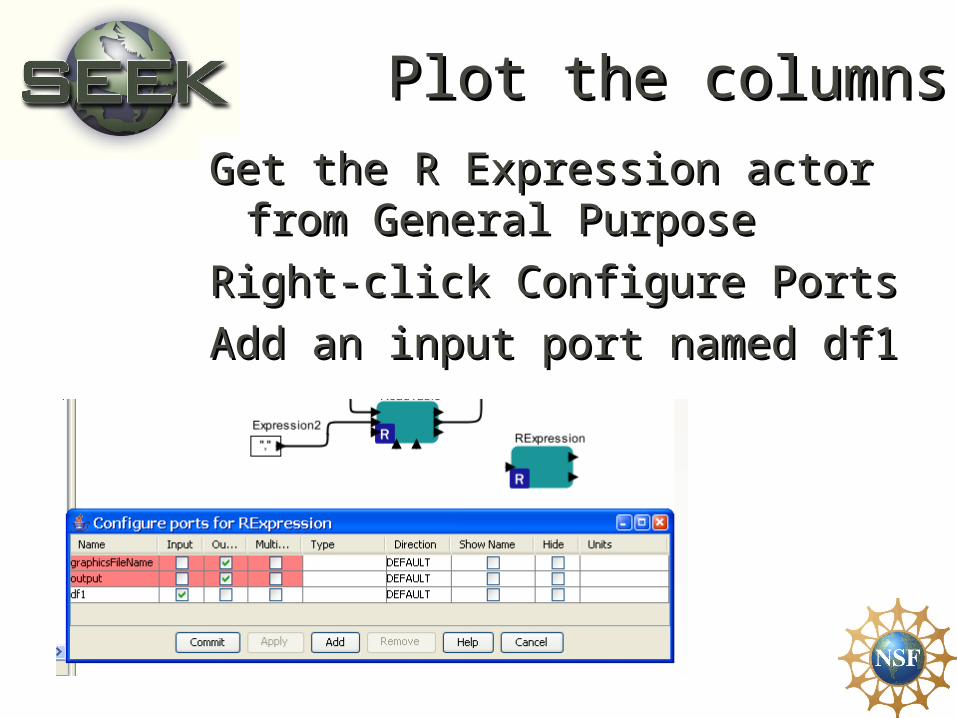
Plot the columnsPlot the columns
Get the R Expression actor from Get the R Expression actor from General PurposeGeneral Purpose
Right-click Configure PortsRight-click Configure Ports
Add an input port named df1Add an input port named df1
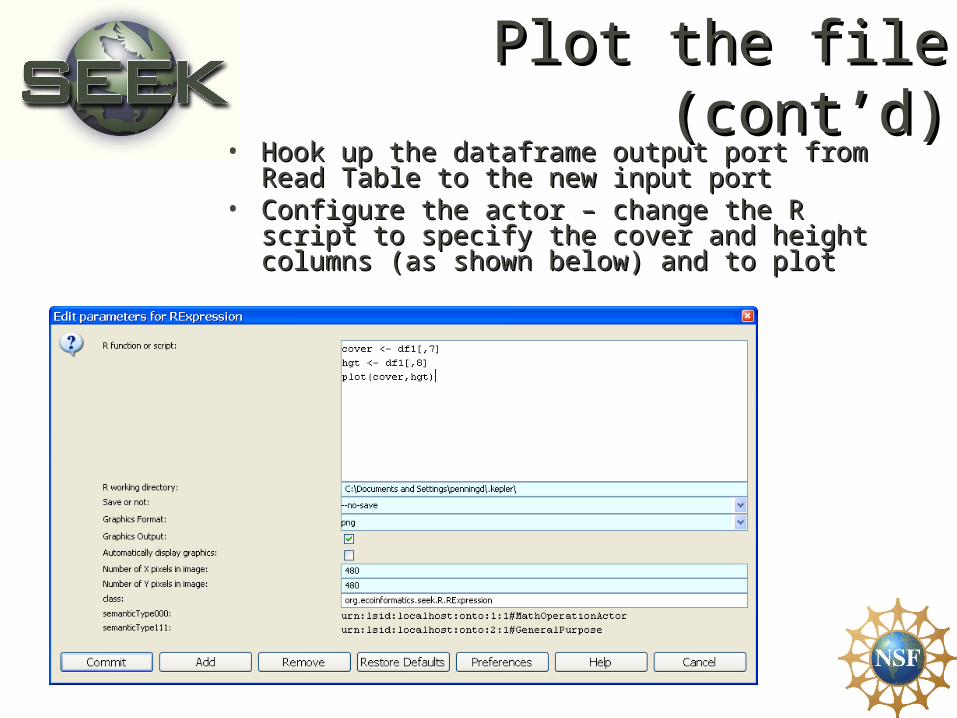
Plot the file (cont’d)Plot the file (cont’d)• Hook up the dataframe output port from Read Hook up the dataframe output port from Read
Table to the new input portTable to the new input port• Configure the actor – change the R script to Configure the actor – change the R script to
specify the cover and height columns (as specify the cover and height columns (as shown below) and to plotshown below) and to plot
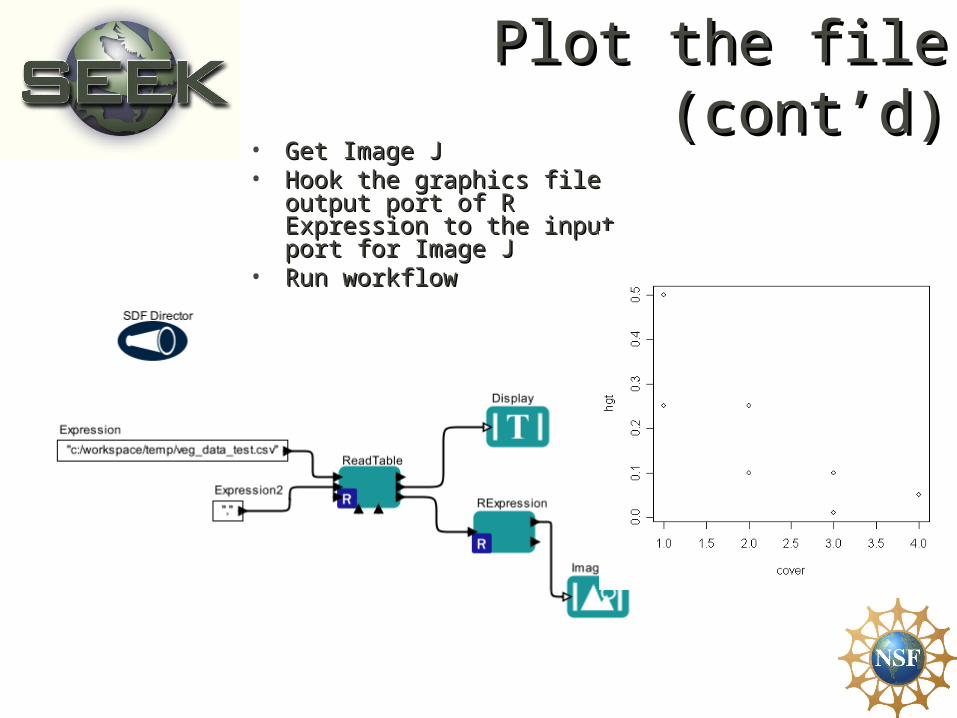
Plot the file (cont’d)Plot the file (cont’d)• Get Image JGet Image J• Hook the graphics file Hook the graphics file
output port of R Expression output port of R Expression to the input port for Image Jto the input port for Image J
• Run workflowRun workflow