Kentucky Primary Care Office
40
Kentucky Primary Care Office 2021 Needs Assessment Report
Transcript of Kentucky Primary Care Office
Kentucky
Primary Care Office
2021 Needs Assessment Report
1
This needs assessment was prepared by the University of Kentucky Prevention Research
Center. For questions about this needs assessment contact Lynn Ann Bishop, Kentucky
Primary Care Program Director, Kentucky Department for Public Health, Prevention and
Quality Improvement Division, Health Care Access Branch.
Kentucky Department for Public Health, Kentucky Primary Care Office. (2021). 2021 Needs
Assessment Report.
2
Table of Contents Introduction ............................................................................................................................................................................... 3
Methods ....................................................................................................................................................................................... 4
Secondary Data .................................................................................................................................................................... 4
Primary Care Needs Survey ............................................................................................................................................ 6
Interviews .............................................................................................................................................................................. 6
Stakeholders .............................................................................................................................................................................. 7
Kentucky Overview ................................................................................................................................................................. 8
Demographics ...................................................................................................................................................................... 8
Shortage Areas ..................................................................................................................................................................... 9
Health Professional Shortage Areas: Primary Care ......................................................................................... 9
Health Professional Shortage Areas: Dental Care ............................................................................................ 9
Health Professional Shortage Areas: Mental Health Care ........................................................................... 10
Workforce Recruitment and Retention ................................................................................................................... 11
J-1 Visa Waiver .............................................................................................................................................................. 11
National Health Service Corps Program ............................................................................................................. 11
Primary Care Needs: County Rankings ......................................................................................................................... 12
Health Status Indicators ................................................................................................................................................. 12
Health Access Indicators ................................................................................................................................................ 13
Primary Care Needs Survey and Interview Results ................................................................................................ 15
Respondent Characteristics.......................................................................................................................................... 15
Health Issues ....................................................................................................................................................................... 18
Disparate Populations .................................................................................................................................................... 18
Health Care Access ........................................................................................................................................................... 19
Emerging Factors and Successes ................................................................................................................................ 23
Challenges ............................................................................................................................................................................ 24
Primary Care Workforce ................................................................................................................................................ 25
The Road Forward ............................................................................................................................................................ 30
Conclusion ................................................................................................................................................................................ 31
References ................................................................................................................................................................................ 31
Appendix A: Rankings .......................................................................................................................................................... 32
Appendix B: List of Acronyms .......................................................................................................................................... 38
3
Introduction The 2020 Scorecard on State Health System Performance ranks Kentucky as 39 out of 51 states and the District of Columbia (The Commonwealth Fund, 2020). This ranking is unchanged from the baseline ranking in 2014. Indicators used to determine the ranking include measures of access to health care, quality of care, service use and costs, health outcomes, and income-based health care disparities. Increasing access to health care, including primary, dental, and mental health care is the focus of the Kentucky Primary Care Office (PCO). This office identifies shortage designations by facility, population or geography. Shortage destinations are used by the National Health Service Corps and others to create loan repayments, scholarships, and other incentives to encourage primary, dental, or mental health providers to practice in areas that demonstrate health care provider shortages. Bringing more health care providers to these areas will help to decrease gaps in access to care for populations that face health disparities. The Kentucky PCO received funding from the Health Resources and Services Administration (HRSA) to produce a needs assessment report that identifies communities with the greatest unmet health care needs. This includes collecting data that identifies health workforce shortages, disparities, and barriers to accessing health care for communities across the state. This document includes the results of this needs assessment, as well as recommendations for the development of an action plan that will guide the Kentucky PCO in creating steps for future program planning.

4
Methods The Kentucky PCO contracted with the University of Kentucky Prevention Research Center (UKPRC) to collaborate on developing this needs assessment. The main methods used in the needs assessment are 1) secondary data collection, 2) electronic survey, and 3) standardized interviews of key state partners.
Secondary Data
Secondary data collection includes compiling socioeconomic, health status, and health access measures. Socioeconomic data were collected to provide an overview of the state. The most recent data available were collected for health status and health access measures for each county in Kentucky. Data were collected from sources that provide county-level measurements, such as County Health Rankings. County Health Rankings uses data from other sources and these are listed below. Counties were ranked according to their measurement for each topic (health status and access), where 120 is considered the worst outcome and 1 is considered the best. Measurements that are based on small numbers are not reported, as they are unstable. The average across all items of each topic (health status and access) was then calculated and these averages were ranked to provide an overall ranking of counties for health status and access. Health status indicators:
Poor or Fair: Percentage of adults reporting fair or poor health (age-adjusted); County Health Rankings, 2020; Kentucky Behavioral Risk Factor Surveillance System, 2017.
Physical Distress: Percentage of adults reporting 14 or more days of poor physical health per month; County Health Rankings, 2020; Kentucky Behavioral Risk Factor Surveillance System, 2017.
Mental Distress: Percentage of adults reporting 14 or more days of poor mental health per month; County Health Rankings, 2020; Kentucky Behavioral Risk Factor Surveillance System, 2017.
Obesity: Percentage of the adults (age 20 and older) that report a body mass index greater than or equal to 30; County Health Rankings, 2020 United States Diabetes Surveillance System, 2016.
Diabetes: Percentage of adults (age 20 and older) who have been diagnosed with diabetes; County Health Rankings, 2020; United States Diabetes Surveillance System, 2016.
Low Birth Weight: Percentage of live births with low birthweight (< 2,500 grams); County Health Rankings, 2020; National Center for Health Statistics - Natality files, 2012-2018.
5
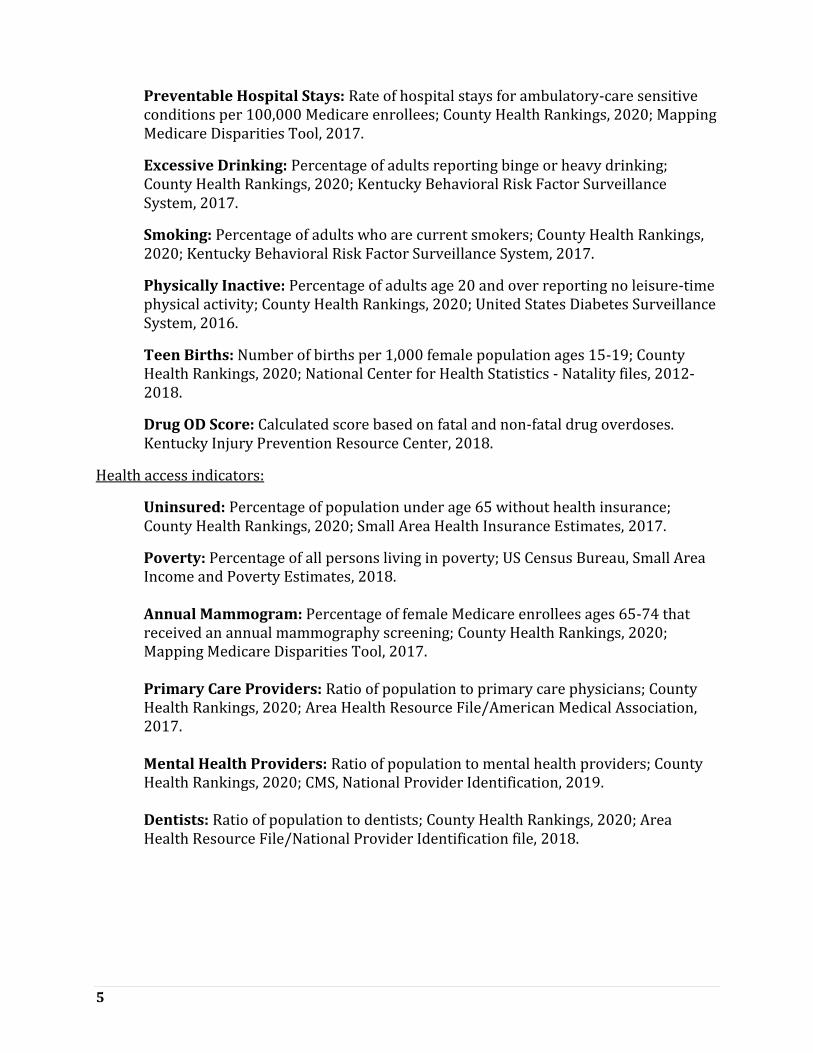
Preventable Hospital Stays: Rate of hospital stays for ambulatory-care sensitive conditions per 100,000 Medicare enrollees; County Health Rankings, 2020; Mapping Medicare Disparities Tool, 2017.
Excessive Drinking: Percentage of adults reporting binge or heavy drinking; County Health Rankings, 2020; Kentucky Behavioral Risk Factor Surveillance System, 2017.
Smoking: Percentage of adults who are current smokers; County Health Rankings, 2020; Kentucky Behavioral Risk Factor Surveillance System, 2017.
Physically Inactive: Percentage of adults age 20 and over reporting no leisure-time physical activity; County Health Rankings, 2020; United States Diabetes Surveillance System, 2016.
Teen Births: Number of births per 1,000 female population ages 15-19; County Health Rankings, 2020; National Center for Health Statistics - Natality files, 2012-2018.
Drug OD Score: Calculated score based on fatal and non-fatal drug overdoses. Kentucky Injury Prevention Resource Center, 2018.
Health access indicators:
Uninsured: Percentage of population under age 65 without health insurance; County Health Rankings, 2020; Small Area Health Insurance Estimates, 2017.
Poverty: Percentage of all persons living in poverty; US Census Bureau, Small Area Income and Poverty Estimates, 2018.
Annual Mammogram: Percentage of female Medicare enrollees ages 65-74 that received an annual mammography screening; County Health Rankings, 2020; Mapping Medicare Disparities Tool, 2017.
Primary Care Providers: Ratio of population to primary care physicians; County Health Rankings, 2020; Area Health Resource File/American Medical Association, 2017. Mental Health Providers: Ratio of population to mental health providers; County Health Rankings, 2020; CMS, National Provider Identification, 2019. Dentists: Ratio of population to dentists; County Health Rankings, 2020; Area Health Resource File/National Provider Identification file, 2018.
6
Primary Care Needs Survey
The Primary Care Needs Survey is an electronic survey of partners that was administered in Survey Monkey. The maintenance of the survey was completed by UKPRC and the distribution by the Kentucky PCO. PCO staff shared the link with state partners and asked that they complete it and share it with local partners for participation. The survey link was also shared via email with local health departments and other health groups. The survey was open for six weeks and state partners sent a reminder to the same recipients once during this time. Data collected include perceptions about primary care needs, populations facing health disparities, health care access, and workforce concerns in Kentucky. Frequencies were calculated for answer responses and results were categorized geographically for key topics.
Interviews
Standardized interviews were conducted with key state level partners by UKPRC. The Kentucky PCO identified priority partners who were considered to have important perspectives regarding health care access and workforce in Kentucky. UKPRC contacted individuals from these organizations to schedule interviews, which were conducted by phone or video conferencing (Zoom). A questionnaire was used and the interviewer took notes, as well as recorded the interview. Data were categorized into themes and results were summarized from these.

7
Stakeholders Stakeholders of the Kentucky PCO are important partners in the implementation of the office’s goals to increase access to primary, dental, and mental health care. The Kentucky PCO’s state-level stakeholders include the following organizations:
Foundation for a Healthy Kentucky
Kentucky Area Health Education Centers
Kentucky Board of Dentistry
Kentucky Board of Medical Licensure
Kentucky Cancer Consortium
Kentucky Department for Public Health
HIV Program
Infectious Disease
Laboratory Services
Maternal and Child Health
Office of Health Equity
Oral Health Program
Women’s Health
Kentucky Hospital Association
Kentucky Local Health Departments
Kentucky Primary Care Association
Kentucky Regional Health Information Organization
Kentucky Rural Health Association
Kentucky Office of Rural Health
Kentucky Youth Advocates
University of Kentucky Center of Excellence in Rural Health
8
Kentucky Overview
Kentucky is in the northern part of southeast United States and known historically for tobacco and coal production. A large part of the state is rural, including a significant area of eastern Kentucky, which is in Appalachia.
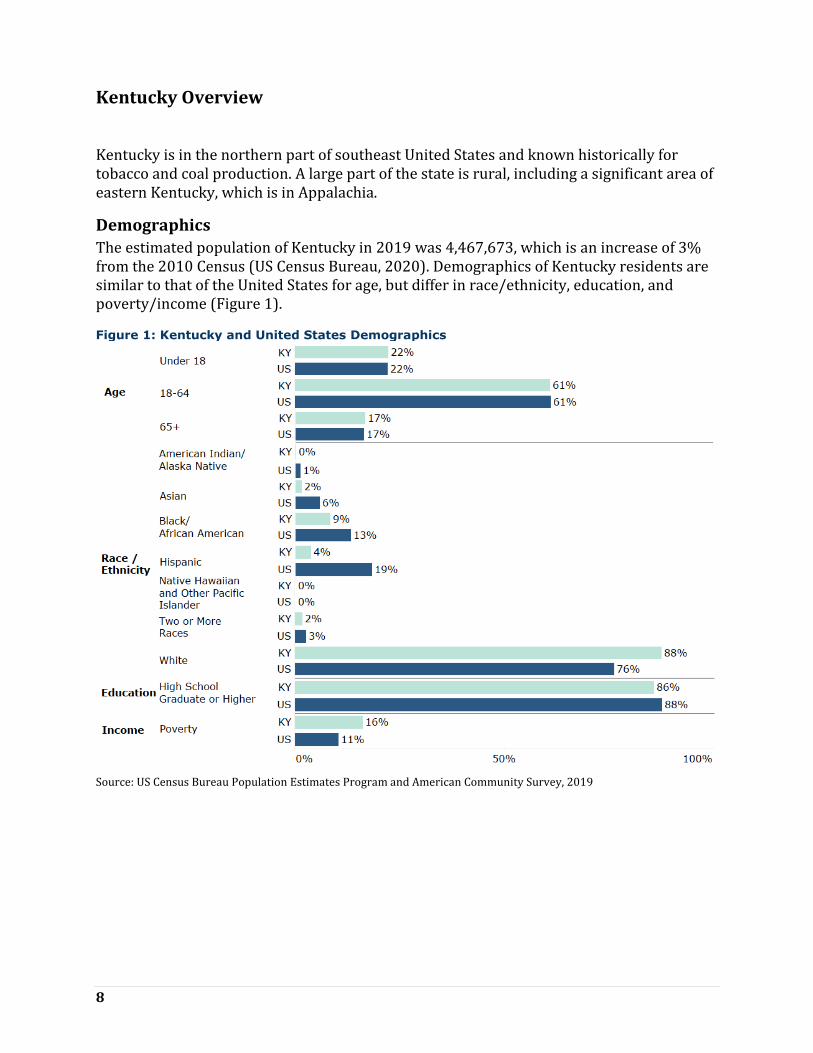
Demographics
The estimated population of Kentucky in 2019 was 4,467,673, which is an increase of 3% from the 2010 Census (US Census Bureau, 2020). Demographics of Kentucky residents are similar to that of the United States for age, but differ in race/ethnicity, education, and poverty/income (Figure 1).
Figure 1: Kentucky and United States Demographics
Source: US Census Bureau Population Estimates Program and American Community Survey, 2019

9
Shortage Areas
Areas that have been designated as having health care provider deficiencies in primary, dental, and mental health are considered to be Health Professional Shortage Areas. These designations can be based on geography, population, or facility. Medically underserved areas are areas that have a shortage of primary care providers, high infant mortality, high poverty, or high elderly population.
Health Professional Shortage Areas: Primary Care
According to 2019 HPSA designations, primary care shortages are found in all but seven counties in Kentucky (Health Resources & Services Administration, 2020). In fact, 94% of counties have a primary care shortage. A majority of the primary care HPSAs in the state are entire counties. Primary care HPSAs are found in all regions of Kentucky, with a concentration in western, southern, and eastern regions (Figure 2). Centers for Medicare and Medicaid Services (CMS) HPSA Bonus Payment Program, and the CMS Rural Health Clinic Program utilize primary care HPSAs for their programs.
Figure 2: Primary care health professional shortage areas in Kentucky, 2019 Source: data.HRSA.gov
Health Professional Shortage Areas: Dental Care
According to 2019 HPSA designations, dental care shortages are found in all but 40 counties in Kentucky (67% of the counties have a dental care shortage) (Health Resources & Services Administration, 2020). A majority of the dental care HPSAs in the state are entire counties. Dental care HPSAs are found in all regions of Kentucky, with a higher concentration in eastern Kentucky (Figure 3).
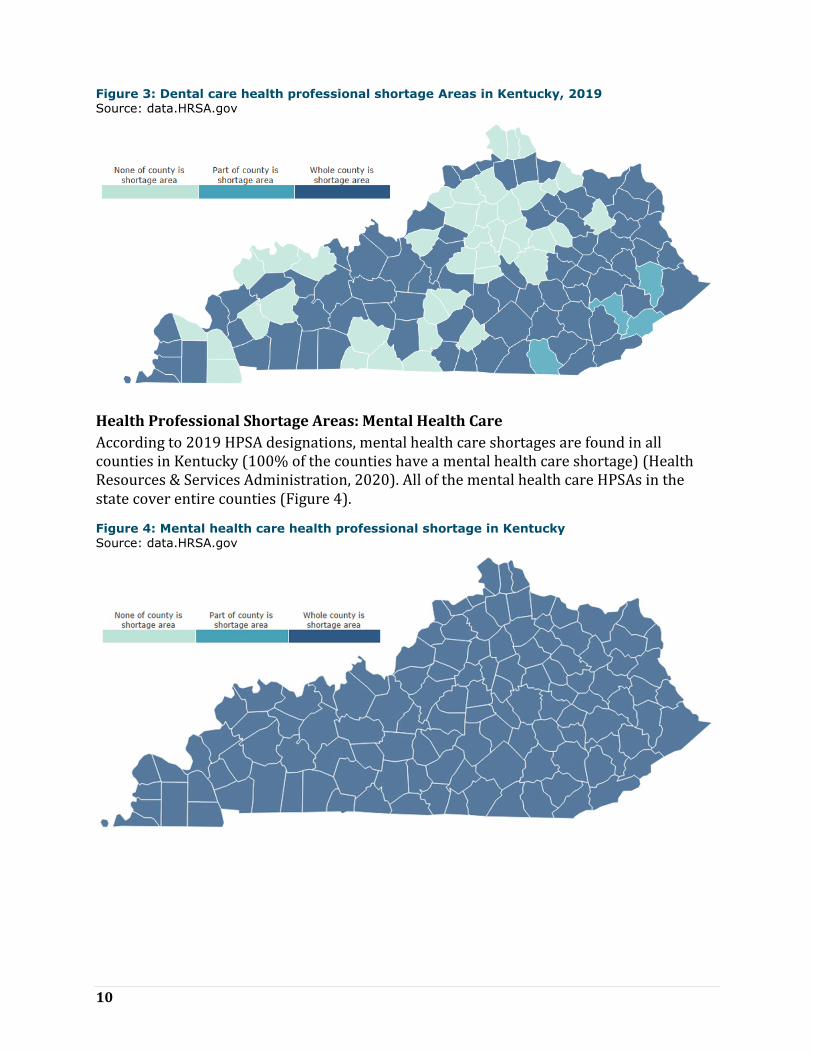
10
Figure 3: Dental care health professional shortage Areas in Kentucky, 2019
Source: data.HRSA.gov
Health Professional Shortage Areas: Mental Health Care
According to 2019 HPSA designations, mental health care shortages are found in all counties in Kentucky (100% of the counties have a mental health care shortage) (Health Resources & Services Administration, 2020). All of the mental health care HPSAs in the state cover entire counties (Figure 4).
Figure 4: Mental health care health professional shortage in Kentucky Source: data.HRSA.gov
11
Workforce Recruitment and Retention
The Kentucky PCO administers programs that improve access to health care in Kentucky by providing increased opportunities for the health care workforce. Available workforce recruitment and retention programs are described below.
J-1 Visa Waiver
A J-1 Visa Waiver provides the opportunity for international medical graduates to waive the U.S. immigration law requirement. The requirement without the waiver is to return to their home country for two years, then apply for an H-1 B visa to re-enter and work for three years in the HPSAs in the U.S. There are four types of J-1 Visa Waiver programs available for international medical graduates in Kentucky.
The State 30 Program (also known as the Conrad 30 Program): This program allows for recommendation of up to 30 international medical graduates to receive U. S. State Department waivers each fiscal year, which is from October 1 to September 30 for the state of Kentucky.
Appalachian Regional Commission J-1 Visa Waiver Program: This program creates opportunities for health care providers located in an Appalachian county in Kentucky to recruit and retain international medical graduates through the J-1 Visa Waiver program.
HHS Exchange Visitor Program: This program enables a J-1 Visa Waiver manager to offer technical assistance to program applicants, as well as coordination of program opportunities.
The Delta Regional Authority: This program enables a J-1 Visa Waiver manager to provide technical assistance and program referrals to program applicants. The Delta Regional Authority program also allows for Waiver recommendations to be made to the U. S. State Department.
National Health Service Corps Program
The National Health Service Corps (NHSC) Program is an initiative that builds capacity among the primary care workforce by connecting trained and licensed health care clinicians to NHSC-approved sites in areas with health care workforce shortages. Eligibility includes U.S. citizens who are physicians, dentists, nurse practitioners, certified nurse-midwives, physician assistants, dental hygienists, psychologists, licensed clinical social workers, psychiatric nurse specialists, marriage and family therapists, and licensed professional counselors.
NHSC Loan Repayment Program (LRP): The NHSC LRP is a competitive program that aims to increase employment of primary medical care, dental care, and mental health care providers in HPSAs. Eligible LRP applicants are fully-trained and licensed health professionals working at NHSC-approved sites. LRP recruits may receive monetary awards to assist with repayment of outstanding qualifying education loans.

12
The Kentucky State Loan Repayment Program (KSLRP): The KSLRP is a loan repayment program managed by the Kentucky Office of Rural Health. The KSLRP program provides loan repayment assistance to applicants that have qualifying education loans. Applicants must make a two-year fulltime service commitment in a HPSA in order to participate and seek a sponsoring organization that would provide 50% of the loan repayment award. The remaining dollar for dollar match is pledged from a sponsor in the community, often the clinician’s employer.
NHSC Scholarship Program (SP): The NHSC Scholarship Program provides financial assistance to health professional students in need. The NHSC SP provides assistance for tuition, fees, supplies, books and a monthly living stipend. Upon completion of their degree, recipients of the SP commit to working in an area in need of increasing access to health care for the same number of years as they received educational support.
HRSA offers several NHSC incentive programs to health care participants of the NHSC, which include the LRP, SLRP and SP. Additional HRSA incentive programs include the Substance Use Disorder Workforce LRP, the Rural Community LRP, the Students to Service LRP, and the Nurse Corps. The NHSC LRP, SP and SLRP are the programs used most often in Kentucky.
Primary Care Needs: County Rankings
Health status and health access for each county in Kentucky were ranked according to their measurement for each topic, where 120 is considered the worst outcome and 1 is considered the best. The average across all items of each topic is included in the tables. These averages were ranked to provide an overall ranking of counties for health status and access. The rankings are shaded in the tables as shown in Figure 5. Measurements without ranking numbers are not shown because of small numbers. Figure 5: Shading range (1 = best outcome/ 120= worst outcome)
Health Status Indicators
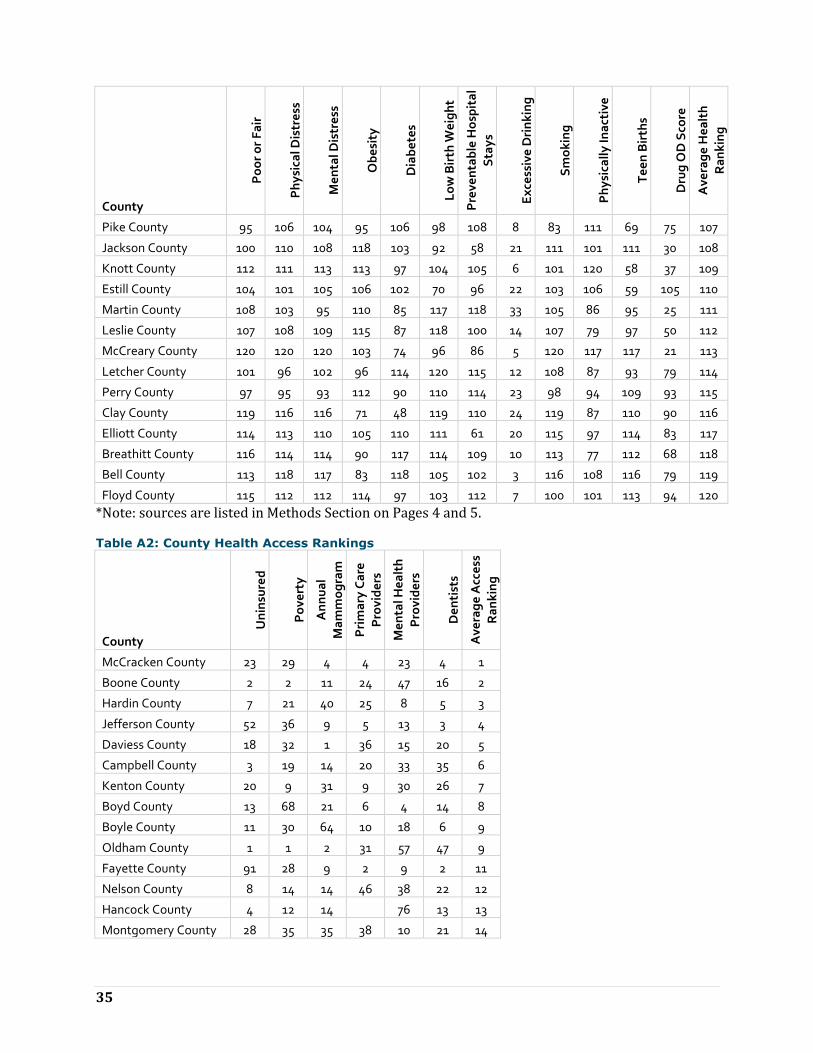
Health status indicators are measures of outcomes and factors that determine length and quality of life. Poor or fair health, physical and mental distress, and birth weight are health status indicators that are outcomes of other indicators that play a role in health status, such as tobacco use, exercise, and alcohol and drug use. Figure 6 shows the five lowest and highest ranking counties in terms of health status indicators, along with the ranking for each indicator and county. Figure 7 shows the average ranking for health status indicators geographically. The lowest ranking (better outcome) counties in terms of health status indicators are Oldham, Lyon, Woodford, Shelby, and Marshall. The highest ranking (worse outcome) counties in terms of health status indicators are Clay, Elliott, Breathitt, Bell, and Floyd. All counties and their health access rankings can be seen in Appendix A, Table A1.

13
Figure 6: Five lowest and highest ranking counties based on health status indicators
(low rank= better outcome/ high rank= worse outcome)
County
Po
or o
r F
air
Ph
ysic
al
Dis
tress
Men
tal D
istr
ess
Ob
esit
y
Dia
bete
s
Lo
w B
irth
Weig
ht
Preven
tab
le
Ho
sp
ital S
tays
Excessiv
e
Drin
kin
g
Sm
okin
g
Ph
ysic
ally
In
acti
ve
Teen
Bir
ths
Dru
g O
D S
co
re
Averag
e H
ealt
h
Ran
kin
g
Lowest ranking counties (best health status)
Oldham County 1 1 1 1 6 5 5 114 1 1 1 47 1
Lyon County 13 7 6 3 34 11 25 70 11 48 29 32 2
Woodford County 9 11 10 26 8 36 1 97 4 4 2 86 3
Shelby County 15 13 11 16 35 23 24 98 8 18 11 72 4
Marshall County 11 12 17 93 20 7 23 79 12 28 24 30 5
Highest ranking counties (worst health status)
Clay County 119 116 116 71 48 119 110 24 119 87 110 90 116
Elliott County 114 113 110 105 110 111 61 20 115 97 114 83 117
Breathitt County 116 114 114 90 117 114 109 10 113 77 112 68 118
Bell County 113 118 117 83 118 105 102 3 116 108 116 79 119
Floyd County 115 112 112 114 97 103 112 7 100 101 113 94 120
Figure 7: Average health status ranking by county
Health Access Indicators
Health access indicators are measures of access and quality of care, such as the rate of health care providers and the rate of preventable hospital stays. Accessing health care in a timely manner contributes to healthier lifestyles with an increase in prevention and early detection of diseases. Figure 8 shows the five lowest and highest ranking counties in terms

14
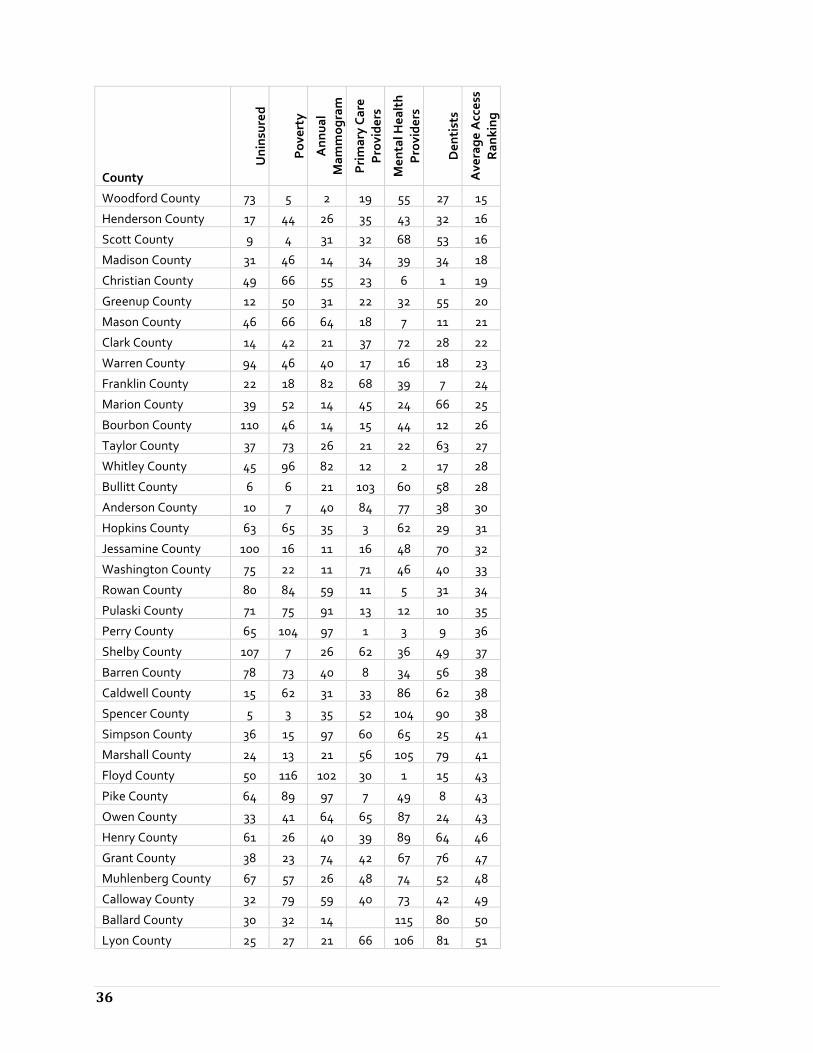
of health access indicators, along with the ranking for each indicator and county. Figure 9 shows the average ranking for health access indicators geographically. The lowest ranking (better outcome) counties in terms of health access indicators are McCracken, Boone, Hardin, Jefferson, and Daviess. The highest ranking (worse outcome) counties in terms of health access indicators are Harlan, Martin, McCreary, Clay, and Casey. All counties and their health access rankings can be seen in Appendix A, Table A2.
Figure 8: Five lowest and highest ranking counties based on health access indicators (low rank= better outcome/ high rank= worse outcome)
County Uninsured Poverty Annual
Mammogram
Primary Care
Providers
Mental Health
Providers Dentists
Average Access
Ranking
Lowest ranking counties (best health access)
McCracken County 23 29 4 4 23 4 1
Boone County 2 2 11 24 47 16 2
Hardin County 7 21 40 25 8 5 3
Jefferson County 52 36 9 5 13 3 4
Daviess County 18 32 1 36 15 20 5
Highest ranking counties (worst health access)
Harlan County 87 114 117 79 99 67 116
Martin County 88 119 111 69 88 116 117
McCreary County 111 115 116 90 50 111 118
Clay County 116 118 120 58 92 101 119
Casey County 119 98 102 115 64 108 120
Figure 9: Average health access ranking by county

15
Primary Care Needs Survey and Interview Results
Respondent Characteristics
The Primary Care Needs Survey was administered from December 2020 to January 2021. A total of 261 state and local partners and stakeholders completed the survey, representing all counties of Kentucky (Figure 9) and multiple types of organizations (Figure 10). Many respondents’ organizations served more than one county. Additionally, 18% of respondents’ organizations were statewide. Most often, respondents represented local organizations, including local health departments, schools, and community health centers or other community organizations. Most respondents’ organizations serve rural areas (Figure 11).
Interviews were conducted virtually with 12 key state partners during January 2021 to gather additional information. Participants represented the Kentucky Department for Public Health, Kentucky Primary Care Association, Area Health Education Centers, a non-profit advocacy group, state rural health agencies, and a regional health system.
Figure 9: Number of survey respondents by county of organizational service area

16
Figure 10: Survey respondent organization types
Note: ‘Other’ includes professional, religious, and local government.

17
Figure 11: Type of survey respondent organization service area- rural, urban, or suburban

18
Health Issues
Survey and interview respondents shared the information about the greatest health issues facing the communities their organizations serve. A majority of survey respondents said that one of the greatest health issues in their community is drug and alcohol abuse (Figure 12). This is followed by COVID-19 and mental health issues.
Interview data echoed survey results and provided additional context on the causes of health issues that Kentuckians face. These include poverty, low health literacy, social determinants of health, uncertainty in some medical providers, parental incarceration, and what one interviewee termed “cultural fatalism,” or the idea that certain cultural behaviors, including eating habits, are a part of the way of life in Kentucky. Another interviewee shared that Kentuckians have negative attitudes towards those outside their community that tell them their “way of life isn’t ideal,” including behaviors relating to nutrition and exercise.
Figure 12: Greatest health issues facing Kentuckians*
Note: ‘Other’ includes asthma/allergies, homicide, trauma, and aging. Percentages do not add to 100 because multiple
answers could have been selected.
Disparate Populations
Respondents shared information on populations that face health disparities, including differences in access to care and health outcomes, in the communities where they work. Survey respondents were most likely to say that low income populations face greater health disparities, followed by racial/ethnic minorities (including Black/African American, Hispanic/Latino, and indigenous populations), and elderly (Figure 13). Other populations not shown include low education; uninsured; homeless; unemployed; middle age; middle income; pregnant; lesbian, gay, bisexual, transgender, and queer (LGBTQ); the mental health population; and others. The ‘Immigrant’ category includes the following

19
populations: immigrants, undocumented immigrants, refugees, migrants, and those with English as a second language.
Interview respondents echoed these results, stating that those in poverty; minorities; uninsured and underinsured, such as the mid-low income working poor; populations with language barriers; and rural populations, including eastern and western Kentuckians face a higher degree of unmet health care needs.
Figure 13: Disparate Populations of Kentucky*
Note: Percentages do not add to 100 because multiple answers could have been selected.
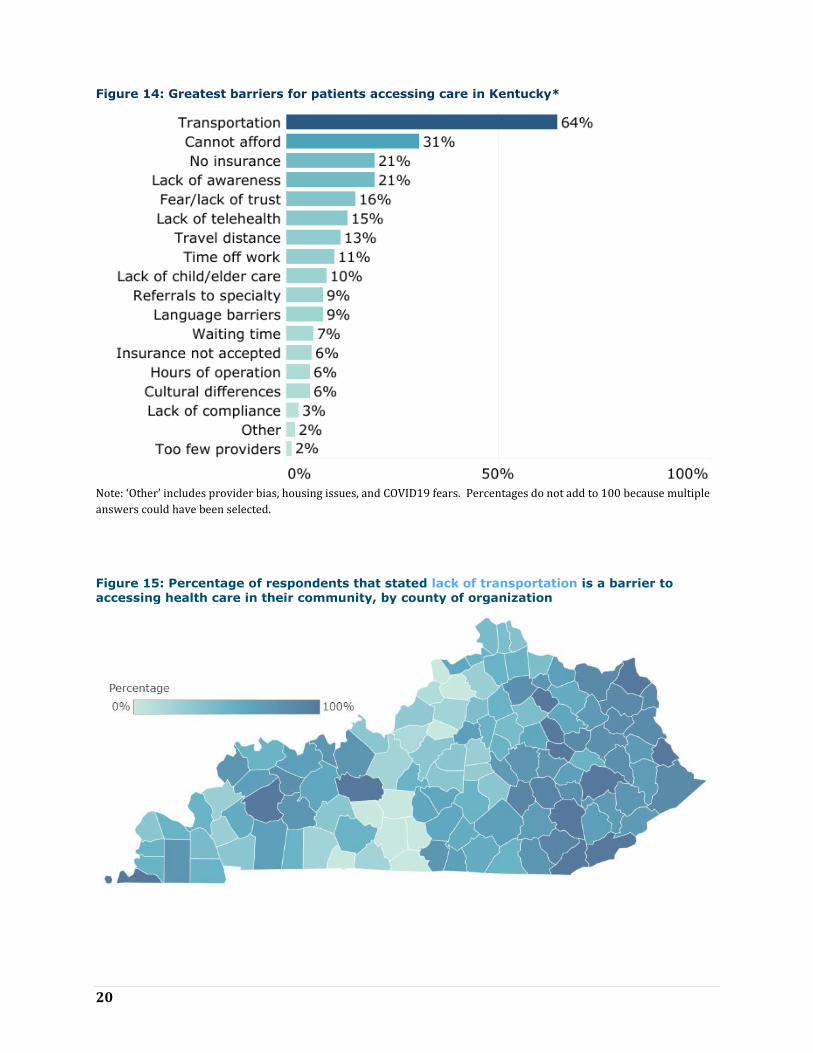
Health Care Access
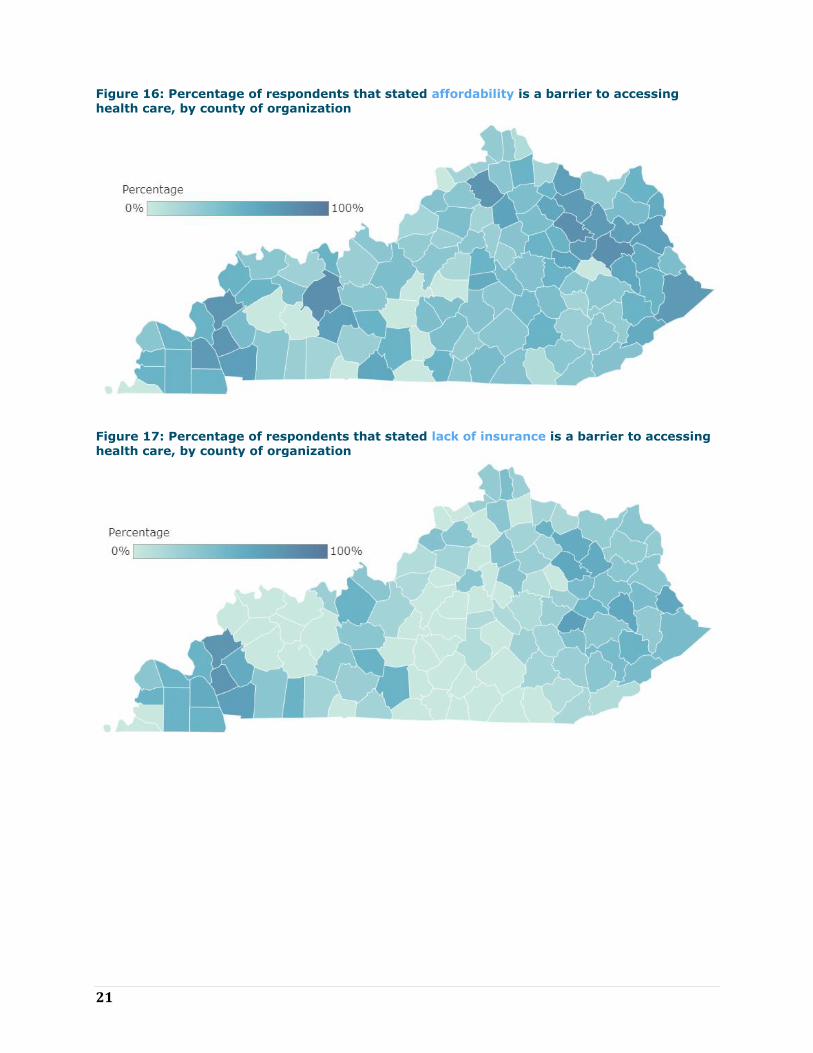
Respondents shared information on the greatest barriers that patients face when accessing care in the communities where they work (Figure 14). Transportation was cited as the greatest health access issue by survey respondents, followed by inability to afford care, lack of insurance and lack of awareness of services. Geographically, survey respondents were more likely to state that transportation, affordability, and lack of insurance were barriers to accessing health care if their organizations served counties in the eastern and western areas of the state, compared to organizations covering central Kentucky (Figures 15-17). Respondents from organizations serving western counties cited lack of awareness as a barrier more often (Figure 18).
20
Figure 14: Greatest barriers for patients accessing care in Kentucky*
Note: ‘Other’ includes provider bias, housing issues, and COVID19 fears. Percentages do not add to 100 because multiple
answers could have been selected.
Figure 15: Percentage of respondents that stated lack of transportation is a barrier to accessing health care in their community, by county of organization
21
Figure 16: Percentage of respondents that stated affordability is a barrier to accessing
health care, by county of organization
Figure 17: Percentage of respondents that stated lack of insurance is a barrier to accessing health care, by county of organization

22
Figure 18: Percentage of respondents that stated lack of awareness of services is a barrier
to accessing health care, by county of organization
Interview respondents shared additional information about health care access issues in Kentucky, including challenges relating to workforce. A lack of in-network providers, providers accepting Medicaid, and providers accepting new patients are pieces of this challenge. Multiple interviewees stated that there is a need for more dental providers that accept Medicaid, with one saying, “we definitely don’t have enough Medicaid dental providers.” This theme came up in the survey comments, as well. Another interviewee stated that there is a lack of psychiatrists in their region due to insufficient training opportunities in the state.
Aside from transportation, rural areas offer additional challenges for accessing a healthy lifestyle. Multiple interviewees stated that exercise opportunities are missing in the area where they live and work. One commented that they “don’t have the ability to go walk out on the road or run. There are coal trucks. There is no structure there for exercise."
Interviewees stated that not having health insurance is an access issue as well, specifically with non-citizens, and lack of translation services can be a barrier for this group to access care. Even with insurance, copays can cause barriers, as some individuals are unable to afford payment. Likewise, mistrust in providers or the health care system are
“We definitely don’t have
enough Medicaid dental
providers.”
We “also have to think
about health care access
as: if they build it why
don’t they come." We
need to consider
whether or not everyone
"feels respected and
valued by the health care
system."
23
barriers for some groups, including in western Louisville, northern Kentucky, and Appalachia. Interviewees stated that these groups do not feel comfortable receiving health care due to mistrust, which poses access challenges even when transportation and insurance are not issues. One interviewee said that transportation is important, but we “also have to think about health care access as: if they build it why don’t they come." We need to consider whether or not everyone "feels respected and valued by the health care system."
Emerging Factors and Successes
Emerging factors that increase access to primary care in survey respondents’ communities include telehealth and Medicaid expansion (Figure 19). Interviewees said telehealth is a facilitator to increasing access to health care because it has “opened borders” for individuals accessing primary, dental, and mental health care by eliminating or reducing many access issues, and these capabilities have been fast-tracked due to the COVID19 pandemic. Telehealth provides an opportunity for individuals without personal or public transportation to receive care. It also reduces caregiver barriers of individuals needing child or elder care in order to see a provider. Telehealth reduces stigma barriers, as well. One interviewee stated that telehealth can increase the likelihood of individuals seeking mental health care because they will not worry about being recognized at a mental health clinic in a small rural town.
Multiple interviewees stated that the implementation of Federally Qualified Health Centers (FQHC) is a success in Kentucky. One interview respondent stated that Kentucky’s FQHCs are “among the more robust and well-developed” in the nation and many offer a “full-spectrum” of care that includes primary, dental, and mental health services. Another interviewee said the integration of mental, behavioral, and primary care in FQHCs helps to reduce stigma for some individuals because “no one knows what you are coming for.”
The opening of school health centers was another example of a success shared by interviewees in Kentucky, including the offering of primary, dental, and mental health care in school settings through school based clinics and programs. An additional school health program that was noted as a success is the Public Health Dental Hygiene Program, administered by the Kentucky Oral Health Program. This program sends teams to schools in rural areas to provide preventive dental services and refers children to dental offices, often for their first visit.
Interviewees also said that the COVID19 pandemic has led to successes in primary, dental and mental health care in Kentucky. This includes the increase in telehealth; funding for providers; and increased innovation, flexibility and collaboration by providers and partners. One interviewee said it was inspiring to see providers and administrators in rural areas “adapt
Health systems are
becoming more aware as
Kentucky makes the
move to value-based
care, “recognizing that if
we are going to be
compensated for
outcomes rather than
procedure, prevention
becomes important, and
then getting into
communities becomes
important.”

24
and embrace” the situation by setting up pop-up tents to be able to see patients outside of clinics, partnering with churches and civic centers to hold screening events in larger areas, and providing tablets and internet access to patients in clinic parking lots for telehealth visits.
Other emerging factors and successes shared by interviewees include the growth of retail medicine; mobile units; leadership that prioritizes health; parity to provide insurance coverage for mental health visits; and the use and training of patient navigators or community health workers, which are seen as trusted entities in the community. One interviewee stated that a facilitator now is that health systems are becoming more aware as Kentucky makes the move to value-based care, “recognizing that if we are going to be compensated for outcomes rather than procedure, prevention becomes important, and then getting into communities becomes important.”
Figure 19: Emerging factors that are increasing primary care in Kentucky*
Note: ‘Other’ includes provider bias training, school clinics, raising awareness, church screenings, CHWs, discount
program, and walk-in clinics. Percentages do not add to 100 because multiple answers could have been selected.
Challenges
While telehealth was described by both survey and interview respondents as an aid to individuals accessing health care, many said there are challenges for telehealth. An overarching challenge is a lack of internet coverage across the state, particularly in rural areas. One interviewee said that “internet is not the same up in the hollows and in the real rural
“Internet is not the same
up in the hollows and in
the real rural parts of
Kentucky.”

25
parts of Kentucky,” with some counties having no internet service at all. This is followed by individuals not having the equipment to engage in telehealth. Additionally, if internet coverage does exist, low income individuals may be limited to a certain number of minutes on their phone plans, which reduces their ability to have a health care visit, or have a fear of using telehealth because of privacy issues (not wanting others in the patient’s home to hear or fearing there are others on the provider side listening in).
FQHCs were noted as primary, dental, and mental health care successes by interviewees, but there are a limited number of these centers in the state. An interviewee stated that, while FQHCs are helping to increase access to health care, the impact is not broad enough to reach everyone. Kentucky has Rural Health Centers (RHC), which improve access to care by being located throughout the rural areas, but according to a survey respondent, RHCs may have limited resources. Further, not all FQHCs or RHCs offer comprehensive services, such as integrated behavioral health and dental care. Mobile units were also named as a facilitator to increase access to health care, but there is currently only one dental mobile unit and more are needed to “start to answer the need in eastern Kentucky.”
Also noted by interviewees as a success was the introduction of parity to provide insurance coverage of mental health visits. However, multiple interviewees shared limitations to parity, including how much the insurance covers and loop holes which lead to gaps in reimbursement for mental health providers. Interviewees described other challenges relating to insurance, such as insufficient reimbursement for primary care providers and dentists and provider “burnout” caused by the “amount of documentation required to get reimbursement and to make sure you are hitting all the marks and checking boxes.” Another interviewee said that, with Medicaid, it takes more time to understand the system and to be reimbursed at an adequate level and not a lot of providers accept Medicaid because of that. Echoing this, a different interviewee stated that it costs the same, if not more, for dental providers to treat Medicaid patients because they need more management and time, as their presentations are usually more severe. This also reduces the willingness of some dentists to see patients with Medicaid coverage.
Other challenges in primary, dental, and mental health care shared by interviewees are the stigma around mental health, which includes individuals not wanting others to know they are being treated for a mental health issue because they fear being looked down upon. Individuals’ fears and mistrust of providers are also challenges that Kentucky faces regarding increasing access to health care, particularly for those who never or rarely receive health care. One interviewee stated that “our biggest challenge is how to reach those people and comfort them so that they will seek care.”
Primary Care Workforce
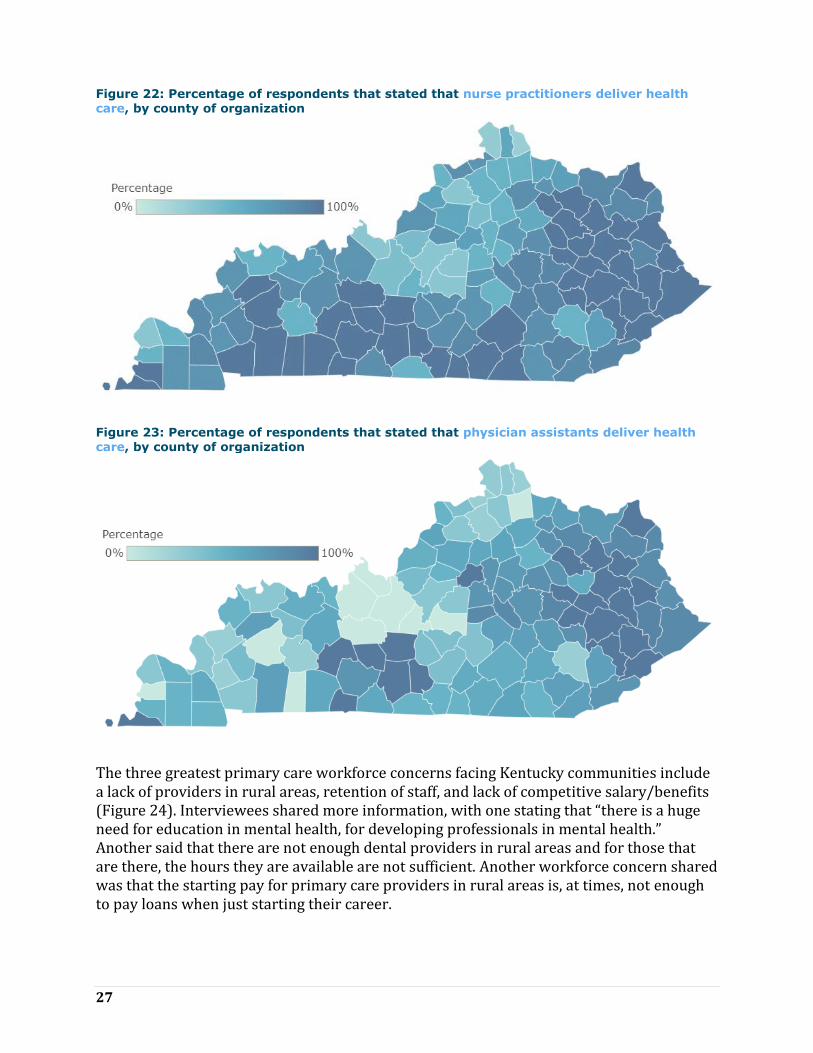
Types of providers that most often deliver health care in respondents’ communities were most commonly said to be nurse practitioners and doctors (Figure 20). Nearly half of respondents stated that physician assistants deliver health care, as well. A lower percentage of survey respondents from organizations in some central counties stated that doctors deliver health care, compared to other areas of the state (Figure 21). Similarly, a lower percentage of survey respondents from organizations in some central and northern counties stated that nurse practitioners deliver health care (Figure 22). A higher

26
percentage of survey respondents from organizations serving eastern counties stated that physician assistants delivered health care, compared to other areas (Figure 23).
Figure 20: Types of providers that deliver health care in Kentucky*
Note: ‘Other’ includes midwives, home health aides, school nurses, registered nurses, and allied health professionals.
Percentages do not add to 100 because multiple answers could have been selected.
Figure 21: Percentage of respondents that stated that doctors deliver health care, by county
of organization
27
Figure 22: Percentage of respondents that stated that nurse practitioners deliver health
care, by county of organization
Figure 23: Percentage of respondents that stated that physician assistants deliver health care, by county of organization
The three greatest primary care workforce concerns facing Kentucky communities include a lack of providers in rural areas, retention of staff, and lack of competitive salary/benefits (Figure 24). Interviewees shared more information, with one stating that “there is a huge need for education in mental health, for developing professionals in mental health.” Another said that there are not enough dental providers in rural areas and for those that are there, the hours they are available are not sufficient. Another workforce concern shared was that the starting pay for primary care providers in rural areas is, at times, not enough to pay loans when just starting their career.

28
When asked if the primary care workforce in Kentucky is strong or weak, most interviewees said that while the state’s providers are dedicated and committed, the workforce numbers are weak. One person stated, “I think [the primary care workforce is] weak because we’ve created structures that reduce the attractiveness of being in primary care—the amount of burden on primary care [providers] to be all things to all people.” However, multiple interviewees also said that progress has been made in the primary care workforce in Kentucky in recent years, such as increasing numbers of nurse practitioners and physician assistants providing care, which allows providers to work “at the scope of their license.”
Regarding the dental workforce, interviewees stated the numbers are weak. One interviewee said, “availability does not always equal access" because dentists limit the number of Medicaid patients they see (as described earlier). Many interviewees stated that the dental workforce in Kentucky has “maldistribution.” While the ratio of people to dentists in Kentucky is close to that of the nation and there are enough dentists to address the need in urban and suburban areas of the state, there are many rural areas with too few dentists to serve the needs of residents. Some rural counties in both western and eastern Kentucky have no dentist at all, do not have dentists that accept Medicaid, or lack dentist that are trained in pediatrics.
The mental health workforce was described by interviewees as weak. One interviewee stated that part of the challenge relates back to reimbursement and compensation levels, which are not adequate to attract or keep this workforce. This includes payments for psychologists, psychiatrists, and licensed clinical social workers, which all need compensation levels that will attract them to do a demanding role. Another interviewee said that the mental health workforce in Kentucky has made progress because of an increase in awareness and recognition of mental health issues, but overall it is weak due to being overwhelmed with the opioid crisis and substance use disorder. Multiple interviewees stated that there is an increased need for behavioral health nurse practitioners. One described a challenge that there are currently not enough behavioral health nurse practitioners in the state to serve as preceptors to train the amount of these practitioners we need for the next generation.
“I think [the primary
care workforce is] weak
because we’ve created
structures that reduce
the attractiveness of
being in primary care—
the amount of burden on
primary care [providers]
to be all things to all
people.”

29
Figure 24: Primary care workforce concerns*
Note: ‘Other’ includes lack of recognition programs, not having enough time with patients, providers not accepting new
patients, lack of practice sites, long wait times for new patients, and a need for CHWs and reimbursement for these.
Percentages do not add to 100 because multiple answers could have been selected.
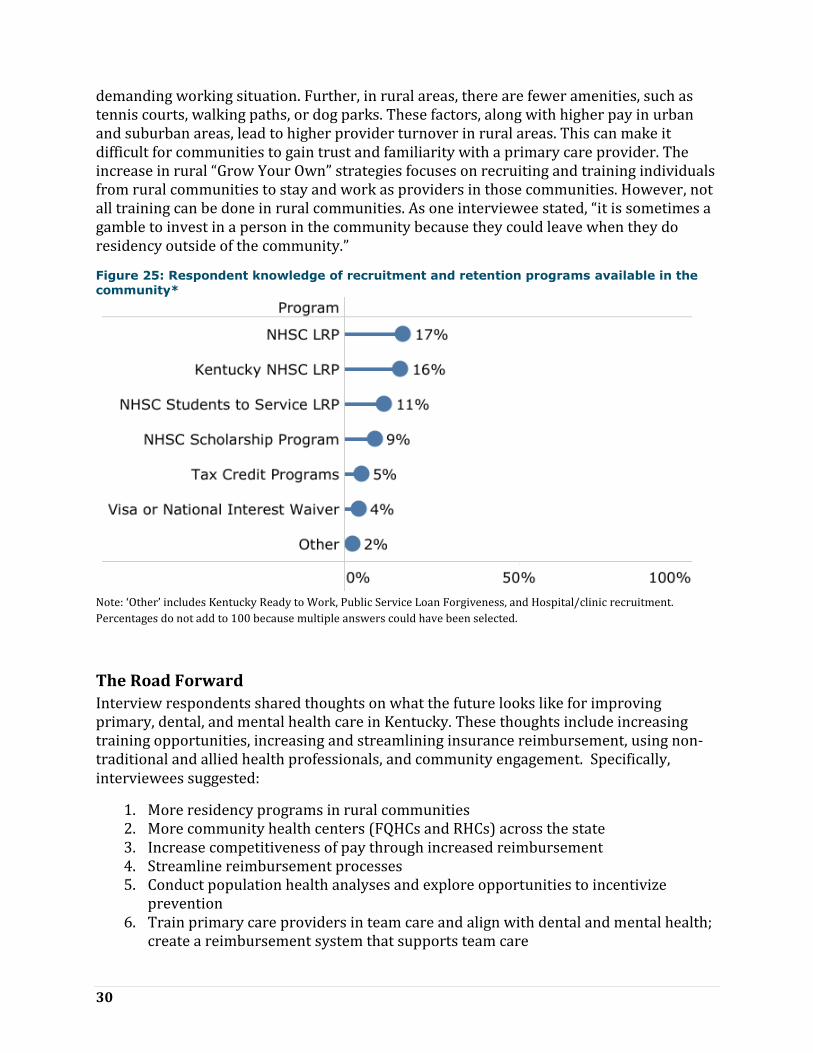
Survey respondents were more likely to state that the NHSC Loan Repayment Program and the Kentucky NHSC Loan Repayment Program were available programs in their community (Figure 25). Nearly three fourths of respondents left this question blank or stated they were unsure of what programs were available.
Benefits of these programs cited by both survey and interview respondents are that they assist the provider by paying back education loans, encourage providers to work in rural areas they may not have chosen otherwise, and increase diversity of smaller communities. Recruitment and retention programs also increase the participating site’s ability to compete with larger, higher paying hospitals or clinics.
Challenges of these programs are that the participating provider may leave the assigned area after the commitment is over, the application process is cumbersome, awareness of the programs is low, and a lack of provider interest to participate, despite the benefits. Also, there are often financial requirements to participate that might be challenging for smaller clinics or hospitals. Another challenge noted by an interviewee is that when recruitment and retention programs bring in foreign trained providers, rural communities may have resentment and mistrust initially toward the provider.
Many interviewees stated that working in a rural area may be less enticing to a new graduate because they will be less likely to have equipment needed or a smaller team to work with, which may mean a more
“It is sometimes a
gamble to invest in a
person in the community
because they could leave
when they do residency
outside of the
community.”
30
demanding working situation. Further, in rural areas, there are fewer amenities, such as tennis courts, walking paths, or dog parks. These factors, along with higher pay in urban and suburban areas, lead to higher provider turnover in rural areas. This can make it difficult for communities to gain trust and familiarity with a primary care provider. The increase in rural “Grow Your Own” strategies focuses on recruiting and training individuals from rural communities to stay and work as providers in those communities. However, not all training can be done in rural communities. As one interviewee stated, “it is sometimes a gamble to invest in a person in the community because they could leave when they do residency outside of the community.”
Figure 25: Respondent knowledge of recruitment and retention programs available in the
community*
Note: ‘Other’ includes Kentucky Ready to Work, Public Service Loan Forgiveness, and Hospital/clinic recruitment.
Percentages do not add to 100 because multiple answers could have been selected.
The Road Forward
Interview respondents shared thoughts on what the future looks like for improving primary, dental, and mental health care in Kentucky. These thoughts include increasing training opportunities, increasing and streamlining insurance reimbursement, using non-traditional and allied health professionals, and community engagement. Specifically, interviewees suggested:
1. More residency programs in rural communities 2. More community health centers (FQHCs and RHCs) across the state 3. Increase competitiveness of pay through increased reimbursement 4. Streamline reimbursement processes 5. Conduct population health analyses and explore opportunities to incentivize
prevention 6. Train primary care providers in team care and align with dental and mental health;
create a reimbursement system that supports team care
31
7. Look beyond traditional clinicians to allied health practitioners 8. Focus on training behavioral health nurse practitioners 9. Increase use of community health workers and explore Medicaid reimbursement 10. Engage communities by exploring social determinants of health with community
members, including system barriers that affect vulnerable populations (inadequate housing, water, etc.)
Conclusion According to Kentucky PCO stakeholders, Kentucky has made progress toward overcoming challenges related to primary care in recent years. The implementation of FQHCs, RHCs, mobile units, and telehealth has increased access to primary, dental, and mental health care services for Kentuckians, and begins to bridge the health care gap for those disparately affected by limited access, such as low income and racial/ethnic minorities. However, challenges still exist and more is needed to increase access and improve health outcomes in HPSA designated areas and counties with worse health status and access rankings in western, southern and eastern sections of the state. More FQHCs are needed to reach Kentuckians in these areas, RHCs that are already in these areas need a broader range of services and more resources, affordable broadband connectivity is still needed in some rural counties, and transportation remains a challenge for many. Leading primary care workforce concerns include a lack of providers in rural areas and low retention of primary care staff, which stem from a lack of competitive pay and reimbursement issues. To overcome these challenges, Kentucky PCO stakeholders recommend building training and educational capacity locally for the primary, dental, and mental health care workforce, exploring improvements to reimbursements for providers, increasing awareness of workforce recruitment and retention programs, and increasing the use of community health workers, allied health professionals, and behavioral health nurse practitioners.
References Health Resources & Services Administration. (2020, 12 2). Data by Geography, Kentucky.
Retrieved from Health Resources & Services Administration:
https://data.hrsa.gov/geo
Robert Wood Johnson Foundation. (2020, 12 2). Kentucky County Health Rankings.
Retrieved from County Health Rankings:
https://www.countyhealthrankings.org/app/kentucky/2020/overview
The Commonwealth Fund. (2020). 2020 Scorecard on State Health System Performance.
New York: The Commonwealth Fund.
US Census Bureau. (2020, 12 2). US and KY Quickfacts. Retrieved from US Census Bureau:
https://www.census.gov/quickfacts/fact/table/US/PST045219?

32
Appendix A: Rankings Table A1: County Health Status Rankings *
County P
oo
r o
r F
air
Ph
ysi
cal D
istr
ess
Me
nta
l Dis
tre
ss
Ob
esi
ty
Dia
be
tes
Lo
w B
irth
We
igh
t
Pre
ven
tab
le H
osp
ita
l
Sta
ys
Ex
cess
ive
Dri
nk
ing
Sm
ok
ing
Ph
ysi
call
y In
act
ive
Te
en
Bir
ths
Dru
g O
D S
core
Ave
rag
e H
ea
lth
Ra
nk
ing
Oldham County 1 1 1 1 6 5 5 114 1 1 1 47 1
Lyon County 13 7 6 3 34 11 25 70 11 48 29 32 2
Woodford County 9 11 10 26 8 36 1 97 4 4 2 86 3
Shelby County 15 13 11 16 35 23 24 98 8 18 11 72 4
Marshall County 11 12 17 93 20 7 23 79 12 28 24 30 5
Boone County 3 3 3 59 20 4 31 117 3 11 5 100 6
Fayette County 5 9 16 4 13 53 6 119 17 2 7 109 7
Daviess County 18 23 22 19 43 22 10 86 2 27 40 57 8
Nelson County 6 6 9 55 28 40 3 108 7 19 20 83 9
Scott County 7 8 8 45 3 34 40 115 6 20 10 97 10
Warren County 17 25 19 11 3 69 52 112 21 7 6 57 11
Trigg County 30 19 21 32 64 6 13 82 26 42 51 18 12
Campbell County 12 15 15 23 10 32 49 118 14 8 13 113 13
Calloway County 51 49 51 34 11 3 68 111 16 22 3 10 14
Boyle County 23 42 28 8 76 45 27 87 27 3 23 68 15
Henry County 45 41 43 9 17 17 34 68 38 9 39 101 16
Livingston County 33 38 42 26 9 31 97 60 23 48 44 18 17
Kenton County 2 4 5 35 26 63 21 120 40 14 21 118 17
Spencer County 4 2 2 73 113 19 45 109 5 35 9 68 19
Hancock County 39 21 33 18 90 9 2 96 47 39 84 7 20
Pendleton County 14 14 14 35 1 37 53 106 22 20 55 115 21
Caldwell County 28 43 39 39 81 26 32 59 19 28 90 9 22
Washington County 21 34 23 50 87 51 16 85 24 13 18 75 23
Meade County 27 27 20 74 68 10 56 104 48 42 16 7 24
Breckinridge County 49 44 45 2 53 46 78 64 65 14 26 18 25
Bourbon County 41 37 36 14 20 48 51 61 31 46 22 97 25
Madison County 19 35 35 55 16 78 18 110 9 5 8 120 27
Clark County 16 18 24 67 20 77 12 66 10 26 62 120 28
Jessamine County 32 31 27 39 41 59 9 94 28 36 12 113 29
Jefferson County 34 16 7 25 39 81 46 116 20 12 17 113 30
Bullitt County 8 5 4 49 101 20 76 107 18 31 15 100 31
Harrison County 25 28 32 59 14 42 35 78 25 58 49 90 32
McCracken County 47 36 25 13 28 64 30 113 42 32 48 61 33
Carlisle County 67 78 78 6 18 1 63 43 62 73 54 7 34

33
County
Po
or
or
Fa
ir
Ph
ysi
cal D
istr
ess
Me
nta
l Dis
tre
ss
Ob
esi
ty
Dia
be
tes
Lo
w B
irth
We
igh
t
Pre
ven
tab
le H
osp
ita
l
Sta
ys
Ex
cess
ive
Dri
nk
ing
Sm
ok
ing
Ph
ysi
call
y In
act
ive
Te
en
Bir
ths
Dru
g O
D S
core
Ave
rag
e H
ea
lth
Ra
nk
ing
Mercer County 36 40 38 7 76 73 43 80 34 34 36 54 35
Mason County 43 32 40 48 43 29 11 50 66 63 52 80 36
Anderson County 10 10 13 78 81 14 37 101 15 81 33 91 37
Bracken County 52 51 54 24 12 90 15 84 41 48 34 64 38
Hopkins County 24 30 37 65 79 41 60 25 32 70 87 22 39
Larue County 55 47 47 67 15 58 81 62 49 46 37 14 40
Green County 46 55 50 50 39 35 88 27 43 45 53 47 40
Fleming County 38 56 61 45 55 33 59 92 59 30 32 25 42
Crittenden County 54 54 56 19 3 38 119 81 56 39 66 9 43
Hardin County 22 22 18 88 62 13 66 99 45 58 28 75 44
Franklin County 31 17 12 81 51 89 64 102 13 16 25 104 45
Simpson County 37 33 34 90 57 83 91 88 39 10 38 25 46
Edmonson County 59 58 58 70 96 2 73 76 54 6 27 54 47
Logan County 53 48 52 94 6 16 80 93 63 33 73 27 48
Garrard County 35 24 30 96 99 88 17 89 30 22 47 63 49
Gallatin County 20 26 29 15 71 74 19 100 44 58 68 117 50
Butler County 57 66 75 19 62 8 83 58 74 53 76 14 51
Ballard County 40 39 44 72 90 67 55 56 33 114 50 4 52
Hickman County 93 88 94 12 64 21 111 9 70 89 19 2 53
Owen County 44 29 31 57 110 55 8 83 37 84 31 114 54
Hart County 81 86 80 16 1 24 48 31 78 89 81 70 55
Muhlenberg County 63 71 55 59 36 30 70 38 55 84 91 38 56
Trimble County 29 20 26 78 79 80 72 95 35 70 43 72 57
Cumberland County 70 59 66 82 93 25 116 30 50 64 57 4 58
Metcalfe County 89 94 92 39 43 15 39 28 94 75 98 12 59
McLean County 48 50 49 87 112 115 22 37 36 58 71 47 60
Graves County 65 72 63 53 36 12 101 63 60 110 64 37 61
Taylor County 72 74 79 58 24 61 57 46 58 62 46 102 62
Barren County 84 87 77 43 32 27 36 49 67 109 80 57 63
Marion County 75 67 65 78 57 71 7 41 86 113 41 49 64
Todd County 50 60 57 59 28 68 89 69 64 115 30 65 65
Robertson County 90 92 97 5 120 75 69 13 81 38 12 66
Menifee County 69 64 53 33 119 18 41 45 46 76 102 92 67
Allen County 56 52 59 85 36 97 67 77 61 118 35 21 68
Webster County 73 61 71 59 48 85 54 57 85 53 92 32 69
Montgomery County 58 73 72 31 66 76 4 35 84 82 88 108 70

34
County
Po
or
or
Fa
ir
Ph
ysi
cal D
istr
ess
Me
nta
l Dis
tre
ss
Ob
esi
ty
Dia
be
tes
Lo
w B
irth
We
igh
t
Pre
ven
tab
le H
osp
ita
l
Sta
ys
Ex
cess
ive
Dri
nk
ing
Sm
ok
ing
Ph
ysi
call
y In
act
ive
Te
en
Bir
ths
Dru
g O
D S
core
Ave
rag
e H
ea
lth
Ra
nk
ing
Russell County 80 79 82 26 41 86 29 19 76 80 99 85 71
Henderson County 42 45 46 59 95 108 74 91 52 48 77 49 72
Boyd County 26 46 41 109 84 100 71 42 53 56 60 117 73
Carroll County 61 69 62 10 55 62 103 67 68 42 101 107 74
Laurel County 62 75 73 98 87 52 42 48 51 82 75 63 75
Christian County 60 80 67 47 18 79 77 103 88 53 107 30 76
Pulaski County 74 84 81 76 70 39 26 55 97 66 82 61 77
Grant County 64 62 64 39 68 49 14 90 80 99 72 113 78
Union County 71 57 60 22 72 116 87 72 69 100 74 21 79
Adair County 66 70 76 111 103 44 79 75 72 70 14 41 79
Greenup County 86 53 48 108 108 60 85 44 29 67 45 97 81
Ohio County 79 65 70 65 51 43 62 71 71 115 104 54 82
Morgan County 96 91 87 86 25 99 20 65 102 73 61 59 83
Fulton County 105 100 100 100 57 102 95 11 99 24 83 1 84
Powell County 76 76 83 30 105 57 38 73 91 39 119 104 85
Rowan County 68 98 101 90 53 82 84 105 90 37 4 81 86
Bath County 88 85 91 116 46 28 44 39 77 104 94 87 87
Monroe County 78 68 69 77 114 66 120 52 82 92 56 41 88
Whitley County 99 104 98 38 28 113 33 40 92 97 103 70 88
Lincoln County 92 83 86 89 99 91 50 36 79 24 89 98 90
Wayne County 102 97 89 107 57 72 28 26 93 101 105 42 91
Owsley County 103 107 107 120 27 93 104 15 109 17 78 41 92
Rockcastle County 77 82 74 44 61 106 98 74 89 91 42 85 93
Clinton County 85 89 99 54 75 65 113 29 87 95 100 33 94
Nicholas County 87 90 90 35 86 87 75 53 96 104 79 47 95
Lewis County 91 93 96 117 66 56 47 47 104 107 70 37 96
Grayson County 83 81 84 83 78 47 92 54 95 93 65 79 97
Johnson County 94 63 68 119 106 95 99 17 57 95 67 58 98
Casey County 98 102 103 52 73 50 106 32 110 52 96 88 99
Carter County 82 77 85 100 83 54 65 51 73 119 86 106 100
Lawrence County 106 99 88 102 116 112 90 34 75 68 63 37 101
Wolfe County 118 119 119 67 46 84 82 1 118 111 118 26 102
Knox County 117 115 115 99 48 109 93 4 117 77 106 15 103
Magoffin County 110 105 106 74 93 101 94 18 106 56 108 47 104
Lee County 109 109 111 103 32 94 107 16 112 69 85 76 105
Harlan County 111 117 118 29 108 107 117 2 114 65 115 51 106
35
County
Po
or
or
Fa
ir
Ph
ysi
cal D
istr
ess
Me
nta
l Dis
tre
ss
Ob
esi
ty
Dia
be
tes
Lo
w B
irth
We
igh
t
Pre
ven
tab
le H
osp
ita
l
Sta
ys
Ex
cess
ive
Dri
nk
ing
Sm
ok
ing
Ph
ysi
call
y In
act
ive
Te
en
Bir
ths
Dru
g O
D S
core
Ave
rag
e H
ea
lth
Ra
nk
ing
Pike County 95 106 104 95 106 98 108 8 83 111 69 75 107
Jackson County 100 110 108 118 103 92 58 21 111 101 111 30 108
Knott County 112 111 113 113 97 104 105 6 101 120 58 37 109
Estill County 104 101 105 106 102 70 96 22 103 106 59 105 110
Martin County 108 103 95 110 85 117 118 33 105 86 95 25 111
Leslie County 107 108 109 115 87 118 100 14 107 79 97 50 112
McCreary County 120 120 120 103 74 96 86 5 120 117 117 21 113
Letcher County 101 96 102 96 114 120 115 12 108 87 93 79 114
Perry County 97 95 93 112 90 110 114 23 98 94 109 93 115
Clay County 119 116 116 71 48 119 110 24 119 87 110 90 116
Elliott County 114 113 110 105 110 111 61 20 115 97 114 83 117
Breathitt County 116 114 114 90 117 114 109 10 113 77 112 68 118
Bell County 113 118 117 83 118 105 102 3 116 108 116 79 119
Floyd County 115 112 112 114 97 103 112 7 100 101 113 94 120
*Note: sources are listed in Methods Section on Pages 4 and 5. Table A2: County Health Access Rankings
County
Un
insu
red
Po
vert
y
An
nu
al
Ma
mm
og
ram
Pri
ma
ry C
are
Pro
vid
ers
Me
nta
l He
alt
h
Pro
vid
ers
De
nti
sts
Ave
rag
e A
cce
ss
Ra
nk
ing
McCracken County 23 29 4 4 23 4 1
Boone County 2 2 11 24 47 16 2
Hardin County 7 21 40 25 8 5 3
Jefferson County 52 36 9 5 13 3 4
Daviess County 18 32 1 36 15 20 5
Campbell County 3 19 14 20 33 35 6
Kenton County 20 9 31 9 30 26 7
Boyd County 13 68 21 6 4 14 8
Boyle County 11 30 64 10 18 6 9
Oldham County 1 1 2 31 57 47 9
Fayette County 91 28 9 2 9 2 11
Nelson County 8 14 14 46 38 22 12
Hancock County 4 12 14 76 13 13
Montgomery County 28 35 35 38 10 21 14
36
County
Un
insu
red
Po
vert
y
An
nu
al
Ma
mm
og
ram
Pri
ma
ry C
are
Pro
vid
ers
Me
nta
l He
alt
h
Pro
vid
ers
De
nti
sts
Ave
rag
e A
cce
ss
Ra
nk
ing
Woodford County 73 5 2 19 55 27 15
Henderson County 17 44 26 35 43 32 16
Scott County 9 4 31 32 68 53 16
Madison County 31 46 14 34 39 34 18
Christian County 49 66 55 23 6 1 19
Greenup County 12 50 31 22 32 55 20
Mason County 46 66 64 18 7 11 21
Clark County 14 42 21 37 72 28 22
Warren County 94 46 40 17 16 18 23
Franklin County 22 18 82 68 39 7 24
Marion County 39 52 14 45 24 66 25
Bourbon County 110 46 14 15 44 12 26
Taylor County 37 73 26 21 22 63 27
Whitley County 45 96 82 12 2 17 28
Bullitt County 6 6 21 103 60 58 28
Anderson County 10 7 40 84 77 38 30
Hopkins County 63 65 35 3 62 29 31
Jessamine County 100 16 11 16 48 70 32
Washington County 75 22 11 71 46 40 33
Rowan County 80 84 59 11 5 31 34
Pulaski County 71 75 91 13 12 10 35
Perry County 65 104 97 1 3 9 36
Shelby County 107 7 26 62 36 49 37
Barren County 78 73 40 8 34 56 38
Caldwell County 15 62 31 33 86 62 38
Spencer County 5 3 35 52 104 90 38
Simpson County 36 15 97 60 65 25 41
Marshall County 24 13 21 56 105 79 41
Floyd County 50 116 102 30 1 15 43
Pike County 64 89 97 7 49 8 43
Owen County 33 41 64 65 87 24 43
Henry County 61 26 40 39 89 64 46
Grant County 38 23 74 42 67 76 47
Muhlenberg County 67 57 26 48 74 52 48
Calloway County 32 79 59 40 73 42 49
Ballard County 30 32 14 115 80 50
Lyon County 25 27 21 66 106 81 51

37
County
Un
insu
red
Po
vert
y
An
nu
al
Ma
mm
og
ram
Pri
ma
ry C
are
Pro
vid
ers
Me
nta
l He
alt
h
Pro
vid
ers
De
nti
sts
Ave
rag
e A
cce
ss
Ra
nk
ing
Meade County 16 11 64 97 66 82 52
McLean County 42 23 5 98 115 53
Mercer County 53 17 59 88 41 84 54
Johnson County 41 91 82 14 31 89 55
Harrison County 43 37 74 53 85 61 56
Bracken County 26 10 40 86 108 83 56
Letcher County 40 107 74 27 61 50 58
Menifee County 66 99 82 44 11 65 59
Livingston County 19 23 26 74 111 114 59
Union County 83 44 5 100 97 41 61
Logan County 70 62 5 80 83 71 62
Graves County 96 51 50 75 63 39 63
Grayson County 79 80 82 29 52 54 64
Ohio County 47 54 5 81 96 93 64
Cumberland County 92 87 97 49 19 36 66
Crittenden County 55 61 40 51 113 67
Monroe County 109 86 59 43 69 19 68
Carroll County 105 40 50 63 82 48 69
Elliott County 29 92 91 109 26 43 70
Lawrence County 76 95 50 61 17 96 71
Carlisle County 90 54 40 57 92 72
Adair County 60 89 64 67 21 100 73
Pendleton County 21 37 59 99 79 106 73
Hickman County 58 59 40 95 87 75
Carter County 44 107 74 96 28 72 76
Laurel County 82 77 82 55 84 45 77
Russell County 106 81 74 70 45 57 78
Estill County 84 94 64 83 81 30 79
Green County 114 62 64 104 42 51 80
Trigg County 59 19 40 98 114 107 80
Breathitt County 57 113 118 28 25 99 82
Fulton County 27 105 64 76 97 83
Rockcastle County 51 85 50 54 101 109 84
Gallatin County 117 31 91 47 53 112 85
Larue County 69 32 35 114 112 91 86
Breckinridge County 95 71 50 85 51 102 87
Fleming County 113 70 64 41 90 77 88

38
County
Un
insu
red
Po
vert
y
An
nu
al
Ma
mm
og
ram
Pri
ma
ry C
are
Pro
vid
ers
Me
nta
l He
alt
h
Pro
vid
ers
De
nti
sts
Ave
rag
e A
cce
ss
Ra
nk
ing
Powell County 54 82 82 111 71 60 89
Trimble County 35 46 74 87 109 110 90
Garrard County 85 43 55 82 110 86 90
Wayne County 104 102 102 26 56 73 92
Robertson County 86 72 119 33 93
Hart County 99 83 74 64 70 78 94
Metcalfe County 56 87 82 101 54 94 95
Bell County 74 109 111 50 113 23 96
Morgan County 97 101 106 91 20 69 97
Allen County 77 56 91 106 80 75 98
Lee County 48 117 106 78 36 103 99
Jackson County 68 100 91 94 102 37 100
Bath County 81 76 91 112 14 119 101
Owsley County 34 120 111 58 88 102
Clinton County 112 96 106 59 27 95 103
Magoffin County 118 103 106 77 35 59 104
Butler County 101 59 35 113 75 120 105
Webster County 115 69 55 89 95 85 106
Edmonson County 93 57 64 110 91 98 107
Lincoln County 108 77 82 72 59 118 108
Wolfe County 62 110 106 108 29 105 109
Lewis County 72 92 97 92 100 68 110
Nicholas County 103 37 74 107 103 104 111
Knott County 102 112 111 73 93 44 112
Knox County 89 111 102 93 78 74 113
Todd County 120 52 55 105 107 117 114
Leslie County 98 106 111 102 94 46 115
Harlan County 87 114 117 79 99 67 116
Martin County 88 119 111 69 88 116 117
McCreary County 111 115 116 90 50 111 118
Clay County 116 118 120 58 92 101 119
Casey County 119 98 102 115 64 108 120
*Note: sources are listed in Methods Section on Pages 4 and 5.
Appendix B: List of Acronyms

39
Acronym Meaning
AHEC Area Health Education Center
CMS RHC Centers for Medicare and Medicaid Services Rural Health Center
FQHC Federally Qualified Health Centers
FRYSC Family Resources Youth Services Coalition
HC Health Center
HRSA Health Resources and Services Administration
KY PCO Kentucky Primary Care Office
LRP NHSC Loan Repayment Program
LRP Loan Repayment Program
MHP Mental Health Provider
NHSC National Health Service Corps
PCP Primary Care Provider
RHC Rural Health Center
SLRP State Loan Repayment Program
SP NHSC Scholarship Program
SUD Substance abuse disorder
UK University of Kentucky