Kent Academic Repository revision 2 proofread.pdf · Content in the Kent Academic Repository is...
38
Kent Academic Repository Full text document (pdf) Copyright & reuse Content in the Kent Academic Repository is made available for research purposes. Unless otherwise stated all content is protected by copyright and in the absence of an open licence (eg Creative Commons), permissions for further reuse of content should be sought from the publisher, author or other copyright holder. Versions of research The version in the Kent Academic Repository may differ from the final published version. Users are advised to check http://kar.kent.ac.uk for the status of the paper. Users should always cite the published version of record. Enquiries For any further enquiries regarding the licence status of this document, please contact: [email protected] If you believe this document infringes copyright then please contact the KAR admin team with the take-down information provided at http://kar.kent.ac.uk/contact.html Citation for published version Brown, Anna and Ford, Tamsin and Deighton, Jessica and Wolpert, Miranda (2014) Satisfaction in Child and Adolescent Mental Health Services: Translating Users’ Feedback into Measurement. Administration and Policy in Mental Health and Mental Health Services Research, 41 (4). pp. 434-446. ISSN 0894-587X. DOI https://doi.org/10.1007/s10488-012-0433-9 Link to record in KAR http://kar.kent.ac.uk/30454/ Document Version Author's Accepted Manuscript
Transcript of Kent Academic Repository revision 2 proofread.pdf · Content in the Kent Academic Repository is...
Kent Academic RepositoryFull text document (pdf)
Copyright & reuse
Content in the Kent Academic Repository is made available for research purposes. Unless otherwise stated all
content is protected by copyright and in the absence of an open licence (eg Creative Commons), permissions
for further reuse of content should be sought from the publisher, author or other copyright holder.
Versions of research
The version in the Kent Academic Repository may differ from the final published version.
Users are advised to check http://kar.kent.ac.uk for the status of the paper. Users should always cite the
published version of record.
Enquiries
For any further enquiries regarding the licence status of this document, please contact:
If you believe this document infringes copyright then please contact the KAR admin team with the take-down
information provided at http://kar.kent.ac.uk/contact.html
Citation for published version
Brown, Anna and Ford, Tamsin and Deighton, Jessica and Wolpert, Miranda (2014) Satisfactionin Child and Adolescent Mental Health Services: Translating Users’ Feedback into Measurement. Administration and Policy in Mental Health and Mental Health Services Research, 41 (4). pp. 434-446. ISSN 0894-587X.
DOI
https://doi.org/10.1007/s10488-012-0433-9
Link to record in KAR
http://kar.kent.ac.uk/30454/
Document Version
Author's Accepted Manuscript
MEASURING SATISFACTION IN CAMHS 1
Satisfaction in Child and Adolescent Mental Health Services: Translating Users‟ Feedback into
Measurement
Anna Brown
University of Cambridge
Tamsin Ford
Peninsula Medical School, University of Exeter
Jessica Deighton & Miranda Wolpert
CAMHS EBPU, University College London and the Anna Freud Centre
Author Note
Anna Brown, PhD, Research Associate, University of Cambridge (at the time of writing).
Tamsin Ford, PhD, Clinical Senior Lecturer, Peninsula Medical School, University of Exeter.
Jessica Deighton, PhD, Senior Research Fellow, and Miranda Wolpert, DClinPsy, Director,
CAMHS EBPU, University College London and the Anna Freud Centre.
Correspondence should be addressed to Anna Brown, School of Psychology, University
of Kent, Canterbury, Kent CT2 7NP, United Kingdom; e-mail: [email protected]
MEASURING SATISFACTION IN CAMHS 2
Acknowledgements
We are grateful to all members of the CORC collaboration for providing the data, and to
the CORC central team researchers Jenna Bradley and Halina Flannery for preparing the data for
analyses. Anna Brown‟s work on this article was supported by Grant RG63087 from the Isaac
Newton Trust, University of Cambridge. Jessica Deighton‟s work on this article was provided as
part of the Department of Health Child Policy Research Unit (Reference number: 109/0001).
Disclosures
The authors have no competing interests. CORC is not-for-profit Company limited by
guarantee. Tamsin Ford is an unpaid director of CORC (other than travel expenses). Miranda
Wolpert is a paid director of CORC (3 days a week).
MEASURING SATISFACTION IN CAMHS 3
Abstract
The present research addressed gaps in our current understanding of validity and quality of
measurement provided by Patient Reported Experience Measures (PREM). We established the
psychometric properties of a freely available Experience of Service Questionnaire (ESQ), based
on responses from 7,067 families of patients across 41 UK providers of Child and Adolescent
Mental Health Services (CAMHS), using the two-level latent trait modeling. Responses to the
ESQ were subject to strong „halo‟ effects, which were thought to represent the overall positive or
negative affect towards one‟s treatment. Two strongly related constructs measured by the ESQ
were interpreted as specific aspects of global satisfaction, namely Satisfaction with Care, and
with Environment. The Care construct was sensitive to differences between less satisfied
patients, facilitating individual and service-level problem evaluation. The effects of nesting
within service providers were strong, with parental reports being the most reliable source of data
for the between-provider comparisons. We provide a scoring protocol for converting the hand-
scored ESQ to the model-based population-referenced scores with supplied standard errors,
which can be used for benchmarking services as well as individual evaluations.
Keywords: patient satisfaction, PREM, halo effects, affective overtones, approximated
IRT scores
MEASURING SATISFACTION IN CAMHS 4
Satisfaction in Child and Adolescent Mental Health Services: Translating Users‟ Feedback into
Measurement
Health policy in many countries is increasingly preoccupied with the importance of
capturing service users‟ feedback, and there is a strong emphasis on the need to use patient-
reported experience measures (PREMs) as a key source of information in this regard. The use of
feedback has been widely encouraged as a way to evaluate outcomes in Child and Adolescent
Mental Health Services (CAMHS), where clinical governance reviews target such areas of user
experiences as accessibility, humanity and organization of care, environment and outcomes
(Department of Health, 2009; Attride-Stirling, 2002). The reason for enquiring about the whole
experience surrounding patients‟ treatment, rather than merely focusing on clinical effectiveness
and safety, is that even a highly effective service may provide a highly unsatisfactory experience
and vice versa.
In a recent influential UK report, Professor Sir Ian Kennedy (2010) suggested that service
satisfaction should be the only measure of service quality in child health. A growing body of
literature suggests that satisfaction with the care that patients receive is indeed important, and
may be as important as clinical effectiveness, because through complex feedback processes one
influences the other. While positive outcomes promote satisfaction in a rather obvious way,
satisfaction may also promote positive outcomes, for example by keeping the child and the
family engaged in treatment. Both child and parental satisfaction is associated with engagement
and treatment completion (Stallard, 1995; Shapiro, Welker & Jacobson, 1997); and given that
30%-60% of CAMHS cases terminate treatment prematurely (Kazdin & Mazurick, 1994),
promoting satisfaction may be particularly important to reduce dropout rates in CAMHS.
Satisfaction may increase involvement of patients in the care that they receive, and greater
involvement is associated with positive outcomes (Anderson, Rivera & Kutash, 1998; Edwards
MEASURING SATISFACTION IN CAMHS 5
& Elwyn, 2001). In CAMHS in particular, involvement must be ensured not only for the young
people themselves but also for their parents/carers, primarily because the parents play a crucial
role in deciding whether a child reaches and completes treatment (McNaughton, 1994).
Based on this evidence, there are good reasons for capturing service user feedback.
However, there is a long way between collecting feedback and putting it to good use. The
intended use of patient feedback in CAMHS includes understanding and solving problems in
care delivery, demonstrating accountability to the public and taxpayers, and benchmarking of
services (Department of Health, 2009). For all these purposes, adequate interpretation of what
patients have said is essential; and any quantified interpretation requires good measurement.
The remainder of this article is organized as follows. First, we discuss likely constructs
invoked by PREMs, and general issues and challenges in establishing their construct validity. We
point out the limitations of psychometric information available on most PREMs described in the
literature, and argue that psychometric modeling of response processes at the item level is
essential for building valid metric scales for benchmarking and other diagnostic purposes. Next,
we present the Experience of Service Questionnaire (ESQ) – a short satisfaction measure
designed specifically for use in child healthcare – which is ideally suited for exploring the raised
issues of construct validity and measurement quality. We analyze responses to the ESQ using a
large sample of CAMHS patients treated by 41 service providers across the UK, in order to
establish measurement models at the individual and the service provider levels, and investigate
levels of agreement between parents and children. We also provide a scoring protocol and norm-
referenced tables for the ESQ that can be used for individual diagnostics and service
benchmarking purposes. We conclude with a discussion of findings and the illuminating
interpretation of the factor structure underlying the data.
MEASURING SATISFACTION IN CAMHS 6
Service Users’ Feedback and Measurement
What do Patient-Reported Experience Measures Actually Measure?
PREMs capture individual experiences with very different aspects of service, such as
suitability of the environment in which the patients are seen, respect that is shown to them, their
involvement in decision making, convenience and accessibility, etc. Considered separately, these
aspects may be used as a basis for benchmarking services according to the average level of
provision/satisfaction across patients in the service. Taken together, these aspects may form a
different kind of measurement; they may measure psychological attributes that drive users‟
reports, which have a distribution in the population of patients and therefore may be used for
scaling of individuals as well as services.
The literature on PREMs is inconsistent in regard to which constructs may be underlying
responses to them. Some authors (e.g. Brannan, Sonnichesen, & Heflinger, 1996; Ayton et al.,
2007) suggest that PREMs in the context of CAMHS indicate satisfaction, while some (e.g. Day,
Michelson and Hassan, 2011) imply that they directly measure service quality as experienced by
the patient. The difference might seem subtle; however, understanding the nature of constructs
PREMs might invoke is important for their correct use and interpretation. It has been questioned
whether feedback reports constitute the results of an active service evaluation; instead, they seem
to be heavily influenced by the patient‟s „attitudes and feelings‟ (Williams, Coyle & Healy, 1998;
emphasis is original), and therefore they are conceptually closer to affective satisfaction.
Interestingly, much research attempts to understand the nature of satisfaction by
correlating PREM scores with demographic variables, symptomatology, and other external
measures, including self-reported attitudes and other constructs that themselves have unclear
structure and validity (e.g. Garland, Saltzman & Aarons, 2000; Barber, Tischler & Healy, 2006).
This preoccupation with finding socio-demographic correlates of satisfaction (which is

MEASURING SATISFACTION IN CAMHS 7
presumably measured by PREMs) was noted by Locker and Dunt back in 1974, and we agree
that the value of such analyses in understanding the nature of satisfaction is limited, and a more
direct approach is needed.
Other researchers aim to understand antecedents of satisfaction by asking patients what
features constitute a good and a bad service (e.g. Biering & Jensen, 2011; Hart, Saunders &
Thomas, 2005). A direct qualitative study has been carried out recently by Biering & Jensen
(2011) who found that adolescents perceive that a „good‟ psychiatric service allows self-
expression, sees a person in them as opposed to just patient, provides them with a secure place,
„tough love‟ and discipline, and interaction with peers who have similar problems. Clearly, the
adolescents‟ satisfaction is likely to develop from service evaluations according to these criteria,
rather than areas of service experiences prescribed as important by the health services, or as
judged by parents/carers or medical professionals. An important point to make here is that
clinical governance or other bodies interested in patient feedback do not necessarily know which
aspects of service drive satisfaction for different users. These might overlap with areas covered
by an experience measure, or might differ from them entirely. Developers of comprehensive
experience measures in CAHMs are well aware of this and try to incorporate criteria important to
service users‟ satisfaction into their measures (e.g. Ayton et al., 2007; Day et al., 2011). Whether
a measure constitutes of these user-specific criteria, or more governance-driven general ones, we
would argue that the feeling of overall satisfaction based on their own criteria is likely to
influence the users‟ reports on all service experiences.
To shed more light on constructs underlying responses to PREMs, researchers explore
their factorial structures (e.g. Garland et al., 2000; Day et al., 2011; Brannan et al., 1996; Ayton
et al., 2007; Shapiro et al., 1997). It must be said that factorial studies cannot reveal factors
beyond what has been put in; and accordingly, questionnaires that are more comprehensive will
typically yield a larger number of measured constructs than shorter and more general ones. For
MEASURING SATISFACTION IN CAMHS 8
instance, Garland, Saltzman and Aarons (2000) constructed a satisfaction measure for
adolescents by using themes emerging from qualitative interviews, and then identified “four
factors of the scale” (Counselor qualities, Meeting needs, Effectiveness, and Counselor conflict).
Other questionnaires developed specifically for CAMHs reveal different factors depending on the
content included in them. For instance, Ayton and colleagues (2007) identified seven factors,
including Professionals‟ skills and behavior, Information, Access, and Relatives‟ involvement.
Day and colleagues (2011) identified three (Relationship, Privacy, and Session activity); and
Shapiro and colleagues (1997) found only two (Relationships with therapist, and Benefits of
therapy).
Despite the seemingly different structures underlying these questionnaires, all of them
yielded strong correlations between factors. Where reported, these correlations are in range 0.5-
0.7; and specific factors can be considered related enough to form a total satisfaction score (e.g.
Brannan et al., 1996; Ayton et al., 2007). „Validation‟ exercises against other established
satisfaction measures typically yield strong correlations between all measured scales (e.g.
Garland et al., 2000). This evidence points to existence of a general factor that underlies
satisfaction with specific aspects of users‟ experiences. Whether this factor represents
satisfaction, or only satisfaction, remains largely unknown.
Importance of Adequate Psychometric Analysis of Responses to PREMs
Sound psychometric properties are vital for adequate decision making based on responses
to questionnaires. In particular, all stakeholders must have a very good idea of the
appropriateness and fidelity of measurement, as well as of its precision and sensitivity. Knowing
what a PREM really measures is important for care providers who rely on patient feedback to
improve quality of care. Ensuring the instrument‟s ability to differentiate between a good
experience and a bad one is important for health authorities who monitor performance of

MEASURING SATISFACTION IN CAMHS 9
services. For children and their families, it is important that the right questions are asked, and
that their voices are not only heard but also adequately interpreted.
Two specific issues in patient experience measurement often obscure the true picture of
its validity and sensitivity. First, it is widely acknowledged that PREMs often give an overly
positive picture of experiences (for an overview, see Williams et al., 1998). Inflated satisfaction
scores have been partly attributed to biased sampling (e.g. only most satisfied patients return
questionnaires) and partly to „social desirability‟ effects (Young, Nicholson & Davis, 1995;
Brannan et al., 1996). While „social desirability‟ in its usual meaning refers to presenting self in
more positive light, in the context of evaluation of service providers overly positive feedback
might be explained by desire to please people the patient is rating, fear of confrontation and
similar processes. In their illuminating interviews, Williams, Coyle and Healy (1998) revealed a
highly conditioned and contrived process by which patients decide whether to report
„satisfaction‟ or „dissatisfaction‟, despite being clear on the valence of their experiences. They
found that service users were generally inclined to report satisfaction and „forgive‟ negative care
episodes, often driven by their subjective perception of service‟s boundaries of duty and
culpability. Clearly, reports influenced by such caveats cannot be taken as true reflection of
patients‟ experiences.
The second problem with measurement provided by PREMs is lack of discriminant
validity between different aspects of experiences. As discussed earlier, all constructs within the
same measure and across different experience measures tend to be strongly correlated; even
conceptually unrelated domains are often found to produce similarly positive or similarly
negative ratings. It might be the case that some services get every aspect of care right, and some
get them consistently wrong, thus positive correlations of all service aspects could be seen when
between-service data is considered. For instance, Brannan and colleagues (1996) report
correlation 0.68 between such different aspects of service as „Access and Convenience‟ and
MEASURING SATISFACTION IN CAMHS 10
„Relationship with Therapist‟ based on data from different services. However, reports from
within the same service also yield strong positive correlations between all service aspects (e.g.
Garland et al., 2000), which would imply, for example, that families located further away from
the service happen to also receive worst appointment times etc. – clearly an unlikely proposition.
This phenomenon, named halo effects or affective overtones, is well known and researched in
marketing and brand evaluation. It is defined as overgeneralization of features based on a single
important dimension. Holbrook (1983, page 247) suggests that “this effect may occur …when
overall preferences color belief ratings and thereby obscure the underlying role of perceptions
as bases for … evaluation”. Direct evidence of this exact process taking place in service
evaluation comes from the work of Williams and colleagues (1998) who found that experiences
with services expressed by patients during in-depth interviews were overwhelmingly “couched in
positive or negative terms”. Ignoring this factor in feedback reports may lead to false conclusions
about their construct validity.
Patient-reported experience measures suitable for use in CAMHS for which some
psychometric information is available include self-completion questionnaires and structured
interview schedules, ranging in length from four to over one hundred questions. Unfortunately,
recent studies on the psychometric properties of patient-reported experience measures in CAMHs
that we have reviewed (Brannan et al., 1996; Attkisson & Greenfield, 1996; Shapiro et al., 1997;
Garland et al., 2000; Ayton et al., 2007; Day et al., 2011) do not address the questions of
construct validity and measurement precision fully, nor do they deal with the above mentioned
challenges. In particular, the cited studies use Cronbach‟s alpha as evidence of internal
consistency (i.e. unidimensionality) and as the estimate of test‟s reliability. Recent psychometric
work conclusively shows that alpha is not related to the internal structure of the test, nor is it a
good measure of the accuracy of individuals‟ test score (e.g. Sijtsma, 2009). Factor analysis,
which is a good basis for investigations of the test‟s structure and establishing the precision of
MEASURING SATISFACTION IN CAMHS 11
measurement, was conducted in some of the studies; however, the item responses in such
analyses were treated as they were continuous variables. Because responses to items are in fact
arranged in categories, relationships between the item scores and the factor scores are not linear,
and Item Response Theory (IRT) techniques would be more appropriate for modeling
questionnaires‟ factorial structures (Reise & Waller, 2009). To our knowledge, no existing
CAMHS-specific experience measure employs IRT-based scoring methods, or provides
information on measurement precision for each score, which are essential for service
performance decisions and assessments of change (Reise & Haviland, 2005).
Moreover, the reviewed studies are based on too few patients (typically just over 100; e.g.
Ayton et al., 2007; Day et al., 2011) from a few closely located service providers. While such
samples are too small for analyses of factor structures, and certainly are inadequate for
benchmarking purposes, the main problem is that research findings might not be generalizable
across other service providers. A notable exception is the study by Brannan and colleagues
(1996), which recruited over 500 patients across several geographical regions in the US.
However, this study did not explore effects of nesting patients within services to identify any
service-level processes affecting users‟ experiences.
Objectives of the Present Study
Given current lack of quality information on psychometric properties of existing
experience measures used in CAMHS, the last thing needed in this situation is developing yet
another measure. Instead, we believe that any existing measure could be made more useful to
psychiatric services and enable better decision making in clinical governance if the following
information was provided: 1) a clear statement of construct(s) measured; 2) a scoring protocol
together with the assessment of the scores precision; and 3) benchmarking data. In dealing with
questionnaire responses that are categorized, nested within service providers, and are subject to

MEASURING SATISFACTION IN CAMHS 12
systematic „halo‟ biases, we argue that using up-to-date techniques that take all these issues to
account is paramount.
The instrument we are looking to improve by supplying detailed psychometric
information is the Experience of Service Questionnaire (ESQ), a short, free-to-use general
feedback tool developed for use across child healthcare (Attride-Stirling, 2002). The measure has
been adopted as the core measure for service experience across many CAHMS providers in the
UK. The most recent England-wide CAMHS mapping exercise (Barnes, Devanney, Uglebjerg,
Wistow & Hartley, 2010) reported the questionnaire‟s use with parents by 19% of services, and
with children by 21% of services in 2008 – a steady increase compared to the previous years.
Despite the widespread adoption of the ESQ, to our knowledge only one study has
explored its properties based on real patient data. Barber, Tischler and Healy (2006) focused on
relationships between young persons‟ symptoms („caseness‟) and satisfaction, and to this end the
researchers employed the prescribed ESQ sum score. In addition, they looked at the parent-child
agreement aspect by aspect (i.e. item by item). This research offered a first insight into between-
rater agreement and item endorsement levels (both reported to be high); however, the findings
are limited by a small sample size (73 parents and 45 children) confined to one clinic. The study
did not examine the internal structure of ESQ or its reliability; instead, it assumed that the
questionnaire is a valid and reliable measure of satisfaction.
We do not attempt to promote the ESQ beyond other questionnaires or suggest its better
coverage or comprehensiveness. Instead, the aim is to enable better decision making using a
popular generic questionnaire by applying modern psychometric science to a large sample of
patients across a range of UK CAMHS providers. Attride-Stirling (2002) identified the key
weaknesses in the ESQ development project as the lack of thorough validation, the absence of
evidence for it psychometric properties, and the absence of national benchmarks. In this paper,
we aim to answer all these shortcomings, as follows. First, we look to establish latent constructs
MEASURING SATISFACTION IN CAMHS 13
that affect individual reports by modeling item responses. Second, we assess effects of nesting
within providers to identify service-related factors of users‟ experiences. Finally, we suggest a
scoring protocol taking to account both the individual and the service-level effects, and assess
measurement precision and sensitivity of these suggested scales.
Methods
The Experience of Service Questionnaire
The ESQ was developed by the Commission for Health Improvement – a body charged
with service improvement of health services across England, which has since been reconfigured
into the Care Quality Commission. The measure was developed from focus groups with children
and parents across the child health sector, identifying elements that were important for their
positive experience of care (Attride-Stirling, 2002). It was intended for use with children and
young people over the age of nine and with the parents/carers of younger children. It was piloted
with CAMHS attendees with qualitative feedback leading to final amendments.
The ESQ comes in three versions: the parent/carer, the child version for children aged 9-
11, and the young person version for children aged 12-18. All ESQ questionnaire versions are
given in the Appendix. It can be seen that the 12 items cover the same content in all versions, in
the same order. However, there are differences between the three versions in the way the
questions are phrased, and in response format and options used. In the child versions, the
questions are asked about the patients‟ own experiences: whether the child felt that he/she was
listened to, or his/her problems were addressed. In the parent version the questions still relate to
‘my child’, but it is the parent who is the focus of this experience – questions are asked about
whether the parent felt that he/she was listened to, or his/her problems were addressed.
Furthermore, there are differences in phrasing between the two child versions of the
questionnaire. While the young persons‟ version uses affirmative statements and the same rating

MEASURING SATISFACTION IN CAMHS 14
options as the parent version („not true‟ – „partly true‟ – „certainly true‟), the version for younger
children asks direct questions and uses response options that vary for each individual question.
Participants
Responses to the ESQ were obtained from the CAMHS Outcomes Research Consortium
(CORC; www.corc.uk.net) – a learning collaboration of the majority of CAMH services across
the UK and Scandinavia who have joined to determine best ways to use patient reported
outcomes and experience data to improve service quality. Forty-one CORC members have been
collecting experience data using the ESQ; these were located in London, Midlands, East of
England, North of England, South East and South West of England; and Scotland.
Either parent/carer, or child, or both ESQ forms were available for 7,067 patients (55.1%
were boys), ranging from 11 to 757 patients per service (mean 172.4, median 82). The children‟s
ages at referral ranged from 1 to 18 years, mean 11.2 (SD=3.6). The full age distribution,
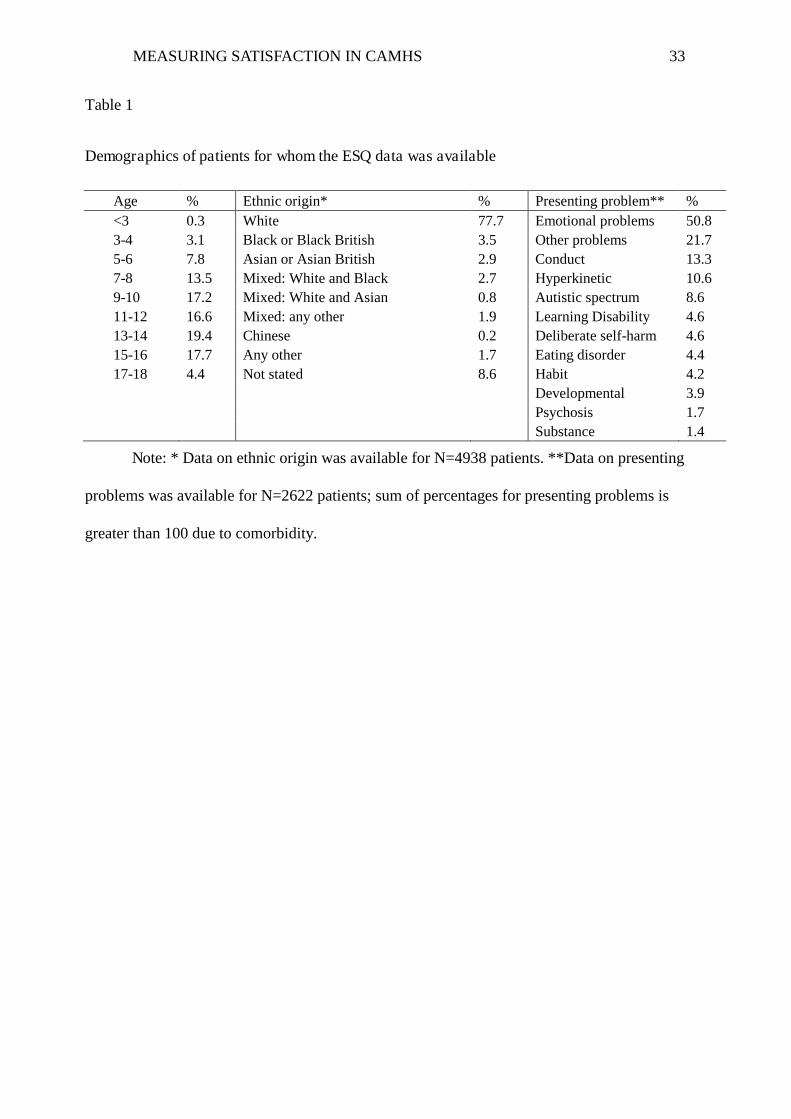
children‟s ethnic background and recorded presenting problems are shown in Table 1. The mean
parent-reported total difficulty score on the Strength and Difficulties Questionnaire (SDQ;
Goodman, 2001) for these young people was 18.8 (SD=7.2), which is equivalent to the 94th
centile of British national norms and above the generally accepted clinical cut point of 17 (SDQ:
Normative SDQ data from Britain, 2001). Overall, the demographic composition of the present
sample and the degree of experienced problems is very similar to that reported for all CORC
members (the full report is available from www.corc.uk.net), which suggests that the families
returning feedback to the ESQ are broadly representative of all families who attend CORC
member services.
Insert Table 1 about here
MEASURING SATISFACTION IN CAMHS 15
Analyses
The focus of our investigation was on unobserved constructs, which are not measured
perfectly but merely indicated by responses to questionnaire items. With only three ordered rating
categories used in the ESQ, it was important to treat the item data as ordinal, using item response
theory (IRT) approaches. Another important feature of our data was that individual responses
were not sampled independently; rather, they were nested within CAMHS providers. Because the
questionnaire focused on the care provider, this nesting was expected to produce substantial
dependence among responses from the same provider. Based on the above considerations,
methodology adopted for this study is two-level latent trait modeling, a synthesis of multilevel
and latent trait modeling (Rabe-Hesketh, Skrondal & Pickles, 2004). All analyses were
performed using Mplus version 6 (Muthén & Muthén, 1998-2010), using the unweighted least
square estimator with robust standard errors (denoted ULSMV in Mplus).
Because all three versions of ESQ differ in the way items and/or response categories are
phrased, they were analyzed separately. The strategy adopted for analyses was as follows. First,
the extent to which nesting of patients in services produced dependencies between their
responses was examined. To quantify the proportion of the total variance due to differences
between the providers, the intraclass correlations were computed. In conjunction with the
reported average cluster size, the intraclass correlation provides an indication of the importance
of the nesting effects (i.e. whether the nesting effects need to be taken into account). When the
design effect size, which is computed simply as 1+(average cluster size–1)*intraclass
correlation, is greater than 2, the nesting effect is important and must be taken to account in
analyses (Muthén & Satorra, 1995). Next, two-level exploratory factor analyses (EFA) were
carried out. At the individual level, we were looking for factors explaining common variance in
item responses. The Graded Response model for ordered categories (Samejima, 1969) was used
MEASURING SATISFACTION IN CAMHS 16
to link the item responses to the common factors. At the service provider level, exploratory
analyses were aiming to explain common variance in service-specific item intercepts (Hox,
2010). Following the EFA, alternative factor models for each level were compared to each other
in confirmatory fashion in terms of their goodness of fit and parsimony, to establish a response
model for each of the ESQ informant versions. For each tested model, we report the residuals
between the model-estimated and the actual item correlations, the chi-square statistic, the Root
Mean Square Error of Approximation (RMSEA), the Comparative Fit Index (CFI), and the
Standardized Root Mean Square Residual (SRMR). However, due to the lack of established
criteria for a well-fitting multilevel model, and the small sample size at the provider level
(N=41), we relied on the assessment of residuals and residual-based index (SRMR) in order to
judge the models‟ appropriateness for the data. Finally, the best within-level and between-level
solutions were suggested for each ESQ informant version. As additional construct validity
evidence, responses from families where both parents and children completed the ESQ were
analyzed jointly to assess agreement between the informants.
Based on the established measurement models, we computed expected a posteriori (EAP)
factor scores for respondents (Thissen & Orlando, 2001), together with their standard errors. To
enable researchers and practitioners easily access these model-based scores without carrying out
the two-level IRT estimation, we computed approximated EAP scores for each possible summed
score (see Thissen & Orlando, 2001) by taking the mean of the likelihood function of all
response patterns leading to this summed score.
Findings
Item Endorsement and Response Rates
Distributions of responses to all ESQ items were highly skewed, with vast majority of
responses falling within the category „certainly true‟, which represents most favorable ratings.

MEASURING SATISFACTION IN CAMHS 17
For most questions, approximately 70-80% of all informants chose the top category. Overall,
question 3 („treated well‟) showed the highest endorsement (92% of parents/carers chose the top
category). The least endorsed questions, particularly by children, were those concerning facilities
(only around 56% of younger children were satisfied with these arrangements) and appointment
times (only around 55% of all children were satisfied). Overall, the older children were least
satisfied and parents were most satisfied with all experiences.
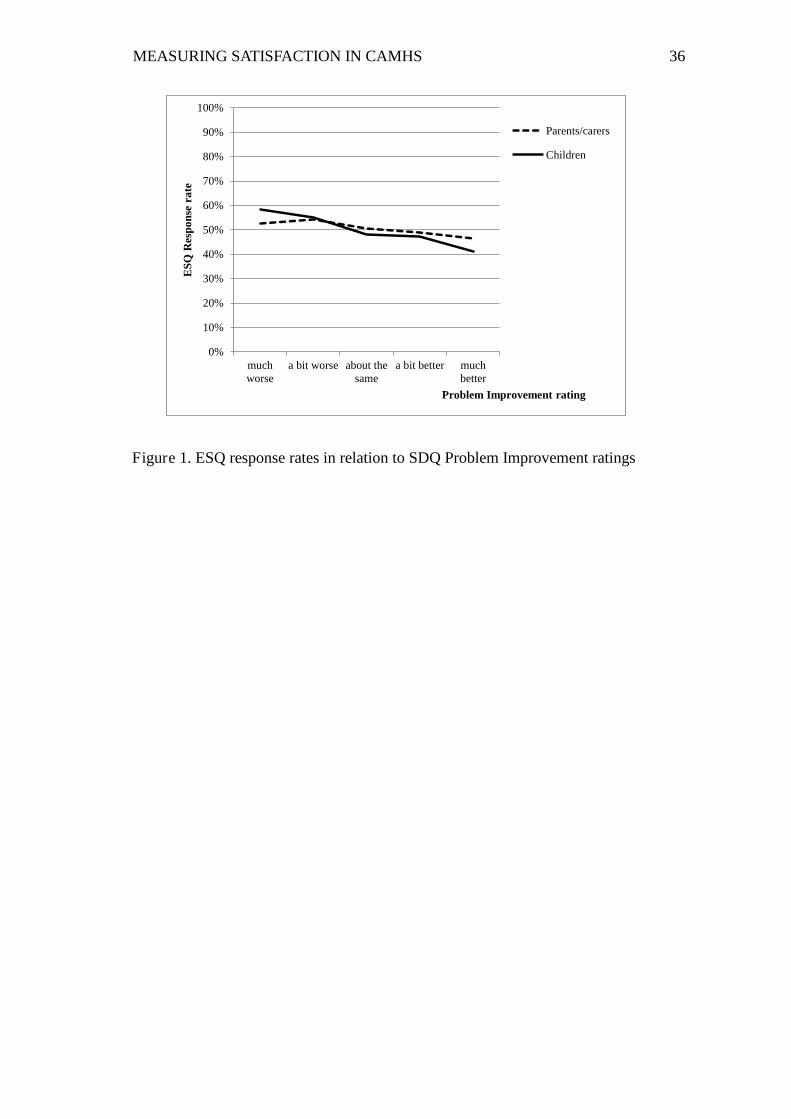
To check whether the high positive ratings could be attributed to biased sampling (i.e.
only most satisfied patients returned questionnaires), we compared the ESQ response rates to
improvement in symptoms. A one-item rating of „problem improvement‟ from the follow-up
version of SDQ is typically collected at about the same time as the ESQ is given, and
distinguishes between five levels of perceived improvement in patient‟s mental wellbeing (from
„much worse‟ to „much better‟). The improvement rating was available for a much wider sample
(N=13,494) than the present ESQ sample. If it was true that only most satisfied patients returned
the service feedback questionnaires, the response rates to the ESQ should increase with the
increase of the self-rated improvement in symptoms. As Figure 1 shows, the opposite was true –
response rates to ESQ for both parents and children dropped slightly with improved symptoms.
Insert Figure 1 about here
Constructs Measured by ESQ
Constructs Measured by the Parent/Carer Version
Parents/carers returned 6,062 questionnaires (across all 41 services, mean 147.9 per
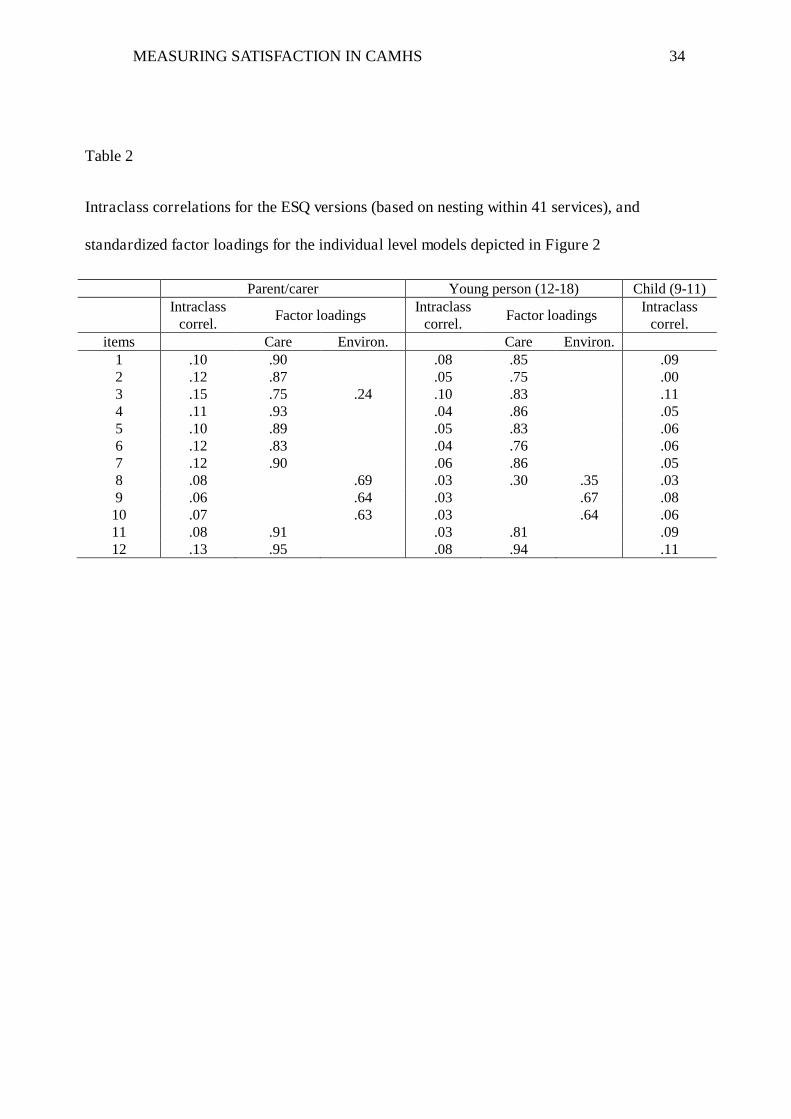
service). Item intraclass correlations presented in Table 2 ranged from 0.06 (item 9, “convenient

MEASURING SATISFACTION IN CAMHS 18
appointment times”) to 0.15 (item 3, “treated well”), yielding the design effect sizes above 9, and
indicating substantial nesting effects on the parents‟ responses to all items.
The two-level EFA suggested presence of a strong first factor and one further factor at
both the individual level (first three eigenvalues 8.0, 1.3 and 0.6) and the provider level
(eigenvalues 10.1, 1.2 and 0.4). At the individual-level, an oblique rotation of two factors
yielded a nearly ideal independent clusters structure. The first factor was indicated by nine items:
1, 2, 3, 4, 5, 6, 7, 11 and 12. These items refer to aspects of health Care such as experiences of
interactions with the clinician(s) including communication (“people who have seen my child
listened to me”), competence (“people here know how to help”) and consistency of care (“people
here are working together”). The second factor was indicated by items 8, 9 and 10, which relate
to Environment surrounding the treatment, such as appointment times, facilities and location.
Item 3 (“treated well”) had a non-trivial cross-loading on this factor, suggesting that for parents
being treated well meant receiving good customer service in general as well as good medical
help. At the provider level, two correlated factors were indicated by the same items as at the
individual level, except that there was no cross loading for item 3.
CFA confirmed that the two-level model depicted in Figure 2, with two correlated factors
at each level fitted the data well (ぬ2 = 156, df = 105, p = 0.001; RMSEA = 0.009; CFI = 0.991;
SRMRw = 0.034; SRMRb = 0.044). This model reproduced the item correlations well (the largest
individual-level and provider-level residuals were 0.08 and 0.09 respectively). Table 2 provides
the standardized individual-level factor loadings for this model. The two factors correlated
moderately at the individual level (r12 = 0.62), and the correlation was strong at the provider level
(r12 = 0.76). Simpler models, with one factor explaining the item co-variances at either individual
(ぬ2 = 298, df = 107, p < 0.001; RMSEA = 0.017; CFI = 0.968; SRMRw = 0.061; SRMRb = 0.044)
or provider levels (ぬ2 = 158, df = 106, p = 0.001; RMSEA = 0.009; CFI = 0.991; SRMRw =
MEASURING SATISFACTION IN CAMHS 19
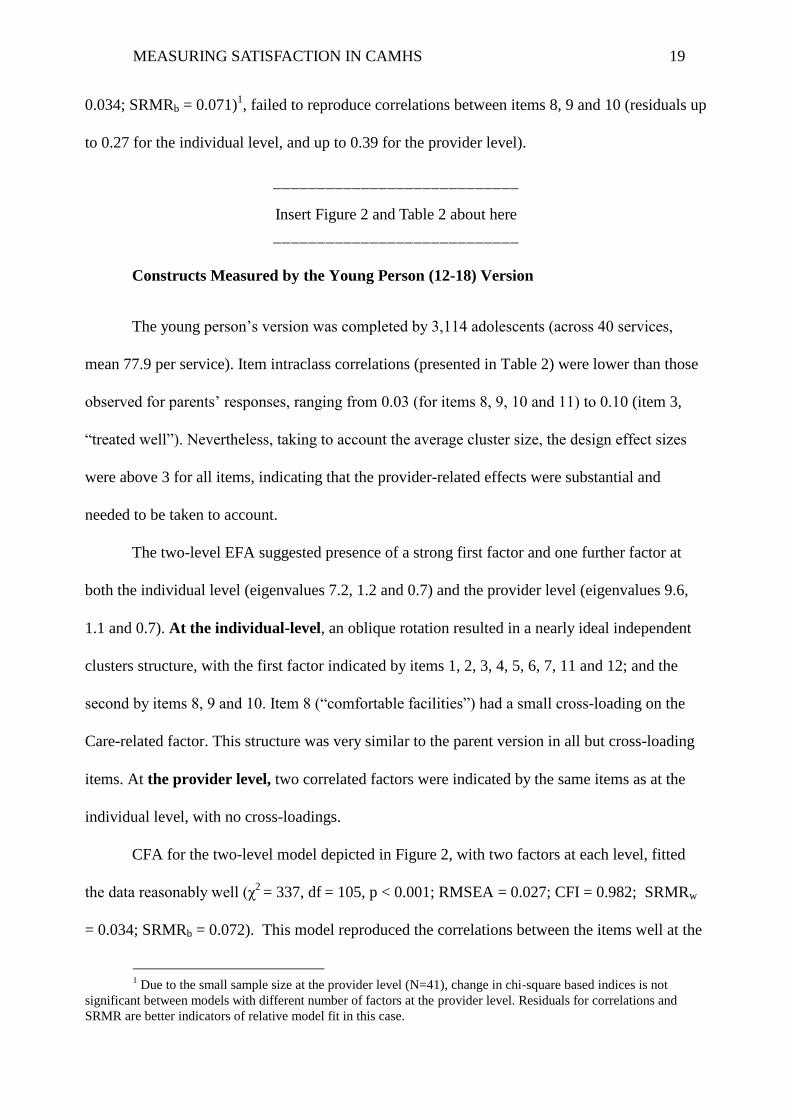
0.034; SRMRb = 0.071)1, failed to reproduce correlations between items 8, 9 and 10 (residuals up
to 0.27 for the individual level, and up to 0.39 for the provider level).
Insert Figure 2 and Table 2 about here
Constructs Measured by the Young Person (12-18) Version
The young person‟s version was completed by 3,114 adolescents (across 40 services,
mean 77.9 per service). Item intraclass correlations (presented in Table 2) were lower than those
observed for parents‟ responses, ranging from 0.03 (for items 8, 9, 10 and 11) to 0.10 (item 3,
“treated well”). Nevertheless, taking to account the average cluster size, the design effect sizes
were above 3 for all items, indicating that the provider-related effects were substantial and
needed to be taken to account.
The two-level EFA suggested presence of a strong first factor and one further factor at
both the individual level (eigenvalues 7.2, 1.2 and 0.7) and the provider level (eigenvalues 9.6,
1.1 and 0.7). At the individual-level, an oblique rotation resulted in a nearly ideal independent
clusters structure, with the first factor indicated by items 1, 2, 3, 4, 5, 6, 7, 11 and 12; and the
second by items 8, 9 and 10. Item 8 (“comfortable facilities”) had a small cross-loading on the
Care-related factor. This structure was very similar to the parent version in all but cross-loading
items. At the provider level, two correlated factors were indicated by the same items as at the
individual level, with no cross-loadings.
CFA for the two-level model depicted in Figure 2, with two factors at each level, fitted
the data reasonably well (ぬ2 = 337, df = 105, p < 0.001; RMSEA = 0.027; CFI = 0.982; SRMRw
= 0.034; SRMRb = 0.072). This model reproduced the correlations between the items well at the
1 Due to the small sample size at the provider level (N=41), change in chi-square based indices is not
significant between models with different number of factors at the provider level. Residuals for correlations and SRMR are better indicators of relative model fit in this case.
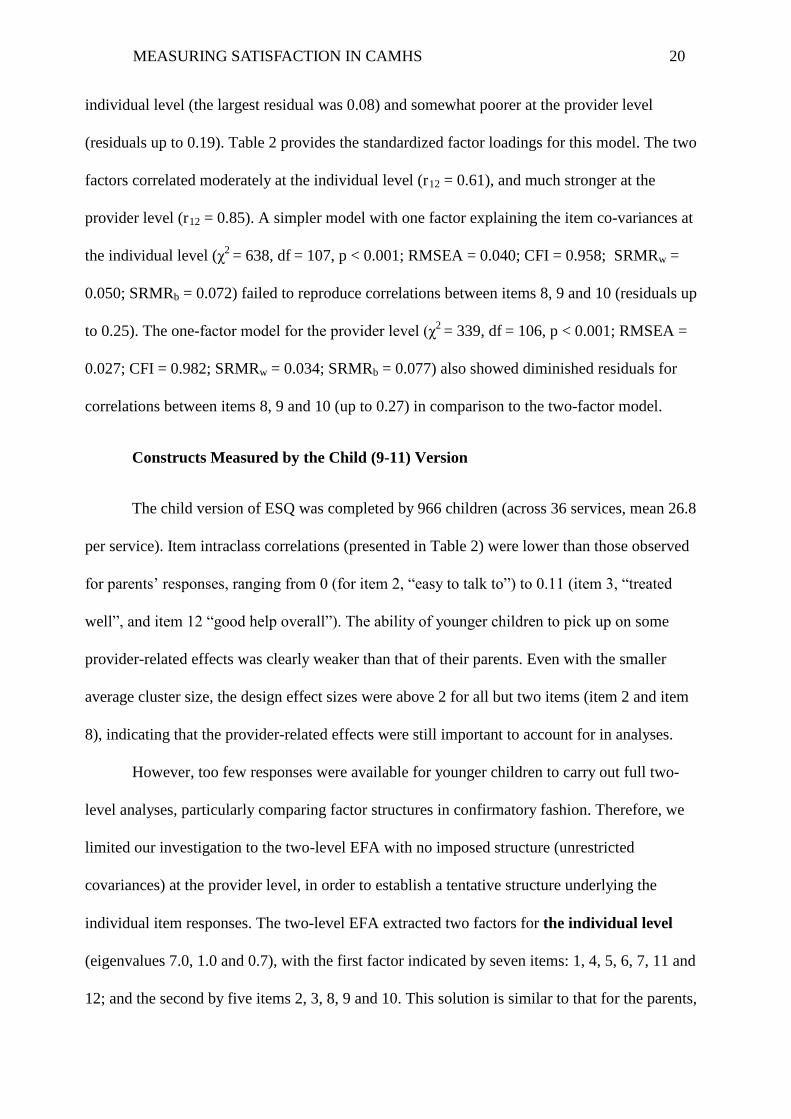
MEASURING SATISFACTION IN CAMHS 20
individual level (the largest residual was 0.08) and somewhat poorer at the provider level
(residuals up to 0.19). Table 2 provides the standardized factor loadings for this model. The two
factors correlated moderately at the individual level (r12 = 0.61), and much stronger at the
provider level (r12 = 0.85). A simpler model with one factor explaining the item co-variances at
the individual level (ぬ2 = 638, df = 107, p < 0.001; RMSEA = 0.040; CFI = 0.958; SRMRw =
0.050; SRMRb = 0.072) failed to reproduce correlations between items 8, 9 and 10 (residuals up
to 0.25). The one-factor model for the provider level (ぬ2 = 339, df = 106, p < 0.001; RMSEA =
0.027; CFI = 0.982; SRMRw = 0.034; SRMRb = 0.077) also showed diminished residuals for
correlations between items 8, 9 and 10 (up to 0.27) in comparison to the two-factor model.
Constructs Measured by the Child (9-11) Version
The child version of ESQ was completed by 966 children (across 36 services, mean 26.8
per service). Item intraclass correlations (presented in Table 2) were lower than those observed
for parents‟ responses, ranging from 0 (for item 2, “easy to talk to”) to 0.11 (item 3, “treated
well”, and item 12 “good help overall”). The ability of younger children to pick up on some
provider-related effects was clearly weaker than that of their parents. Even with the smaller
average cluster size, the design effect sizes were above 2 for all but two items (item 2 and item
8), indicating that the provider-related effects were still important to account for in analyses.
However, too few responses were available for younger children to carry out full two-
level analyses, particularly comparing factor structures in confirmatory fashion. Therefore, we
limited our investigation to the two-level EFA with no imposed structure (unrestricted
covariances) at the provider level, in order to establish a tentative structure underlying the
individual item responses. The two-level EFA extracted two factors for the individual level
(eigenvalues 7.0, 1.0 and 0.7), with the first factor indicated by seven items: 1, 4, 5, 6, 7, 11 and
12; and the second by five items 2, 3, 8, 9 and 10. This solution is similar to that for the parents,
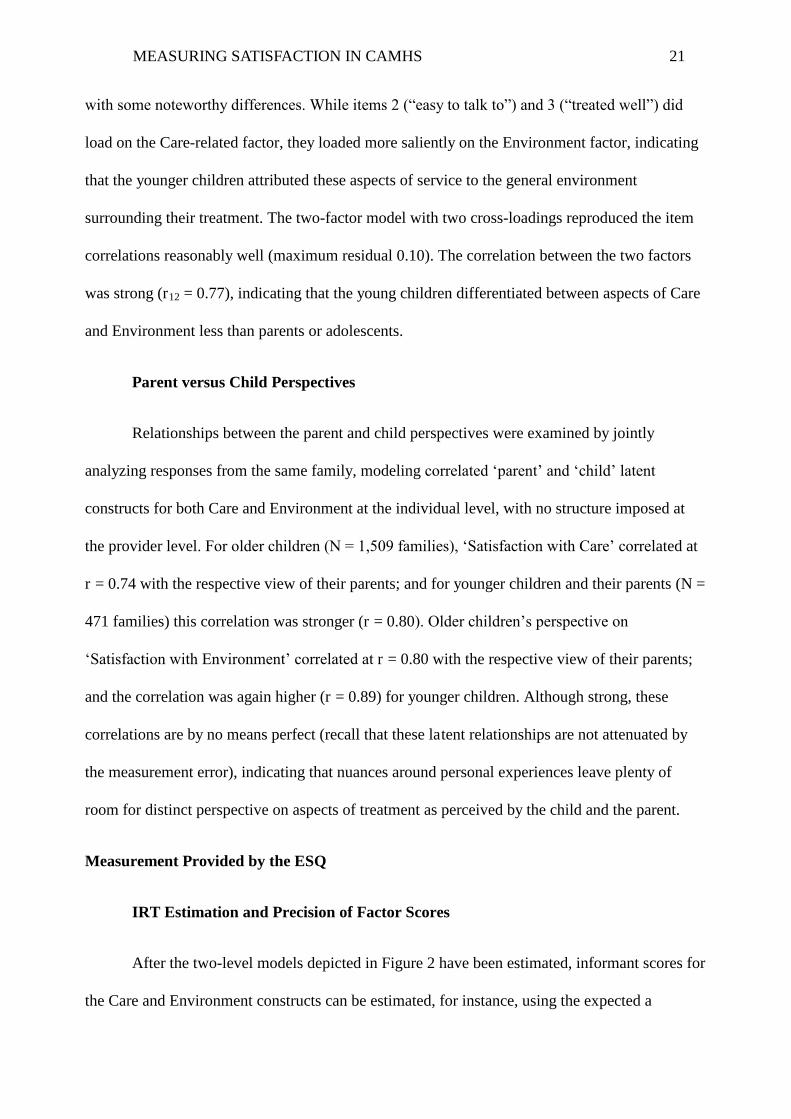
MEASURING SATISFACTION IN CAMHS 21
with some noteworthy differences. While items 2 (“easy to talk to”) and 3 (“treated well”) did
load on the Care-related factor, they loaded more saliently on the Environment factor, indicating
that the younger children attributed these aspects of service to the general environment
surrounding their treatment. The two-factor model with two cross-loadings reproduced the item
correlations reasonably well (maximum residual 0.10). The correlation between the two factors
was strong (r12 = 0.77), indicating that the young children differentiated between aspects of Care
and Environment less than parents or adolescents.
Parent versus Child Perspectives
Relationships between the parent and child perspectives were examined by jointly
analyzing responses from the same family, modeling correlated „parent‟ and „child‟ latent
constructs for both Care and Environment at the individual level, with no structure imposed at
the provider level. For older children (N = 1,509 families), „Satisfaction with Care‟ correlated at
r = 0.74 with the respective view of their parents; and for younger children and their parents (N =
471 families) this correlation was stronger (r = 0.80). Older children‟s perspective on
„Satisfaction with Environment‟ correlated at r = 0.80 with the respective view of their parents;
and the correlation was again higher (r = 0.89) for younger children. Although strong, these
correlations are by no means perfect (recall that these latent relationships are not attenuated by
the measurement error), indicating that nuances around personal experiences leave plenty of
room for distinct perspective on aspects of treatment as perceived by the child and the parent.
Measurement Provided by the ESQ
IRT Estimation and Precision of Factor Scores
After the two-level models depicted in Figure 2 have been estimated, informant scores for
the Care and Environment constructs can be estimated, for instance, using the expected a
MEASURING SATISFACTION IN CAMHS 22
posteriori approach (EAP; Thissen & Orlando, 2001). This Bayesian method makes use of the
known population distribution of the latent trait (assumed standard normal) to estimate the
expected trait value given the observed response pattern. The service-level scores can be also
estimated from continuous service-level item intercepts, for instance by the regression method.
Standard errors computed for the EAP-estimated individual-level „Care‟ scores revealed
that the scale discriminated well between patients with low to average scores, but lacks ability to
differentiate between higher scores. Thus, the standard errors for the „Care‟ scale are below 0.5
(translating into reliability of above 0.75) for the scores below 0 in the Parent version, and for the
scores below 0.25 in the Young Person version. Conversely, measurement precision is
unacceptably low (SE is above 0.6) for all levels of the „Environment‟ construct, which is
measured by only three items. Unfortunately, these levels of precision are insufficient for any
practical measurement purposes at the individual level.
Approximation of the IRT Scores Using Summed Scores
While the IRT-based estimation is the most accurate for producing individual scores, it
requires specialist software and expert knowledge, and is not a realistic option in the psychiatric
practice settings. However, conventional summed score can be used to approximate the IRT
score, by taking the mean of the likelihood function of all response patterns leading to this
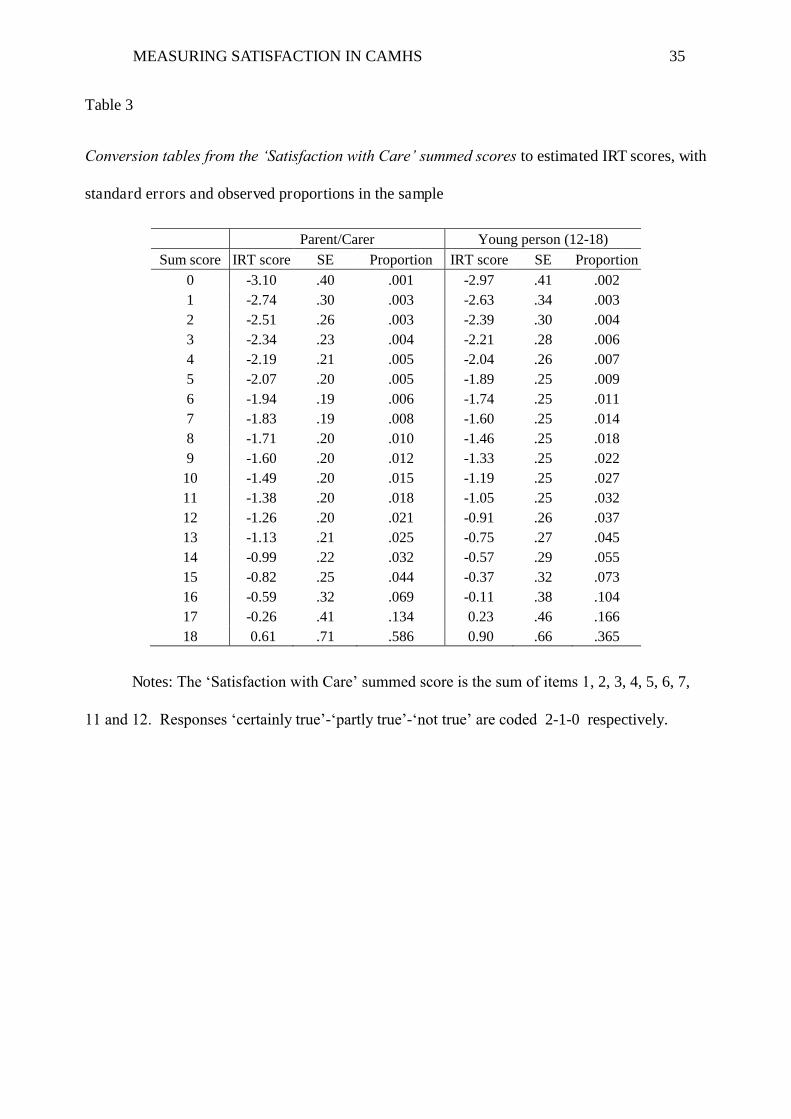
summed score (see Thissen & Orlando, 2001). Table 3 provides such conversion from the
summed ESQ „Care‟ scores to their respective IRT scores, and corresponding standard errors.
This conversion provides an instant reference point (norm) because the IRT score is scaled like
the familiar z-score. The standard error associated with each score can be used to assess
significance of differences between satisfaction levels of individual patients, and for aggregation
at the service level.
MEASURING SATISFACTION IN CAMHS 23
To use the conversion table, the least favorable rating (e.g. “not true”) must be given the
lowest code (0), and the most favorable rating (e.g. “certainly true”) must be given the highest
code (2). Coded in this fashion, item responses must be added to produce the sum score ranging
from 0 to 18, and then the approximated IRT score and its standard error can be easily found for
each sum score.
Insert Table 3 about here
Discussion
The present paper addressed the key weaknesses in our current understanding of
psychometric functioning of patient reported experience measures, namely: the lack of evidence
for their construct validity, for their measurement precision, and the absence of national
benchmarks. To this end, we explored the Experience of Service Questionnaire, a short, freely
available general feedback tool, using responses from children and parents who had attended 41
CAMHS providers across the UK.
First, we established latent constructs that affect individual reports by modeling item
responses taking to account nesting of individuals within services. For all ESQ versions, each
item response was underlain by one of the two moderately to strongly correlated factors, related
to either Care or Environment. Only one item in the parent version (item 3, “treated well”) and
one item in the young person version (item 8, “comfortable facilities”) loaded on both factors.
This rather well behaved independent clusters structure, however, provided several clues for
understanding the real nature of constructs invoked in responding to the ESQ. The first clue was
that the items referring to largely incidental and possibly fluctuating arrangements (i.e.
appointment times, facilities and location) related to each other so strongly as to form a factor.
The second was that these environmental aspects also correlated substantially with care-related

MEASURING SATISFACTION IN CAMHS 24
aspects represented by the rest of the items. The fact that even conceptually independent items
shared common variance suggested that ESQ responses were subject to a strong „halo‟ effect.
While many researchers over years have considered the „halo‟ effect to be a rating bias
and a problem to the quality of data, others noted the useful variance captured by the
respondents‟ affect (Murphy, Jako & Anhalt, 1993). It is our view that the „halo‟ observed in the
present study certainly captures valid variance directly related to patient satisfaction. The overall
feeling of satisfaction/dissatisfaction influences all reported experiences, making reports about
very diverse experiences similar, and responses to questionnaire items highly correlated. To
illustrate a possible mechanism for this process, we constructed an alternative structural model
for the ESQ – with one factor representing the overall satisfaction influencing responses to all
items (which results in the strong „halo‟ effect observed), and the other capturing the remaining
shared variance in nine items concerned with care-related experiences only. This alternative
solution could in fact be easily obtained by EFA with the target rotation according to this
hypothetical model (Browne, 2001), rather than relying on software-driven oblique rotations2.
This alternative rotation inevitably showed the same fit to the data as our adopted two-factor
solution; however, it provided an important insight into constructs underlying the responses. It
clearly links to previous findings and our earlier suggestions that responses to service feedback
questionnaires are underlain by a common factor, which we interpret as satisfaction. In the ESQ
data, this factor accounts for approximately half of the variance in item responses.
For the above reasons, we suggest that the ESQ should be treated as a subjective
measure of satisfaction, not as an objective report of the quality of care patients received or the
quality of environment surrounding their treatment. Hence, the two correlated factors resulting
2 Most EFA rotation methods would minimize the number of factors each item loads on – i.e. rotate to an
independent clusters structure.

MEASURING SATISFACTION IN CAMHS 25
from the independent clusters solution represented related aspects of patients‟ satisfaction and we
shall finally label them „Satisfaction with Care‟ and „Satisfaction with Environment‟.
The „Satisfaction with Care‟ scores had good precision, differentiating well at the lower
levels of satisfaction in particular. This is a desirable property for a PREM because the
measurement focus is typically on individual problems and issues. In addition, as Williams and
colleagues (1998, page 1359) point out, over-reporting is common and therefore „dissatisfaction‟
rather than „satisfaction‟ scores may be more useful “as an indication of a minimum level of
negative experience” and “in benchmarking exercises”. The ESQ measure was not sensitive to
individual differences at the positive end, however, in most cases multiple feedback
questionnaires will ensure reliable distinctions between highly performing services, as well as
between underperforming ones. The „Satisfaction with Environment‟ construct with its three
items of widely varying content was lacking the measurement precision and therefore its use is
not recommended. However, we envisage that the three environment-related items can be useful
in monitoring satisfaction with specific aspects of environment between services.
Based on responses to individual items, high levels of satisfaction with services in general
were found, with children being satisfied slightly less than parents. This is in line with another
UK study on satisfaction in CAMHS (Barber et al., 2006). Despite slightly different phrasing of
items and rating options being used, there were strong similarities between the young patients
and their parents, both in terms of the overall agreement on the given ratings, and in terms of
meaning of the two constructs. However, the children‟s responses were less reliable and
produced less defined factors and a greater dependence between them. In addition, children were
less able to notice provider-related features. This may reflect their relative cognitive immaturity
and should have implications for the weight given to the young patients views in any
comparisons between CAMHS providers. On the other hand, the strong nesting effect observed
MEASURING SATISFACTION IN CAMHS 26
in parental ratings is the best evidence of utility of the ESQ as a service feedback tool. Based on
these results, we recommend using parental ratings to benchmark services.
Limitations
While the present analyses were based on a large sample of parents and children from 41
services across the UK, it is possible that the sample is biased in ways yet unknown. The
voluntary nature of CORC and effort required to collect and submit data may mean that those
services who encourage patients to complete the measure feel most confident about the quality of
service they provide, and our data overestimated levels of satisfaction with CAMHS across the
UK. To eliminate the possibility of such positive-report bias, purposeful randomized data
collection should be employed across not yet included services, and indeed in other countries.
Another limitation is the lack of external validation data, particularly at the provider level.
No externally rated provider-level quality or outcome measures are available at present time in
the CORC dataset; however, exploring the relationships between those and patient satisfaction is
certainly an essential aspect of future research.
Conclusions
The present study presents an important step forward in understanding the construct
validity and quality of measurement provided by PREMs in general, and in establishing the
psychometric credentials of the ESQ, a freely available patient-reported experience measure in
particular. We illustrated our arguments to support the view that responses to PREMs are
universally underlain by a general attribute of satisfaction, which we operationalize as affective
overall opinion on the quality of service the patient received. Based on this view, we suggested
that the ESQ measures two related aspects of satisfaction – Satisfaction with Care, and with
Environment.
MEASURING SATISFACTION IN CAMHS 27
The measure„s robust psychometric properties in assessing Satisfaction with Care suggest
that it has the potential to be a powerful service evaluation tool. We provide easy conversion of
hand-scored ratings into population-referenced IRT scores, enabling instant advantages of the
IRT methodology such as accurate model-based measurement and standard error estimates
conditional on the trait level. At the individual level, the ESQ is sensitive to differences in ratings
from less satisfied patients, potentially facilitating meaningful problem diagnostics. At the
provider level, the ESQ can be used for benchmarking services based on either individual items
or the suggested Satisfaction with Care construct.
Based on the measure‟s performance in multi-level analysis it is recommended that
parental reports are the preferred source of data for between-service comparisons. Further work is
needed to explore the psychometric properties of this measure in randomly selected service
providers and against provider-level measures of service quality.

MEASURING SATISFACTION IN CAMHS 28
References
Anderson, J. A., Rivera, V. R., & Kutash, K. (1998). Measuring consumer satisfaction with
children's mental health. In M. H. Epstein, K. Kutash, & A. J. Duchnowski (Eds.)
Outcomes for children with emotional and behavioral disorders and their families:
Program and evaluation best practices (pp. 455-482). Austin, TX: Pro-Ed.
Attkisson, C. & Greenfield, T. (1996). The Client Satisfaction Questionnaire (CSQ) scales and
the Service Satisfaction Scale-30 (SSS-30). In L. Sederer & B. Dickey (Eds.) Outcomes
Assessment in Clinical Practice. Baltimore: Williams & Wilkins.
Attride-Stirling, J. (2002). Development of methods to capture users’ views of CAMHS in clinical
governance reviews. http://www.corc.uk.net/media/File/Measures/ESQ/CHI-ESQ
development and evaluation.pdf
Ayton, A., Mooney. M., Sillifant, K., Powls, J., & Rasool, H. (2007). The development of the
child and adolescent versions of the Verona Service Satisfaction Scale (CAMHSSS).
Social Psychiatry and Psychiatric Epidemiology, 42, 892-901. DOI: 10.1007/s00127-007-
0241-9
Barber, A.J., Tischler, V.A. & Healy, E. (2006). Consumer satisfaction and child behaviour
problems in child and adolescent mental health services. Journal of Child Health Care,
10(1), 9-21. DOI: 10.1177/1367493506060200
Barnes, D., Devanney, C., Uglebjerg, A., Wistow, R. & Hartley, C. (2010). A profile of children's
health services, child and adolescent mental health services and maternity services in
England 2008/9. Durham: Durham University. http://dro.dur.ac.uk/8220/1/8220.pdf
Biering, P., & Jensen, V. (2011). The Concept of Patient Satisfaction in Adolescent Psychiatric
Care: A Qualitative Study. Journal of Child and Adolescent Psychiatric Nursing, 24, 3–
10. DOI: 10.1111/j.1744-6171.2010.00261.x.
MEASURING SATISFACTION IN CAMHS 29
Brannan, A., Sonnichesen, E. & Heflinger, C. (1996). Measuring satisfaction with children‟s
mental health services: Validity and reliability of the satisfaction scales. Evaluation and
Program Planning, 19, 131-141. DOI: 10.1016/0149-7189(96)00004-3
Browne, M. W. (2001). An overview of analytic rotation in exploratory factor analysis.
Multivariate Behavioral Research, 36, 111-150. DOI:10.1207/S15327906MBR3601_05
CORC Measures website http://www.corc.uk.net/index.php?contentkey=81
Day, C., Michelson, D. & Hassan, I. (2011). Child and adolescent service experience (ChASE):
Measuring service quality and therapeutic process. British Journal of Clinical
Psychology, 50, 452–464. DOI: 10.1111/j.2044-8260.2011.02008.x
Department of Health. (2009). Understanding What Matters: A Guide to Using Patient Feedback
to Transform Services. London: Department of Health. Retrieved from
http://www.dh.gov.uk/en/Publicationsandstatistics/Publications/PublicationsPolicyAndGu
idance/DH_099780
Edwards, A. & Elwyn, G. (2001). Developing professional ability to involve patients in their
care: pull or push? Quality in Health Care, 10, 129-134. DOI:10.1136/qhc.0100129..
Garland, A., Saltzman, M. & Aarons, G. (2000). Adolescent satisfaction with mental health
services: Development of a multidimensional scale. Evaluation and Program Planning,
23, 165-175. DOI: 10.1016/S0149-7189(00)00009-4
Goodman, R. (2001). Psychometric properties of the Strengths and Difficulties Questionnaire
(SDQ). Journal of the American Academy of Child and Adolescent Psychiatry, 40, 1337-
1345. DOI: 10.1097/00004583-200111000-00015
Hart, A., Saunders, A., & Thomas, H. (2005). Attuned practice: a service user study of specialist
child and adolescent mental health, UK. Epidemiology and Psychiatric Sciences, 14, 22-
31. DOI: 10.1017/S1121189X00001895
MEASURING SATISFACTION IN CAMHS 30
Holbrook, M. B. (1983). Using a structural model of halo effect to assess perceptual distortion
due to affective overtones. Journal of Consumer Research, 10, 247-252.
http://www.jstor.org/stable/2488928
Hox, J. J. (2010). Multilevel analysis: Techniques and Applications. 2nd Edition. New York:
Routledge.
Kazdin, A. & Mazurick, J. (1994). Dropping out of child psychotherapy: Distinguishing early and
late dropouts over the course of treatment. Journal of Consulting and Clinical
Psychology, 62, 1069-1074. DOI: 10.1177/1359104596011012
Kennedy, I. (2010). Getting it right for children and young people: Overcoming cultural barriers
in the NHS so as to meet their needs. London: Department of Health.
http://www.dh.gov.uk/en/Publicationsandstatistics/Publications/PublicationsPolicyAndGu
idance/DH_119445
McNaughton, D. (1994). Measuring parent satisfaction with early childhood intervention
programs. Topics in Early Childhood Special Education, 14, 26-48. DOI:
10.1177/027112149401400106
Murphy, K. R., Jako, R. A., & Anhalt, R. L. (1993). Nature and consequences of halo error: A
critical analysis. Journal of Applied Psychology, 78, 218-225. DOI: 10.1037/0021-
9010.78.2.218
Muthén, L.K. & Muthén, B.O. (1998-2010). Mplus User’s Guide. Sixth Edition. Los Angeles,
CA: Muthén & Muthén. www.stamodel.com
Muthén, B. & Satorra, A. (1995). Complex sample data in structural equation modeling.
Sociological Methodology, 25, 267-316. http://www.jstor.org/stable/271070
Rabe-Hesketh, S., Skrondal, A. & Pickles, A. (2004). Generalized multilevel structural equation
modeling. Psychometrika, 69, pp. 167-190. DOI: 10.1007/BF02295939
MEASURING SATISFACTION IN CAMHS 31
Reise, S. & Haviland, M. (2005). Item response theory and the measurement of clinical change.
Journal of Personality Assessment, 84, 228-238. DOI: 10.1207/s15327752jpa8403_02
Reise, S. & Waller, G. (2009). Item response theory and clinical measurement. Annual Review of
Clinical Psychology, 5, 25-46. DOI: 10.1146/annurev.clinpsy.032408.153553
Samejima, F. (1969). Estimation of Latent Ability Using a Response Pattern of Graded Scores
(Psychometric Monograph No. 17). Richmond, VA: Psychometric Society.
Sijtsma, K. (2009). On the Use, the Misuse, and the Very Limited Usefulness of Cronbach‟s
Alpha. Psychometrika, 74, 107–120. DOI: 10.1007/s11336-008-9101-0
SDQ: Normative SDQ data from Britain. (2001). http://www.sdqinfo.com/UKNorm.html
Shapiro, J., Welker, C. & Jacobson, B. (1997). The youth client satisfaction questionnaire:
Development, construct validation and factor structure. Journal of Child Clinical
Psychology, 26, 87-98. DOI:10.1207/s15374424jccp2601_9
Stallard, P. (1995). Parental satisfaction with intervention: differences between respondents and
non-respondents to postal questionnaire. British Journal of Clinical Psychology, 34, 397-
405. DOI: 10.1111/j.2044-8260.1995.tb01474.x
Thissen, D. & Orlando, M. (2001). Item response theory for items scored in two categories. In D.
Thissen & H. Wainer (Eds.), Test Scoring. Mahwah, NJ: Lawrence Erlbaum, pp. 73-140.
Williams, B., Coyle, J. & Healy, D. (1998). The meaning of patient satisfaction: An explanation
of high reported levels. Social Science and Medicine, 47, 1351-1359. DOI:
10.1016/S0277-9536(98)00213-5
Young, S., Nicholson, J. & Davis, M. (1995). An overview of issues in research on consumer
satisfaction with child and adolescent mental health services. Journal of Child and
Family Studies, 4, 219-238. DOI: 10.1007/BF02234097

MEASURING SATISFACTION IN CAMHS 32
Appendix
ESQ for parents/carers Response options: Certainly True – Partly True – Not True – Don’t know (“don‟t know” response option is not scored).
1. I feel that the people who have seen my child listened to me 2. It was easy to talk to the people who have seen my child 3. I was treated well by the people who have seen my child 4. My views and worries were taken seriously 5. I feel the people here know how to help with the problem I came for 6. I have been given enough explanation about the help available here 7. I feel that the people who have seen my child are working together to help with the problem(s) 8. The facilities here are comfortable (e.g. waiting area) 9. The appointments are usually at a convenient time (e.g. don‟t interfere with work, school) 10. It is quite easy to get to the place where the appointments are 11. If a friend needed similar help, I would recommend that he or she come here 12. Overall, the help I have received here is good
ESQ for young people aged 12-18 Response options: Certainly True – Partly True – Not True – Don’t know (“don‟t know” response option is not scored).
1. I feel that the people who saw me listened to me 2. It was easy to talk to the people who saw me 3. I was treated well by the people who saw me 4. My views and worries were taken seriously 5. I feel the people here know how to help me 6. I have been given enough explanation about the help available here 7. I feel that the people who have seen me are working together to help me 8. The facilities here are comfortable (e.g. waiting area) 9. My appointments are usually at a convenient time (e.g. don‟t interfere with school, clubs, college, work) 10. It is quite easy to get to the place where I have my appointments 11. If a friend needed this sort of help, I would suggest to them to come here 12. Overall, the help I have received here is good
ESQ for children aged 9-11 Response options vary and are given with each question (“don‟t know” response option is not scored).
1. Did the people who saw you listen to you? (Yes-Only a little-Not really-Don’t Know) 2. Was it easy to talk to the people who saw you? (Yes-Only a little-Not really-Don’t Know) 3. How were you treated by the people who saw you? (Very well-Ok-Not very well-Don’t Know) 4. Were your views and worries taken seriously? (Yes-Only a little-Not really-Don’t Know) 5. Do you feel that the people here know how to help you? (Yes-A little-Not really-Don’t Know) 6. Were you given enough explanation about the help available here? (Yes-Only a little-Not really-Don’t Know) 7. Do you feel that the people here are working together to help you? (Yes-Only a little-Not really-Don’t Know) 8. The facilities here (like the waiting area) are… (Comfortable-Ok-Uncomfortable-Don’t Know) 9. The time of my appointments was… (Convenient-Ok-Not convenient-Don’t Know) 10. The place where I had my appointments was… (Easy to get to-Ok to get to-Hard to get to-Don’t Know) 11. If a friend needed this sort of help, do you think they should come here? (Yes-Maybe-Not really-Don’t Know) 12. Has the help you got here been good? (Yes-Only a little-Not really-Don’t Know)
MEASURING SATISFACTION IN CAMHS 33
Table 1
Demographics of patients for whom the ESQ data was available
Age % Ethnic origin* % Presenting problem** % <3 0.3 White 77.7 Emotional problems 50.8 3-4 3.1 Black or Black British 3.5 Other problems 21.7 5-6 7.8 Asian or Asian British 2.9 Conduct 13.3 7-8 13.5 Mixed: White and Black 2.7 Hyperkinetic 10.6 9-10 17.2 Mixed: White and Asian 0.8 Autistic spectrum 8.6 11-12 16.6 Mixed: any other 1.9 Learning Disability 4.6 13-14 19.4 Chinese 0.2 Deliberate self-harm 4.6 15-16 17.7 Any other 1.7 Eating disorder 4.4 17-18 4.4 Not stated 8.6 Habit 4.2 Developmental 3.9 Psychosis 1.7 Substance 1.4
Note: * Data on ethnic origin was available for N=4938 patients. **Data on presenting
problems was available for N=2622 patients; sum of percentages for presenting problems is
greater than 100 due to comorbidity.
MEASURING SATISFACTION IN CAMHS 34
Table 2
Intraclass correlations for the ESQ versions (based on nesting within 41 services), and
standardized factor loadings for the individual level models depicted in Figure 2
Parent/carer Young person (12-18) Child (9-11)
Intraclass
correl. Factor loadings
Intraclass correl.
Factor loadings Intraclass
correl. items Care Environ. Care Environ.
1 .10 .90 .08 .85 .09 2 .12 .87 .05 .75 .00 3 .15 .75 .24 .10 .83 .11 4 .11 .93 .04 .86 .05 5 .10 .89 .05 .83 .06 6 .12 .83 .04 .76 .06 7 .12 .90 .06 .86 .05 8 .08 .69 .03 .30 .35 .03 9 .06 .64 .03 .67 .08 10 .07 .63 .03 .64 .06 11 .08 .91 .03 .81 .09 12 .13 .95 .08 .94 .11
MEASURING SATISFACTION IN CAMHS 35
Table 3
Conversion tables from the ‘Satisfaction with Care’ summed scores to estimated IRT scores, with
standard errors and observed proportions in the sample
Parent/Carer Young person (12-18) Sum score IRT score SE Proportion IRT score SE Proportion
0 -3.10 .40 .001 -2.97 .41 .002 1 -2.74 .30 .003 -2.63 .34 .003 2 -2.51 .26 .003 -2.39 .30 .004 3 -2.34 .23 .004 -2.21 .28 .006 4 -2.19 .21 .005 -2.04 .26 .007 5 -2.07 .20 .005 -1.89 .25 .009 6 -1.94 .19 .006 -1.74 .25 .011 7 -1.83 .19 .008 -1.60 .25 .014 8 -1.71 .20 .010 -1.46 .25 .018 9 -1.60 .20 .012 -1.33 .25 .022 10 -1.49 .20 .015 -1.19 .25 .027 11 -1.38 .20 .018 -1.05 .25 .032 12 -1.26 .20 .021 -0.91 .26 .037 13 -1.13 .21 .025 -0.75 .27 .045 14 -0.99 .22 .032 -0.57 .29 .055 15 -0.82 .25 .044 -0.37 .32 .073 16 -0.59 .32 .069 -0.11 .38 .104 17 -0.26 .41 .134 0.23 .46 .166 18 0.61 .71 .586 0.90 .66 .365
Notes: The „Satisfaction with Care‟ summed score is the sum of items 1, 2, 3, 4, 5, 6, 7,
11 and 12. Responses „certainly true‟-„partly true‟-„not true‟ are coded 2-1-0 respectively.
MEASURING SATISFACTION IN CAMHS 36
0%
10%
20%
30%
40%
50%
60%
70%
80%
90%
100%
muchworse
a bit worse about thesame
a bit better muchbetter
ESQ
Res
pons
e ra
te
Problem Improvement rating
Parents/carers
Children
Figure 1. ESQ response rates in relation to SDQ Problem Improvement ratings

MEASURING SATISFACTION IN CAMHS 37
Figure 2. Individual and service-level measurement models for the ESQ
Notes: Cross loading for item 3 marked in dashed and dotted line is significant for
parental data only; cross loading for item 8 marked in dashed line is significant for the young
persons‟ data only.
i1 i2 i3 i4 i5 i6 i7 i10 i11 i12 i8 i9
Between level
i1 i2 i3 i4 i5 i6 i7 i10 i11 i12 i8 i9
Satisfaction with Care
Satisfaction with Environment
Within level
Care Environment