Kenexis · Safety instrumented systems (SIS) are the most flexible and one of the most common...
79
Kenexis Safety Instrumented Systems Engineering Handbook Kenexis Consulting Corporation – Columbus, OH
Transcript of Kenexis · Safety instrumented systems (SIS) are the most flexible and one of the most common...
Kenexis
Safety Instrumented Systems Engineering Handbook
Kenexis Consulting Corporation – Columbus, OH
i
Copyright © 2010-2017 Kenexis Consulting Corporation
2929 Kenny Road
Suite 225
Columbus, OH 43221
e-mail: [email protected]
http://www.kenexis.com
Phone: (614) 451-7031
All Rights Reserved
No part of this work 7may be reproduced, stored in a retrieval system, or transmitted in any form or by
any means, electronic, mechanical, photocopying, recording or otherwise, without the prior written
permission of Kenexis Consulting Corporation.
In preparing this work the Kenexis Consulting Corporation did not research or consider patents which may
apply to the subject matter contained in this book. It is the responsibility of the readers and users of the
material contained in this book to protect themselves against liability for the infringement of patents. The
information and recommendations contained in this book are not intended for any specific application or
applications, and are of a general informative nature. As a result, Kenexis Consulting Corporation
assumes no responsibility and disclaims all liability of any kind, however arising, as a result of using the
information contained in this book. Any equipment that might be referenced in this work has been
selected by the authors as examples of technology. Kenexis Consulting Corporation makes no
endorsement of any product, either expressed or implied. In all instances, an equipment manufacturer’s
procedures should prevail regarding the use of specific equipment. No representation, expressed or
implied, is made with regard to the availability of any equipment, process, formula, or other procedures
contained in this book.
Library of Congress Cataloging-in-Publication Data

ii
About Kenexis
Kenexis is a global engineering consulting company that is focused on the implementation of engineered
safeguards in process plants. Engineered safeguards are physical devices that can detect that an
unwanted or out-of-control situation is occurring in the process plant and take remedial action to move
the process to a safe state. Some typical examples of engineered safeguards employed in the process
industries are shown below.
• Safety Instrumented Systems
• Fire and Gas Detection and Suppression Systems
• Emergency Isolation Valve Systems
• Alarm Systems
• Pressure Relief Systems
• Cyber Security Systems (Intrusion Detection and Prevention)
• Machine Safeguarding Systems
Kenexis helps our clients to deploy these systems by working as an independent expert third-party advisor
who assists in the development of the design basis of these systems and validation that these systems are
implemented in accordance with the design basis over their entire lifecycle. Since Kenexis does not sell or
recommend any hardware or perform any detailed engineering services, Kenexis is uniquely positioned to
act as an independent advisor with no conflicts of interest that might sway the direction of decisions in the
development of the design basis.
Kenexis applies a risk-based approach in assisting our clients to determine their engineered safeguard
needs. The risks that are posed by the processes that our clients operate can be determined and
developed through Process Hazards Analyses (PHA) that Kenexis can both facilitate and actively
participate in. Once the needs for engineered safeguards are identified, the design basis for those
safeguards is further developed by considering the codes and standards that apply to the design of each
specific safeguard along with the level of risk reduction that those safeguards are required to provide.
Considering these two factors Kenexis prepares design basis documentation that defines the requirements
in sufficient detail to allow equipment to be selected and purchased, but general enough to ensure that
any technology or equipment vendor that is capable of meeting the technical requirements can provide an
appropriate solution. Kenexis design basis documents are unique in their ability to allow end users to
compare alternatives from multiple vendors and select the solution that best suits their requirements.
After the design basis is complete, our clients work with equipment vendors, systems integrators, and
engineering companies to physically implement the solution. After the safeguards are implemented,
Kenexis helps our clients by performing validation services and ongoing support services to ensure that
the safeguards were selected, designed, and installed in accordance with the design basis documentation,
and that the system design and design basis documentation are maintained in an evergreen fashion.
iii
About the Authors
Kevin J. Mitchell
Mr. Kevin J. Mitchell has unparalleled experience in the risk management and process safety fields. Mr.
Mitchell has been involved in hundreds of projects covering such diverse operations as oil & gas
production, refining, petrochemical, specialty chemical and general manufacturing. Specializes in state-of-
the-art assessment of the risk of toxic, flammable, and explosive materials on people, property, the
environment, and, ultimately, the business. Uses risk assessment and Cost-Benefit Analysis to assist in
making engineering and business decisions.
Todd M. Longendelpher
Mr. Longendelpher has experience in design of safety instrumented systems and risk analysis methods. He
is responsible for the development of SIL requirements and verification of SIL requirements for safety
instrumented systems. He utilizes risk analysis techniques to assess existing SIS design versus potential
hazards resulting in consequences. He has conducted LOPA / SIL Selection and SIL Verification activities
for customers in petroleum refining, petrochemicals, and upstream oil and gas production in US and
international locations. He currently oversees the implementation of SIS design at multiple upstream oil
and gas production platforms in the Gulf of Mexico.

iv
Preface
Safety instrumented systems (SIS) form some of the most widely used and difficult to design engineered
safeguards in the process industries. Prior to the release of risk-based standards for the design of SIS,
designs were traditionally implemented using rules of thumb – which were quite effective, but not entirely
satisfactory. After the implementation of risk-based analysis, users of SIS realized that these engineered
safeguards alone had the design flexibility to allow widely diverse designs with widely diverse risk
reduction capabilities. Only SIS can be designed in a good, better, and best fashion, limiting the amount
of risk reduction provided to match the amount of risk reduction needed.
The downside of the flexibility that risk-based decision making provides is the large amount of complexity
that subsequently is introduced to the design process. In order to make risk-based decisions, one needs
to understand the risk of the chemical process, which is no small feat and typically out of the “comfort
zone” of SIS designers, and also to understand the details of reliability engineering as applied to SIS
design.
In the years following the release of the performance-based standards that define SIS engineering, many
books, standards, technical reports, and papers have been written about the SIS Engineering process
(including books and papers by the authors of this book). The authors of this book determined that it
would be very valuable to distill this information down into a handbook format that will allow everyday
practitioners to have a quick reference to the most salient points of the design process.
This book provides a very practical discussion of the SIS safety lifecycle and presents it in a fashion that
leans toward assistance in execution of the tasks without belaboring the theoretical underpinnings of the
equations and data that are presented in other books and technical reports. In addition, this book reflects
the most proven and accepted methodologies for performing tasks, especially in areas where the
standards allow great flexibility to the users to select from many options for complying with the standard.
For instance, the task of selecting safety integrity levels can be performed utilizing a wide variety of
methods including risk graphs and layer of protection analysis. But since the vast preponderance of
industry has elected to use layer of protection analysis, only this methodology will be explored in great
detail.
Also, this book focuses on the SIS engineering aspects of the safety lifecycle while leaving important tasks
that are out of the realm of instrumentation and control engineering to others. For instance, a good
process hazards analysis is important to identifying where instrumented safeguards such as SIS are
required, but execution of a PHA is typically not the responsibility of instrumentation and control
engineers, and is thus discussed, but not developed in detail.
The authors of this book hope you enjoy the contents and find the information educational and useful on a
day-to-day basis.
v
Table of Contents
About the Authors ............................................................. iii
Kevin J. Mitchell ............................................................. iii
Peter Hereña ...................... Error! Bookmark not defined.
Todd M. Longendelpher .................................................. iii
Matthew C. Kuhn ................ Error! Bookmark not defined.
Preface ............................................................................ iv
Table of Contents ............................................................... v
Introduction ...................................................................... 1
Why do I need an SIS? .................................................... 1
What is an SIS? .............................................................. 2
Legislation and Regulation ............................................... 2
Why develop SIS standards? ............................................ 3
What does the standard require? ...................................... 4
The Safety Lifecycle ........................................................ 5
Conceptual Process Design .................................................. 8
Process Hazards Analysis .................................................... 9
SIF Definition................................................................... 12
Safety Integrity Level Selection .......................................... 15
Defining SIL ................................................................. 15
SIL Selection Process .................................................... 16
Representing Tolerable Risk for SIL Selection ................... 17
Layer of Protection Analysis ........................................... 20
Conceptual Design / SIL Verification ................................... 24
Component Selection .................................................... 25
Fault Tolerance ............................................................. 26
vi
Functional Test Interval ................................................. 27
Common Cause Failures ................................................ 27
Diagnostic Coverage ...................................................... 27
PFD Calculation ............................................................ 27
Simplified Equations ...................................................... 28
Safety Requirements Specifications .................................... 29
Detailed Design and Specifications ..................................... 32
Procedure Development .................................................... 33
Construction, Installation, and Commissioning ..................... 35
Pre-Startup Acceptance Testing ......................................... 36
Operations and Maintenance .............................................. 37
Management of Change .................................................... 38
Conclusions ..................................................................... 39
Appendix A – Acronyms .................................................... 40
Appendix B – Definitions ................................................... 41
Appendix C – Typical Initiating Event Frequencies ................ 45
Appendix D – Typical Protection Layers ............................... 46
Appendix E – PFDavg and Spurious Trip Rate Simplified Equations 50
Appendix F – Minimum Fault Tolerance Tables ..................... 59
Appendix G –SIS Component Failure Data ........................... 63
Sensor Data ................................................................. 64
Logic Solver Data .......................................................... 65
Final Element Interface Data .......................................... 66
Final Element Data ........................................................ 66
Appendix H – Example Risk Criteria .................................... 67
Appendix I – References ................................................... 72
1
Introduction
Safety instrumented systems (SIS) are the most flexible and one of the most common engineered
safeguards used in process plants today. The design of SIS, in accordance with current practice, is a risk
based process where the selected equipment and associated maintenance and testing procedures are
tailored to specific requirements of an application. This risk-based approach yields superior designs that
provide the required risk reduction while minimizing cost.
SIS design has become a more complex process due to the need to understand more than traditional
instrumentation and control engineering. In addition to basic concepts, SIS design requires expertise in
analyzing the risks of the process under control (which necessarily requires an understanding of the
process) in order to establish design targets, and also expertise in reliability engineering to ensure that
the selected targets have been met.
The purpose of this book is to provide a brief overview of the Safety Lifecycle that is used to design SIS,
along with general information to assist in performing the tasks that are defined in the safety lifecycle.
This includes tables of data, lists of definitions and acronyms, equations, and explanations for using these
resources.
Why do I need an SIS?
Process plants create value by converting raw materials into valuable products. The processes utilized to
perform this conversion often create hazardous conditions that could result in significant consequences if
the processes are not adequately controlled. These conditions include:
• Flammable Materials
• Toxic Materials
• High Pressures
• High Temperatures
Control of the risks posed by process plants is performed by a combination of:
• Administrative Controls
• Engineered Safeguards
A Safety Instrumented System (SIS) is one of the safeguards used in modern petroleum and chemical
processing to reduce risk to a tolerable level. It is an engineered control, and fits in with engineering
safeguards, as well as administrative controls, to achieve an overall balance of safeguards that reduce risk
to a tolerable level.
Common Safety Instrumented System applications include emergency shutdown systems, burner
management systems for boilers and other fired devices; high integrity pressure protection systems
(HIPPS) in petroleum or chemical processing facilities, as well as other industry specific applications.
2
What is an SIS?
The Safety Instrumented System is an instrumentation and control system that detects out-of-control
process conditions, and automatically returns the process to a safe state. It is the last line - or near last
line - of defense against a chemical process hazard, and it is not part of the Basic Process Control System.
The last line of defense is what differentiates a Safety Instrumented System from the Basic Process
Control System, which is used for normal regulatory process control.
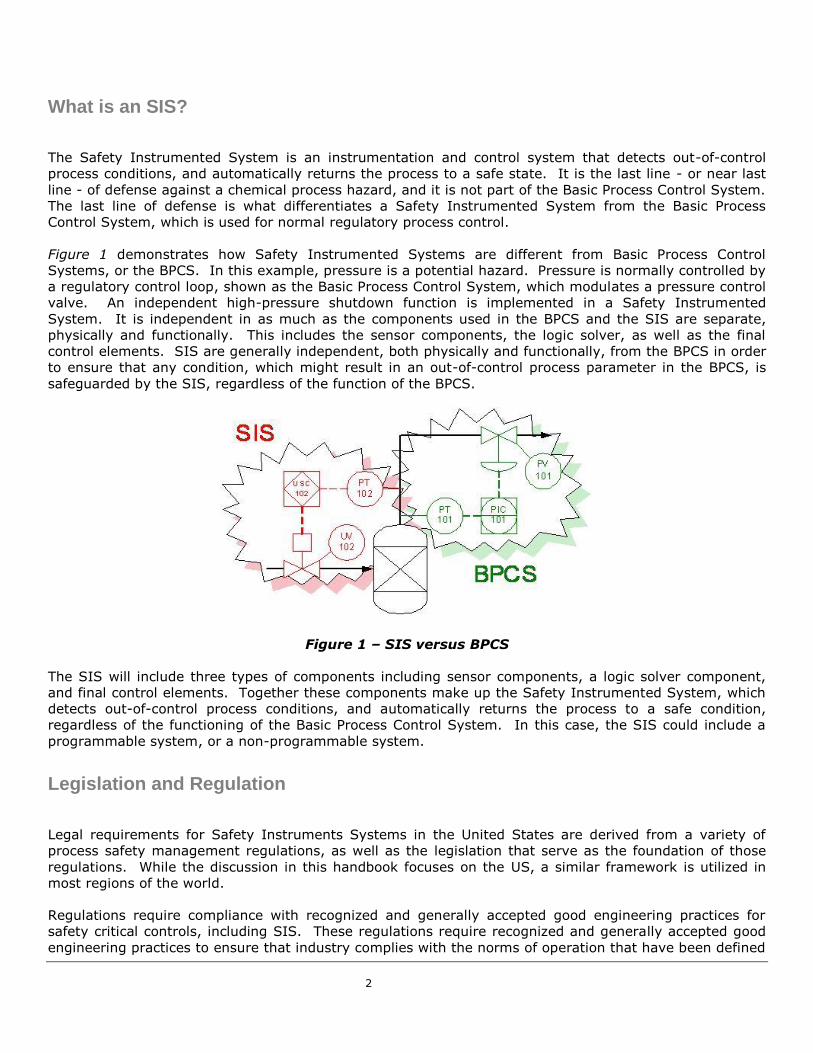
Figure 1 demonstrates how Safety Instrumented Systems are different from Basic Process Control
Systems, or the BPCS. In this example, pressure is a potential hazard. Pressure is normally controlled by
a regulatory control loop, shown as the Basic Process Control System, which modulates a pressure control
valve. An independent high-pressure shutdown function is implemented in a Safety Instrumented
System. It is independent in as much as the components used in the BPCS and the SIS are separate,
physically and functionally. This includes the sensor components, the logic solver, as well as the final
control elements. SIS are generally independent, both physically and functionally, from the BPCS in order
to ensure that any condition, which might result in an out-of-control process parameter in the BPCS, is
safeguarded by the SIS, regardless of the function of the BPCS.
Figure 1 – SIS versus BPCS
The SIS will include three types of components including sensor components, a logic solver component,
and final control elements. Together these components make up the Safety Instrumented System, which
detects out-of-control process conditions, and automatically returns the process to a safe condition,
regardless of the functioning of the Basic Process Control System. In this case, the SIS could include a
programmable system, or a non-programmable system.
Legislation and Regulation
Legal requirements for Safety Instruments Systems in the United States are derived from a variety of
process safety management regulations, as well as the legislation that serve as the foundation of those
regulations. While the discussion in this handbook focuses on the US, a similar framework is utilized in
most regions of the world.
Regulations require compliance with recognized and generally accepted good engineering practices for
safety critical controls, including SIS. These regulations require recognized and generally accepted good
engineering practices to ensure that industry complies with the norms of operation that have been defined
3
for that industry. Regulations and standards that apply to Safety Instrumented Systems originated in the
late 1980’s when industry regulators, including the U.S. Occupational Safety and Health Administration
(OSHA), as well as the U.S. Environmental Protection Agency (EPA), concluded that industry’s
performance with respect to prevention of major hazards was inadequate. This originated Process Safety
Management Standards by OSHA, which were propagated in 1992 under 29 CFR 1910.119. In 1996, the
EPA propagated its Accidental Release Prevention Program, or 40 CFR Part 68, which is also called Risk
Management Program. This regulatory standard was substantially similar in the requirements to OSHA’s
Process Safety Management Standard. Largely in response to these regulations, the International Society
for Automation (ISA) as well as the International Electrotechnical Commission, or IEC, developed industry
standards for safety critical control systems to provide additional information on how to comply with OSHA
and EPA process safety management regulations.
Why develop SIS standards?
As was previously noted, regulations regarding process safety came about due to a perception of
inadequate policies and procedures regarding safety in the process industries. Many of the lessons that
have been learned from major accident investigations point to the lack of functional safety as a key cause
in loss of life, as well as other property damage, and lost production incidence in the petroleum and
chemical industries. Upon review of the accident history of the process industries with respect to
scenarios where SIS failure contributed, several common themes developed.
➢ Often, no SIS was installed when it could be argued that was necessary for safety to be automated. In
fact, in many of these cases no study to assess the risks posed by the process was performed at all.
➢ In some instances, a poor decision making process was used to determine when safety should be
automated versus left to another system. This included deciding if operator intervention or the basic
process control was adequate in lieu of a separate instrumented system that is dedicated to safety.
➢ Incident histories also point to questionable equipment selection as another cause for lack of functional
safety that resulted in major accidents and losses.
➢ Lack of redundancy and diagnostic features of SIS was another frequent cause.
➢ Poor testing methods and poor determination of the frequencies for functional testing was also a cause
in many of the losses that were seen related to lack of functional safety, as well as improper bypassing
and equipment selection techniques.
Together, these causes point to the need for improved practices for ensuring functional safety
management is achieved. The implications of the accident data on Safety Instrumented System
engineering are listed below, and incorporated into the IEC 61511 (ISA 84.00.01) standard for SIS
design and implementation.
➢ We should select criteria for when to use alarms and operator judgment verses an automatic
shutdown, using a SIS, when predefined safe operating limits have been violated and the risk is
significant enough that manual means are insufficient.
➢ It is also important to recognize that in order to prevent major hazards, a defense in depth strategy
involving multiple, independent layers of protection or safeguards is necessary to prevent major
accidents. We recognize this because in some cases, safeguards can fail resulting in demands on SIS.
4
➢ We also recognize that inadequate specification of SIS is often a fundamental cause of accidents where
functional safety was inadequate. This includes specification of components, system architecture,
diagnostic testing, as well as functional proof tests.
➢ In many cases, accident data shows that bypass and defeat of safety critical systems was also a
significant contributor to accident case histories.
In response to these factors, as well as other drivers in the industry, the ISA and IEC developed a
Standard for SIS that addresses many of these causes. It provides a Safety Lifecycle as the foundation to
address functional safety. The Safety Lifecycle includes identification, design, testing, maintenance, and
management of change. It’s a “Cradle-to-Grave” approach to safety that addresses fundamental
problems that could occur at any step during the design, operation, maintenance, and change of a Safety
Instrumented System.
In the U.S., OSHA requires industrial facilities that are covered by the Process Safety Management
regulation to comply with recognized and generally accepted good engineering practices. ISA posed the
question to OSHA as to whether their standard, ISA 84.00.01 for Safety Instrumented Systems, complies
with OSHA’s requirements for Process Safety Management. OSHA, in response to this question, agreed
that the ISA standard would be one example of compliance with the mechanical integrity requirements for
safety critical controls and shutdown systems. OSHA also indicated that this was only one example - it
was not the only way - that a company could comply with the Process Safety Management standard
requirements for mechanical integrity, as well as process safety information. Since that time most
process industry operating companies have come to agree that the safety lifecycle contained in IEC 61511
(ISA 84.00.01) is the optimal methodology for managing safety instrumented system design and
implementation.
What does the standard require?
Unlike other standards and practices in use prior to the release of IEC 61511 (ISA 84.00.01), this standard
does not provide a set of rules that define, in details, how a system should be designed. Instead it lays
out a framework for allowing each individual user to determine what is appropriate for their specific
situation. It’s a performance-based approach to SIS rather than a prescriptive approach. In other words,
the standard does not take the position of prescribing: what types of components, what types of
architecture, what types of diagnostic testing, how often, and what functionally tests a Safety
Instrumented System? Rather, the standard establishes a performance or goal-setting approach. In
other words, users should select an appropriate performance target for a Safety Instrumented System
function, and design the system accordingly to achieve that level of performance.
The standard defines a Safety Lifecycle with multiple steps that should be taken to achieve functional
safety in a “Cradle-to-Grave” approach for functional safety management. The standard requires the
selection and achievement of a target performance level. That key performance level is the Safety
Integrity Level (SIL), which is selected for each Safety Instrumented Function within a SIS using risk-
based approaches. The SIL is the fundamental metric for all subsequent decision making about the design
of the SIS.
The standards bodies (IEC and ISA) and government regulators (e.g., OSHA in the U.S.) generally agree
on the different approach to existing equipment versus new engineering design. Good engineering
practice for new design would include compliance with recognized and generally accepted engineering
standards, including IEC 61511. However, existing equipment could be treated slightly differently,
depending on how each company decides to handle an approach to grandfathering of existing equipment.
“Grandfathering” of existing equipment is allowed in the U.S. under OSHA’s Process Safety Management
5
Standard, and is also allowed under the ISA 84.00.01 version of the IEC 61511 version of the SIS
standard. The standard says, “For existing systems, designed and constructed in accordance with codes,
standards, or practices prior to the issue of this standard, the owner/operator shall determine, and if any
equipment is designed, maintained, inspected, tested, and operated in a safe manner.” In other words, it
does not prescribe that old equipment designed to previous engineering standards needs to be up to the
current SIS standard; rather a system should be in place to verify that equipment is operated, tested,
inspected, maintained, and designed according to safe standards of the time. The acceptability of
“grandfathering” may vary depending on the location in which a SIS is employed.
The Safety Lifecycle
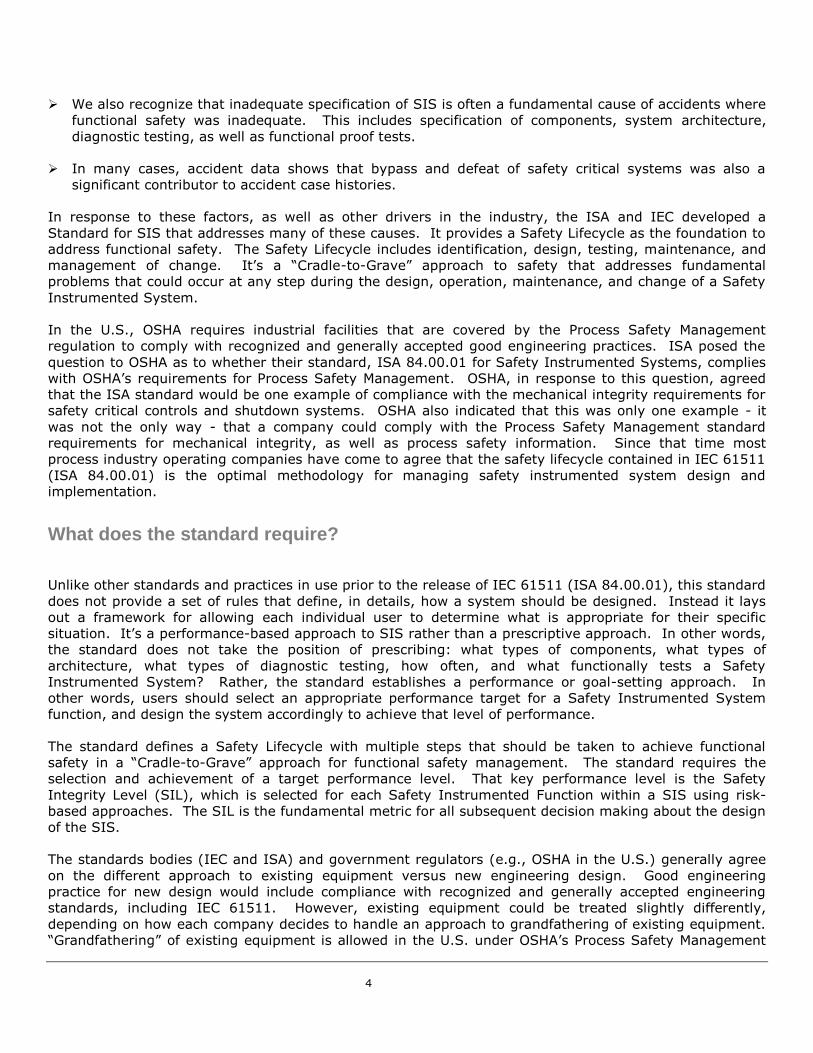
Figure 2 presents the SIS Safety Lifecycle as prescribed in IEC 61511 (ISA 84.00.01). The Safety
Lifecycle includes a number of specific steps from design through operation, maintenance, testing, and
even decommissioning, to address safety throughout the lifetime of a Safety Instrumented System in the
petroleum or chemical process.
Figure 2 – IEC 61511 Safety Lifecycle
The first step in the Safety Lifecycle is “Hazard and Risk Assessment”. The premise of this step is that to
adequately design a Safety Instrumented System, we must fully understand the hazards against which
that system is intended to safeguard. If we don’t have an adequate understanding of those hazards, the
system might be improperly designed with respect to the types of components that are used, the type of
redundancy or architecture that is selected, and other factors that are pertinent to SIS engineering design.
The next step, “Allocation of Safety Functions”, involves assigning certain levels of integrity to each of the
safeguards that are used in the process, including Safety Instrumented Functions, as well as non-
instrumented functions to achieve an overall level of safety that is acceptable to the company that is
operating that process.
The third step in the Safety Lifecycle is “Safety Requirement Specifications”. This is an important step to
achieve overall functional safety. In the conceptual design of a process, we must make sure that the
safety requirements are adequately specified prior to proceeding to other steps in the engineering design
lifecycle, including detailed design, construction, installation, and commissioning. This step is where the
objectives and means for achieving those objectives are defined. Once completed, the Safety
Requirements Specifications (SRS) form the basis for all subsequent design and validation activities.
6
The steps after SRS (which are often performed in parallel by different groups) are “Detail Design and
Engineering” and “Design and Development” of other non-safety instrumented system safeguards. This
stage is where the information in the SRS is expanded into more detailed documentation that is used for
purchase of equipment, equipment configuration, and installation. This includes tasks such as creating
equipment lists, cabinet layout diagrams, internal wiring diagrams, interconnecting wiring diagrams, and
PLC programs.
After the detailed design of the SIS is complete the following step is “Installation, Commissioning, and
Validation” of the Safety Instrumented System itself. This stage involves factory acceptance testing
(FAT), physical installation of the SIS logic solver and all of the field instrumentation, commissioning of
those devices, and a validation step that will include site acceptance testing (SAT) and pre-startup
acceptance testing (PSAT).
Once the SIS is installed and operational, a different phase of the lifecycle begins where the design team
passes responsibility for the equipment to the operations and maintenance team of the operating
company. The “Operation and Maintenance” involves the routine day-to-day interaction with a functioning
system. During this phase, operations staff will respond to overt system alarms utilizing procedures
written for that purpose. In addition, maintenance will repair the system in response to overt faults and
also perform periodic function testing to ensure the system’s proper operation.
The “Decommissioning” and “Modification” steps are very similar in nature. If changes to the SIS or to
the process under control occur, measures must be taken so that the SIS is not compromised in its ability
to provide the required amount of risk reduction. During this phase Management of Change (MOC)
requirements apply to ensure that when changes are made to the process that are outside the SRS, those
changes are adequately analyzed for potential hazards prior to implementing the change.
Decommissioning is a special form of modification where analysis of the removed equipment must be
analyzed with respect to its impact on the equipment that will stay in service.
There are three other steps of the Safety Lifecycle that occur over the entire length of an SIS lifetime.
These steps are “Management of Functional Safety and Functional Safety Assessment and Auditing”,
“Safety Lifecycle Structure and Planning”, and “Verification”. In order to execute a functional safety
project effectively, management of the entire process is important. Management tasks such as assigning
tasks to qualified resources can have a bearing on the project, and thus standard requirements were set.
Each step along the way, the standard requires that we verify that the outputs of each step in the Safety
Lifecycle have been achieved, and are consistent with the inputs to that step of the Safety Lifecycle.
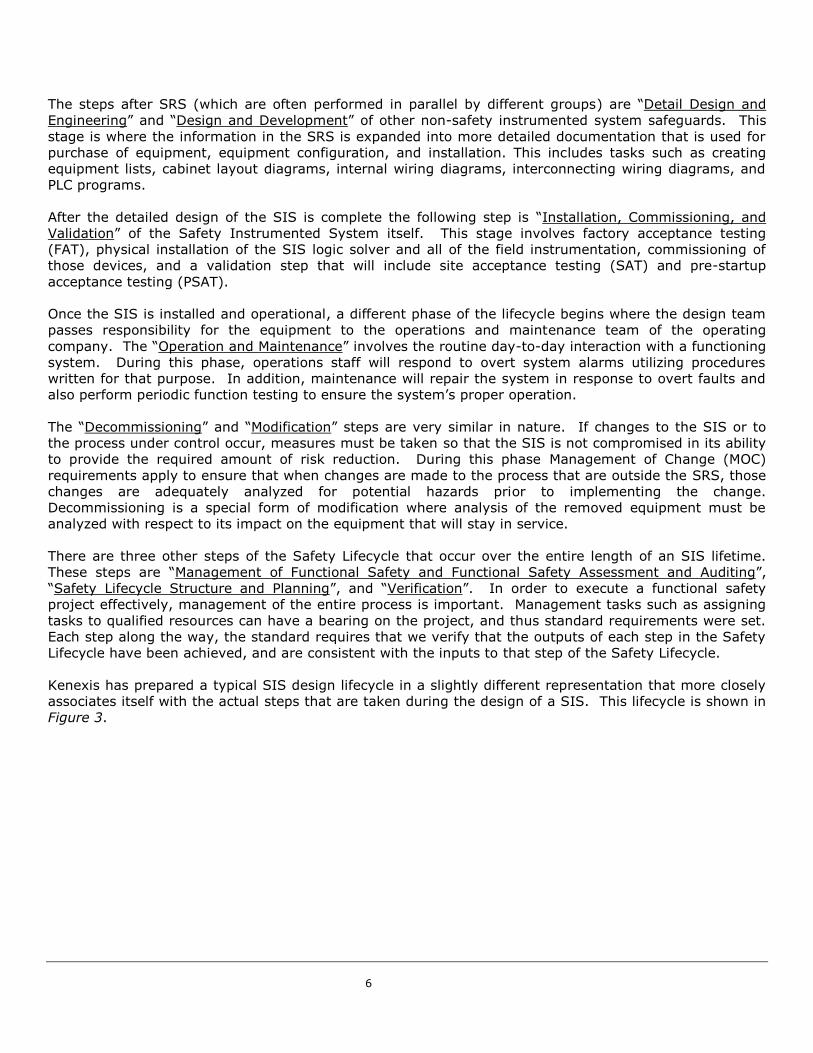
Kenexis has prepared a typical SIS design lifecycle in a slightly different representation that more closely
associates itself with the actual steps that are taken during the design of a SIS. This lifecycle is shown in
Figure 3.
7
Figure 3 – Kenexis Safety Lifecycle
The steps in the Kenexis Safety Lifecycle are more granular than what is shown in the standard, and thus
functions more effectively as a flowchart of an SIS project than does the lifecycle in IEC 61511.
8
Conceptual Process Design
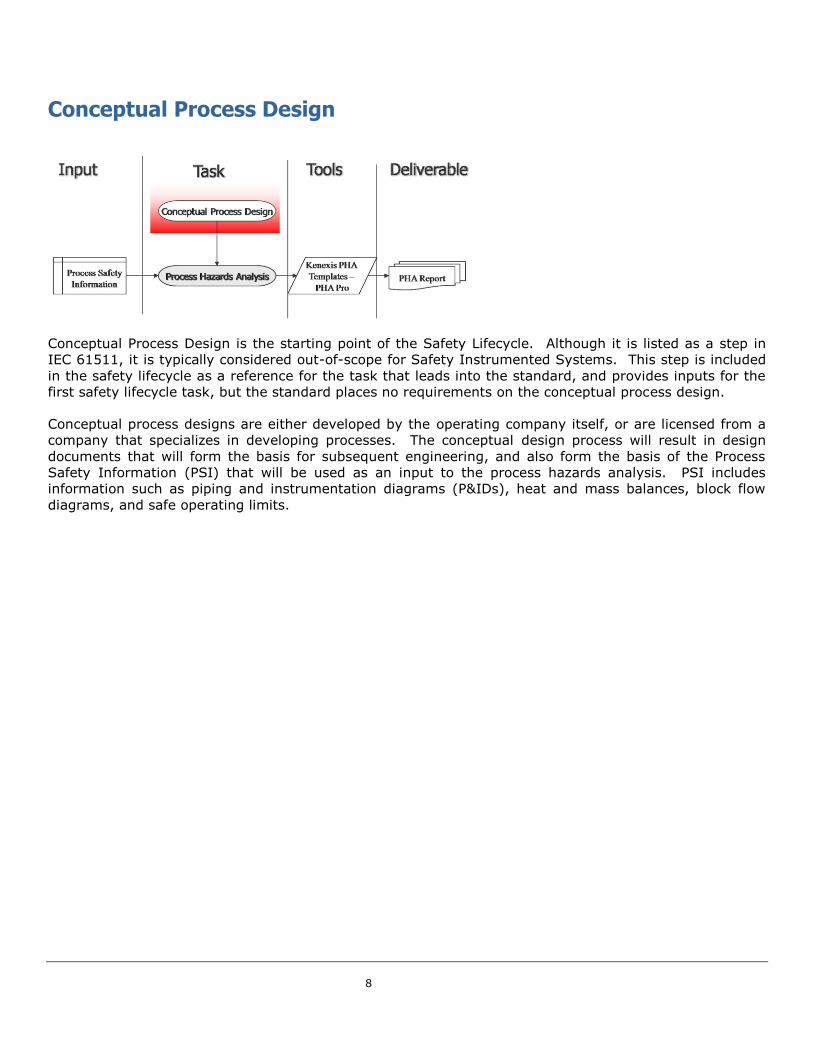
Conceptual Process Design is the starting point of the Safety Lifecycle. Although it is listed as a step in
IEC 61511, it is typically considered out-of-scope for Safety Instrumented Systems. This step is included
in the safety lifecycle as a reference for the task that leads into the standard, and provides inputs for the
first safety lifecycle task, but the standard places no requirements on the conceptual process design.
Conceptual process designs are either developed by the operating company itself, or are licensed from a
company that specializes in developing processes. The conceptual design process will result in design
documents that will form the basis for subsequent engineering, and also form the basis of the Process
Safety Information (PSI) that will be used as an input to the process hazards analysis. PSI includes
information such as piping and instrumentation diagrams (P&IDs), heat and mass balances, block flow
diagrams, and safe operating limits.
9
Process Hazards Analysis
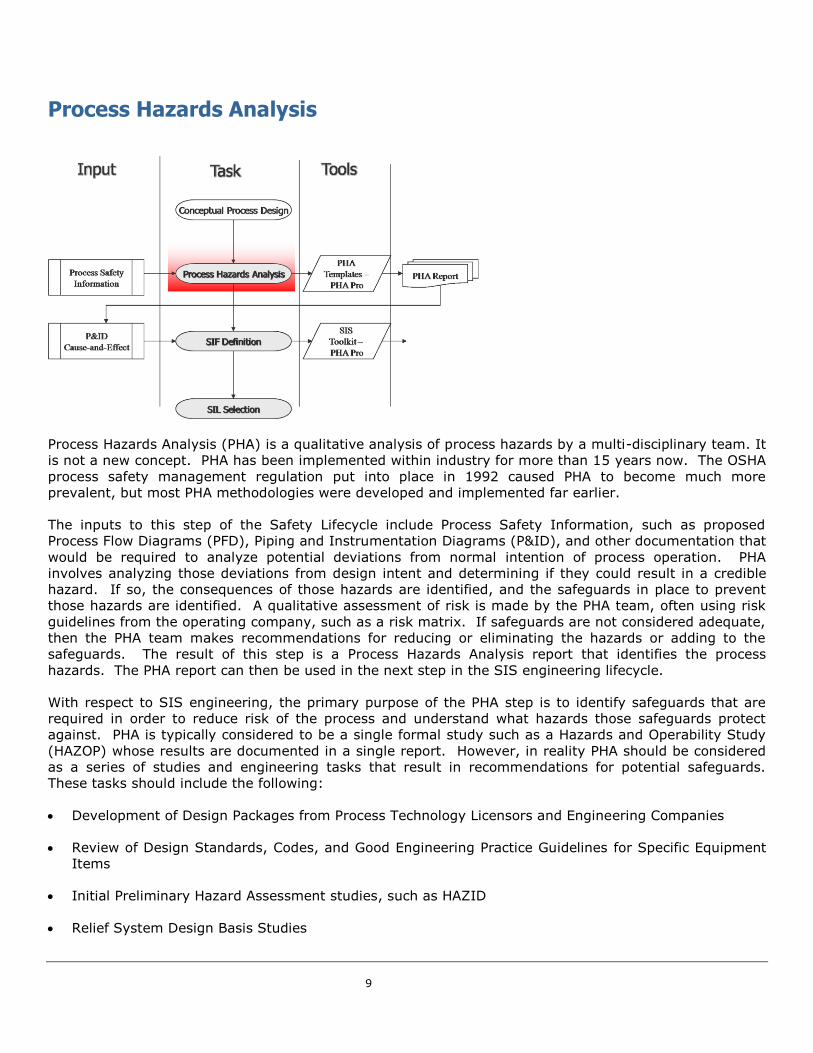
Process Hazards Analysis (PHA) is a qualitative analysis of process hazards by a multi-disciplinary team. It
is not a new concept. PHA has been implemented within industry for more than 15 years now. The OSHA
process safety management regulation put into place in 1992 caused PHA to become much more
prevalent, but most PHA methodologies were developed and implemented far earlier.
The inputs to this step of the Safety Lifecycle include Process Safety Information, such as proposed
Process Flow Diagrams (PFD), Piping and Instrumentation Diagrams (P&ID), and other documentation that
would be required to analyze potential deviations from normal intention of process operation. PHA
involves analyzing those deviations from design intent and determining if they could result in a credible
hazard. If so, the consequences of those hazards are identified, and the safeguards in place to prevent
those hazards are identified. A qualitative assessment of risk is made by the PHA team, often using risk
guidelines from the operating company, such as a risk matrix. If safeguards are not considered adequate,
then the PHA team makes recommendations for reducing or eliminating the hazards or adding to the
safeguards. The result of this step is a Process Hazards Analysis report that identifies the process
hazards. The PHA report can then be used in the next step in the SIS engineering lifecycle.
With respect to SIS engineering, the primary purpose of the PHA step is to identify safeguards that are
required in order to reduce risk of the process and understand what hazards those safeguards protect
against. PHA is typically considered to be a single formal study such as a Hazards and Operability Study
(HAZOP) whose results are documented in a single report. However, in reality PHA should be considered
as a series of studies and engineering tasks that result in recommendations for potential safeguards.
These tasks should include the following:
• Development of Design Packages from Process Technology Licensors and Engineering Companies
• Review of Design Standards, Codes, and Good Engineering Practice Guidelines for Specific Equipment
Items
• Initial Preliminary Hazard Assessment studies, such as HAZID
• Relief System Design Basis Studies
10
• Alarm Rationalization Studies
• Chemical Reactivity Testing and Analysis
• Formal Process Hazards Analysis
A preliminary process design is rarely performed starting from a blank slate. Often, process design is
based on proven technologies used for years. There are often process design templates from process
licensors that contain important information about hazards and key safeguards. These licensor packages
identify Safety Instrumented Functions that have been included by process licensors based on past
experience with design and operation of the process technology. Furthermore, most process plants
include a large number of common pieces of process equipment that require safeguarding through SIS.
These include pumps, compressors, and fired equipment. Often, this equipment is designed and
safeguarded in accordance with equipment specific standards such as the National Fire Protection
Association (NFPA) standards for fired equipment including boilers, as well as the American Petroleum
Institute’s (API) recommended practices for designs for fired equipment, compressors, and other rotating
equipment.
Other engineered safeguard design basis studies may also yield requirements for safety instrumented
systems. Studies such as relief system design basis, alarm management study, or chemical reactivity
study often result in recommendations for SIS especially when other means of safeguarding are
determined to be inappropriate or less effective than use of SIS.
The tasks that are traditionally considered PHA are essentially “structured brainstorming” techniques
where a trained facilitator generates discussion among a group of experts with regards to the hazards
potentially posed by a process by leading the discussion with cues that are designed to stimulate thought.
For instance, in a HAZOP the cues are deviations from design intent for a specific process section such as
less flow or more level. Formal PHA studies are typically performed at several stages in the lifecycle of a
process plant. In many cases the first studies are carried out using simpler techniques (e.g., checklists,
HAZID) and later studies using more detailed methods such as HAZOP. At the point in time that a final
PHA is performed, the great preponderance of engineered safeguards have already been documented in
the plant’s design and the PHA simply acts as a final check on a good design.
With respect to the SIS safety lifecycle, it is important for the selection of a SIL target to be consistent
with other PHA studies performed for the process plant. In addition, the information provided in these
studies can provide valuable assistance and insight during the SIL selection effort.
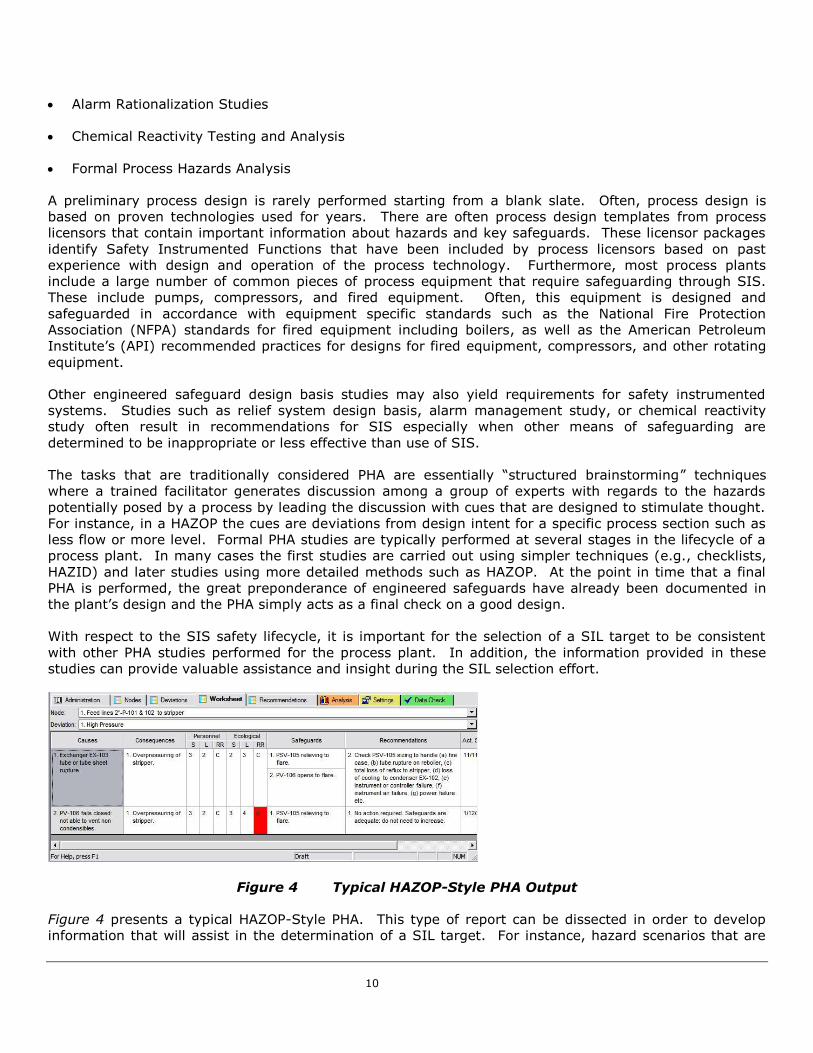
Figure 4 Typical HAZOP-Style PHA Output
Figure 4 presents a typical HAZOP-Style PHA. This type of report can be dissected in order to develop
information that will assist in the determination of a SIL target. For instance, hazard scenarios that are
11
listed are typically assigned consequence categories, the causes can often be used as initiating events,
and the safeguards can be considered as independent protection layers. Also, recommendations from the
PHA might identify the need for additional SIF that were not identified by other prior analysis.
In summary, this step in the safety lifecycle should not be considered as conducting a “traditional PHA”,
but a comprehensive series of activities to identify and understand the hazards that require safeguarding
by the SIS.
12
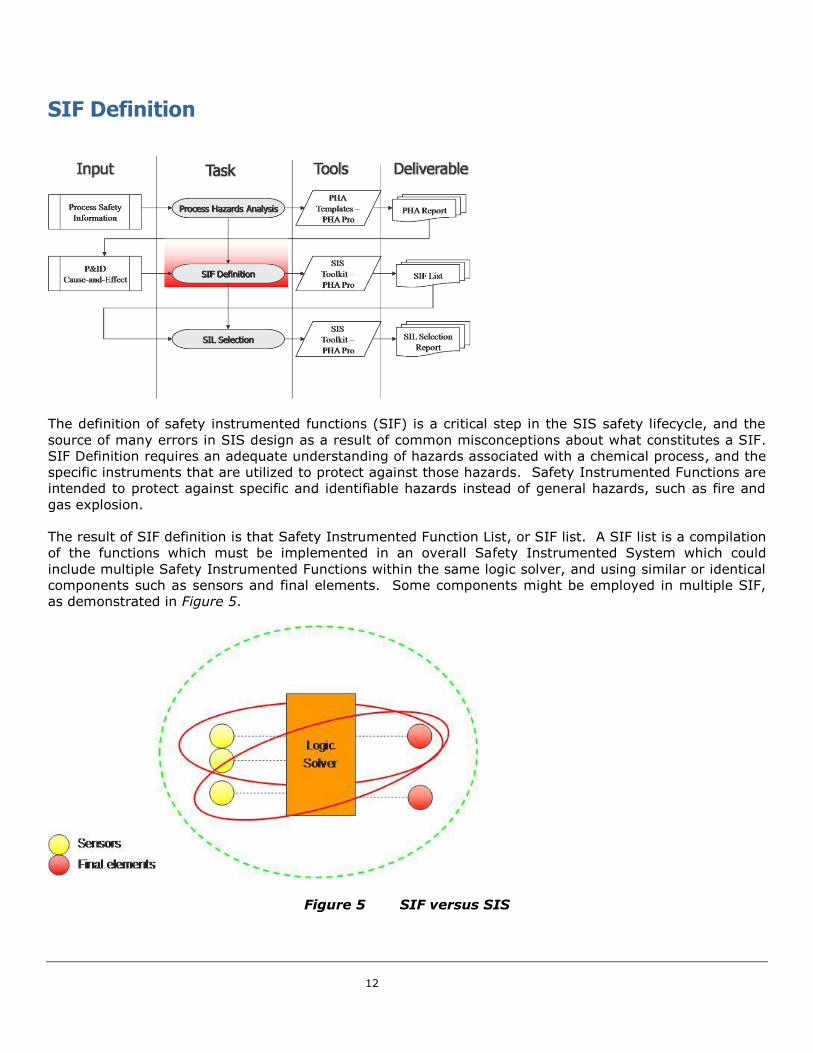
SIF Definition
The definition of safety instrumented functions (SIF) is a critical step in the SIS safety lifecycle, and the
source of many errors in SIS design as a result of common misconceptions about what constitutes a SIF.
SIF Definition requires an adequate understanding of hazards associated with a chemical process, and the
specific instruments that are utilized to protect against those hazards. Safety Instrumented Functions are
intended to protect against specific and identifiable hazards instead of general hazards, such as fire and
gas explosion.
The result of SIF definition is that Safety Instrumented Function List, or SIF list. A SIF list is a compilation
of the functions which must be implemented in an overall Safety Instrumented System which could
include multiple Safety Instrumented Functions within the same logic solver, and using similar or identical
components such as sensors and final elements. Some components might be employed in multiple SIF,
as demonstrated in Figure 5.
Figure 5 SIF versus SIS
13
The purpose of SIF definition is to create a list of all the functions that need to be analyzed in the
remaining steps of the Safety Lifecycle including SIL selection, Safety Requirement Specification,
Functional Test Procedure development, and so on. Safety Instrumented Functions are identified on a
hazard-by-hazard basis, as opposed to strictly considering the functionality executed by the SIF.
Therefore, it is imperative that this step is done adequately, with sufficient thought as to the hazards that
are involved in the process, and the equipment or components that could be used to detect and take
corrective action once those hazards are identified.
Identification of Safety Instrumented Functions is performed considering a range of design documentation
including Cause and Effect Diagrams, and Piping and Instrumentation Diagrams. The SIF List is a list of all
functions that needs to be analyzed. Each SIF is assigned its own Safety Integrity Level, individually, in
order to represent the risk reduction required to mitigate the specific hazard associated with that function.
The integrity level requires or defines the performance for that function in terms of its ability to achieve a
tolerable risk target that is established by the company operating the process.
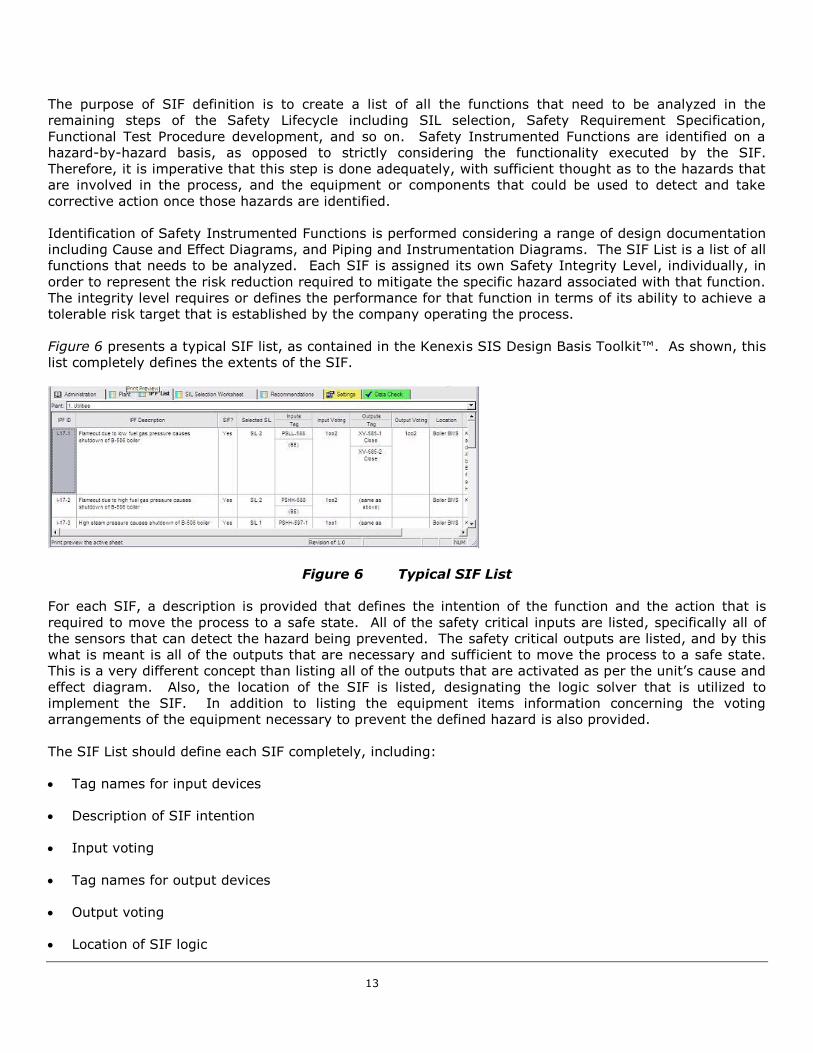
Figure 6 presents a typical SIF list, as contained in the Kenexis SIS Design Basis Toolkit™. As shown, this
list completely defines the extents of the SIF.
Figure 6 Typical SIF List
For each SIF, a description is provided that defines the intention of the function and the action that is
required to move the process to a safe state. All of the safety critical inputs are listed, specifically all of
the sensors that can detect the hazard being prevented. The safety critical outputs are listed, and by this
what is meant is all of the outputs that are necessary and sufficient to move the process to a safe state.
This is a very different concept than listing all of the outputs that are activated as per the unit’s cause and
effect diagram. Also, the location of the SIF is listed, designating the logic solver that is utilized to
implement the SIF. In addition to listing the equipment items information concerning the voting
arrangements of the equipment necessary to prevent the defined hazard is also provided.
The SIF List should define each SIF completely, including:
• Tag names for input devices
• Description of SIF intention
• Input voting
• Tag names for output devices
• Output voting
• Location of SIF logic
14
Additional information such as interlock numbers, P&ID drawing numbers and general notes may also be
included for complete documentation purposes.
15
Safety Integrity Level Selection
Once all of the functions that are in the scope of analysis have been defined in the SIF list, Safety
Integrity Level (SIL) Selection is performed. At this stage, the SIFs are analyzed sequentially looking at
the hazards, identifying the appropriate perimeters that affect the risk of those hazards, and selecting an
appropriate SIL to achieve a desired risk tolerance threshold. It is important to remember that the
purpose of SIL Selection is to define performance criteria for the system. It is not to define the SIF, but
rather prescribe how much risk reduction is required of each of those SIF.
Defining SIL
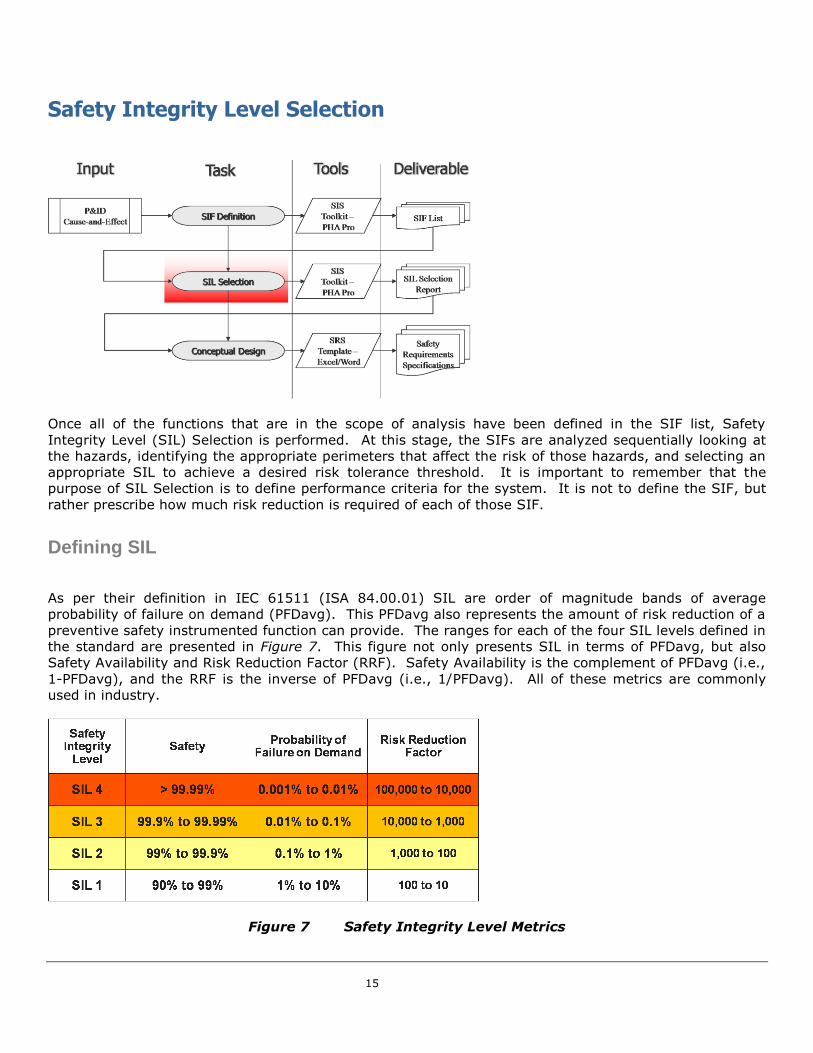
As per their definition in IEC 61511 (ISA 84.00.01) SIL are order of magnitude bands of average
probability of failure on demand (PFDavg). This PFDavg also represents the amount of risk reduction of a
preventive safety instrumented function can provide. The ranges for each of the four SIL levels defined in
the standard are presented in Figure 7. This figure not only presents SIL in terms of PFDavg, but also
Safety Availability and Risk Reduction Factor (RRF). Safety Availability is the complement of PFDavg (i.e.,
1-PFDavg), and the RRF is the inverse of PFDavg (i.e., 1/PFDavg). All of these metrics are commonly
used in industry.
Figure 7 Safety Integrity Level Metrics
16
SIL 1 is the lowest level of Safety Integrity that is defined by safety availability by at least 90% up to
99%, essentially providing one order of magnitude of risk reduction. SIL 2 is an order of magnitude safer
than SIL 1 in terms of its safety availability. The safety availability of a SIL 2 function would be at least at
least 99% and up to 99.9% safety available. SIL 3 is an order of magnitude on top of SIL 2 in terms of
safety availability, and SIL 4 follows accordingly. SIL 4 is rarely - if ever - seen in the process industries,
and is often reserved for application to other non-process related industries that could be covered by
international standards for Safety Instrumented System design. If a SIL selection process results in a
requirement for SIL 4 the user should proceed with care and obtain the assistance of experts.
SIL Selection Process
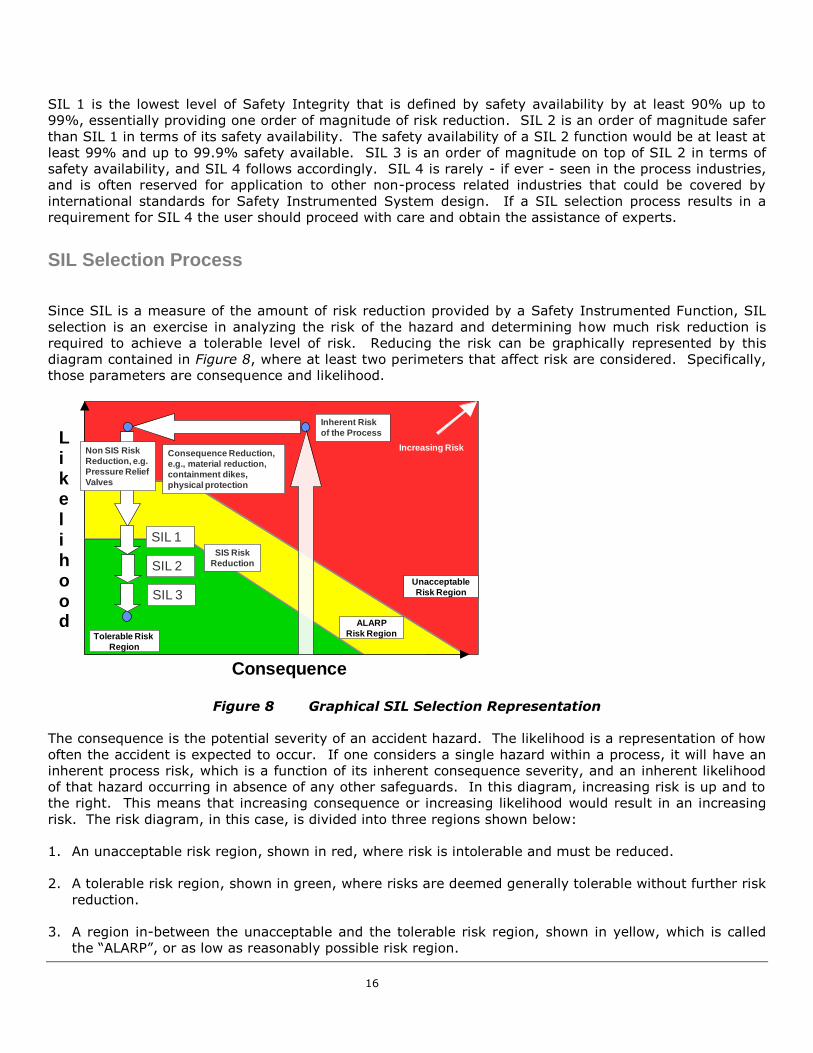
Since SIL is a measure of the amount of risk reduction provided by a Safety Instrumented Function, SIL
selection is an exercise in analyzing the risk of the hazard and determining how much risk reduction is
required to achieve a tolerable level of risk. Reducing the risk can be graphically represented by this
diagram contained in Figure 8, where at least two perimeters that affect risk are considered. Specifically,
those parameters are consequence and likelihood.
Consequence
Likelihood
Tolerable Risk
Region
ALARP
Risk Region
Unacceptable
Risk Region
Consequence Reduction,
e.g., material reduction,
containment dikes,
physical protection
Inherent Risk
of the Process
Increasing Risk
SIL 1
SIL 2
SIL 3
Non SIS Risk
Reduction, e.g.
Pressure Relief
Valves
SIS Risk
Reduction
Figure 8 Graphical SIL Selection Representation
The consequence is the potential severity of an accident hazard. The likelihood is a representation of how
often the accident is expected to occur. If one considers a single hazard within a process, it will have an
inherent process risk, which is a function of its inherent consequence severity, and an inherent likelihood
of that hazard occurring in absence of any other safeguards. In this diagram, increasing risk is up and to
the right. This means that increasing consequence or increasing likelihood would result in an increasing
risk. The risk diagram, in this case, is divided into three regions shown below:
1. An unacceptable risk region, shown in red, where risk is intolerable and must be reduced.
2. A tolerable risk region, shown in green, where risks are deemed generally tolerable without further risk
reduction.
3. A region in-between the unacceptable and the tolerable risk region, shown in yellow, which is called
the “ALARP”, or as low as reasonably possible risk region.
17
In order to achieve a level of risk that is broadly acceptable, the user is required to show that risk is in the
green area of this diagram.
The inherent risk can be reduced by Non-SIS risk reduction. In order to assess the risk one, is required to
know and evaluate the effectiveness of all Non-SIS risk reduction measures to ensure that the risk is
reduced to as low as possible before we apply the additional benefit of a SIS. Or in fact, address whether
or not we need a SIS to further reduce the risk.
Non-SIS risk reduction could include consequence reduction measures, as well as likelihood reduction
measures. “Consequence Reduction” could take the form of containment dikes, or physical protections
such as blast walls, or blast-resistant control buildings. “Likelihood Reduction” could take the form of
operators responding to safety critical alarms, or pressure relief provided by conventional over-pressure
protection.
In the example shown in Figure 8, the benefit of all these Non-SIS layers of protection, or safeguards, is
not sufficient to achieve tolerable risk. Therefore, additional risk reduction is required, and in this
example, a SIL 1 level of risk reduction, a SIL 1 performance, is adequate to achieve a tolerable risk. In
this example, we would specify a SIL 1 level of performance to achieve tolerable risk for a Safety
Instrumented Function that protects against this hazard. Each SIL level provides a one order of
magnitude decrease in the frequency of the event.
Representing Tolerable Risk for SIL Selection
For the purposes of performing SIL selection, companies often, represent their risk tolerance in terms of
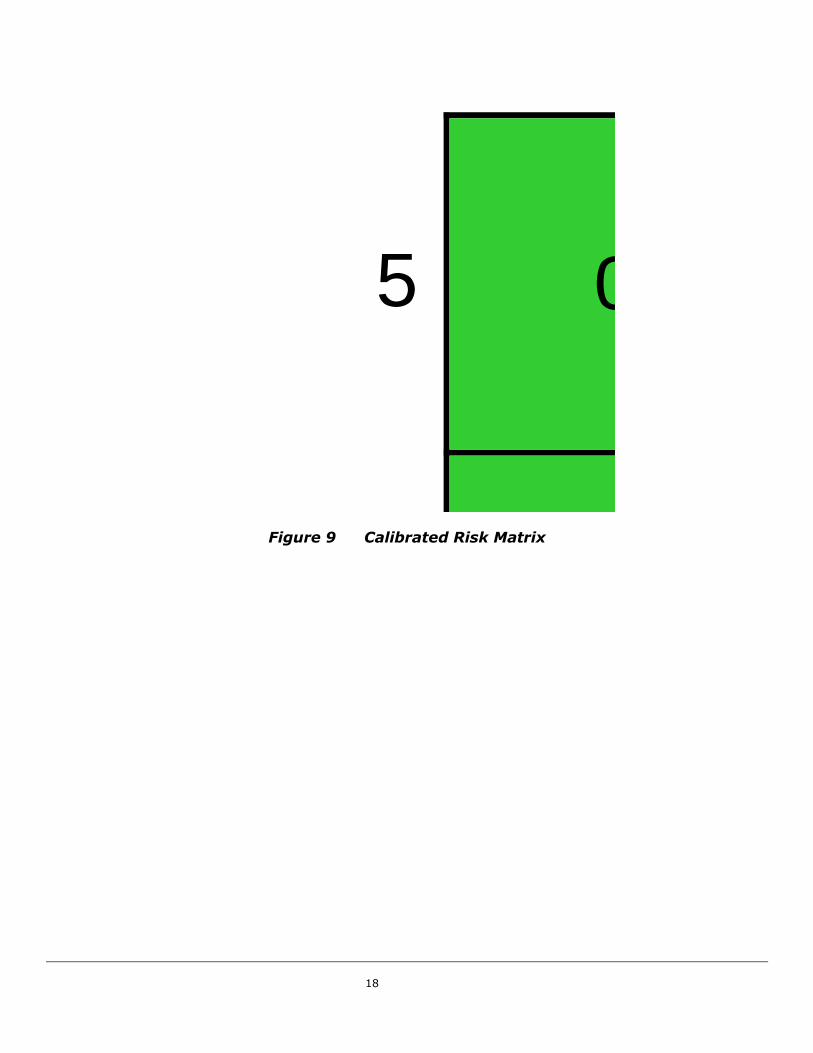
either risk matrices or Tolerable Maximum Event Likelihood (TMEL) Tables. Figure 9 shows an example
risk matrix and Figure 10 contains a consequence categorization table that includes TMEL figures for each
consequence category. These risk tools are utilized for day-to-day risk engineering tasks, and are
calibrated against corporations’ tolerable risk guidelines. Calibration details for these example risk tools
are contained in Appendix H.
18
0
0
0
0
0
0
3
2
1
0
0
0
4
3
2
1
0
0
5
4
3
2
1
0
6
5
4
3
2
0
7
6
5
4
3
0
0 1 2 3 4 5
5
4
3
2
1
0
LIKELIHOOD
SE
VE
RIT
Y -
SA
FE
TY
Figure 9 Calibrated Risk Matrix
19
S Category Safety Environment Commercial TMEL
0 None No significant safety consequence
None None N/A
1 Very Low Minor injury - first aid Small release with minimal clean up requirements
$50,000 1E-02
2 Low Lost time injury not requiring extended hospitalization
Moderate release limited to onsite damage with moderate clean up effort
$500,000 1E-03
3 Moderate Severe injury (extended hospitalization, dismemberment)
Large release with limited offsite impact requires significant onsite clean up
$5 Million 1E-04
4 High Single fatality Large release offsite on extensive clean up and damage to sensitive areas
$50 Million 1E-05
5 Very High Multiple fatalities Very large release off site with extensive clean of and permanent damage to several sensitive areas
$500 Million 1E-06
Figure 10 Consequence Category Table with TMEL
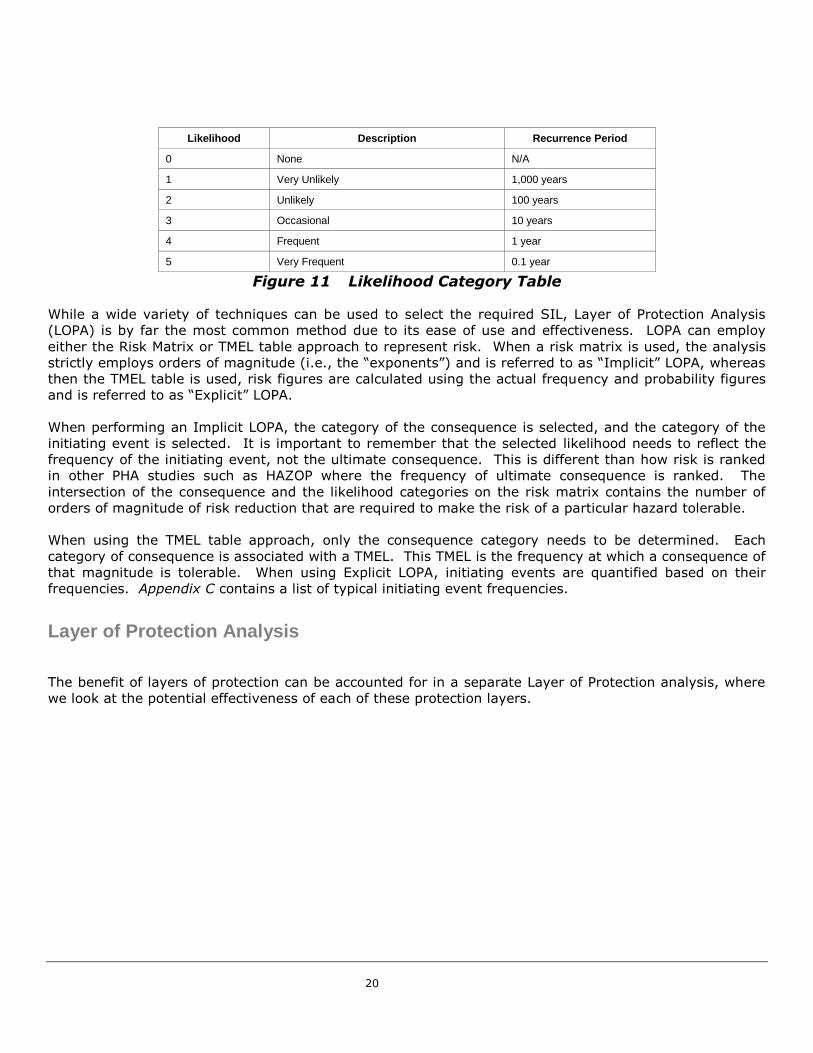
Figure 11 shows an example likelihood category table which would be used in combination with the
consequence table when using the Risk Matrix approach.
20
Likelihood Description Recurrence Period
0 None N/A
1 Very Unlikely 1,000 years
2 Unlikely 100 years
3 Occasional 10 years
4 Frequent 1 year
5 Very Frequent 0.1 year
Figure 11 Likelihood Category Table
While a wide variety of techniques can be used to select the required SIL, Layer of Protection Analysis
(LOPA) is by far the most common method due to its ease of use and effectiveness. LOPA can employ
either the Risk Matrix or TMEL table approach to represent risk. When a risk matrix is used, the analysis
strictly employs orders of magnitude (i.e., the “exponents”) and is referred to as “Implicit” LOPA, whereas
then the TMEL table is used, risk figures are calculated using the actual frequency and probability figures
and is referred to as “Explicit” LOPA.
When performing an Implicit LOPA, the category of the consequence is selected, and the category of the
initiating event is selected. It is important to remember that the selected likelihood needs to reflect the
frequency of the initiating event, not the ultimate consequence. This is different than how risk is ranked
in other PHA studies such as HAZOP where the frequency of ultimate consequence is ranked. The
intersection of the consequence and the likelihood categories on the risk matrix contains the number of
orders of magnitude of risk reduction that are required to make the risk of a particular hazard tolerable.
When using the TMEL table approach, only the consequence category needs to be determined. Each
category of consequence is associated with a TMEL. This TMEL is the frequency at which a consequence of
that magnitude is tolerable. When using Explicit LOPA, initiating events are quantified based on their
frequencies. Appendix C contains a list of typical initiating event frequencies.
Layer of Protection Analysis
The benefit of layers of protection can be accounted for in a separate Layer of Protection analysis, where
we look at the potential effectiveness of each of these protection layers.
21
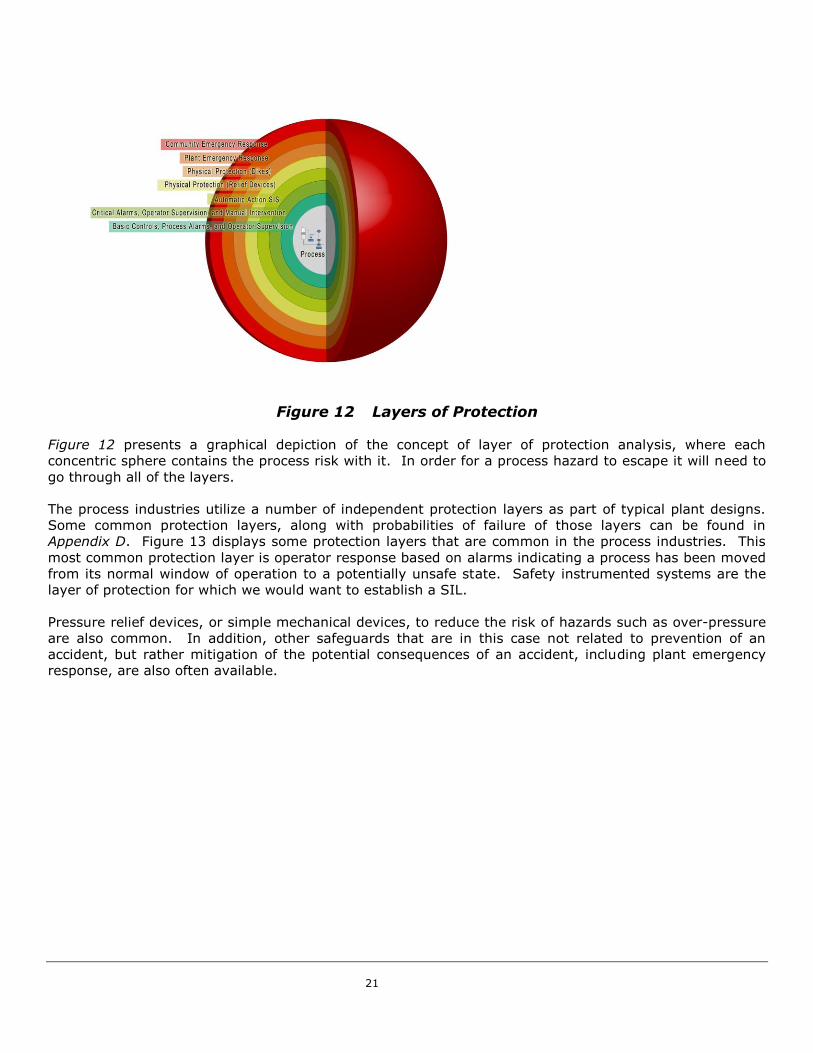
Figure 12 Layers of Protection
Figure 12 presents a graphical depiction of the concept of layer of protection analysis, where each
concentric sphere contains the process risk with it. In order for a process hazard to escape it will need to
go through all of the layers.
The process industries utilize a number of independent protection layers as part of typical plant designs.
Some common protection layers, along with probabilities of failure of those layers can be found in
Appendix D. Figure 13 displays some protection layers that are common in the process industries. This
most common protection layer is operator response based on alarms indicating a process has been moved
from its normal window of operation to a potentially unsafe state. Safety instrumented systems are the
layer of protection for which we would want to establish a SIL.
Pressure relief devices, or simple mechanical devices, to reduce the risk of hazards such as over-pressure
are also common. In addition, other safeguards that are in this case not related to prevention of an
accident, but rather mitigation of the potential consequences of an accident, including plant emergency
response, are also often available.
22
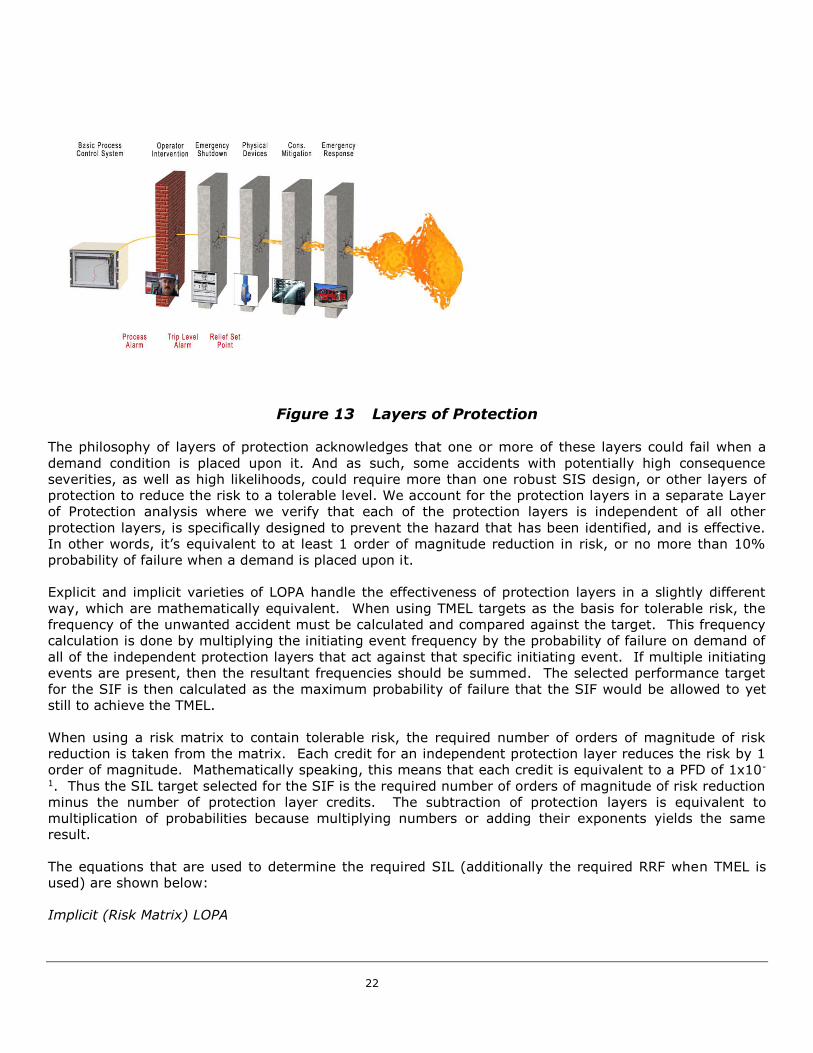
Figure 13 Layers of Protection
The philosophy of layers of protection acknowledges that one or more of these layers could fail when a
demand condition is placed upon it. And as such, some accidents with potentially high consequence
severities, as well as high likelihoods, could require more than one robust SIS design, or other layers of
protection to reduce the risk to a tolerable level. We account for the protection layers in a separate Layer
of Protection analysis where we verify that each of the protection layers is independent of all other
protection layers, is specifically designed to prevent the hazard that has been identified, and is effective.
In other words, it’s equivalent to at least 1 order of magnitude reduction in risk, or no more than 10%
probability of failure when a demand is placed upon it.
Explicit and implicit varieties of LOPA handle the effectiveness of protection layers in a slightly different
way, which are mathematically equivalent. When using TMEL targets as the basis for tolerable risk, the
frequency of the unwanted accident must be calculated and compared against the target. This frequency
calculation is done by multiplying the initiating event frequency by the probability of failure on demand of
all of the independent protection layers that act against that specific initiating event. If multiple initiating
events are present, then the resultant frequencies should be summed. The selected performance target
for the SIF is then calculated as the maximum probability of failure that the SIF would be allowed to yet
still to achieve the TMEL.
When using a risk matrix to contain tolerable risk, the required number of orders of magnitude of risk
reduction is taken from the matrix. Each credit for an independent protection layer reduces the risk by 1
order of magnitude. Mathematically speaking, this means that each credit is equivalent to a PFD of 1x10-
1. Thus the SIL target selected for the SIF is the required number of orders of magnitude of risk reduction
minus the number of protection layer credits. The subtraction of protection layers is equivalent to
multiplication of probabilities because multiplying numbers or adding their exponents yields the same
result.
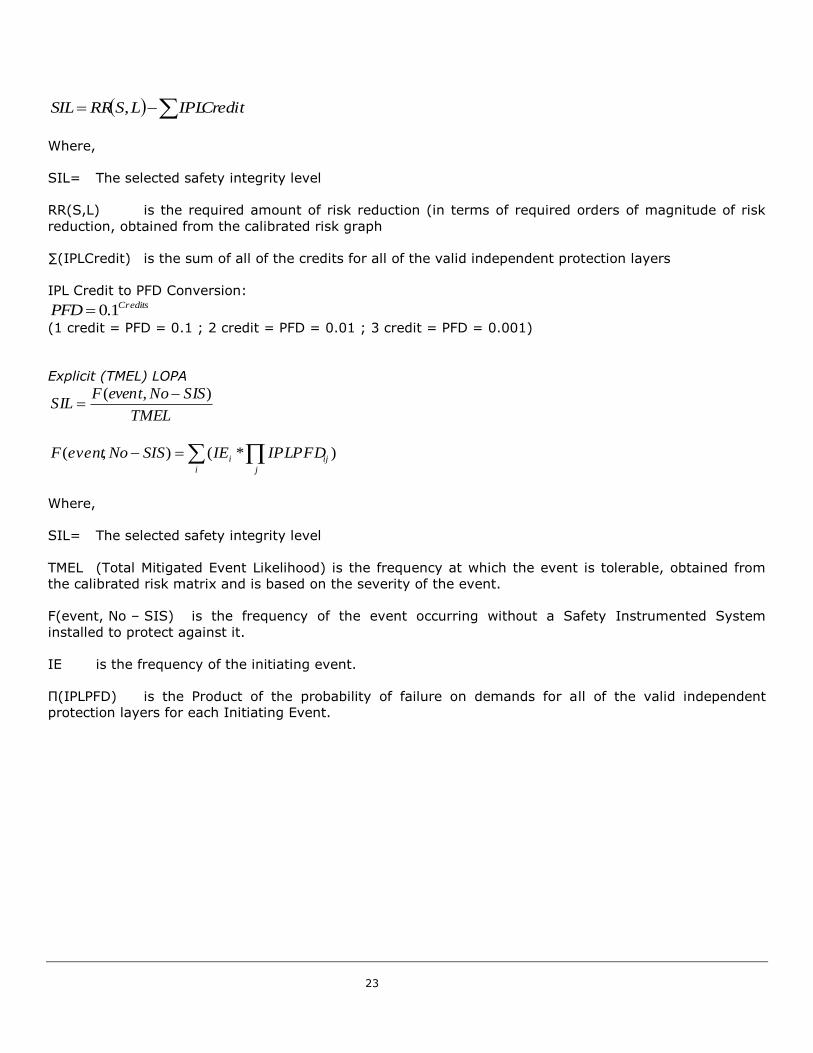
The equations that are used to determine the required SIL (additionally the required RRF when TMEL is
used) are shown below:
Implicit (Risk Matrix) LOPA
23
CreditIPLLSRRSIL ,
Where,
SIL= The selected safety integrity level
RR(S,L) is the required amount of risk reduction (in terms of required orders of magnitude of risk
reduction, obtained from the calibrated risk graph
∑(IPLCredit) is the sum of all of the credits for all of the valid independent protection layers
IPL Credit to PFD Conversion: CreditsPFD 1.0
(1 credit = PFD = 0.1 ; 2 credit = PFD = 0.01 ; 3 credit = PFD = 0.001)
Explicit (TMEL) LOPA
TMEL
SISNoeventFSIL
),(
i j
iji IPLPFDIESISNoeventF )*(),(
Where,
SIL= The selected safety integrity level
TMEL (Total Mitigated Event Likelihood) is the frequency at which the event is tolerable, obtained from
the calibrated risk matrix and is based on the severity of the event.
F(event, No – SIS) is the frequency of the event occurring without a Safety Instrumented System
installed to protect against it.
IE is the frequency of the initiating event.
П(IPLPFD) is the Product of the probability of failure on demands for all of the valid independent
protection layers for each Initiating Event.
24
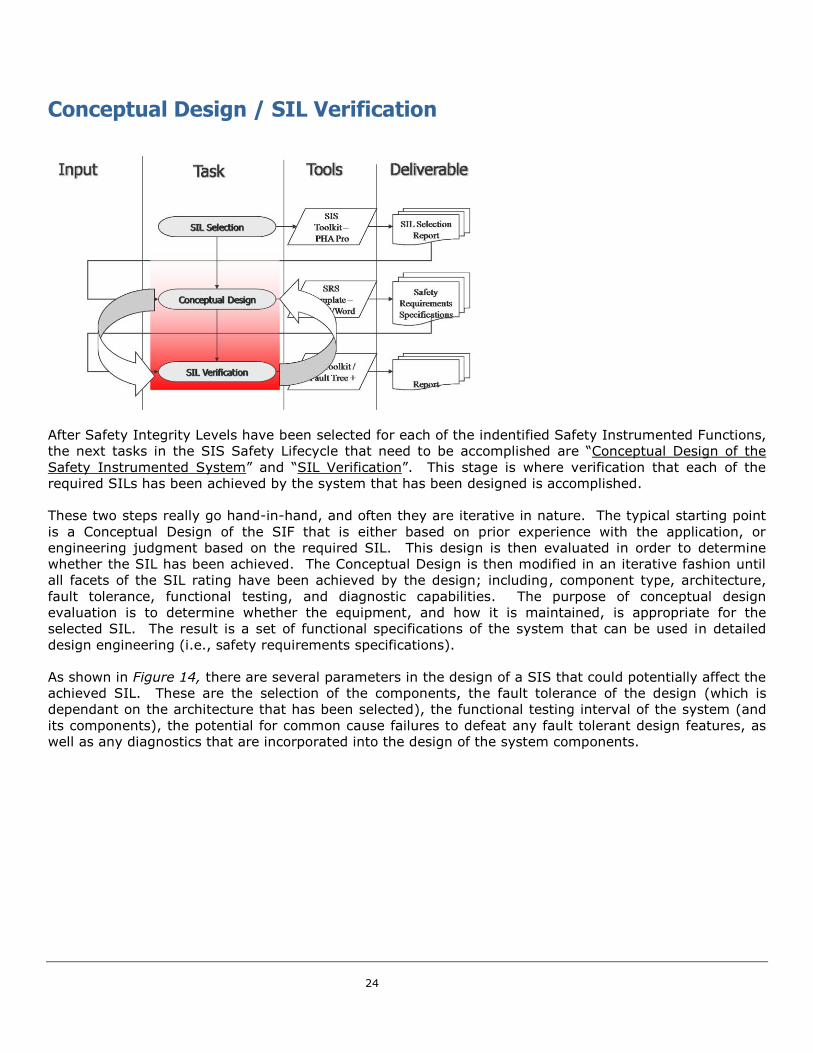
Conceptual Design / SIL Verification
After Safety Integrity Levels have been selected for each of the indentified Safety Instrumented Functions,
the next tasks in the SIS Safety Lifecycle that need to be accomplished are “Conceptual Design of the
Safety Instrumented System” and “SIL Verification”. This stage is where verification that each of the
required SILs has been achieved by the system that has been designed is accomplished.
These two steps really go hand-in-hand, and often they are iterative in nature. The typical starting point
is a Conceptual Design of the SIF that is either based on prior experience with the application, or
engineering judgment based on the required SIL. This design is then evaluated in order to determine
whether the SIL has been achieved. The Conceptual Design is then modified in an iterative fashion until
all facets of the SIL rating have been achieved by the design; including, component type, architecture,
fault tolerance, functional testing, and diagnostic capabilities. The purpose of conceptual design
evaluation is to determine whether the equipment, and how it is maintained, is appropriate for the
selected SIL. The result is a set of functional specifications of the system that can be used in detailed
design engineering (i.e., safety requirements specifications).
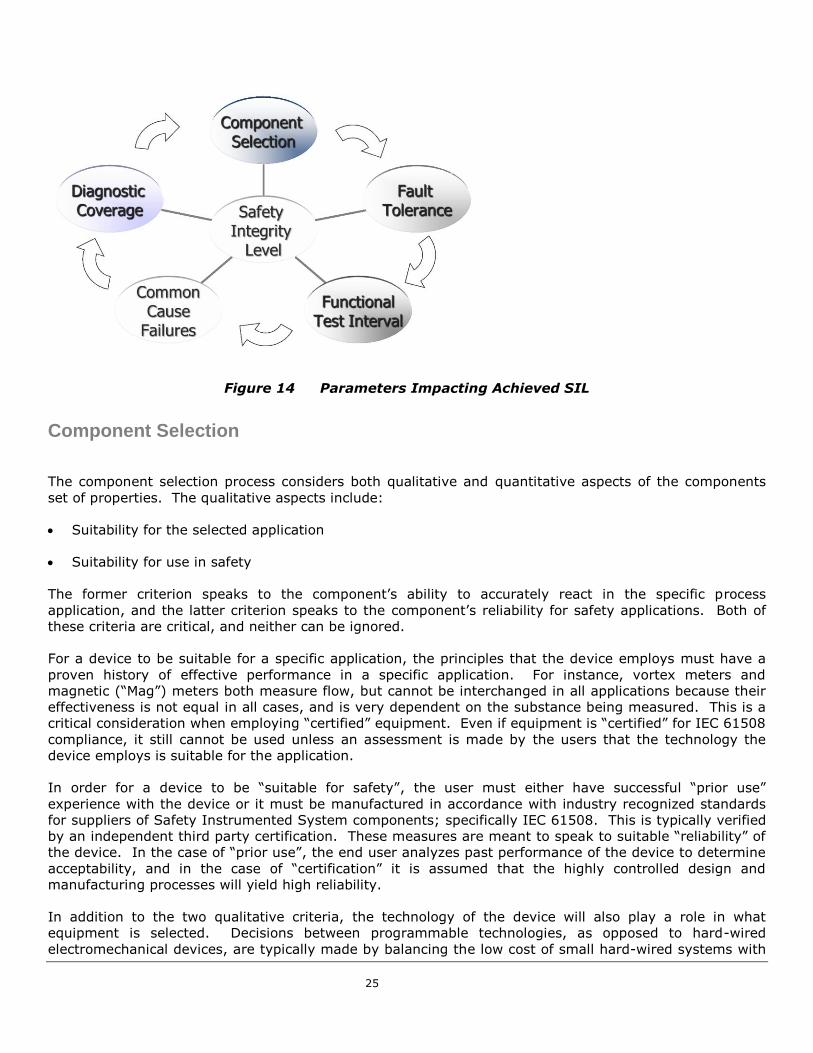
As shown in Figure 14, there are several parameters in the design of a SIS that could potentially affect the
achieved SIL. These are the selection of the components, the fault tolerance of the design (which is
dependant on the architecture that has been selected), the functional testing interval of the system (and
its components), the potential for common cause failures to defeat any fault tolerant design features, as
well as any diagnostics that are incorporated into the design of the system components.
25
Figure 14 Parameters Impacting Achieved SIL
Component Selection
The component selection process considers both qualitative and quantitative aspects of the components
set of properties. The qualitative aspects include:
• Suitability for the selected application
• Suitability for use in safety
The former criterion speaks to the component’s ability to accurately react in the specific process
application, and the latter criterion speaks to the component’s reliability for safety applications. Both of
these criteria are critical, and neither can be ignored.
For a device to be suitable for a specific application, the principles that the device employs must have a
proven history of effective performance in a specific application. For instance, vortex meters and
magnetic (“Mag”) meters both measure flow, but cannot be interchanged in all applications because their
effectiveness is not equal in all cases, and is very dependent on the substance being measured. This is a
critical consideration when employing “certified” equipment. Even if equipment is “certified” for IEC 61508
compliance, it still cannot be used unless an assessment is made by the users that the technology the
device employs is suitable for the application.
In order for a device to be “suitable for safety”, the user must either have successful “prior use”
experience with the device or it must be manufactured in accordance with industry recognized standards
for suppliers of Safety Instrumented System components; specifically IEC 61508. This is typically verified
by an independent third party certification. These measures are meant to speak to suitable “reliability” of
the device. In the case of “prior use”, the end user analyzes past performance of the device to determine
acceptability, and in the case of “certification” it is assumed that the highly controlled design and
manufacturing processes will yield high reliability.
In addition to the two qualitative criteria, the technology of the device will also play a role in what
equipment is selected. Decisions between programmable technologies, as opposed to hard-wired
electromechanical devices, are typically made by balancing the low cost of small hard-wired systems with
26
the decreased cost and engineering effort associated with large programmable systems. In addition, the
technology will also affect other quantitative parameters that will be discussed later in this section such as
failure rate, safe failure fraction, and diagnostic coverage.
Fault Tolerance
Fault tolerance is the ability of the SIS to be able to perform its intended actions (and not perform
unintended actions) in the presence of failure of one or more of the SIS components. Fault tolerance is
typically achieved through the use of multiple redundant components that are arranged to “vote” upon
action of the SIF. This arrangement of multiple redundant components is referred to as the “architecture”
of a SIF subsystem. Some voting architectures would potentially result in loss of safety upon failure of a
component, while others could potentially increase the level of safety if one or more of components in the
architecture failed.
The most common architectures employed as SIS subsystems are listed below. In general, these figures
are described in M-out-of-N systems, where M is the number of components that must function in order to
take the safety action and N is the total number of components.
1oo1 One-out-of-One (simplex)
1oo2 One-out-of-Two
2oo2 Two-out-of-Two
2oo3 Two-out-of-Three
The 1oo1 architecture is a single, individual component, and serves as the baseline in comparing the
various available SIS architectures. The 1oo2 arrangement is the “safest” of the options, meaning it
provides the lowest probability of failure on demand. In this arrangement, if either of two transmitters
“votes” to shutdown, the shutdown action is taken. The 1oo2 arrangement provides one degree of fault
tolerance with respect to “dangerous” failures, but none with respect to spurious failures. In fact, the
1oo2 arrangement will result in a spurious failure twice as often as the rate resulting from a single device.
The 2oo2 arrangement provides one degree of fault tolerance to spurious failures, but none to safety. As
a result, its PFDavg is twice that of a single component (i.e., more dangerous), but has a nuisance trip
rate that is an order of magnitude lower. Finally, 2oo3 offers a compromise between 1oo2 and 2oo2. This
arrangement has both lower PFDavg and lower spurious trip rate than a single device, but is neither as
safe as 1oo2 nor as spurious trip resistant as 2oo2.
In addition to the quantitative impacts of architecture, SIL levels require the achievement of “Architectural
Constraints” which are essentially restrictions on the minimum fault tolerance that must be supplied for
any given subsystem. Generally, Safety Integrity Level 1 requires no fault tolerance unless it is necessary
to achieve the desired probability in PFDavg target. Safety Integrity Level 2 requires at least one degree
of fault tolerance, which could be achieved by, for example, a 1oo2 voting architecture. A detailed
discussion of achieving minimum fault tolerance, along with the minimum fault tolerance tables out of IEC
61511 and IEC 61508 is included in Appendix F.
27
Functional Test Interval
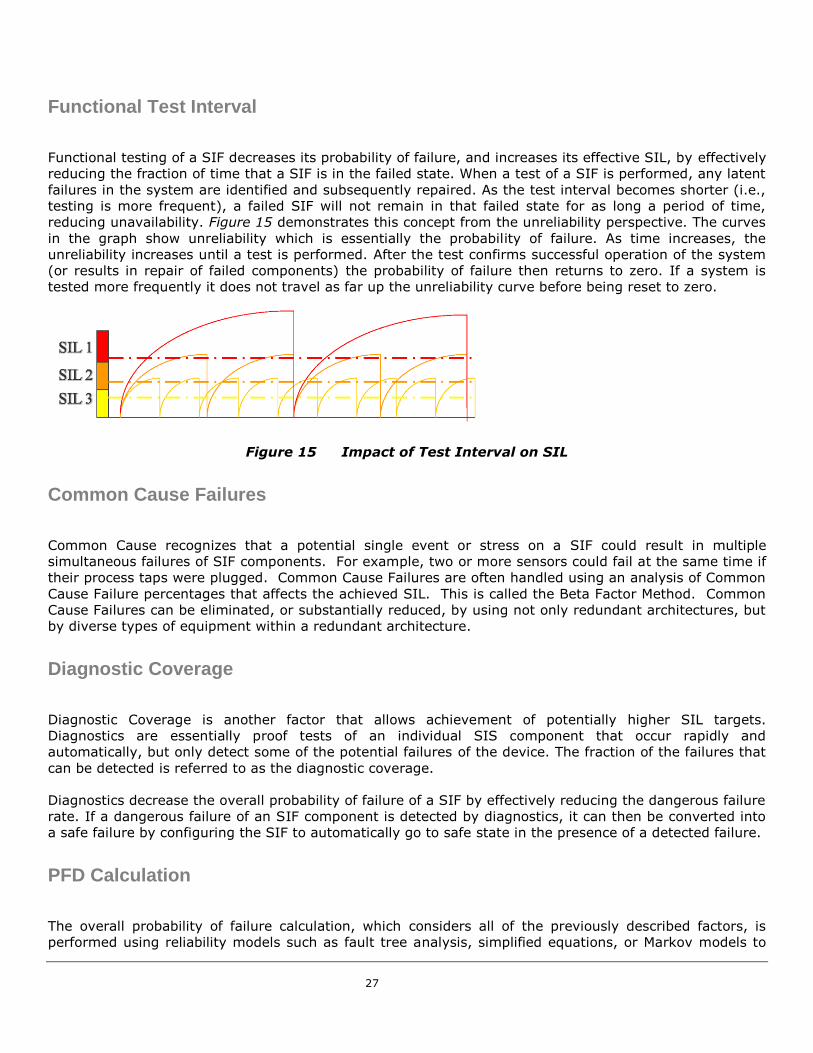
Functional testing of a SIF decreases its probability of failure, and increases its effective SIL, by effectively
reducing the fraction of time that a SIF is in the failed state. When a test of a SIF is performed, any latent
failures in the system are identified and subsequently repaired. As the test interval becomes shorter (i.e.,
testing is more frequent), a failed SIF will not remain in that failed state for as long a period of time,
reducing unavailability. Figure 15 demonstrates this concept from the unreliability perspective. The curves
in the graph show unreliability which is essentially the probability of failure. As time increases, the
unreliability increases until a test is performed. After the test confirms successful operation of the system
(or results in repair of failed components) the probability of failure then returns to zero. If a system is
tested more frequently it does not travel as far up the unreliability curve before being reset to zero.
Figure 15 Impact of Test Interval on SIL
Common Cause Failures
Common Cause recognizes that a potential single event or stress on a SIF could result in multiple
simultaneous failures of SIF components. For example, two or more sensors could fail at the same time if
their process taps were plugged. Common Cause Failures are often handled using an analysis of Common
Cause Failure percentages that affects the achieved SIL. This is called the Beta Factor Method. Common
Cause Failures can be eliminated, or substantially reduced, by using not only redundant architectures, but
by diverse types of equipment within a redundant architecture.
Diagnostic Coverage
Diagnostic Coverage is another factor that allows achievement of potentially higher SIL targets.
Diagnostics are essentially proof tests of an individual SIS component that occur rapidly and
automatically, but only detect some of the potential failures of the device. The fraction of the failures that
can be detected is referred to as the diagnostic coverage.
Diagnostics decrease the overall probability of failure of a SIF by effectively reducing the dangerous failure
rate. If a dangerous failure of an SIF component is detected by diagnostics, it can then be converted into
a safe failure by configuring the SIF to automatically go to safe state in the presence of a detected failure.
PFD Calculation
The overall probability of failure calculation, which considers all of the previously described factors, is
performed using reliability models such as fault tree analysis, simplified equations, or Markov models to

28
evaluate each SIF. Industry standards require quantitative verification that the selected SIL targets were
achieved for the selected design. While each of the potential methods for performing SIL verification
calculations have their strengths and weaknesses, the simplified equation options is primarily used by
industry practitioners where possible. In cases where the situation that is being modeled cannot be
described using the standard set of simplified equations, more robust – but difficult to employ – tools,
such as fault tree analysis are used to support the simplified equations.
Calculation of the overall PFDavg of a SIF begins with use of one of the equations shown below for each
subsystem – sensor, logic solver, and final element. The equations used considering the specific failure
rates of the analyzed device and the proposed test interval of the subsystem. Some typical failure rates
for common instrumentation that is used in safety applications is given in Appendix G. The following
section contains simplified equations for most common SIS subsystem architectures. More details
regarding the equations can be found in Appendix E.
Simplified Equations
Equations for Probability of Failure on Demand
1oo1
2
TIPFDavg
DU
1oo1D-NT
xMTTRDDSDDU
2
TIPFD avg
1oo2
23PFD
22
avg
TITI DUDU
2oo2 TIDU avgPFD
2oo3
2)()(PFD 22
avg
TITI DUDU
Equations for Spurious Trip Rate (STR)
1oo1 DDSSTR
1oo1D-NT SUSTR
1oo2 )(2 DDSSTR
2oo2 DDSDDS MTTRSTR 2)(2
2oo3 DDSDDS MTTRSTR 2)(6

29
Safety Requirements Specifications
The “Safety Requirements Specifications” task is the next step in the Safety Lifecycle. The Safety
Requirements Specifications (SRS) development occurs at the end of the Conceptual Design/SIL
Verification phase – after the proposed design has been confirmed to achieve its target. The objective of
the SRS is to define both functional and performance related requirements for the SRS. The SRS is
prepared in enough detail that the functionality of the entire SIS (particularly the logic solver) is defined in
sufficient rigor that detailed design engineering tasks can proceed (typically by a different group than
prepare the SRS package).
The IEC 61511 / ISA 84.00.01-2004 standard provides a listing of the information that should be
documented, or at least considered during this phase. This information includes the following items:
• A description of all the safety instrumented functions necessary to achieve the required functional
safety
• Requirements to identify and take account of common cause failures
• A definition of the safe state of the process for each identified safety instrumented function
• A definition of any individually safe process states which, when occurring concurrently, create a
separate hazard (for example, overload of emergency storage, multiple relief to flare system)
• The assumed sources of demand and demand rate on the safety instrumented function
• Requirement for proof-test intervals
• Response time requirements for the SIS to bring the process to a safe state
• The safety integrity level and mode of operation (demand/continuous) for each safety instrumented
function
• A description of SIS process measurements and their trip points
• A description of SIS process output actions and the criteria for successful operation, for example,
requirements for tight shut-off valves
• The functional relationship between process inputs and outputs, including logic, mathematical
functions and any required permissives
• Requirements for manual shutdown
• Requirements relating to energize or de-energize to trip
• Requirements for resetting the SIS after a shutdown
• Maximum allowable spurious trip rate
• Failure modes and desired response of the SIS (for example, alarms, automatic shutdown)
• Any specific requirements related to the procedures for starting up and restarting the SIS
30
• All interfaces between the SIS and any other system (including the BPCS and operators)
• A description of the modes of operation of the plant and identification of the safety instrumented
functions required to operate within each mode
• The application software safety requirements
• Requirements for overrides/inhibits/bypasses including how they will be cleared
• The specification of any action necessary to achieve or maintain a safe state in the event of fault(s)
being detected in the SIS. Any such action shall be determined taking account of all relevant human
factors
• The mean time to repair which is feasible for the SIS, taking into account the travel time, location,
spares holding, service contracts, environmental constraints
• Identification of the dangerous combinations of output states of the SIS that need to be avoided
• The extremes of all environmental conditions that are likely to be encountered by the SIS shall be
identified. This may require consideration of the following: temperature, humidity, contaminants,
grounding, electromagnetic interference/radiofrequency interference (EMI/RFI), shock/vibration,
electrostatic discharge, electrical area classification, flooding, lightning, and other related factors
• Identification of normal and abnormal modes for both the plant as a whole (for example, plant start-
up) and individual plant operational procedures (for example, equipment maintenance, sensor
calibration and/or repair). Additional safety instrumented functions may be required to support these
modes of operation
• Definition of the requirements for any safety instrumented function necessary to survive a major
accident event, for example, time required for a valve to remain operational in the event of a fire
While all of the information described above must be developed to fully define a SIS, it is not good
practice to attempt to combine all of the information into a single document. Often, engineers who are
new to SIS, have not had significant experience in specification of instrumentation and control system,
and use a reading of the standards as their only basis for how to specify control systems erroneously
attempt to use IEC 61511 / ISA 84.00.01 as a design guideline instead of the collection of requirements
that it is. This often results in an SRS document that uses the list of bullet items shown above as an
“outline” and then proceeds to “fill in the blank” for each SIF. This process usually yields poor results.
The documents are difficult for systems integrators and equipment vendors to use, as they do not present
a comprehensive view of the system, and also include large amounts of repetitive data that is not useful
to system designers, and often does not get updated when subsequent changes occur.
A much better approach is to provide a more comprehensive package that describes an entire SIS. This
type of package typically contains a functional logic description, often in the concise and easy-to-use
cause and effect diagram format. A collection of requirements that are uniformly applied to all SIF – such
as bypass requirements and failure response actions are best contained in a single “general requirements”
document. Finally, complexities of the system that are unique to a single SIF and too complicated to be
explained in the context of the functional logic description (e.g., cause and effect diagram) can be
described in a specific notes document.
Using this methodology, a holistic system view is provided, repetition of information is minimized, and
information that is not relevant to the users of the SRS package (such as SIL selection details) are not
31
included. Instead, the general requirements section simply refers to the other project documents in which
this additional information is contained.
Once the SRS package has been prepared, it can be provided to detailed design contractors and
equipment vendors. These groups can then implement a system that is consistent with the Safety
Integrity Levels that were selected in previous Safety Lifecycle steps. A good SRS package will allow
contractors and vendors to provide equipment bids and perform their detailed design tasks with minimal
additional input from the SIS design basis team.
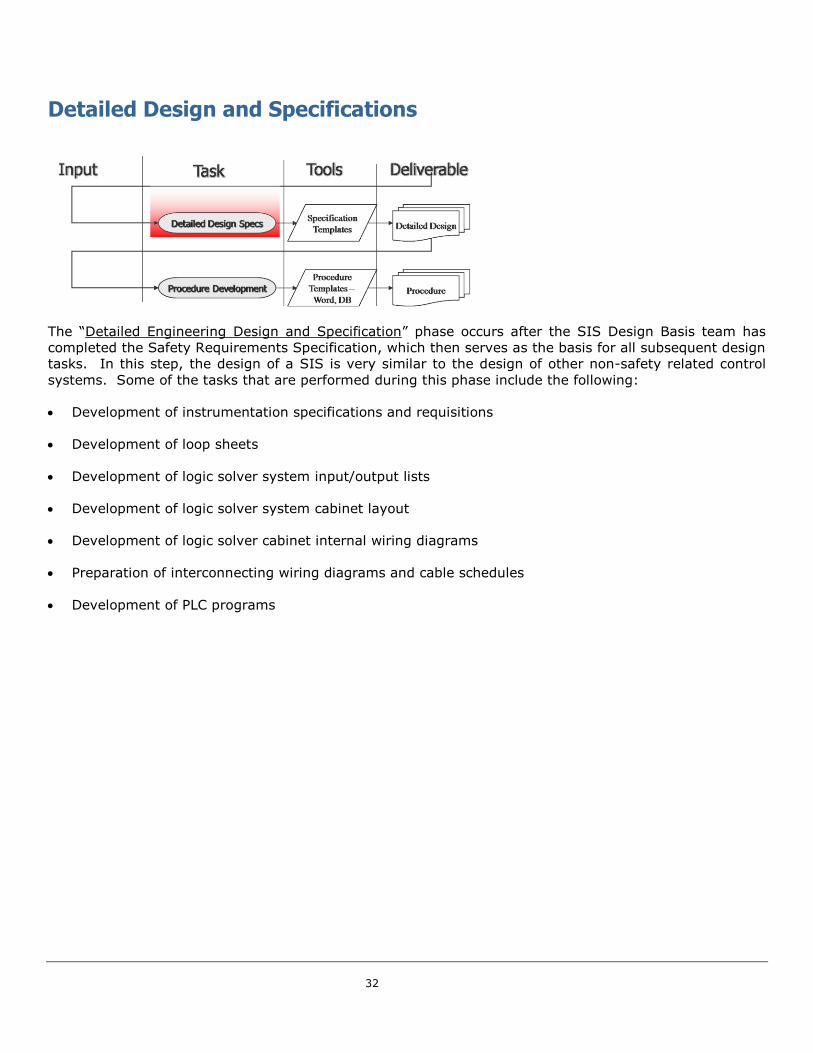
32
Detailed Design and Specifications
The “Detailed Engineering Design and Specification” phase occurs after the SIS Design Basis team has
completed the Safety Requirements Specification, which then serves as the basis for all subsequent design
tasks. In this step, the design of a SIS is very similar to the design of other non-safety related control
systems. Some of the tasks that are performed during this phase include the following:
• Development of instrumentation specifications and requisitions
• Development of loop sheets
• Development of logic solver system input/output lists
• Development of logic solver system cabinet layout
• Development of logic solver cabinet internal wiring diagrams
• Preparation of interconnecting wiring diagrams and cable schedules
• Development of PLC programs
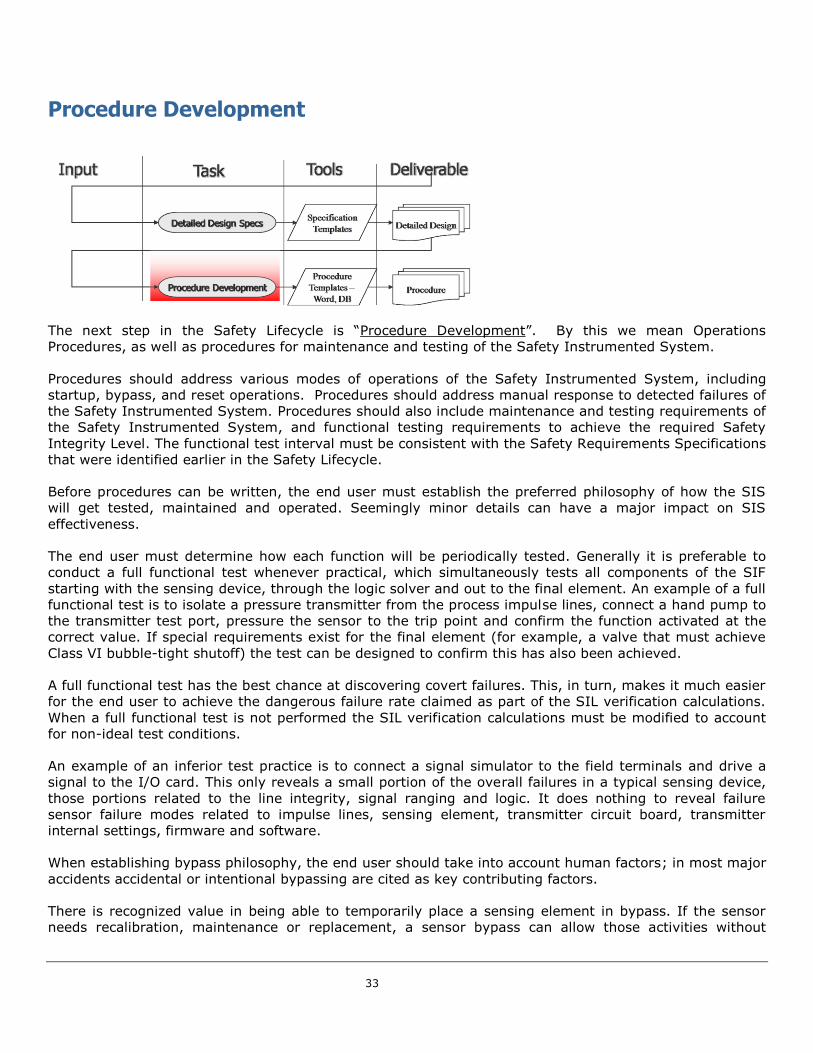
33
Procedure Development
The next step in the Safety Lifecycle is “Procedure Development”. By this we mean Operations
Procedures, as well as procedures for maintenance and testing of the Safety Instrumented System.
Procedures should address various modes of operations of the Safety Instrumented System, including
startup, bypass, and reset operations. Procedures should address manual response to detected failures of
the Safety Instrumented System. Procedures should also include maintenance and testing requirements of
the Safety Instrumented System, and functional testing requirements to achieve the required Safety
Integrity Level. The functional test interval must be consistent with the Safety Requirements Specifications
that were identified earlier in the Safety Lifecycle.
Before procedures can be written, the end user must establish the preferred philosophy of how the SIS
will get tested, maintained and operated. Seemingly minor details can have a major impact on SIS
effectiveness.
The end user must determine how each function will be periodically tested. Generally it is preferable to
conduct a full functional test whenever practical, which simultaneously tests all components of the SIF
starting with the sensing device, through the logic solver and out to the final element. An example of a full
functional test is to isolate a pressure transmitter from the process impulse lines, connect a hand pump to
the transmitter test port, pressure the sensor to the trip point and confirm the function activated at the
correct value. If special requirements exist for the final element (for example, a valve that must achieve
Class VI bubble-tight shutoff) the test can be designed to confirm this has also been achieved.
A full functional test has the best chance at discovering covert failures. This, in turn, makes it much easier
for the end user to achieve the dangerous failure rate claimed as part of the SIL verification calculations.
When a full functional test is not performed the SIL verification calculations must be modified to account
for non-ideal test conditions.
An example of an inferior test practice is to connect a signal simulator to the field terminals and drive a
signal to the I/O card. This only reveals a small portion of the overall failures in a typical sensing device,
those portions related to the line integrity, signal ranging and logic. It does nothing to reveal failure
sensor failure modes related to impulse lines, sensing element, transmitter circuit board, transmitter
internal settings, firmware and software.
When establishing bypass philosophy, the end user should take into account human factors; in most major
accidents accidental or intentional bypassing are cited as key contributing factors.
There is recognized value in being able to temporarily place a sensing element in bypass. If the sensor
needs recalibration, maintenance or replacement, a sensor bypass can allow those activities without
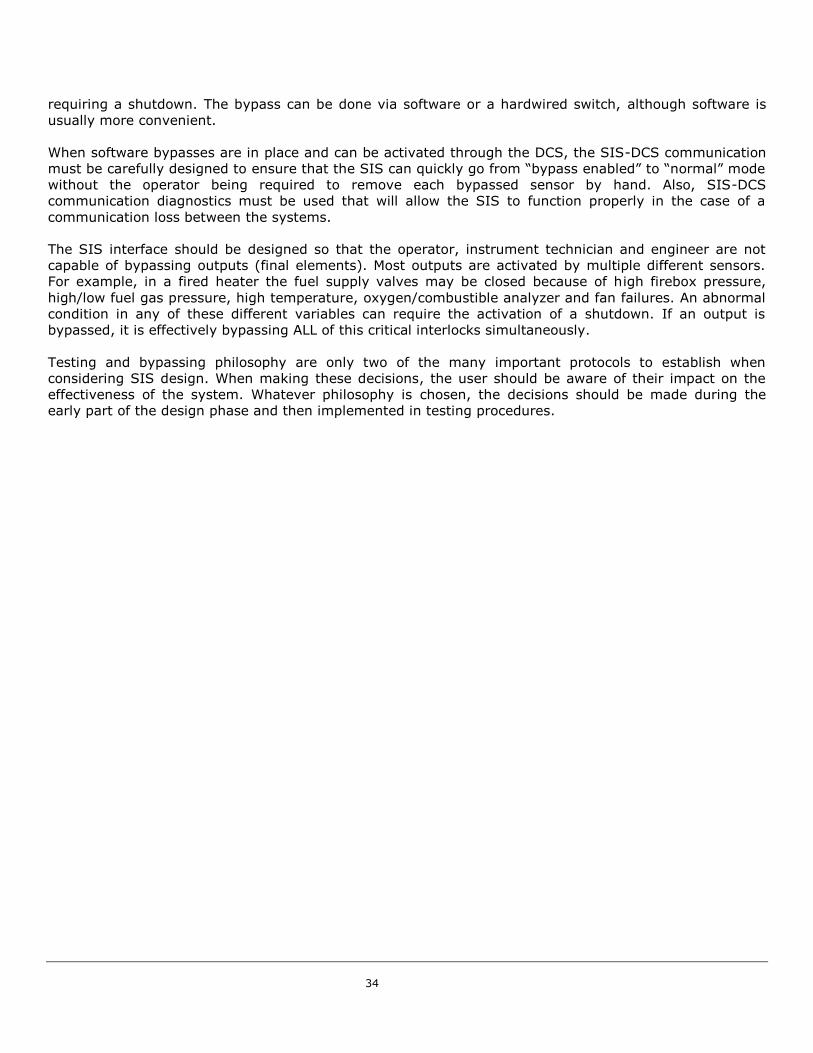
34
requiring a shutdown. The bypass can be done via software or a hardwired switch, although software is
usually more convenient.
When software bypasses are in place and can be activated through the DCS, the SIS-DCS communication
must be carefully designed to ensure that the SIS can quickly go from “bypass enabled” to “normal” mode
without the operator being required to remove each bypassed sensor by hand. Also, SIS-DCS
communication diagnostics must be used that will allow the SIS to function properly in the case of a
communication loss between the systems.
The SIS interface should be designed so that the operator, instrument technician and engineer are not
capable of bypassing outputs (final elements). Most outputs are activated by multiple different sensors.
For example, in a fired heater the fuel supply valves may be closed because of high firebox pressure,
high/low fuel gas pressure, high temperature, oxygen/combustible analyzer and fan failures. An abnormal
condition in any of these different variables can require the activation of a shutdown. If an output is
bypassed, it is effectively bypassing ALL of this critical interlocks simultaneously.
Testing and bypassing philosophy are only two of the many important protocols to establish when
considering SIS design. When making these decisions, the user should be aware of their impact on the
effectiveness of the system. Whatever philosophy is chosen, the decisions should be made during the
early part of the design phase and then implemented in testing procedures.
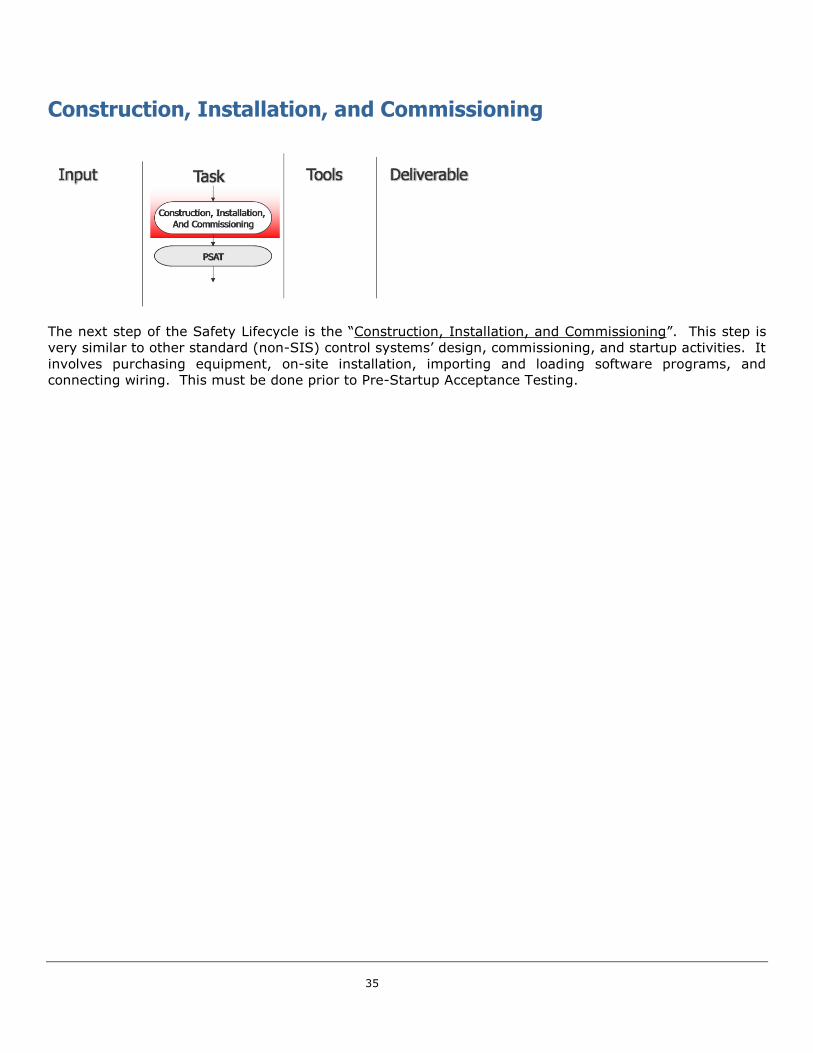
35
Construction, Installation, and Commissioning
The next step of the Safety Lifecycle is the “Construction, Installation, and Commissioning”. This step is
very similar to other standard (non-SIS) control systems’ design, commissioning, and startup activities. It
involves purchasing equipment, on-site installation, importing and loading software programs, and
connecting wiring. This must be done prior to Pre-Startup Acceptance Testing.
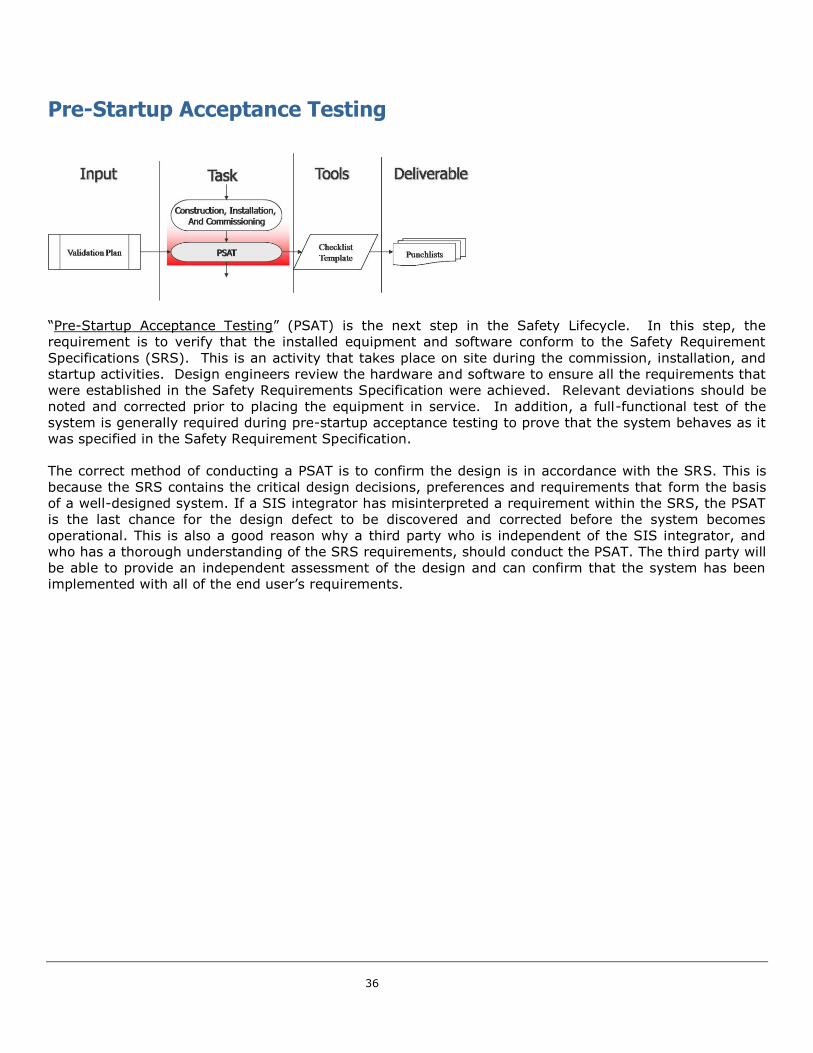
36
Pre-Startup Acceptance Testing
“Pre-Startup Acceptance Testing” (PSAT) is the next step in the Safety Lifecycle. In this step, the
requirement is to verify that the installed equipment and software conform to the Safety Requirement
Specifications (SRS). This is an activity that takes place on site during the commission, installation, and
startup activities. Design engineers review the hardware and software to ensure all the requirements that
were established in the Safety Requirements Specification were achieved. Relevant deviations should be
noted and corrected prior to placing the equipment in service. In addition, a full-functional test of the
system is generally required during pre-startup acceptance testing to prove that the system behaves as it
was specified in the Safety Requirement Specification.
The correct method of conducting a PSAT is to confirm the design is in accordance with the SRS. This is
because the SRS contains the critical design decisions, preferences and requirements that form the basis
of a well-designed system. If a SIS integrator has misinterpreted a requirement within the SRS, the PSAT
is the last chance for the design defect to be discovered and corrected before the system becomes
operational. This is also a good reason why a third party who is independent of the SIS integrator, and
who has a thorough understanding of the SRS requirements, should conduct the PSAT. The third party will
be able to provide an independent assessment of the design and can confirm that the system has been
implemented with all of the end user’s requirements.
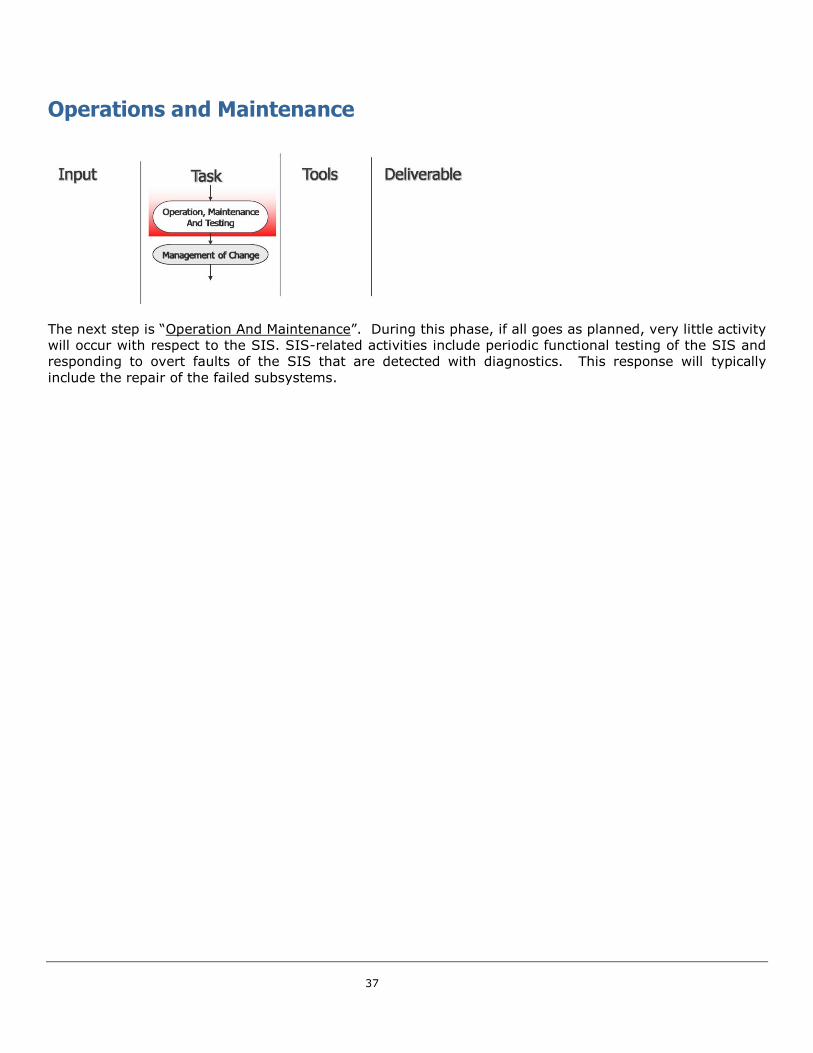
37
Operations and Maintenance
The next step is “Operation And Maintenance”. During this phase, if all goes as planned, very little activity
will occur with respect to the SIS. SIS-related activities include periodic functional testing of the SIS and
responding to overt faults of the SIS that are detected with diagnostics. This response will typically
include the repair of the failed subsystems.
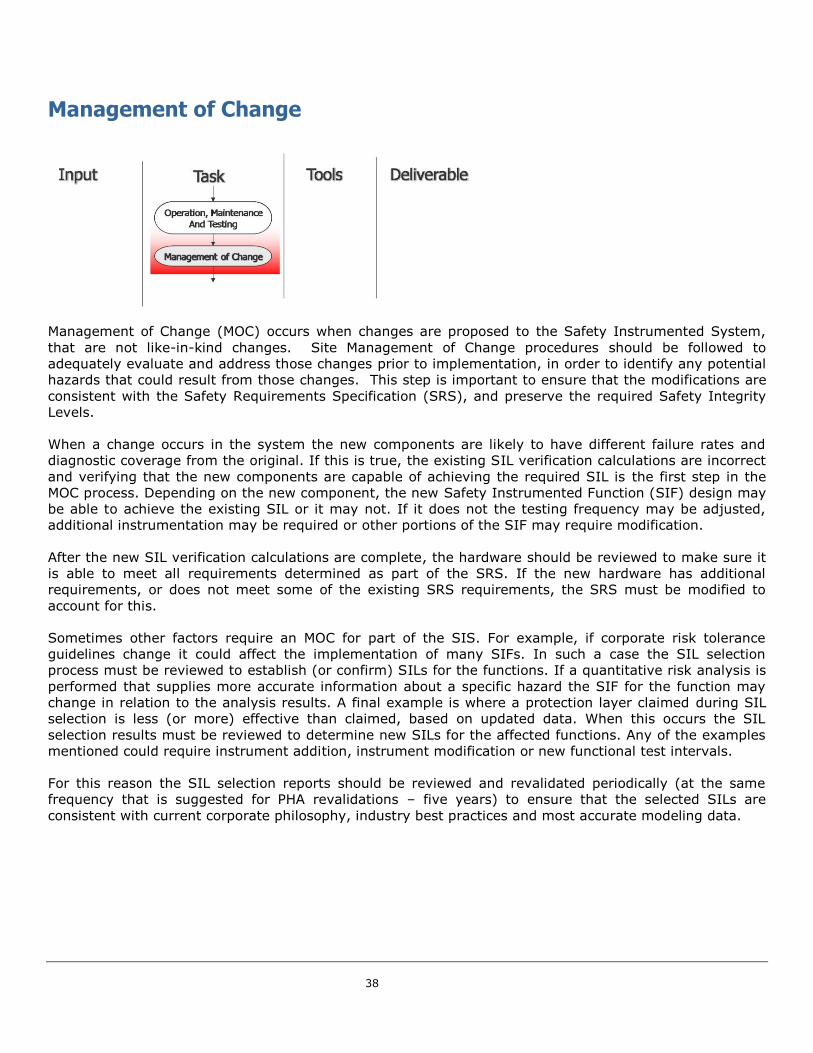
38
Management of Change
Management of Change (MOC) occurs when changes are proposed to the Safety Instrumented System,
that are not like-in-kind changes. Site Management of Change procedures should be followed to
adequately evaluate and address those changes prior to implementation, in order to identify any potential
hazards that could result from those changes. This step is important to ensure that the modifications are
consistent with the Safety Requirements Specification (SRS), and preserve the required Safety Integrity
Levels.
When a change occurs in the system the new components are likely to have different failure rates and
diagnostic coverage from the original. If this is true, the existing SIL verification calculations are incorrect
and verifying that the new components are capable of achieving the required SIL is the first step in the
MOC process. Depending on the new component, the new Safety Instrumented Function (SIF) design may
be able to achieve the existing SIL or it may not. If it does not the testing frequency may be adjusted,
additional instrumentation may be required or other portions of the SIF may require modification.
After the new SIL verification calculations are complete, the hardware should be reviewed to make sure it
is able to meet all requirements determined as part of the SRS. If the new hardware has additional
requirements, or does not meet some of the existing SRS requirements, the SRS must be modified to
account for this.
Sometimes other factors require an MOC for part of the SIS. For example, if corporate risk tolerance
guidelines change it could affect the implementation of many SIFs. In such a case the SIL selection
process must be reviewed to establish (or confirm) SILs for the functions. If a quantitative risk analysis is
performed that supplies more accurate information about a specific hazard the SIF for the function may
change in relation to the analysis results. A final example is where a protection layer claimed during SIL
selection is less (or more) effective than claimed, based on updated data. When this occurs the SIL
selection results must be reviewed to determine new SILs for the affected functions. Any of the examples
mentioned could require instrument addition, instrument modification or new functional test intervals.
For this reason the SIL selection reports should be reviewed and revalidated periodically (at the same
frequency that is suggested for PHA revalidations – five years) to ensure that the selected SILs are
consistent with current corporate philosophy, industry best practices and most accurate modeling data.
39
Conclusions
Safety Instrumented Systems are used in process plants to reduce risk – not to eliminate risk – but to
reduce it to what is deemed to be a tolerable level by the operator of that plant. In the United States,
regulations from OSHA, as well as EPA, govern the design, testing, maintenance, and operation of Safety
Instrumented Systems. You should know the requirements of these regulations before you begin a Safety
Instrumented System design project. Most companies have some type of program for design and
implementation of Safety Instrumented Systems. Increasingly, companies are conforming to the SIS
engineering standards from ISA and IEC. The new standards are performance-based, rather than
prescriptive. They require you to set performance levels, or goals, to be achieved by SIS engineering
design, rather than prescribing what that design should look like.
This handbook has presented a summary of the SIS Engineering Design Lifecycle. Before your facility
implements this lifecycle, it should be carefully considered and understood. Safety Instrumented
Functions in existing or new process designs require analysis to identify the functions, and address Safety
Integrity Level requirements for each function. Safety Integrity Levels can be optimized to account for
likely initiating events and reasonable safeguards, thereby identifying a design that meets safety
objectives without unnecessary equipment and instrumentation.
Replacement of existing hardware is not required by the standards, and in many cases, is not warranted.
An analysis of Safety Integrity Level requirements is necessary, and in some cases – in fact, many cases –
existing equipment can be demonstrated to achieve the Safety Integrity Level targets that are required by
your company.
Although in many cases existing equipment is sufficient to achieve Safety Integrity Levels, for some
functions equipment modification or addition may be necessary. This additional cost is always minimized
by implementing these changes at the start of the design phase. Many “horror stories” describing the
difficulty of implementing IEC 61511 / ISA 84.00.01 are because it was implemented in the middle of an
extensive project, or after the field design was finalized. Just like with proper process design, proper
Safety Instrumented System design should be done at the start of the project, not as an afterthought.
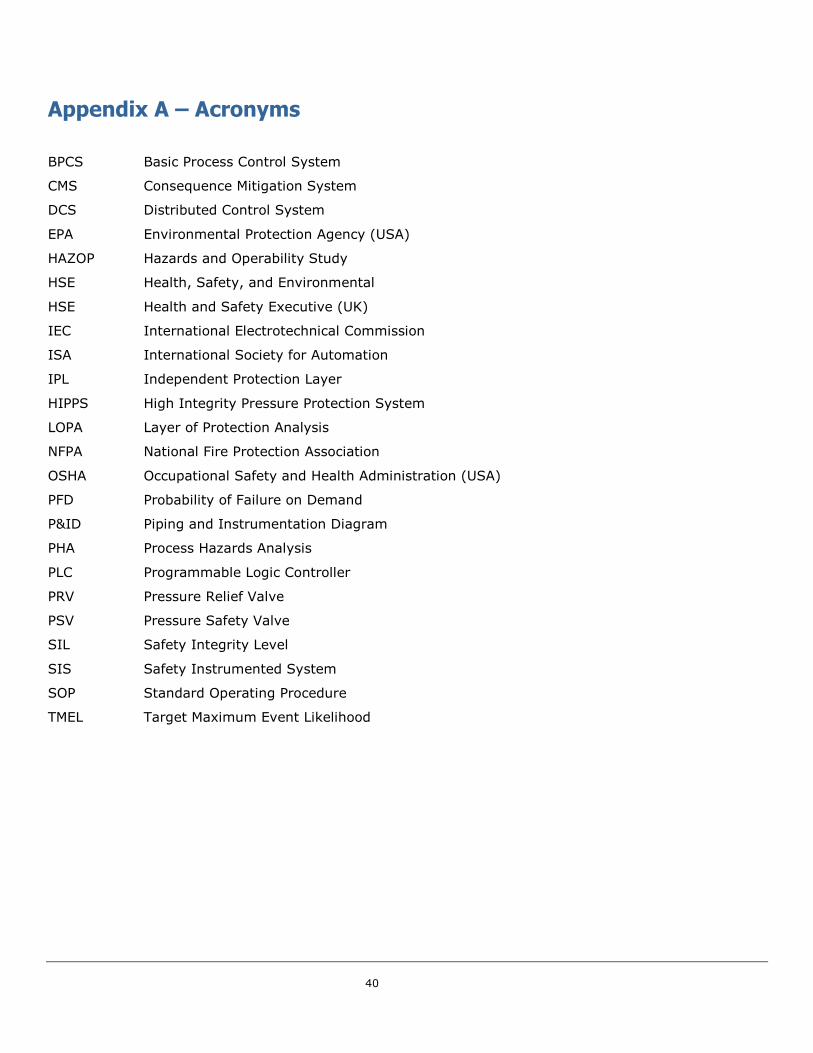
40
Appendix A – Acronyms
BPCS Basic Process Control System
CMS Consequence Mitigation System
DCS Distributed Control System
EPA Environmental Protection Agency (USA)
HAZOP Hazards and Operability Study
HSE Health, Safety, and Environmental
HSE Health and Safety Executive (UK)
IEC International Electrotechnical Commission
ISA International Society for Automation
IPL Independent Protection Layer
HIPPS High Integrity Pressure Protection System
LOPA Layer of Protection Analysis
NFPA National Fire Protection Association
OSHA Occupational Safety and Health Administration (USA)
PFD Probability of Failure on Demand
P&ID Piping and Instrumentation Diagram
PHA Process Hazards Analysis
PLC Programmable Logic Controller
PRV Pressure Relief Valve
PSV Pressure Safety Valve
SIL Safety Integrity Level
SIS Safety Instrumented System
SOP Standard Operating Procedure
TMEL Target Maximum Event Likelihood
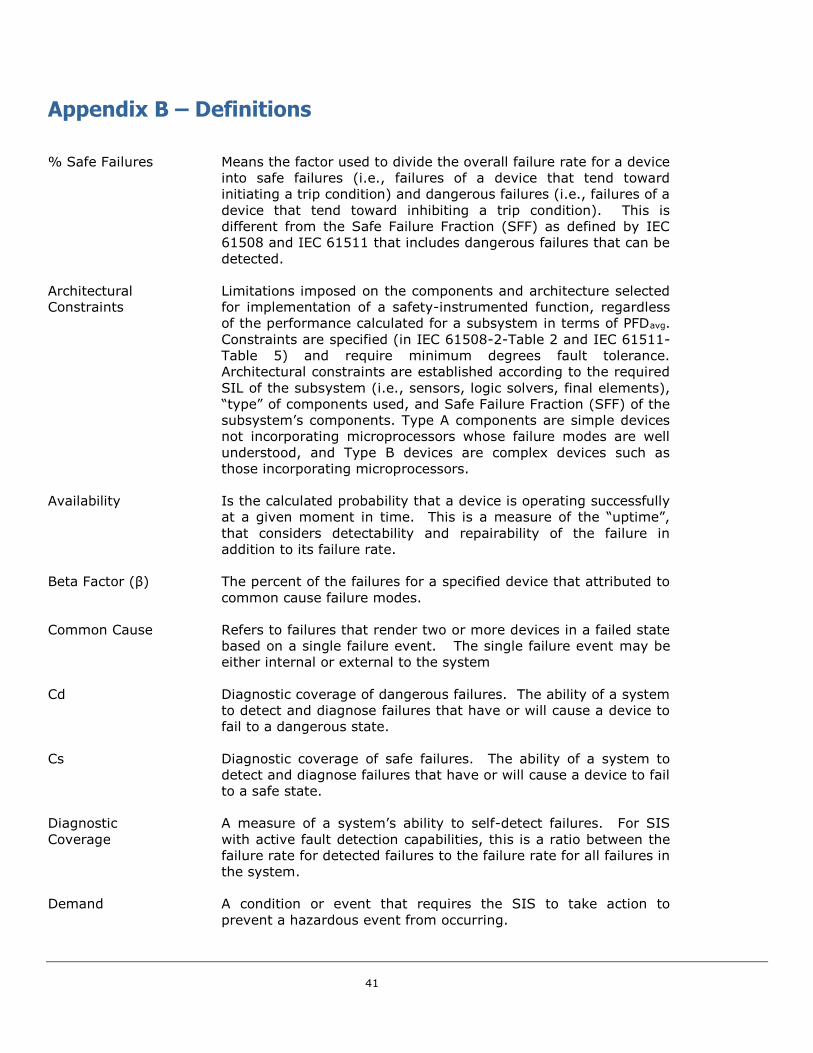
41
Appendix B – Definitions
% Safe Failures Means the factor used to divide the overall failure rate for a device
into safe failures (i.e., failures of a device that tend toward
initiating a trip condition) and dangerous failures (i.e., failures of a
device that tend toward inhibiting a trip condition). This is
different from the Safe Failure Fraction (SFF) as defined by IEC
61508 and IEC 61511 that includes dangerous failures that can be
detected.
Architectural
Constraints
Limitations imposed on the components and architecture selected
for implementation of a safety-instrumented function, regardless
of the performance calculated for a subsystem in terms of PFDavg.
Constraints are specified (in IEC 61508-2-Table 2 and IEC 61511-
Table 5) and require minimum degrees fault tolerance.
Architectural constraints are established according to the required
SIL of the subsystem (i.e., sensors, logic solvers, final elements),
“type” of components used, and Safe Failure Fraction (SFF) of the
subsystem’s components. Type A components are simple devices
not incorporating microprocessors whose failure modes are well
understood, and Type B devices are complex devices such as
those incorporating microprocessors.
Availability Is the calculated probability that a device is operating successfully
at a given moment in time. This is a measure of the “uptime”,
that considers detectability and repairability of the failure in
addition to its failure rate.
Beta Factor (β) The percent of the failures for a specified device that attributed to
common cause failure modes.
Common Cause Refers to failures that render two or more devices in a failed state
based on a single failure event. The single failure event may be
either internal or external to the system
Cd Diagnostic coverage of dangerous failures. The ability of a system
to detect and diagnose failures that have or will cause a device to
fail to a dangerous state.
Cs Diagnostic coverage of safe failures. The ability of a system to
detect and diagnose failures that have or will cause a device to fail
to a safe state.
Diagnostic
Coverage
A measure of a system’s ability to self-detect failures. For SIS
with active fault detection capabilities, this is a ratio between the
failure rate for detected failures to the failure rate for all failures in
the system.
Demand A condition or event that requires the SIS to take action to
prevent a hazardous event from occurring.
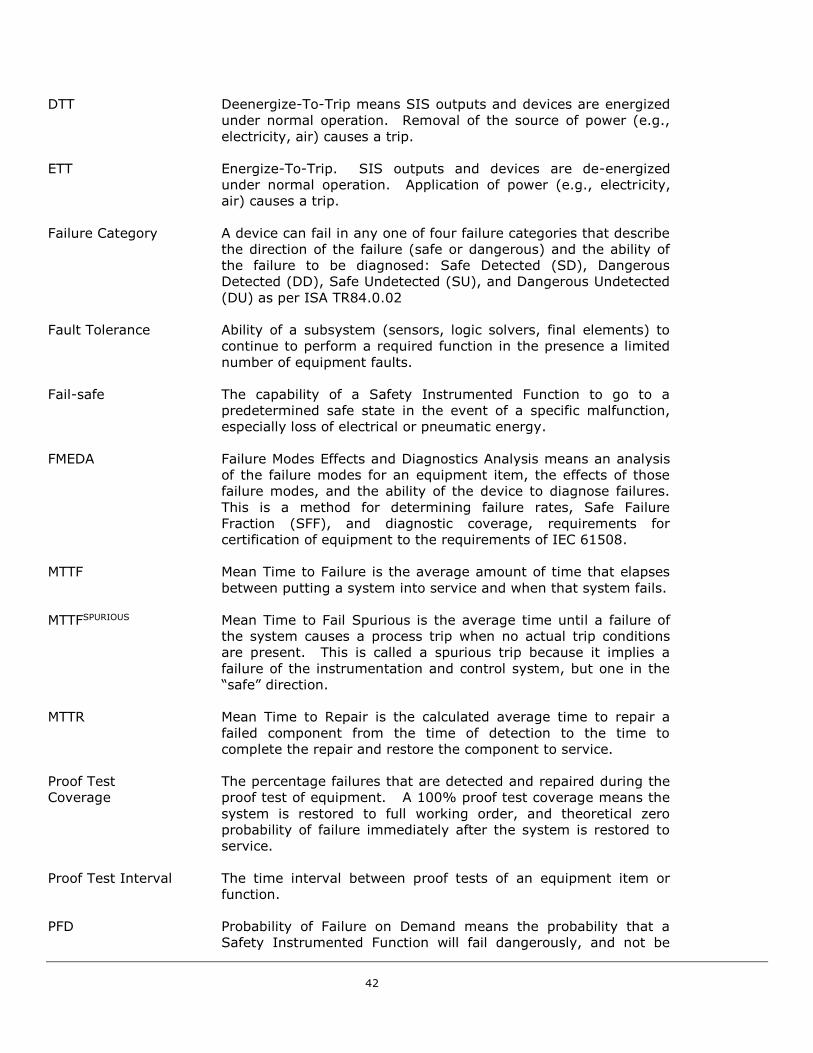
42
DTT Deenergize-To-Trip means SIS outputs and devices are energized
under normal operation. Removal of the source of power (e.g.,
electricity, air) causes a trip.
ETT Energize-To-Trip. SIS outputs and devices are de-energized
under normal operation. Application of power (e.g., electricity,
air) causes a trip.
Failure Category A device can fail in any one of four failure categories that describe
the direction of the failure (safe or dangerous) and the ability of
the failure to be diagnosed: Safe Detected (SD), Dangerous
Detected (DD), Safe Undetected (SU), and Dangerous Undetected
(DU) as per ISA TR84.0.02
Fault Tolerance Ability of a subsystem (sensors, logic solvers, final elements) to
continue to perform a required function in the presence a limited
number of equipment faults.
Fail-safe The capability of a Safety Instrumented Function to go to a
predetermined safe state in the event of a specific malfunction,
especially loss of electrical or pneumatic energy.
FMEDA Failure Modes Effects and Diagnostics Analysis means an analysis
of the failure modes for an equipment item, the effects of those
failure modes, and the ability of the device to diagnose failures.
This is a method for determining failure rates, Safe Failure
Fraction (SFF), and diagnostic coverage, requirements for
certification of equipment to the requirements of IEC 61508.
MTTF Mean Time to Failure is the average amount of time that elapses
between putting a system into service and when that system fails.
MTTFSPURIOUS Mean Time to Fail Spurious is the average time until a failure of
the system causes a process trip when no actual trip conditions
are present. This is called a spurious trip because it implies a
failure of the instrumentation and control system, but one in the
“safe” direction.
MTTR Mean Time to Repair is the calculated average time to repair a
failed component from the time of detection to the time to
complete the repair and restore the component to service.
Proof Test
Coverage
The percentage failures that are detected and repaired during the
proof test of equipment. A 100% proof test coverage means the
system is restored to full working order, and theoretical zero
probability of failure immediately after the system is restored to
service.
Proof Test Interval The time interval between proof tests of an equipment item or
function.
PFD Probability of Failure on Demand means the probability that a
Safety Instrumented Function will fail dangerously, and not be
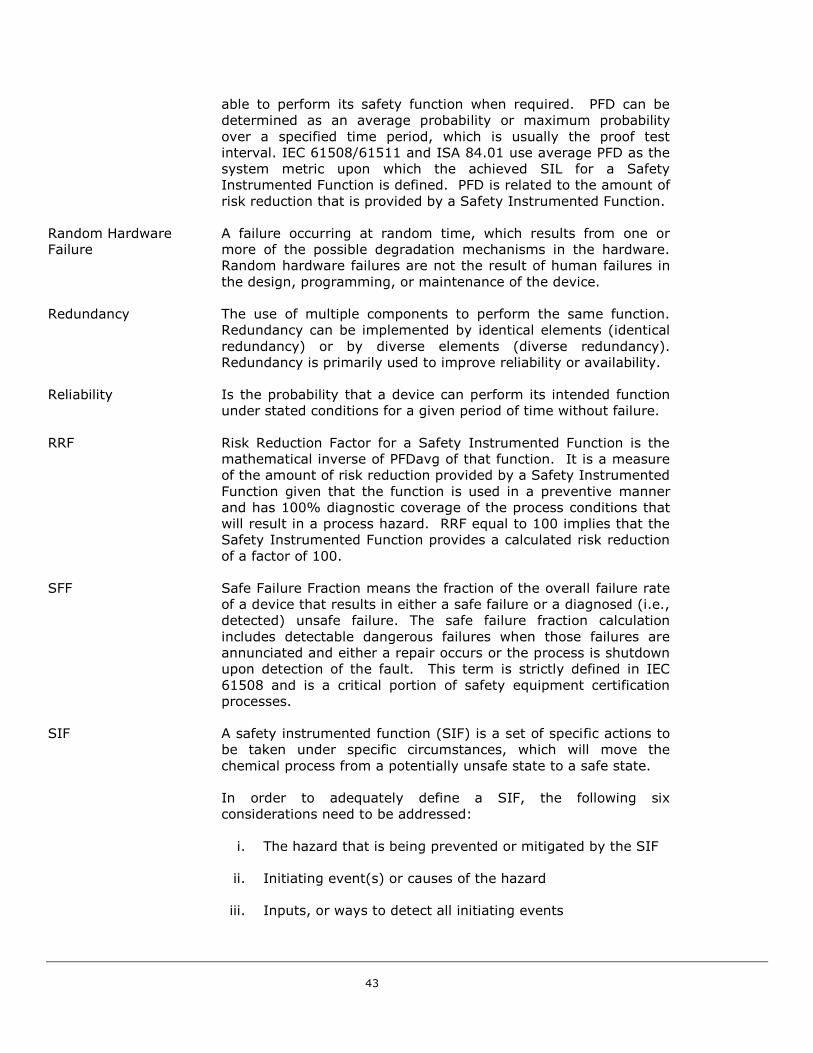
43
able to perform its safety function when required. PFD can be
determined as an average probability or maximum probability
over a specified time period, which is usually the proof test
interval. IEC 61508/61511 and ISA 84.01 use average PFD as the
system metric upon which the achieved SIL for a Safety
Instrumented Function is defined. PFD is related to the amount of
risk reduction that is provided by a Safety Instrumented Function.
Random Hardware
Failure
A failure occurring at random time, which results from one or
more of the possible degradation mechanisms in the hardware.
Random hardware failures are not the result of human failures in
the design, programming, or maintenance of the device.
Redundancy The use of multiple components to perform the same function.
Redundancy can be implemented by identical elements (identical
redundancy) or by diverse elements (diverse redundancy).
Redundancy is primarily used to improve reliability or availability.
Reliability Is the probability that a device can perform its intended function
under stated conditions for a given period of time without failure.
RRF Risk Reduction Factor for a Safety Instrumented Function is the
mathematical inverse of PFDavg of that function. It is a measure
of the amount of risk reduction provided by a Safety Instrumented
Function given that the function is used in a preventive manner
and has 100% diagnostic coverage of the process conditions that
will result in a process hazard. RRF equal to 100 implies that the
Safety Instrumented Function provides a calculated risk reduction
of a factor of 100.
SFF Safe Failure Fraction means the fraction of the overall failure rate
of a device that results in either a safe failure or a diagnosed (i.e.,
detected) unsafe failure. The safe failure fraction calculation
includes detectable dangerous failures when those failures are
annunciated and either a repair occurs or the process is shutdown
upon detection of the fault. This term is strictly defined in IEC
61508 and is a critical portion of safety equipment certification
processes.
SIF A safety instrumented function (SIF) is a set of specific actions to
be taken under specific circumstances, which will move the
chemical process from a potentially unsafe state to a safe state.
In order to adequately define a SIF, the following six
considerations need to be addressed:
i. The hazard that is being prevented or mitigated by the SIF
ii. Initiating event(s) or causes of the hazard
iii. Inputs, or ways to detect all initiating events
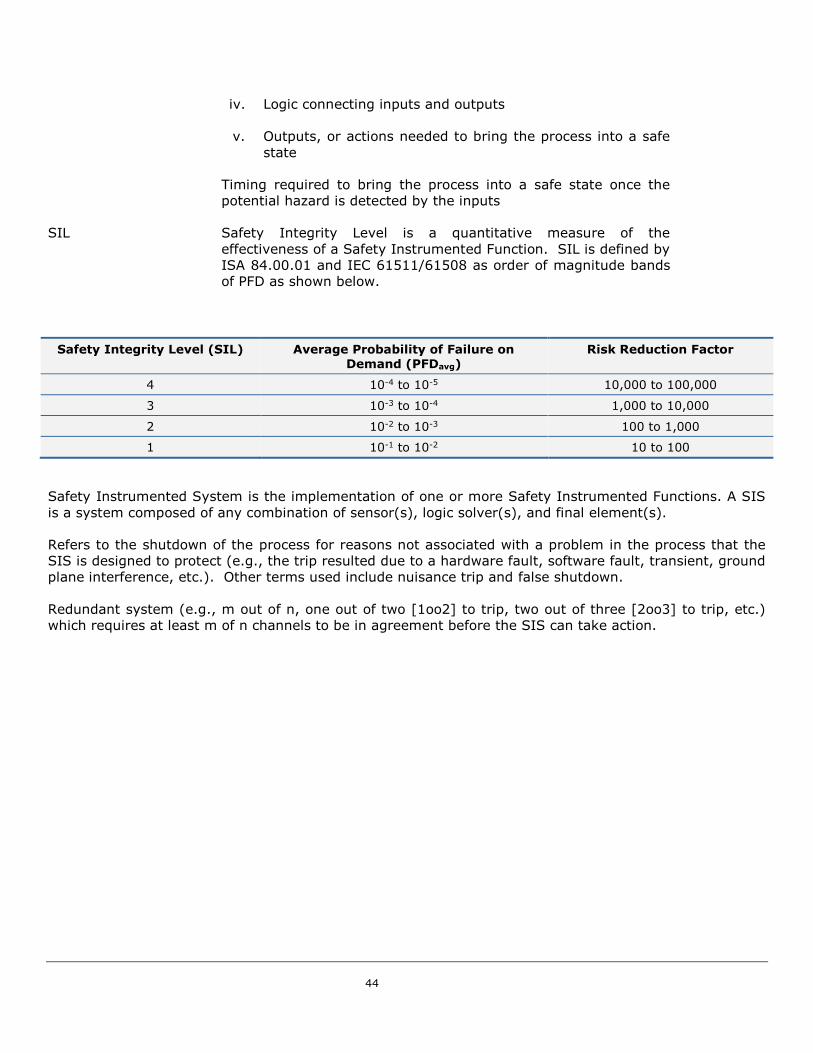
44
iv. Logic connecting inputs and outputs
v. Outputs, or actions needed to bring the process into a safe
state
Timing required to bring the process into a safe state once the
potential hazard is detected by the inputs
SIL Safety Integrity Level is a quantitative measure of the
effectiveness of a Safety Instrumented Function. SIL is defined by
ISA 84.00.01 and IEC 61511/61508 as order of magnitude bands
of PFD as shown below.
Safety Integrity Level (SIL) Average Probability of Failure on Demand (PFDavg)
Risk Reduction Factor
4 10-4 to 10-5 10,000 to 100,000
3 10-3 to 10-4 1,000 to 10,000
2 10-2 to 10-3 100 to 1,000
1 10-1 to 10-2 10 to 100
SIS Safety Instrumented System is the implementation of one or more Safety Instrumented Functions. A SIS
is a system composed of any combination of sensor(s), logic solver(s), and final element(s).
Spurious trip Refers to the shutdown of the process for reasons not associated with a problem in the process that the
SIS is designed to protect (e.g., the trip resulted due to a hardware fault, software fault, transient, ground
plane interference, etc.). Other terms used include nuisance trip and false shutdown.
Voting Redundant system (e.g., m out of n, one out of two [1oo2] to trip, two out of three [2oo3] to trip, etc.)
which requires at least m of n channels to be in agreement before the SIS can take action.
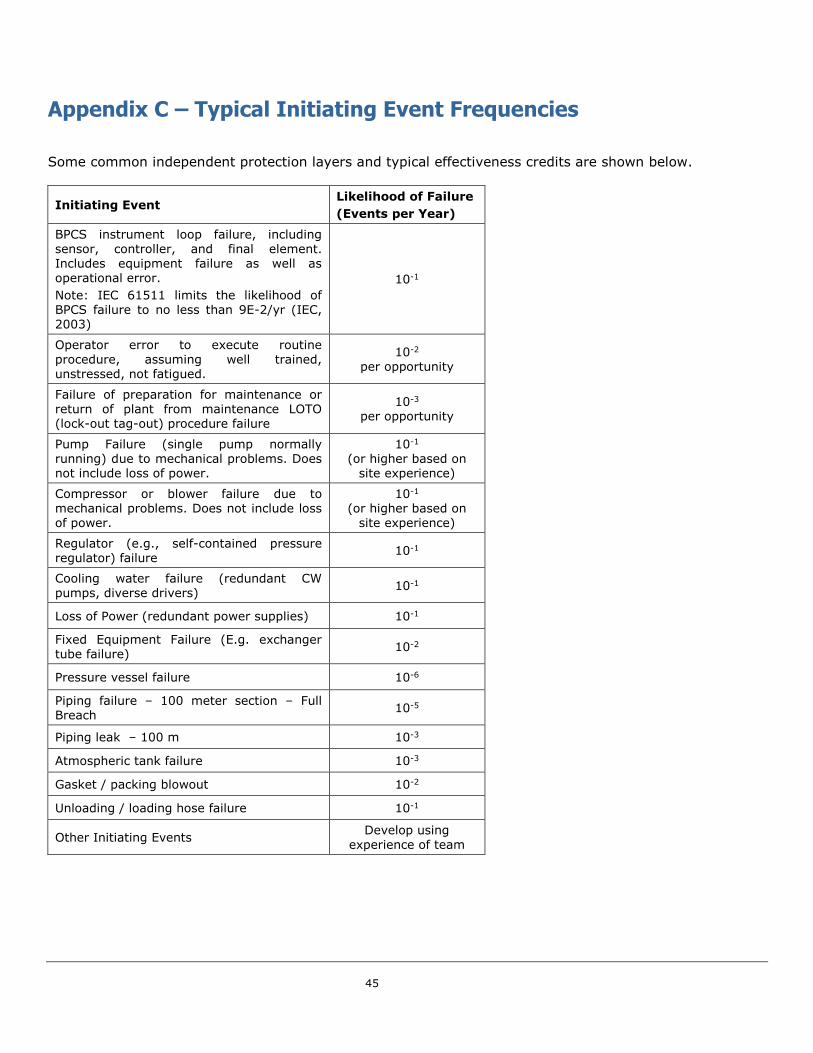
45
Appendix C – Typical Initiating Event Frequencies
Some common independent protection layers and typical effectiveness credits are shown below.
Initiating Event Likelihood of Failure
(Events per Year)
BPCS instrument loop failure, including sensor, controller, and final element. Includes equipment failure as well as operational error.
Note: IEC 61511 limits the likelihood of BPCS failure to no less than 9E-2/yr (IEC, 2003)
10-1
Operator error to execute routine procedure, assuming well trained, unstressed, not fatigued.
10-2 per opportunity
Failure of preparation for maintenance or return of plant from maintenance LOTO (lock-out tag-out) procedure failure
10-3 per opportunity
Pump Failure (single pump normally running) due to mechanical problems. Does not include loss of power.
10-1 (or higher based on
site experience)
Compressor or blower failure due to mechanical problems. Does not include loss of power.
10-1 (or higher based on
site experience)
Regulator (e.g., self-contained pressure regulator) failure
10-1
Cooling water failure (redundant CW pumps, diverse drivers)
10-1
Loss of Power (redundant power supplies) 10-1
Fixed Equipment Failure (E.g. exchanger tube failure)
10-2
Pressure vessel failure 10-6
Piping failure – 100 meter section – Full Breach
10-5
Piping leak – 100 m 10-3
Atmospheric tank failure 10-3
Gasket / packing blowout 10-2
Unloading / loading hose failure 10-1
Other Initiating Events Develop using
experience of team

46
Appendix D – Typical Protection Layers
Some common independent protection layers and typical effectiveness credits are shown below.
Suggested Risk Reduction for Independent Protection Layers
IPL Further Restrictions on Considering as IPL IPL (Typical)
Operator Intervention using Operating Procedures
The action should be independent from the initiating cause and any other IPL. If an operator action is the initiating cause, no IPL should be assigned to any operator action that solely relies
on the same operator to recognize problem and quickly correct it. If the initiating cause is the BPCS, no IPL should be assigned to any operator action that solely relies on BPCS information display (e.g., process conditions, indications).
Process Related Rounds and Inspections. Frequency of operator rounds should be sufficient to detect potential incident. If recognition of process variable is required, the operator should log specific values from sensors or valves independent of the initiating cause. Log should show unacceptable out-of-range values. SOP should describe response to out-of-range values.
1
Observational. Frequency of operator rounds should be sufficient to detect potential incident and mitigate ultimate scenario. Impending incident should be obvious to operator through normal visual or hearing range, i.e. loud noise, high vibration, serious leaking, etc.
1
Review: Independent, supervisory review and sign-off that work is complete and correct prior to start-up or returning component to service.
1
Action: An operator action that uses a different operator, relying on independent observation.
1
Corrective Action: An operator action taken based on a scenario where the event
propagation is sufficiently slow that the operator has enough time to recognize the error and to correct it.
1
Alarm: The alarm with operator response should be examined to ensure that it is independent from the initiating cause and any other IPL. This includes not only independent field instrumentation but also an independent channel in the BPCS and independent of the operator (different operator). Only one BPCS-based alarm or BPCS function can be used as an IPL.
The IPL credit associated with alarms with operator response is based on the amount of time available for action and the location of the response. See Operator Time Restrictions Table for more information.
See Table 6
Basic Process Control System
(BPCS)
The BPCS should be independent of the initiating cause and any other IPL. If the initiating cause is a BPCS control loop, another control loop within the BPCS should not be designated as an IPL, unless a detailed study of the BPCS is performed to ensure sufficient independence and
redundancy in order to address common cause failure. The IPL credit associated with a BPCS IPL is limited to 1 per IEC 61511.
Control loops normal action will mitigate the scenario. The BPCS IPL should run in automatic mode during all operational phases where the accident scenario exists.
1
BPCS interlocks (interlocks NOT implemented in a separate, dedicated logic solver) where all causes can be verified as independent of failure of the BPCS logic solver
1
BPCS interlocks (interlocks NOT implemented in a separate, dedicated logic solver) where all causes can NOT be verified as independent of failure of the BPCS logic solver
0

47
IPL Further Restrictions on Considering as IPL IPL
(Typical)
Other/Local The IPL should be independent of initiating cause and any other IPL. It should be designed to mitigate the scenario.
Check Valve
Single check valve. (none)
Dual check valves in series. 1
Flame Arrester Should be designed to mitigate the scenario. 1 or 2
Vacuum Breaker Should be designed to mitigate the scenario. 1 or 2
Restrictive Orifice Should be designed to mitigate the scenario. 1 or 2
Pressure Regulator Should be designed to mitigate the scenario. 1
Special
Personnel Protection Equipment
Special personnel protection equipment that is not normally worn by operation or maintenance personnel, but is part of an established procedure. This PPE would include wire mesh gloves, fire suits, respirators, self-contained breathing apparatus, etc. The user of the equipment should be trained in the use of the PPE.
1
Safety Instrumented System
Should be independent of the BPCS. IPL credit is based on the SIL that is achieved by the complete functional loop.
SIL 1 1
SIL 2 2
SIL 3 3
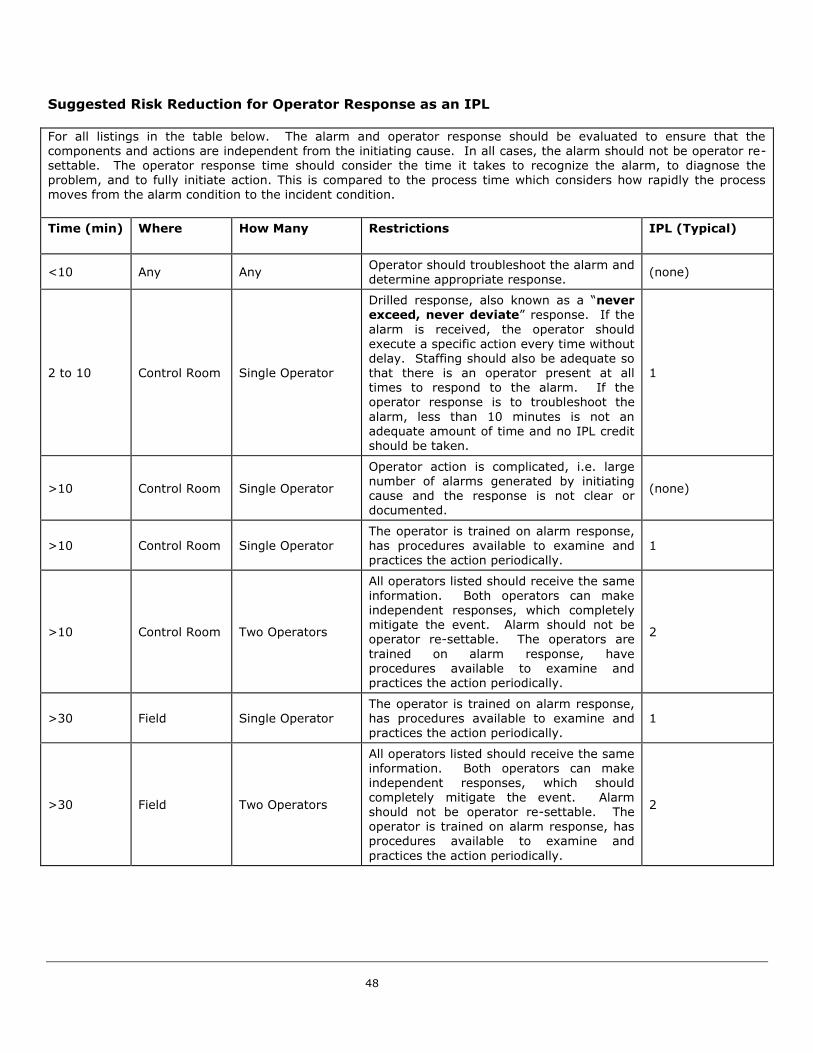
48
Suggested Risk Reduction for Operator Response as an IPL
For all listings in the table below. The alarm and operator response should be evaluated to ensure that the components and actions are independent from the initiating cause. In all cases, the alarm should not be operator re-settable. The operator response time should consider the time it takes to recognize the alarm, to diagnose the problem, and to fully initiate action. This is compared to the process time which considers how rapidly the process moves from the alarm condition to the incident condition.
Time (min) Where How Many Restrictions IPL (Typical)
<10 Any Any Operator should troubleshoot the alarm and determine appropriate response.
(none)
2 to 10 Control Room Single Operator
Drilled response, also known as a “never exceed, never deviate” response. If the
alarm is received, the operator should
execute a specific action every time without delay. Staffing should also be adequate so that there is an operator present at all times to respond to the alarm. If the operator response is to troubleshoot the
alarm, less than 10 minutes is not an adequate amount of time and no IPL credit should be taken.
1
>10 Control Room Single Operator
Operator action is complicated, i.e. large number of alarms generated by initiating cause and the response is not clear or documented.
(none)
>10 Control Room Single Operator The operator is trained on alarm response, has procedures available to examine and practices the action periodically.
1
>10 Control Room Two Operators
All operators listed should receive the same information. Both operators can make independent responses, which completely mitigate the event. Alarm should not be operator re-settable. The operators are
trained on alarm response, have procedures available to examine and practices the action periodically.
2
>30 Field Single Operator The operator is trained on alarm response, has procedures available to examine and practices the action periodically.
1
>30 Field Two Operators
All operators listed should receive the same information. Both operators can make independent responses, which should completely mitigate the event. Alarm
should not be operator re-settable. The operator is trained on alarm response, has procedures available to examine and
practices the action periodically.
2
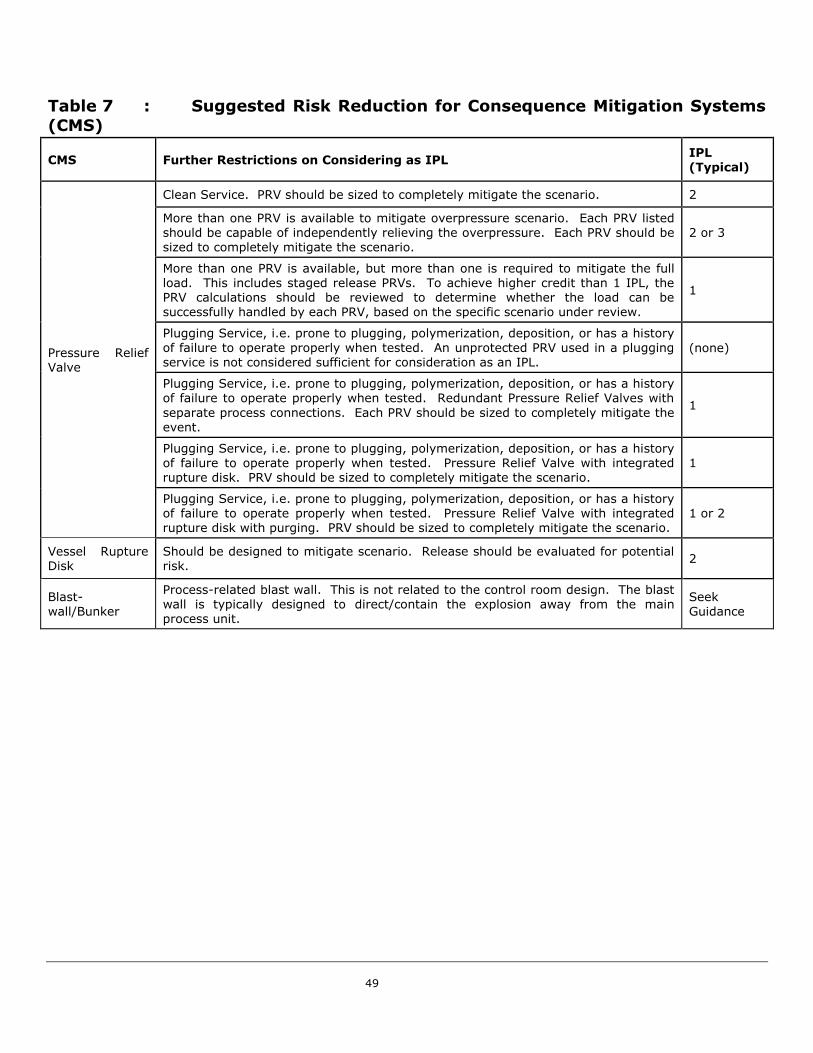
49
Table 7 : Suggested Risk Reduction for Consequence Mitigation Systems
(CMS)
CMS Further Restrictions on Considering as IPL IPL (Typical)
Pressure Relief Valve
Clean Service. PRV should be sized to completely mitigate the scenario. 2
More than one PRV is available to mitigate overpressure scenario. Each PRV listed should be capable of independently relieving the overpressure. Each PRV should be sized to completely mitigate the scenario.
2 or 3
More than one PRV is available, but more than one is required to mitigate the full load. This includes staged release PRVs. To achieve higher credit than 1 IPL, the PRV calculations should be reviewed to determine whether the load can be successfully handled by each PRV, based on the specific scenario under review.
1
Plugging Service, i.e. prone to plugging, polymerization, deposition, or has a history
of failure to operate properly when tested. An unprotected PRV used in a plugging service is not considered sufficient for consideration as an IPL.
(none)
Plugging Service, i.e. prone to plugging, polymerization, deposition, or has a history of failure to operate properly when tested. Redundant Pressure Relief Valves with
separate process connections. Each PRV should be sized to completely mitigate the event.
1
Plugging Service, i.e. prone to plugging, polymerization, deposition, or has a history of failure to operate properly when tested. Pressure Relief Valve with integrated rupture disk. PRV should be sized to completely mitigate the scenario.
1
Plugging Service, i.e. prone to plugging, polymerization, deposition, or has a history of failure to operate properly when tested. Pressure Relief Valve with integrated rupture disk with purging. PRV should be sized to completely mitigate the scenario.
1 or 2
Vessel Rupture Disk
Should be designed to mitigate scenario. Release should be evaluated for potential risk.
2
Blast-wall/Bunker
Process-related blast wall. This is not related to the control room design. The blast wall is typically designed to direct/contain the explosion away from the main process unit.
Seek Guidance
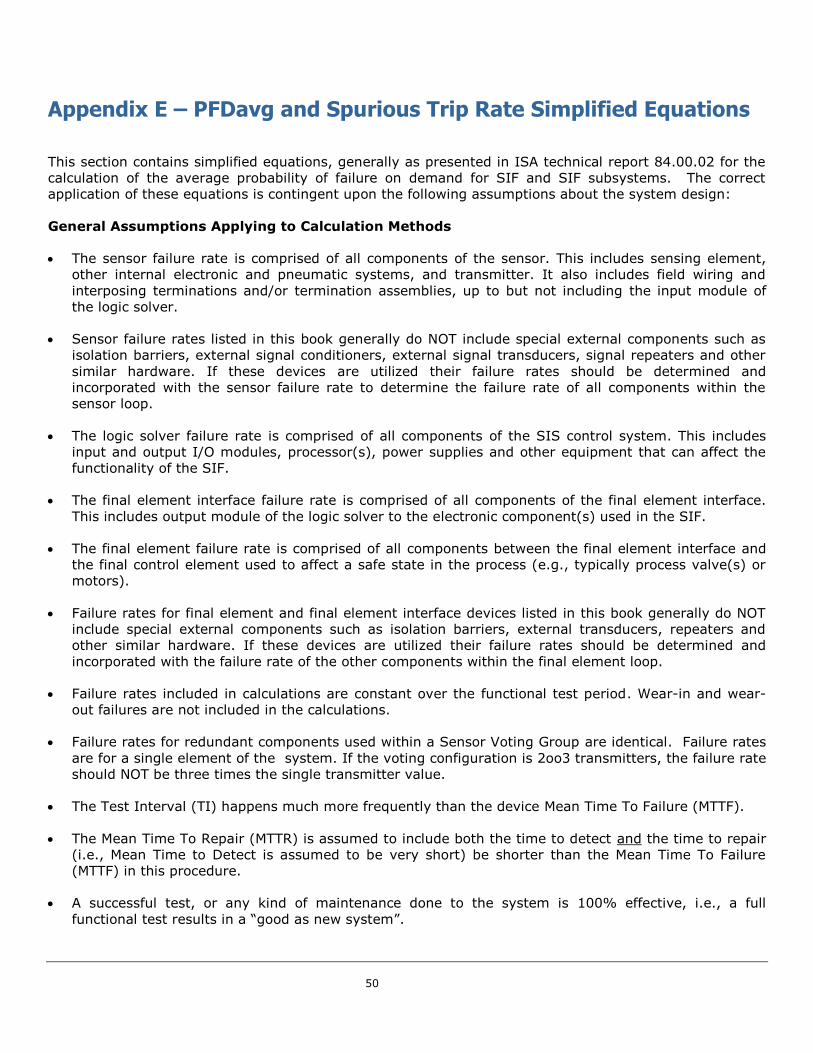
50
Appendix E – PFDavg and Spurious Trip Rate Simplified Equations
This section contains simplified equations, generally as presented in ISA technical report 84.00.02 for the
calculation of the average probability of failure on demand for SIF and SIF subsystems. The correct
application of these equations is contingent upon the following assumptions about the system design:
General Assumptions Applying to Calculation Methods
• The sensor failure rate is comprised of all components of the sensor. This includes sensing element,
other internal electronic and pneumatic systems, and transmitter. It also includes field wiring and
interposing terminations and/or termination assemblies, up to but not including the input module of
the logic solver.
• Sensor failure rates listed in this book generally do NOT include special external components such as
isolation barriers, external signal conditioners, external signal transducers, signal repeaters and other
similar hardware. If these devices are utilized their failure rates should be determined and
incorporated with the sensor failure rate to determine the failure rate of all components within the
sensor loop.
• The logic solver failure rate is comprised of all components of the SIS control system. This includes
input and output I/O modules, processor(s), power supplies and other equipment that can affect the
functionality of the SIF.
• The final element interface failure rate is comprised of all components of the final element interface.
This includes output module of the logic solver to the electronic component(s) used in the SIF.
• The final element failure rate is comprised of all components between the final element interface and
the final control element used to affect a safe state in the process (e.g., typically process valve(s) or
motors).
• Failure rates for final element and final element interface devices listed in this book generally do NOT
include special external components such as isolation barriers, external transducers, repeaters and
other similar hardware. If these devices are utilized their failure rates should be determined and
incorporated with the failure rate of the other components within the final element loop.
• Failure rates included in calculations are constant over the functional test period. Wear-in and wear-
out failures are not included in the calculations.
• Failure rates for redundant components used within a Sensor Voting Group are identical. Failure rates
are for a single element of the system. If the voting configuration is 2oo3 transmitters, the failure rate
should NOT be three times the single transmitter value.
• The Test Interval (TI) happens much more frequently than the device Mean Time To Failure (MTTF).
• The Mean Time To Repair (MTTR) is assumed to include both the time to detect and the time to repair
(i.e., Mean Time to Detect is assumed to be very short) be shorter than the Mean Time To Failure
(MTTF) in this procedure.
• A successful test, or any kind of maintenance done to the system is 100% effective, i.e., a full
functional test results in a “good as new system”.
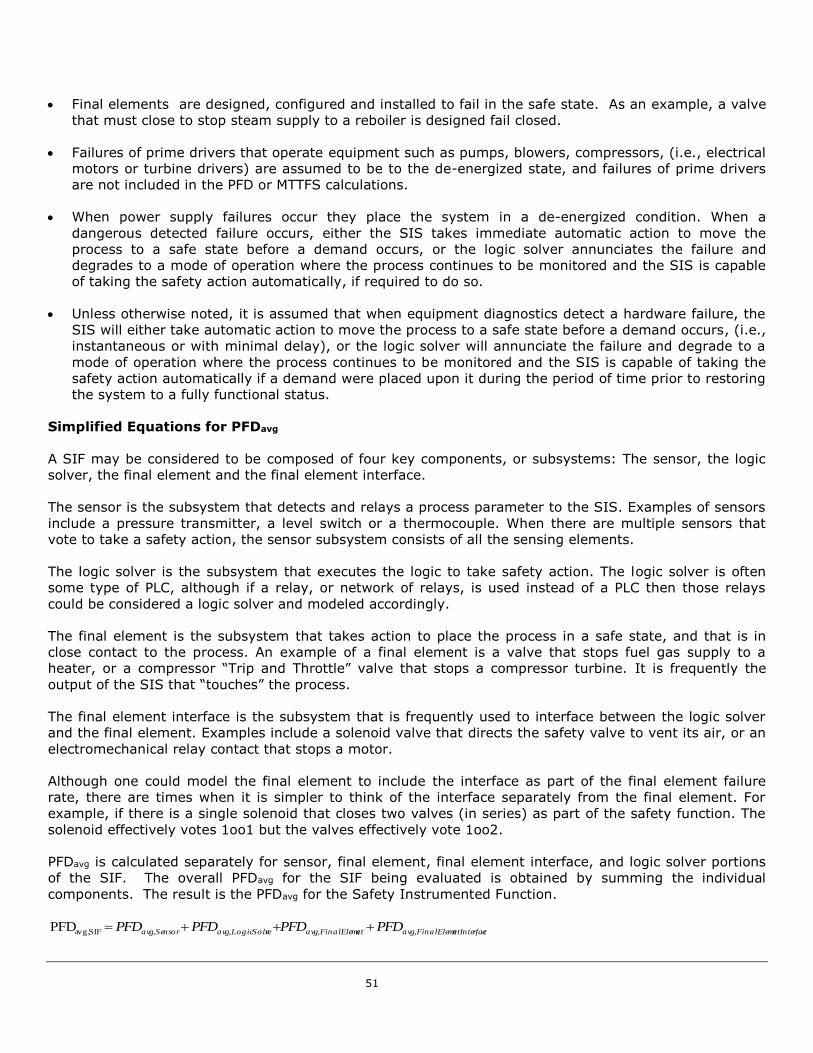
51
• Final elements are designed, configured and installed to fail in the safe state. As an example, a valve
that must close to stop steam supply to a reboiler is designed fail closed.
• Failures of prime drivers that operate equipment such as pumps, blowers, compressors, (i.e., electrical
motors or turbine drivers) are assumed to be to the de-energized state, and failures of prime drivers
are not included in the PFD or MTTFS calculations.
• When power supply failures occur they place the system in a de-energized condition. When a
dangerous detected failure occurs, either the SIS takes immediate automatic action to move the
process to a safe state before a demand occurs, or the logic solver annunciates the failure and
degrades to a mode of operation where the process continues to be monitored and the SIS is capable
of taking the safety action automatically, if required to do so.
• Unless otherwise noted, it is assumed that when equipment diagnostics detect a hardware failure, the
SIS will either take automatic action to move the process to a safe state before a demand occurs, (i.e.,
instantaneous or with minimal delay), or the logic solver will annunciate the failure and degrade to a
mode of operation where the process continues to be monitored and the SIS is capable of taking the
safety action automatically if a demand were placed upon it during the period of time prior to restoring
the system to a fully functional status.
Simplified Equations for PFDavg
A SIF may be considered to be composed of four key components, or subsystems: The sensor, the logic
solver, the final element and the final element interface.
The sensor is the subsystem that detects and relays a process parameter to the SIS. Examples of sensors
include a pressure transmitter, a level switch or a thermocouple. When there are multiple sensors that
vote to take a safety action, the sensor subsystem consists of all the sensing elements.
The logic solver is the subsystem that executes the logic to take safety action. The logic solver is often
some type of PLC, although if a relay, or network of relays, is used instead of a PLC then those relays
could be considered a logic solver and modeled accordingly.
The final element is the subsystem that takes action to place the process in a safe state, and that is in
close contact to the process. An example of a final element is a valve that stops fuel gas supply to a
heater, or a compressor “Trip and Throttle” valve that stops a compressor turbine. It is frequently the
output of the SIS that “touches” the process.
The final element interface is the subsystem that is frequently used to interface between the logic solver
and the final element. Examples include a solenoid valve that directs the safety valve to vent its air, or an
electromechanical relay contact that stops a motor.
Although one could model the final element to include the interface as part of the final element failure
rate, there are times when it is simpler to think of the interface separately from the final element. For
example, if there is a single solenoid that closes two valves (in series) as part of the safety function. The
solenoid effectively votes 1oo1 but the valves effectively vote 1oo2.
PFDavg is calculated separately for sensor, final element, final element interface, and logic solver portions
of the SIF. The overall PFDavg for the SIF being evaluated is obtained by summing the individual
components. The result is the PFDavg for the Safety Instrumented Function.
entInterfacFinalElemeavgntFinalElemeavgrLogicSolveavgSensoravg PFDPFDPFDPFD ,,,,SIF avg,PFD
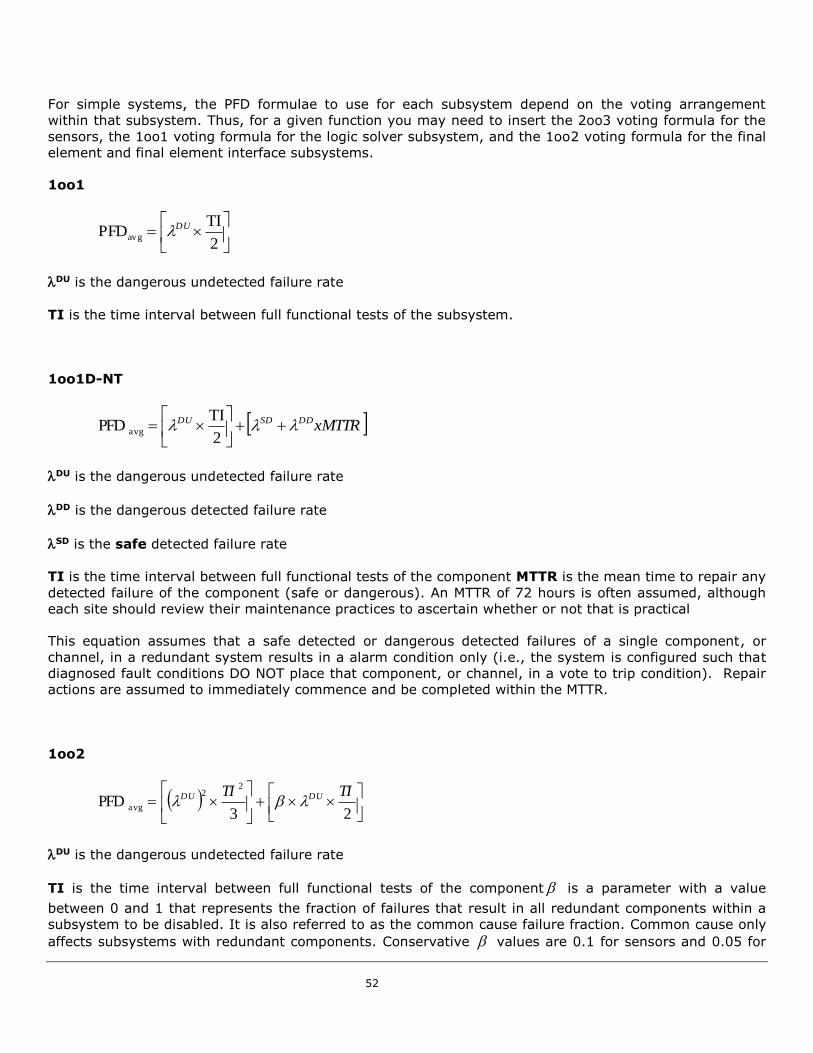
52
For simple systems, the PFD formulae to use for each subsystem depend on the voting arrangement
within that subsystem. Thus, for a given function you may need to insert the 2oo3 voting formula for the
sensors, the 1oo1 voting formula for the logic solver subsystem, and the 1oo2 voting formula for the final
element and final element interface subsystems.
1oo1
2
TIPFDavg
DU
DU is the dangerous undetected failure rate
TI is the time interval between full functional tests of the subsystem.
1oo1D-NT
xMTTRDDSDDU
2
TIPFD avg
DU is the dangerous undetected failure rate
DD is the dangerous detected failure rate
SD is the safe detected failure rate
TI is the time interval between full functional tests of the component MTTR is the mean time to repair any
detected failure of the component (safe or dangerous). An MTTR of 72 hours is often assumed, although
each site should review their maintenance practices to ascertain whether or not that is practical
This equation assumes that a safe detected or dangerous detected failures of a single component, or
channel, in a redundant system results in a alarm condition only (i.e., the system is configured such that
diagnosed fault conditions DO NOT place that component, or channel, in a vote to trip condition). Repair
actions are assumed to immediately commence and be completed within the MTTR.
1oo2
23PFD
22
avg
TITI DUDU
DU is the dangerous undetected failure rate
TI is the time interval between full functional tests of the component is a parameter with a value
between 0 and 1 that represents the fraction of failures that result in all redundant components within a
subsystem to be disabled. It is also referred to as the common cause failure fraction. Common cause only
affects subsystems with redundant components. Conservative values are 0.1 for sensors and 0.05 for
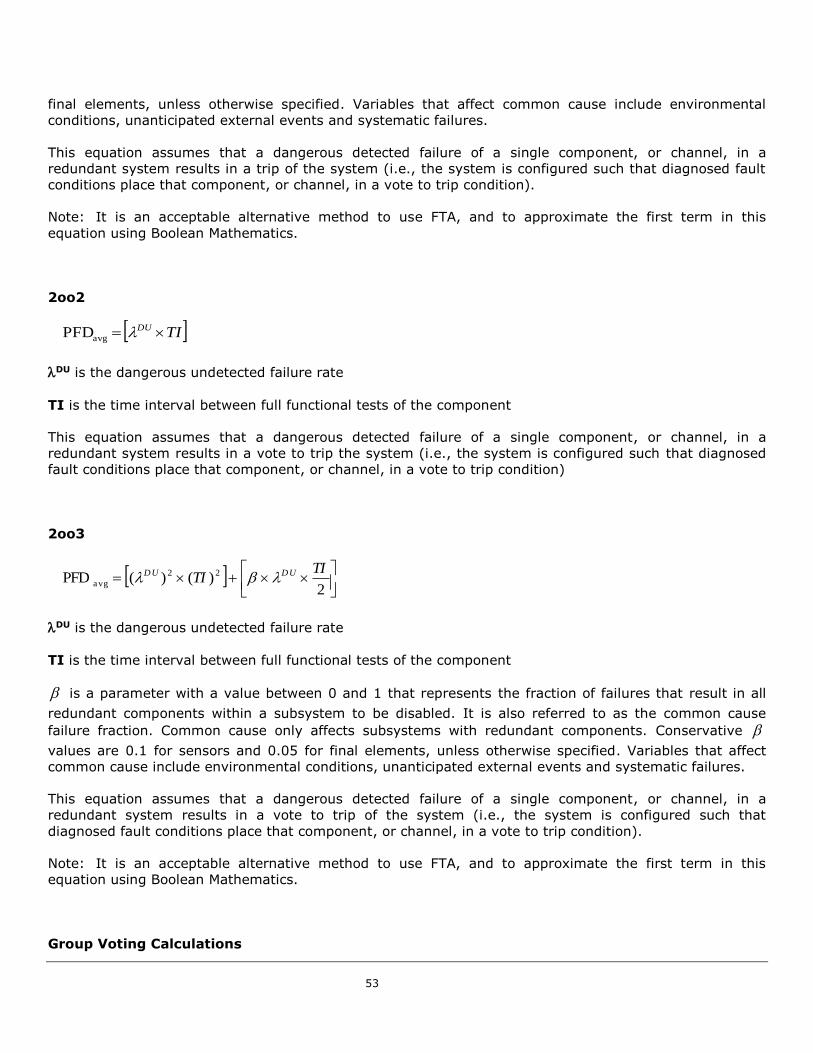
53
final elements, unless otherwise specified. Variables that affect common cause include environmental
conditions, unanticipated external events and systematic failures.
This equation assumes that a dangerous detected failure of a single component, or channel, in a
redundant system results in a trip of the system (i.e., the system is configured such that diagnosed fault
conditions place that component, or channel, in a vote to trip condition).
Note: It is an acceptable alternative method to use FTA, and to approximate the first term in this
equation using Boolean Mathematics.
2oo2
TIDU avgPFD
DU is the dangerous undetected failure rate
TI is the time interval between full functional tests of the component
This equation assumes that a dangerous detected failure of a single component, or channel, in a
redundant system results in a vote to trip the system (i.e., the system is configured such that diagnosed
fault conditions place that component, or channel, in a vote to trip condition)
2oo3
2)()(PFD 22
avg
TITI DUDU
DU is the dangerous undetected failure rate
TI is the time interval between full functional tests of the component
is a parameter with a value between 0 and 1 that represents the fraction of failures that result in all
redundant components within a subsystem to be disabled. It is also referred to as the common cause
failure fraction. Common cause only affects subsystems with redundant components. Conservative
values are 0.1 for sensors and 0.05 for final elements, unless otherwise specified. Variables that affect
common cause include environmental conditions, unanticipated external events and systematic failures.
This equation assumes that a dangerous detected failure of a single component, or channel, in a
redundant system results in a vote to trip of the system (i.e., the system is configured such that
diagnosed fault conditions place that component, or channel, in a vote to trip condition).
Note: It is an acceptable alternative method to use FTA, and to approximate the first term in this
equation using Boolean Mathematics.
Group Voting Calculations
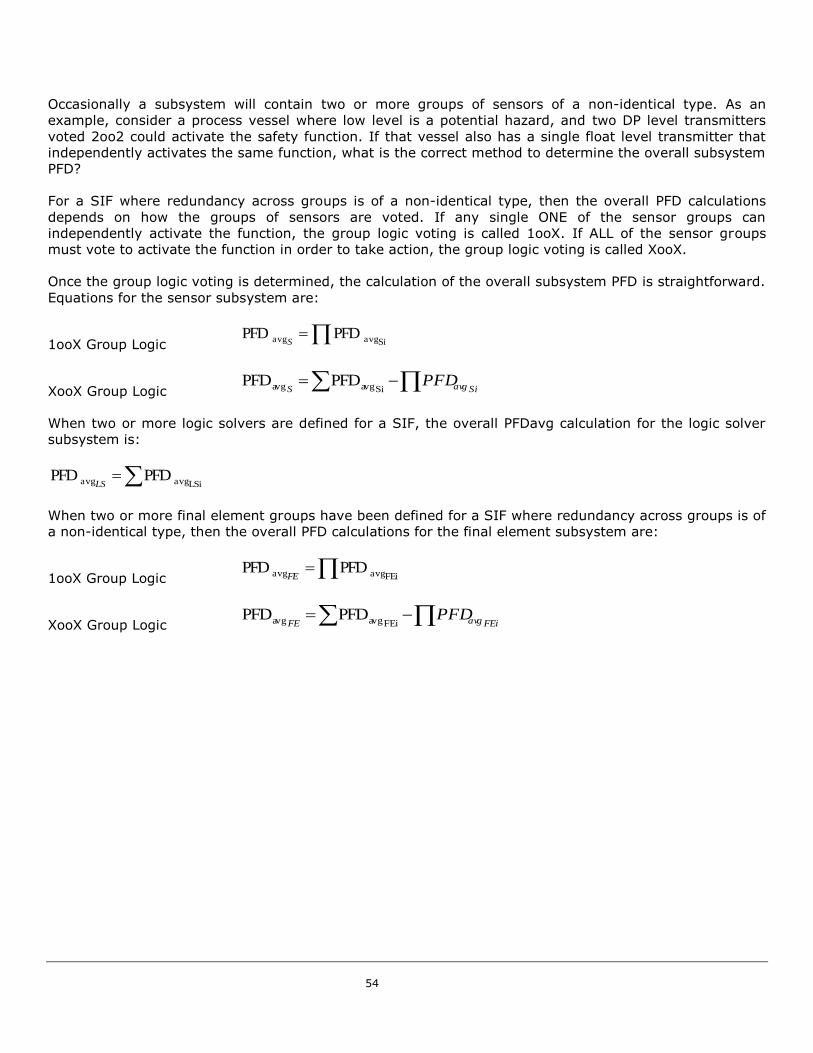
54
Occasionally a subsystem will contain two or more groups of sensors of a non-identical type. As an
example, consider a process vessel where low level is a potential hazard, and two DP level transmitters
voted 2oo2 could activate the safety function. If that vessel also has a single float level transmitter that
independently activates the same function, what is the correct method to determine the overall subsystem
PFD?
For a SIF where redundancy across groups is of a non-identical type, then the overall PFD calculations
depends on how the groups of sensors are voted. If any single ONE of the sensor groups can
independently activate the function, the group logic voting is called 1ooX. If ALL of the sensor groups
must vote to activate the function in order to take action, the group logic voting is called XooX.
Once the group logic voting is determined, the calculation of the overall subsystem PFD is straightforward.
Equations for the sensor subsystem are:
1ooX Group Logic Siavgavg PFDPFD
S
XooX Group Logic
SiavgSPFD
Siavgavg PFDPFD
When two or more logic solvers are defined for a SIF, the overall PFDavg calculation for the logic solver
subsystem is:
LSiavgavg PFDPFDLS
When two or more final element groups have been defined for a SIF where redundancy across groups is of
a non-identical type, then the overall PFD calculations for the final element subsystem are:
1ooX Group Logic FEiavgavg PFDPFD
FE
XooX Group Logic
FEiavgFEPFD
FEiavgavg PFDPFD
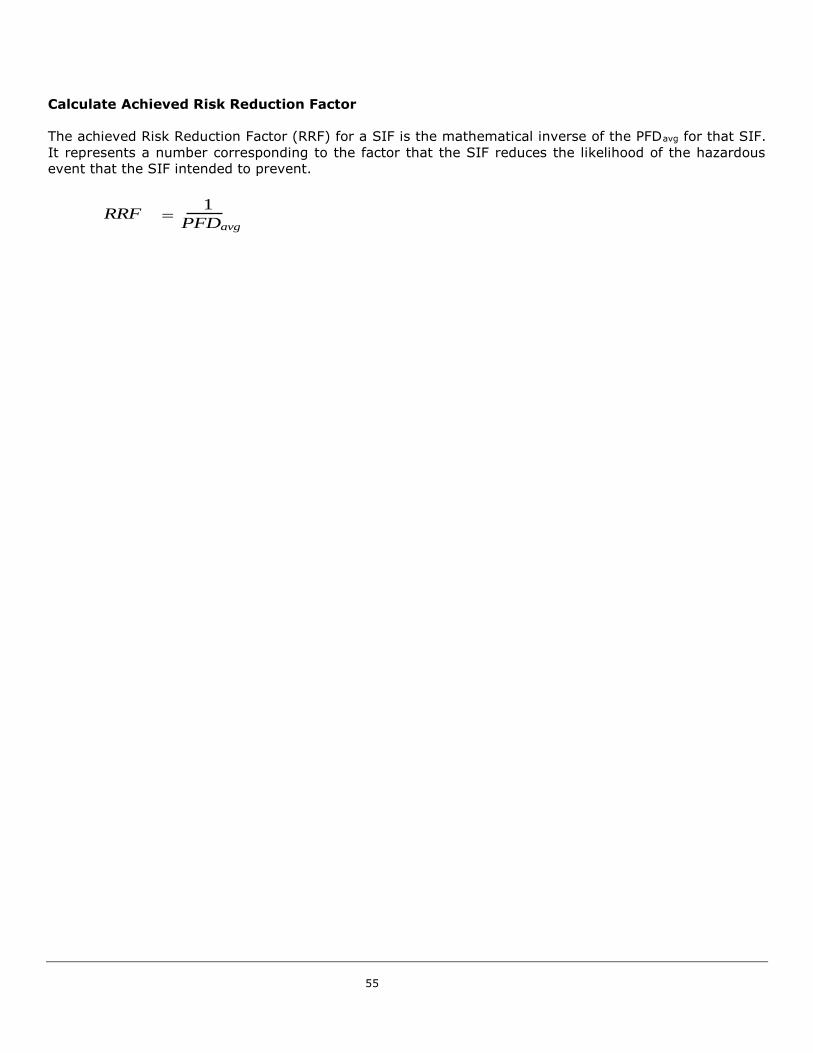
55
Calculate Achieved Risk Reduction Factor
The achieved Risk Reduction Factor (RRF) for a SIF is the mathematical inverse of the PFDavg for that SIF.
It represents a number corresponding to the factor that the SIF reduces the likelihood of the hazardous
event that the SIF intended to prevent.
RRF
PFDavg
1
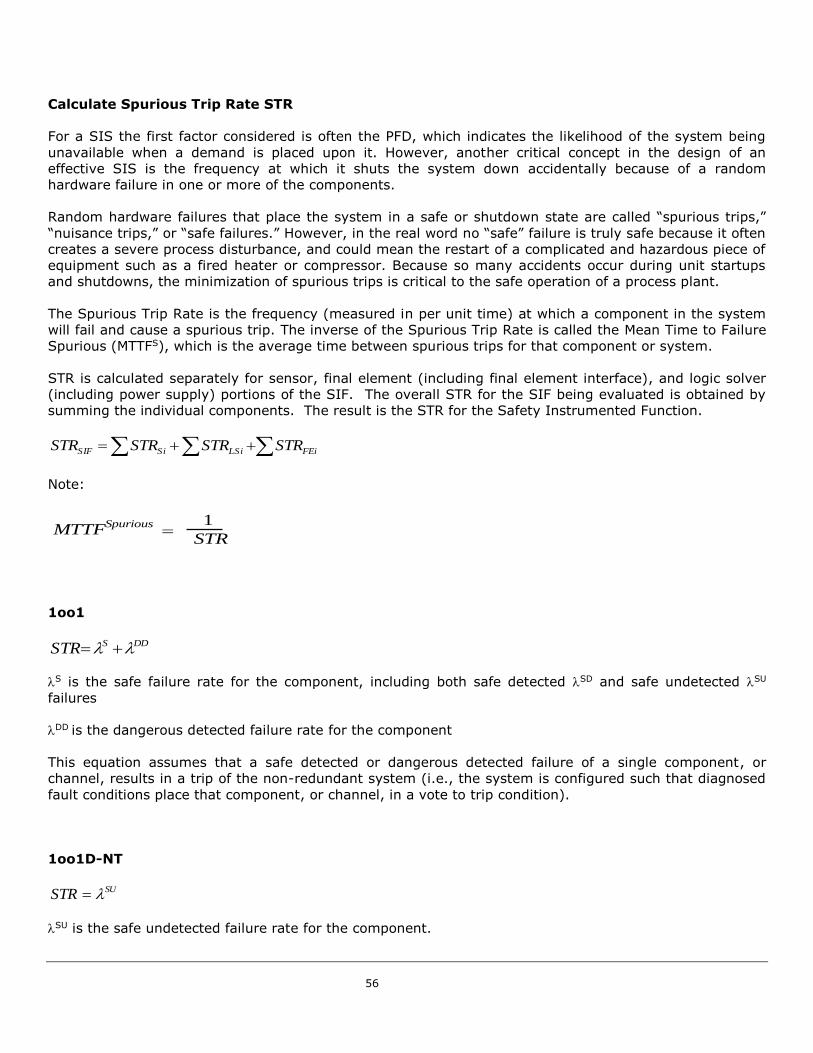
56
Calculate Spurious Trip Rate STR
For a SIS the first factor considered is often the PFD, which indicates the likelihood of the system being
unavailable when a demand is placed upon it. However, another critical concept in the design of an
effective SIS is the frequency at which it shuts the system down accidentally because of a random
hardware failure in one or more of the components.
Random hardware failures that place the system in a safe or shutdown state are called “spurious trips,”
“nuisance trips,” or “safe failures.” However, in the real word no “safe” failure is truly safe because it often
creates a severe process disturbance, and could mean the restart of a complicated and hazardous piece of
equipment such as a fired heater or compressor. Because so many accidents occur during unit startups
and shutdowns, the minimization of spurious trips is critical to the safe operation of a process plant.
The Spurious Trip Rate is the frequency (measured in per unit time) at which a component in the system
will fail and cause a spurious trip. The inverse of the Spurious Trip Rate is called the Mean Time to Failure
Spurious (MTTFS), which is the average time between spurious trips for that component or system.
STR is calculated separately for sensor, final element (including final element interface), and logic solver
(including power supply) portions of the SIF. The overall STR for the SIF being evaluated is obtained by
summing the individual components. The result is the STR for the Safety Instrumented Function.
FEiLSiSiSIF STRSTRSTRSTR
Note:
MTTFSpurious
STR
1
1oo1
DDSSTR
S is the safe failure rate for the component, including both safe detected SD and safe undetected SU
failures
DD is the dangerous detected failure rate for the component
This equation assumes that a safe detected or dangerous detected failure of a single component, or
channel, results in a trip of the non-redundant system (i.e., the system is configured such that diagnosed
fault conditions place that component, or channel, in a vote to trip condition).
1oo1D-NT
SUSTR
SU is the safe undetected failure rate for the component.
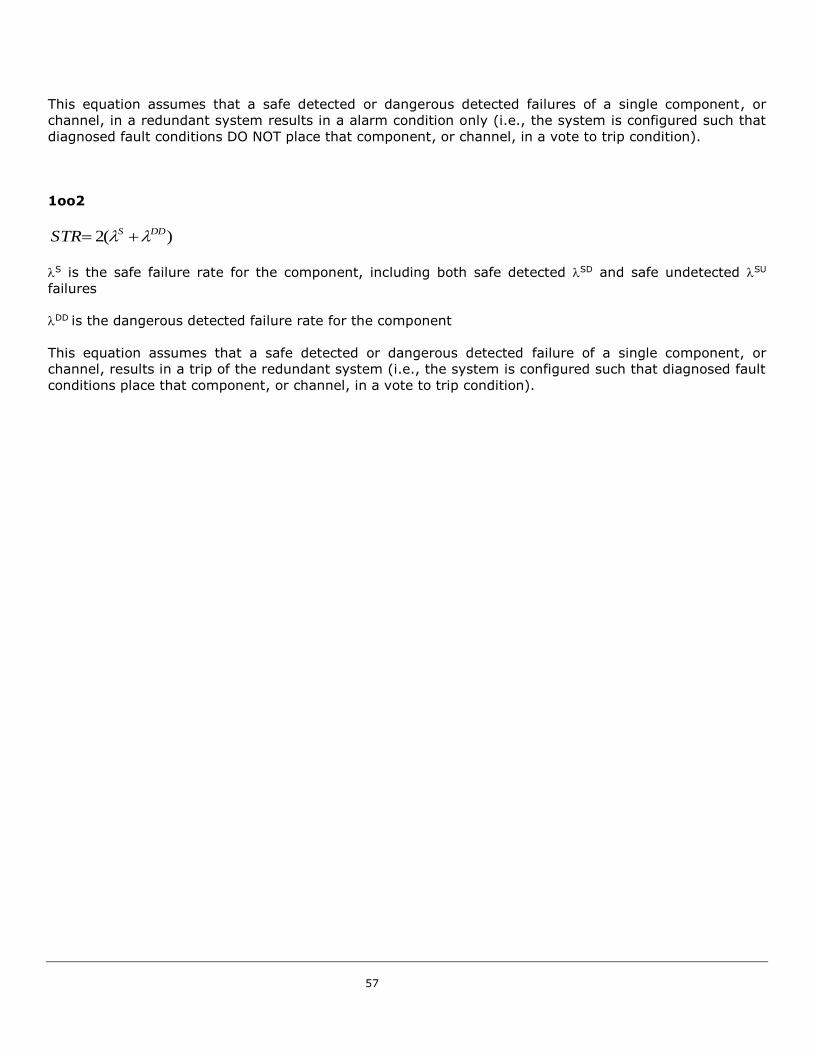
57
This equation assumes that a safe detected or dangerous detected failures of a single component, or
channel, in a redundant system results in a alarm condition only (i.e., the system is configured such that
diagnosed fault conditions DO NOT place that component, or channel, in a vote to trip condition).
1oo2
)(2 DDSSTR
S is the safe failure rate for the component, including both safe detected SD and safe undetected SU
failures
DD is the dangerous detected failure rate for the component
This equation assumes that a safe detected or dangerous detected failure of a single component, or
channel, results in a trip of the redundant system (i.e., the system is configured such that diagnosed fault
conditions place that component, or channel, in a vote to trip condition).
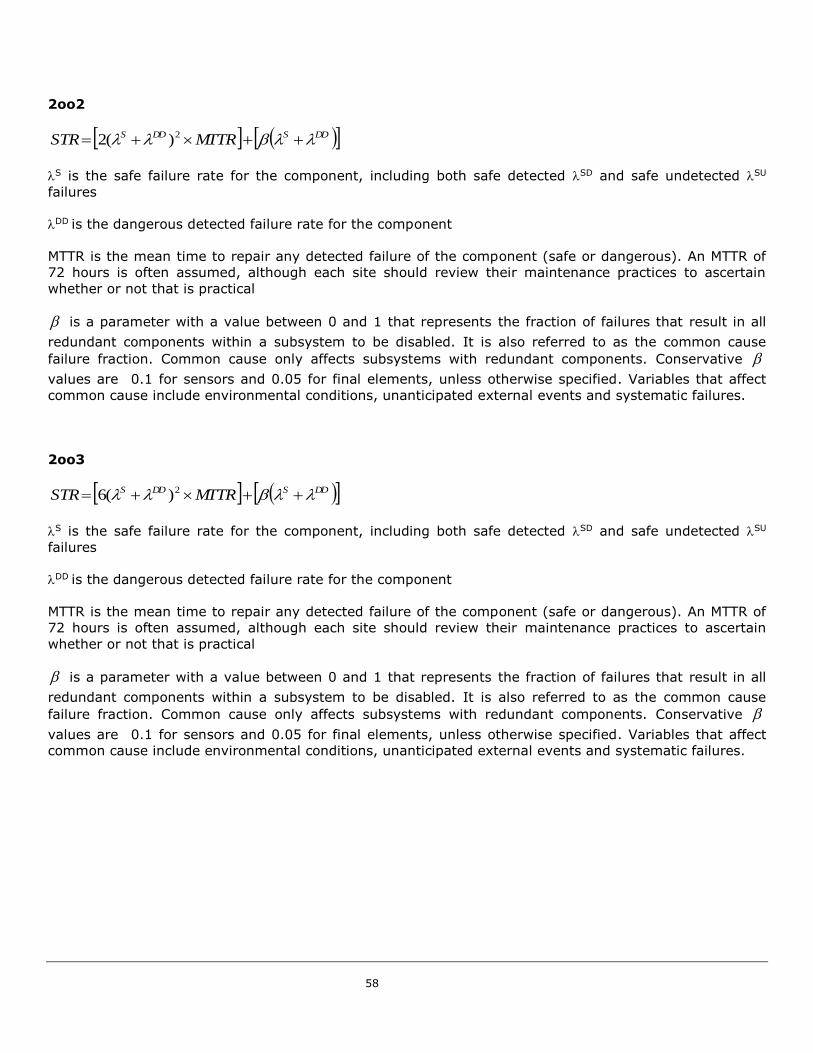
58
2oo2
DDSDDS MTTRSTR 2)(2
S is the safe failure rate for the component, including both safe detected SD and safe undetected SU
failures
DD is the dangerous detected failure rate for the component
MTTR is the mean time to repair any detected failure of the component (safe or dangerous). An MTTR of
72 hours is often assumed, although each site should review their maintenance practices to ascertain
whether or not that is practical
is a parameter with a value between 0 and 1 that represents the fraction of failures that result in all
redundant components within a subsystem to be disabled. It is also referred to as the common cause
failure fraction. Common cause only affects subsystems with redundant components. Conservative
values are 0.1 for sensors and 0.05 for final elements, unless otherwise specified. Variables that affect
common cause include environmental conditions, unanticipated external events and systematic failures.
2oo3
DDSDDS MTTRSTR 2)(6
S is the safe failure rate for the component, including both safe detected SD and safe undetected SU
failures
DD is the dangerous detected failure rate for the component
MTTR is the mean time to repair any detected failure of the component (safe or dangerous). An MTTR of
72 hours is often assumed, although each site should review their maintenance practices to ascertain
whether or not that is practical
is a parameter with a value between 0 and 1 that represents the fraction of failures that result in all
redundant components within a subsystem to be disabled. It is also referred to as the common cause
failure fraction. Common cause only affects subsystems with redundant components. Conservative
values are 0.1 for sensors and 0.05 for final elements, unless otherwise specified. Variables that affect
common cause include environmental conditions, unanticipated external events and systematic failures.
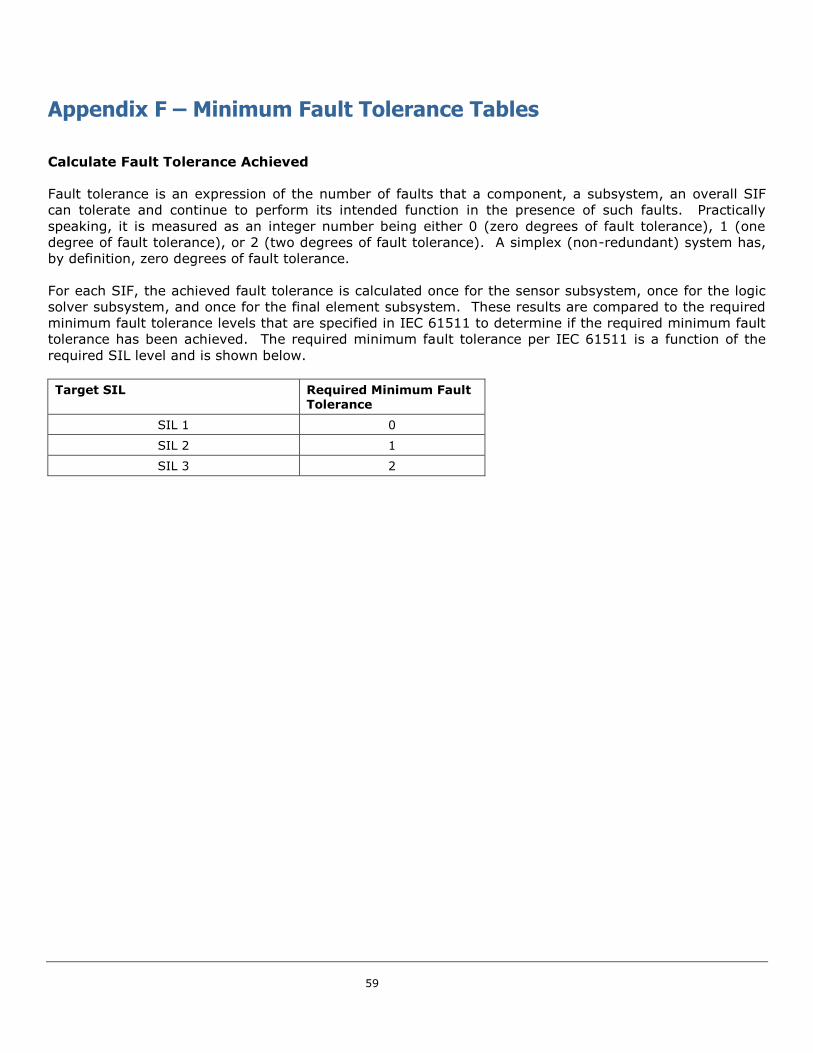
59
Appendix F – Minimum Fault Tolerance Tables
Calculate Fault Tolerance Achieved
Fault tolerance is an expression of the number of faults that a component, a subsystem, an overall SIF
can tolerate and continue to perform its intended function in the presence of such faults. Practically
speaking, it is measured as an integer number being either 0 (zero degrees of fault tolerance), 1 (one
degree of fault tolerance), or 2 (two degrees of fault tolerance). A simplex (non-redundant) system has,
by definition, zero degrees of fault tolerance.
For each SIF, the achieved fault tolerance is calculated once for the sensor subsystem, once for the logic
solver subsystem, and once for the final element subsystem. These results are compared to the required
minimum fault tolerance levels that are specified in IEC 61511 to determine if the required minimum fault
tolerance has been achieved. The required minimum fault tolerance per IEC 61511 is a function of the
required SIL level and is shown below.
Target SIL Required Minimum Fault Tolerance
SIL 1 0
SIL 2 1
SIL 3 2
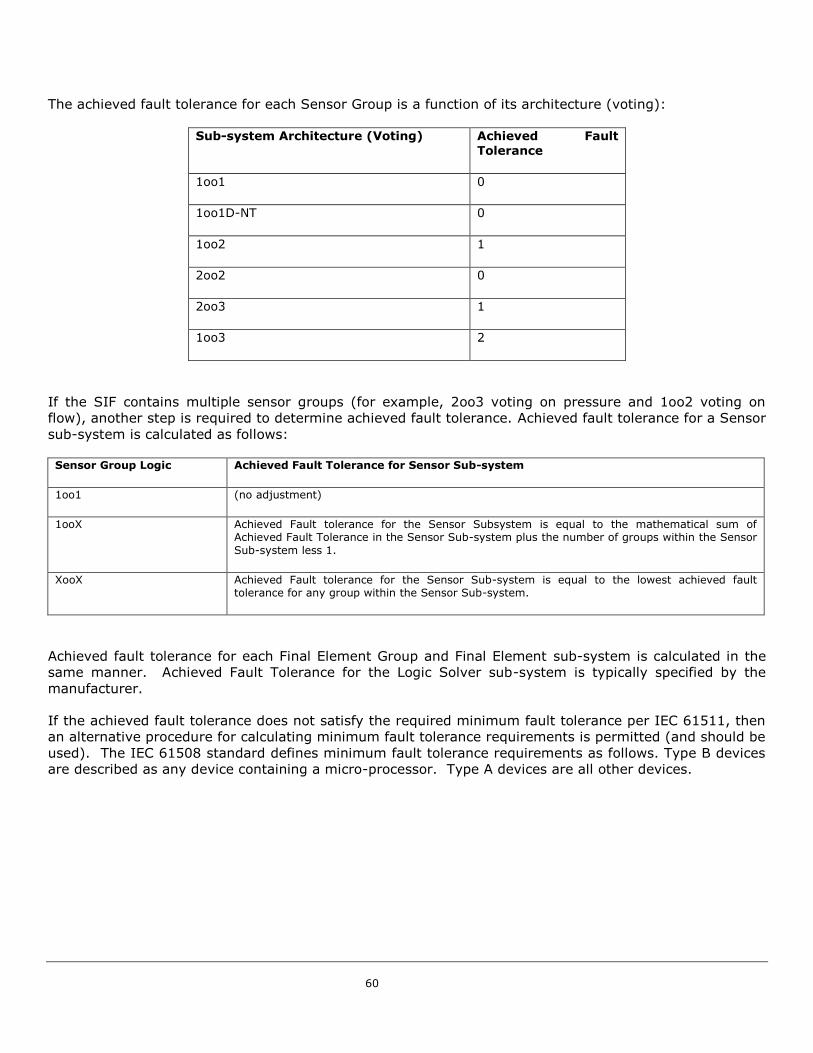
60
The achieved fault tolerance for each Sensor Group is a function of its architecture (voting):
Sub-system Architecture (Voting) Achieved Fault
Tolerance
1oo1 0
1oo1D-NT 0
1oo2 1
2oo2 0
2oo3 1
1oo3 2
If the SIF contains multiple sensor groups (for example, 2oo3 voting on pressure and 1oo2 voting on
flow), another step is required to determine achieved fault tolerance. Achieved fault tolerance for a Sensor
sub-system is calculated as follows:
Sensor Group Logic Achieved Fault Tolerance for Sensor Sub-system
1oo1 (no adjustment)
1ooX Achieved Fault tolerance for the Sensor Subsystem is equal to the mathematical sum of Achieved Fault Tolerance in the Sensor Sub-system plus the number of groups within the Sensor
Sub-system less 1.
XooX Achieved Fault tolerance for the Sensor Sub-system is equal to the lowest achieved fault tolerance for any group within the Sensor Sub-system.
Achieved fault tolerance for each Final Element Group and Final Element sub-system is calculated in the
same manner. Achieved Fault Tolerance for the Logic Solver sub-system is typically specified by the
manufacturer.
If the achieved fault tolerance does not satisfy the required minimum fault tolerance per IEC 61511, then
an alternative procedure for calculating minimum fault tolerance requirements is permitted (and should be
used). The IEC 61508 standard defines minimum fault tolerance requirements as follows. Type B devices
are described as any device containing a micro-processor. Type A devices are all other devices.
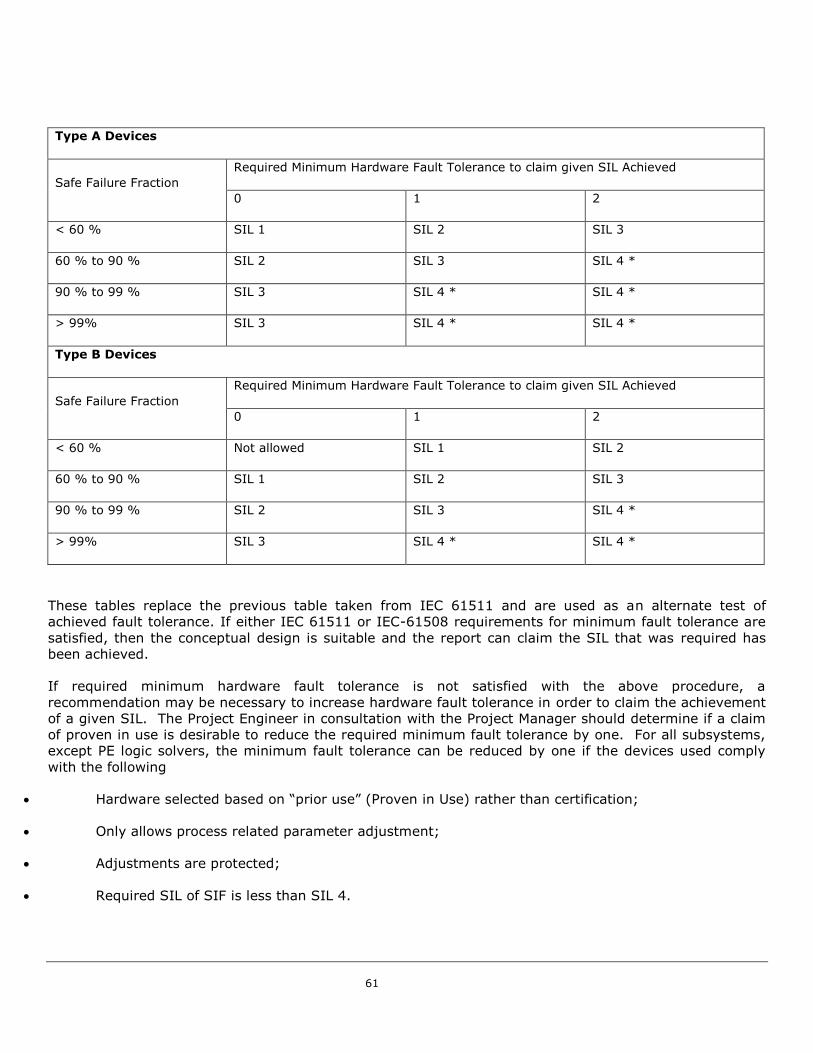
61
Type A Devices
Safe Failure Fraction
Required Minimum Hardware Fault Tolerance to claim given SIL Achieved
0 1 2
< 60 % SIL 1 SIL 2 SIL 3
60 % to 90 % SIL 2 SIL 3 SIL 4 *
90 % to 99 % SIL 3 SIL 4 * SIL 4 *
> 99% SIL 3 SIL 4 * SIL 4 *
Type B Devices
Safe Failure Fraction
Required Minimum Hardware Fault Tolerance to claim given SIL Achieved
0 1 2
< 60 % Not allowed SIL 1 SIL 2
60 % to 90 % SIL 1 SIL 2 SIL 3
90 % to 99 % SIL 2 SIL 3 SIL 4 *
> 99% SIL 3 SIL 4 * SIL 4 *
These tables replace the previous table taken from IEC 61511 and are used as an alternate test of
achieved fault tolerance. If either IEC 61511 or IEC-61508 requirements for minimum fault tolerance are
satisfied, then the conceptual design is suitable and the report can claim the SIL that was required has
been achieved.
If required minimum hardware fault tolerance is not satisfied with the above procedure, a
recommendation may be necessary to increase hardware fault tolerance in order to claim the achievement
of a given SIL. The Project Engineer in consultation with the Project Manager should determine if a claim
of proven in use is desirable to reduce the required minimum fault tolerance by one. For all subsystems,
except PE logic solvers, the minimum fault tolerance can be reduced by one if the devices used comply
with the following
• Hardware selected based on “prior use” (Proven in Use) rather than certification;
• Only allows process related parameter adjustment;
• Adjustments are protected;
• Required SIL of SIF is less than SIL 4.

62
The Project Engineer should use a standard worksheet for gathering information from the specific client to
claim proven in use. The Project Engineer should not claim proven in use based on service history other
than the specific customer for which it is desired to make the claim. The standard worksheet is attached.
For the logic solver subsystem, regardless of achieved PFD all Programmable Electronic (PE) logic solvers
shall be limited to claim no more than SIL 1 unless the vendor has supplied a certification that the system
is capable of SIL 2 or higher performance. This includes single channel as well as redundant (hot standby)
type PE logic solvers. Where achievement of SIL 3 is required, certification shall be per a qualified
independent authority such as TUV.
63
Appendix G –SIS Component Failure Data
This appendix contains typical failure rate data for components that are commonly used in SIS in the
process industries. This is intended to represent “typical” performance of these devices, selected,
installed, and maintained in a way that is appropriate for their process service. The data is based on a
review of a large number of publicly available databases, and numerous confidential data sources from
process industry operating companies. All of the data reflects actual process operation, and no
“predictive” techniques. These values are for informational purposes, and should not be used in
verification calculations unless reviewed against plant operation and historical records of failure rates at a
specific process facility.
The failure characteristics shown in the tables presented below include overall failure rate (all modes of
failure) in terms of failure per hour, the safe failure percentage, safe diagnostic coverage factor [C(S)],
and dangerous coverage factor [C(D)]. It is important to note that the tables provide “Safe Failure
Percentage” not “Safe Failure Fraction”. As discussed in other sections of this book, the Safe Failure
Fraction (as defined in IEC 61511) includes both inherently safe and also diagnosed dangerous failures as
safe. The Safe Failure Percentage is more useful for calculation purposes and includes only those failures
that are inherently safe.
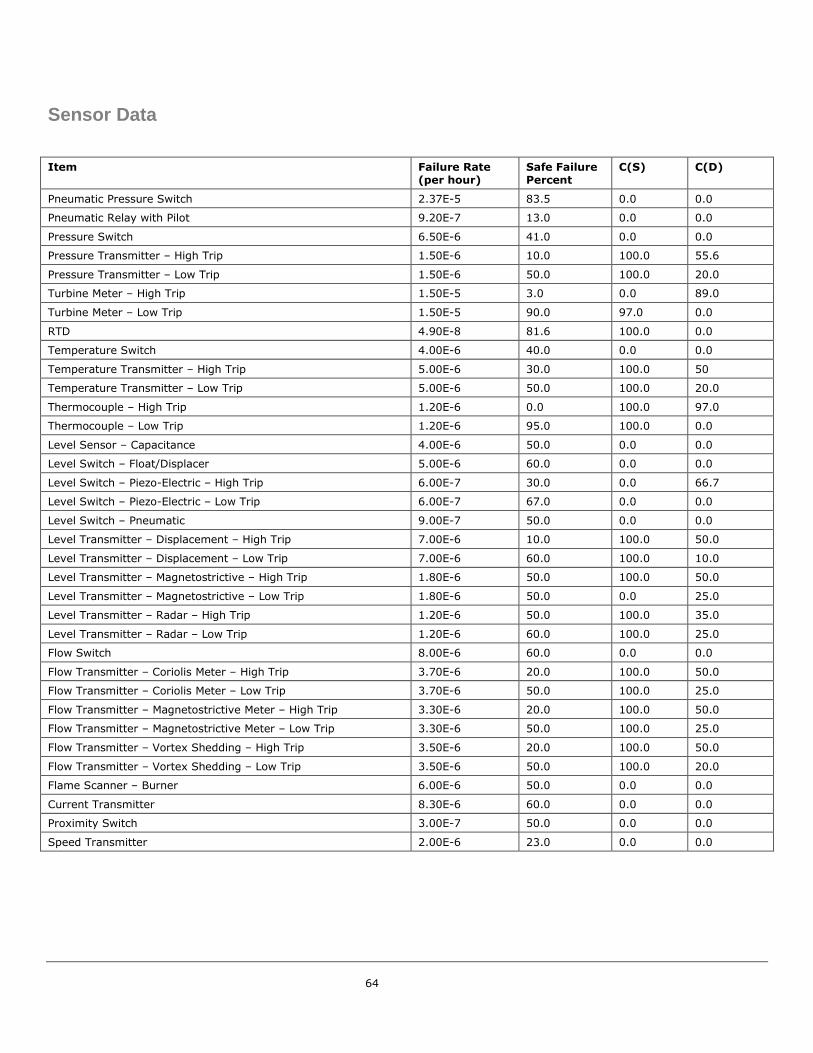
64
Sensor Data
Item Failure Rate (per hour)
Safe Failure Percent
C(S) C(D)
Pneumatic Pressure Switch 2.37E-5 83.5 0.0 0.0
Pneumatic Relay with Pilot 9.20E-7 13.0 0.0 0.0
Pressure Switch 6.50E-6 41.0 0.0 0.0
Pressure Transmitter – High Trip 1.50E-6 10.0 100.0 55.6
Pressure Transmitter – Low Trip 1.50E-6 50.0 100.0 20.0
Turbine Meter – High Trip 1.50E-5 3.0 0.0 89.0
Turbine Meter – Low Trip 1.50E-5 90.0 97.0 0.0
RTD 4.90E-8 81.6 100.0 0.0
Temperature Switch 4.00E-6 40.0 0.0 0.0
Temperature Transmitter – High Trip 5.00E-6 30.0 100.0 50
Temperature Transmitter – Low Trip 5.00E-6 50.0 100.0 20.0
Thermocouple – High Trip 1.20E-6 0.0 100.0 97.0
Thermocouple – Low Trip 1.20E-6 95.0 100.0 0.0
Level Sensor – Capacitance 4.00E-6 50.0 0.0 0.0
Level Switch – Float/Displacer 5.00E-6 60.0 0.0 0.0
Level Switch – Piezo-Electric – High Trip 6.00E-7 30.0 0.0 66.7
Level Switch – Piezo-Electric – Low Trip 6.00E-7 67.0 0.0 0.0
Level Switch – Pneumatic 9.00E-7 50.0 0.0 0.0
Level Transmitter – Displacement – High Trip 7.00E-6 10.0 100.0 50.0
Level Transmitter – Displacement – Low Trip 7.00E-6 60.0 100.0 10.0
Level Transmitter – Magnetostrictive – High Trip 1.80E-6 50.0 100.0 50.0
Level Transmitter – Magnetostrictive – Low Trip 1.80E-6 50.0 0.0 25.0
Level Transmitter – Radar – High Trip 1.20E-6 50.0 100.0 35.0
Level Transmitter – Radar – Low Trip 1.20E-6 60.0 100.0 25.0
Flow Switch 8.00E-6 60.0 0.0 0.0
Flow Transmitter – Coriolis Meter – High Trip 3.70E-6 20.0 100.0 50.0
Flow Transmitter – Coriolis Meter – Low Trip 3.70E-6 50.0 100.0 25.0
Flow Transmitter – Magnetostrictive Meter – High Trip 3.30E-6 20.0 100.0 50.0
Flow Transmitter – Magnetostrictive Meter – Low Trip 3.30E-6 50.0 100.0 25.0
Flow Transmitter – Vortex Shedding – High Trip 3.50E-6 20.0 100.0 50.0
Flow Transmitter – Vortex Shedding – Low Trip 3.50E-6 50.0 100.0 20.0
Flame Scanner – Burner 6.00E-6 50.0 0.0 0.0
Current Transmitter 8.30E-6 60.0 0.0 0.0
Proximity Switch 3.00E-7 50.0 0.0 0.0
Speed Transmitter 2.00E-6 23.0 0.0 0.0
65
Logic Solver Data
** Obtain Data from Equipment Vendor

66
Final Element Interface Data
Item Failure Rate (per hour)
Safe Failure Percent
C(S) C(D)
I/P Transducer 4.00E-6 40.0 0.0 0.0
Interposing Relay 2.00E-7 20.0 0.0 0.0
Pneumatic Regulator 3.00E-6 80.0 0.0 0.0
Solenoid Valve – 2-Way – Deenergize to Trip 4.00E-6 60.0 0.0 0.0
Solenoid Valve – 3-Way – Deenergize to Trip 2.00E-6 60.0 0.0 0.0
Solenoid Valve – 3-Way – Energize to Trip 1.00E-5 20.0 0.0 91.0
Final Element Data
Item Failure Rate (per hour)
Safe Failure Percent‡
C(S) C(D)
Air Operated Ball Valve 3.00E-6 60.0 0.0 0.0
Air Operated Butterfly Valve 3.00E-6 55.0 0.0 0.0
Air Operated Gate Valve 2.00E-6 40.0 0.0 0.0
Air Operated Globe Valve 2.50E-6 55.0 0.0 0.0
Hydraulic Operated Ball Valve 3.00E-6 55.0 0.0 0.0
Hydraulic Operated Slide Valve 5.00E-6 50.0 0.0 0.0
Motor Operated Valve 5.00E-6 10.0 0.0 0.0
Motor Starter Circuit/Contactor 1.50E-6 80.0 0.0 0.0
Stack Damper (Fired Heaters) 6.00E-6 55.0 0.0 0.0
Trip and Throttle Valve 3.80E-6 39.0 0.0 0.0
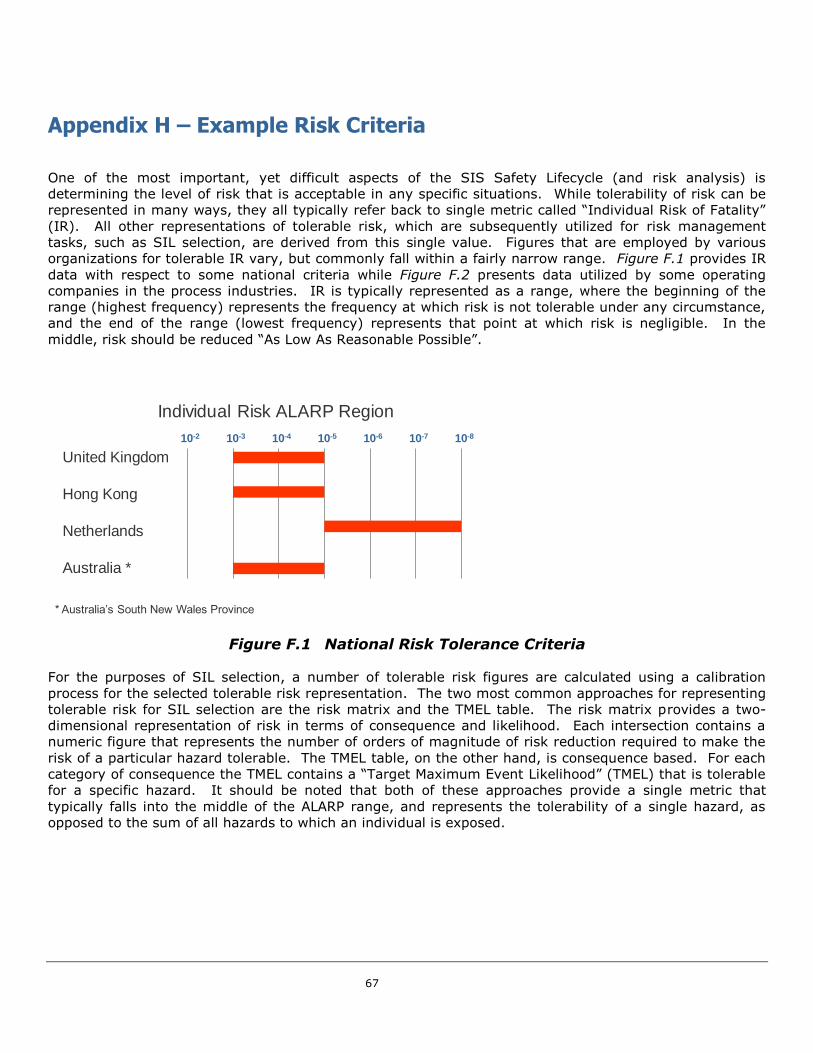
67
Appendix H – Example Risk Criteria
One of the most important, yet difficult aspects of the SIS Safety Lifecycle (and risk analysis) is
determining the level of risk that is acceptable in any specific situations. While tolerability of risk can be
represented in many ways, they all typically refer back to single metric called “Individual Risk of Fatality”
(IR). All other representations of tolerable risk, which are subsequently utilized for risk management
tasks, such as SIL selection, are derived from this single value. Figures that are employed by various
organizations for tolerable IR vary, but commonly fall within a fairly narrow range. Figure F.1 provides IR
data with respect to some national criteria while Figure F.2 presents data utilized by some operating
companies in the process industries. IR is typically represented as a range, where the beginning of the
range (highest frequency) represents the frequency at which risk is not tolerable under any circumstance,
and the end of the range (lowest frequency) represents that point at which risk is negligible. In the
middle, risk should be reduced “As Low As Reasonable Possible”.
United Kingdom
Hong Kong
Netherlands
Australia *
* Australia’s South New Wales Province
10-2 10-3 10-4 10-5 10-6 10-7 10-8
Individual Risk ALARP Region
Figure F.1 National Risk Tolerance Criteria
For the purposes of SIL selection, a number of tolerable risk figures are calculated using a calibration
process for the selected tolerable risk representation. The two most common approaches for representing
tolerable risk for SIL selection are the risk matrix and the TMEL table. The risk matrix provides a two-
dimensional representation of risk in terms of consequence and likelihood. Each intersection contains a
numeric figure that represents the number of orders of magnitude of risk reduction required to make the
risk of a particular hazard tolerable. The TMEL table, on the other hand, is consequence based. For each
category of consequence the TMEL contains a “Target Maximum Event Likelihood” (TMEL) that is tolerable
for a specific hazard. It should be noted that both of these approaches provide a single metric that
typically falls into the middle of the ALARP range, and represents the tolerability of a single hazard, as
opposed to the sum of all hazards to which an individual is exposed.
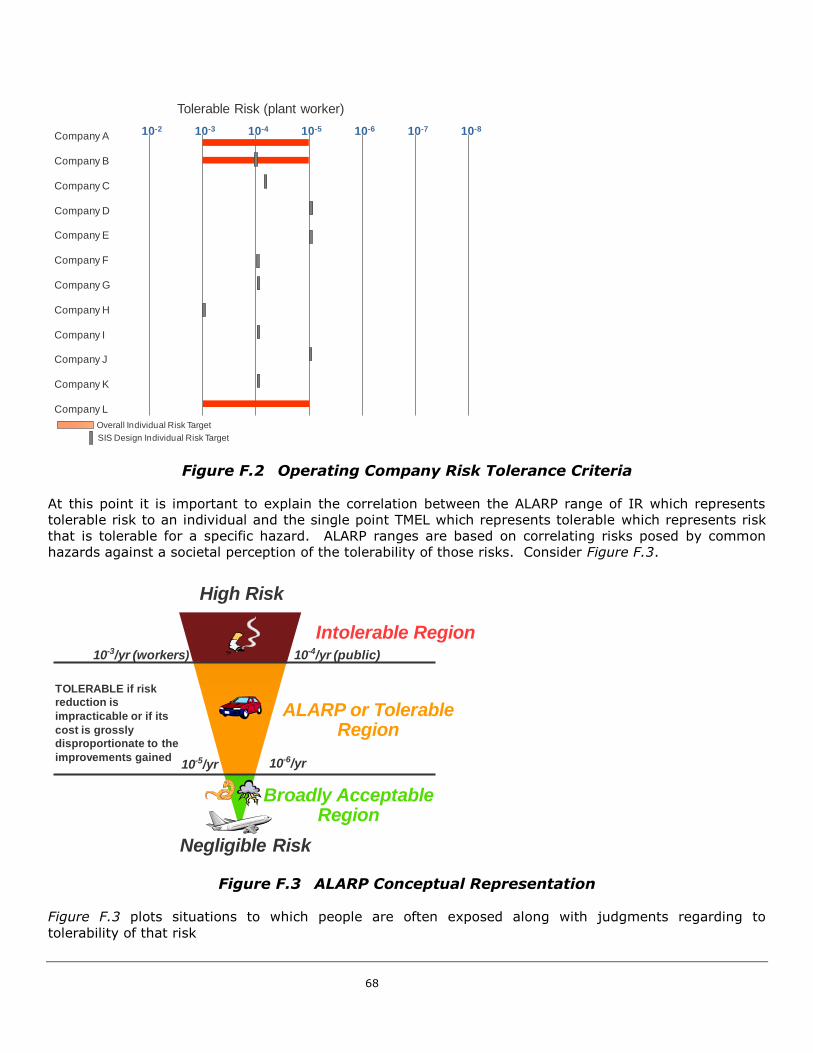
68
Company A
Company B
Company C
Company D
Company E
Company F
Company G
Company H
Company I
Company J
Company K
Company L
10-2 10-3 10-4 10-5 10-6 10-7 10-8
Tolerable Risk (plant worker)
Overall Individual Risk Target
SIS Design Individual Risk Target
Figure F.2 Operating Company Risk Tolerance Criteria
At this point it is important to explain the correlation between the ALARP range of IR which represents
tolerable risk to an individual and the single point TMEL which represents tolerable which represents risk
that is tolerable for a specific hazard. ALARP ranges are based on correlating risks posed by common
hazards against a societal perception of the tolerability of those risks. Consider Figure F.3.
Negligible Risk
High Risk
10-3/yr (workers) 10-4/yr (public)
10-6/yr
Intolerable Region
ALARP or Tolerable Region
Broadly Acceptable Region
TOLERABLE if risk
reduction is
impracticable or if its
cost is grossly
disproportionate to the
improvements gained10-5/yr
Figure F.3 ALARP Conceptual Representation
Figure F.3 plots situations to which people are often exposed along with judgments regarding to
tolerability of that risk

69
While the ALARP range is an excellent tool for representation of tolerable risk, it cannot be directly applied
to SIS engineering or other engineer tasks for two reasons. First, ALARP is a range, when engineering
necessarily requires a single point as a design target. Second, ALARP represents IR, which is considers
the sum of all risks to which a single individual is exposed, whereas SIS engineering requires a target for
prevention of a single hazard to which many people are exposed, but not continually.
The first step in converting ALARP to TMEL is fairly straightforward, converting the range to a single point.
Conservatism and prudence typically result in the selection of the middle of the range as the target point.
The high frequency end of the range is not conservative enough while the low frequency end of the range
will require significant additional spending on risk reduction measures. In the case of Figure F.3, this will
result in a figure of 1x10⁻⁴ per year.
The second step is complex and esoteric, but after the effort required to understand the conversion, no
effort is actually require to modify the figures. Individual risk applies to the sum of all risks to which a
specific individual is exposed, whereas TMEL defines that tolerability of a specific incident. In order to
correlate the two, one needs to consider that an individual is exposed to multiple hazards simultaneously
at all times, but not exposed to any specific hazards for a significantly long duration. In general, these
two factors tend to cancel each other out. It can be speculated that at any point in time a worker might
be exposed to ten different hazards that are protected against by SIS. Also, that same worker is only at
work about 25% of his calendar year, thus being exposed to any specific hazard (as the worker will
continually change location throughout the work day) for a shorter duration. As a result, the selected IR
target figure is typically used directly as the TMEL figure for an event which is expected to result in a
fatality.
Once the TMEL target has been selected, one is required to use this figure to calibrate tables and matrices
that are used for subsequent engineering tasks. In the following figures, typical risk tolerance criteria will
be developed using a scenario-based fatality TMEL of 1x10⁻⁵ per year. The first step is a set up a table
that defines categories of consequence and assign TMEL targets for each category. The table is presented
in Figure F.4. The “anchor point” of the table is severity rating 4 which represents a single fatality. For
this row, the TMEL value of 1x10⁻⁵ can be used directly. The TMEL targets for the rows above and below
are decreased and increased by an order of magnitude, respectively, based on the establishment of
categories that are one order of magnitude changes in consequence severity.
S Category Long Description TMEL-S
0 None No significant safety consequence N/A
1 Very Low Minor injury - first aid 1E-02
2 Low Lost time injury not requiring extended hospitalization 1E-03
3 Moderate Severe injury (extended hospitalization, dismemberment) 1E-04
4 High Single fatality 1E-05
5 Very High Multiple fatalities 1E-06
Figure F.4 Safety Consequence Category Table
The table in Figure F.4 is based on safety consequences only. In many cases it is important to consider
other types of losses, such as commercial losses and environmental damage. In order to do so, each type
of consequence should have a column where an equivalent loss is described. In order to do so, one must
make decisions about equivalency of different loss type. For instance, what financial value of commercial
loss is equivalent to one fatality? Based on US litigation settlement averages at the time of the writing of
this book, a major process company can expect to settle a third party wrongful death lawsuit for about
$50 million depending on the circumstances surrounding the incident. As such, $50 million can be placed
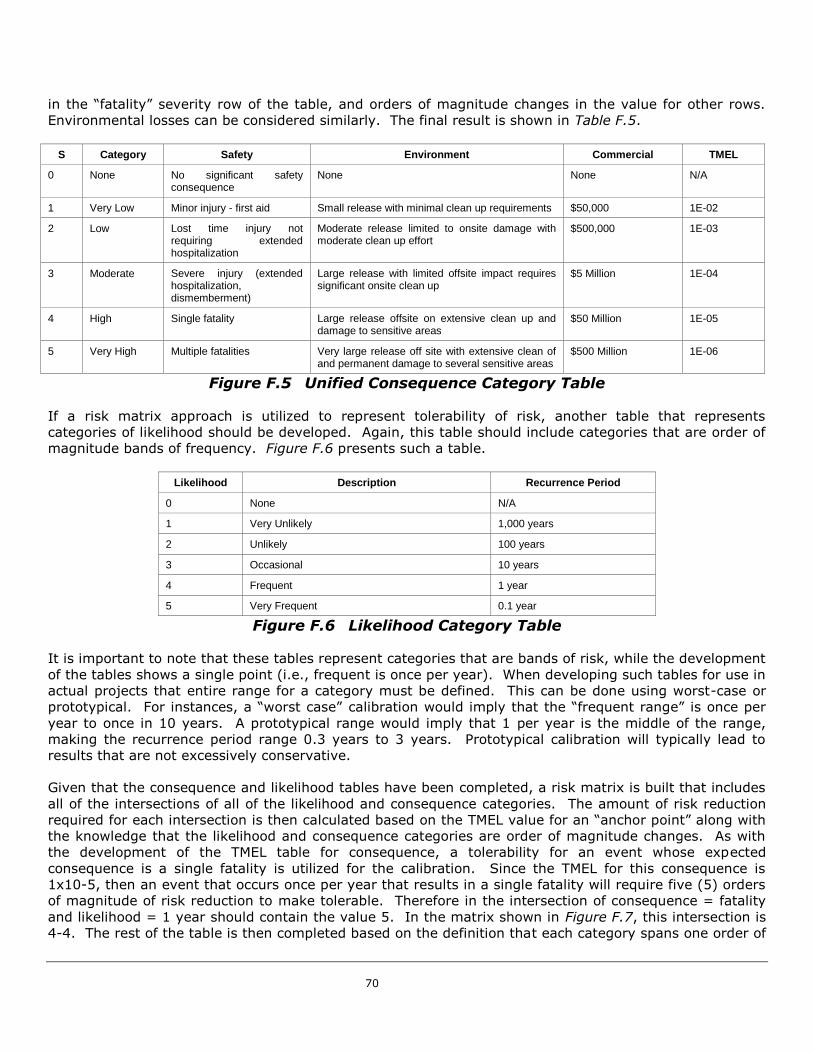
70
in the “fatality” severity row of the table, and orders of magnitude changes in the value for other rows.
Environmental losses can be considered similarly. The final result is shown in Table F.5.
S Category Safety Environment Commercial TMEL
0 None No significant safety consequence
None None N/A
1 Very Low Minor injury - first aid Small release with minimal clean up requirements $50,000 1E-02
2 Low Lost time injury not requiring extended hospitalization
Moderate release limited to onsite damage with moderate clean up effort
$500,000 1E-03
3 Moderate Severe injury (extended hospitalization, dismemberment)
Large release with limited offsite impact requires significant onsite clean up
$5 Million 1E-04
4 High Single fatality Large release offsite on extensive clean up and damage to sensitive areas
$50 Million 1E-05
5 Very High Multiple fatalities Very large release off site with extensive clean of and permanent damage to several sensitive areas
$500 Million 1E-06
Figure F.5 Unified Consequence Category Table
If a risk matrix approach is utilized to represent tolerability of risk, another table that represents
categories of likelihood should be developed. Again, this table should include categories that are order of
magnitude bands of frequency. Figure F.6 presents such a table.
Likelihood Description Recurrence Period
0 None N/A
1 Very Unlikely 1,000 years
2 Unlikely 100 years
3 Occasional 10 years
4 Frequent 1 year
5 Very Frequent 0.1 year
Figure F.6 Likelihood Category Table
It is important to note that these tables represent categories that are bands of risk, while the development
of the tables shows a single point (i.e., frequent is once per year). When developing such tables for use in
actual projects that entire range for a category must be defined. This can be done using worst-case or
prototypical. For instances, a “worst case” calibration would imply that the “frequent range” is once per
year to once in 10 years. A prototypical range would imply that 1 per year is the middle of the range,
making the recurrence period range 0.3 years to 3 years. Prototypical calibration will typically lead to
results that are not excessively conservative.
Given that the consequence and likelihood tables have been completed, a risk matrix is built that includes
all of the intersections of all of the likelihood and consequence categories. The amount of risk reduction
required for each intersection is then calculated based on the TMEL value for an “anchor point” along with
the knowledge that the likelihood and consequence categories are order of magnitude changes. As with
the development of the TMEL table for consequence, a tolerability for an event whose expected
consequence is a single fatality is utilized for the calibration. Since the TMEL for this consequence is
1x10⁻⁵, then an event that occurs once per year that results in a single fatality will require five (5) orders
of magnitude of risk reduction to make tolerable. Therefore in the intersection of consequence = fatality
and likelihood = 1 year should contain the value 5. In the matrix shown in Figure F.7, this intersection is
4-4. The rest of the table is then completed based on the definition that each category spans one order of
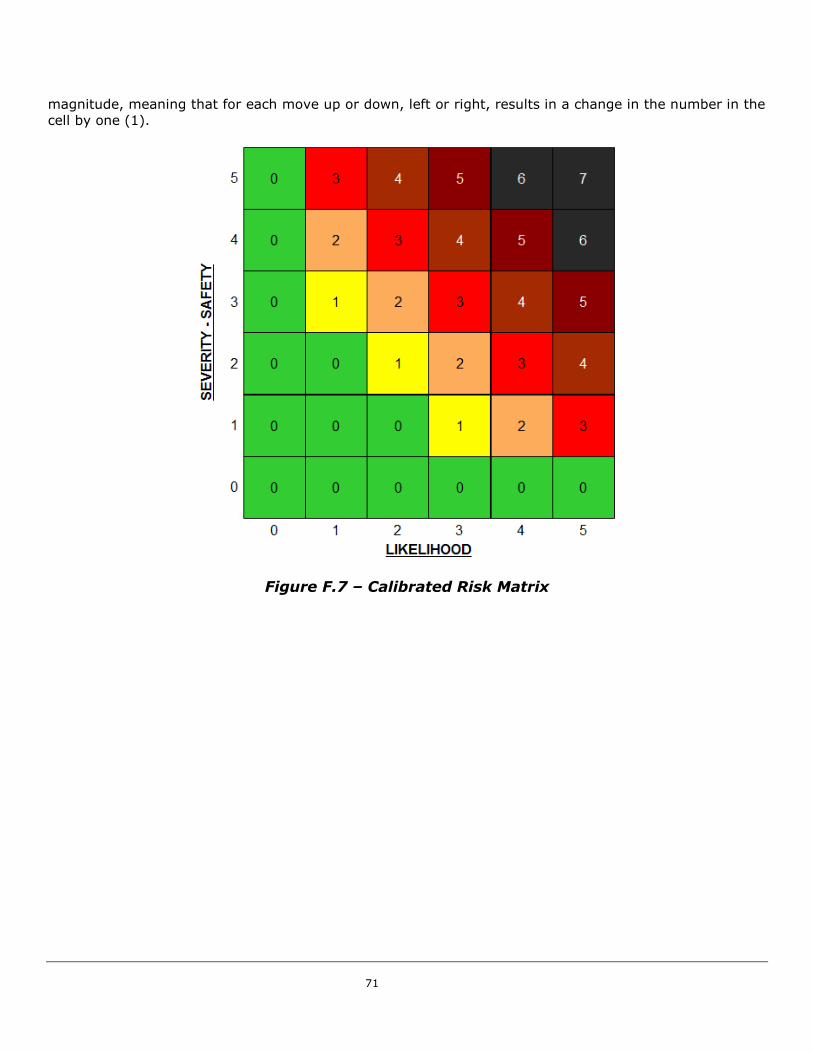
71
magnitude, meaning that for each move up or down, left or right, results in a change in the number in the
cell by one (1).
Figure F.7 – Calibrated Risk Matrix

72
Appendix I – References
“Functional Safety: Safety Instrumented Systems for the Process Industry Sector,” ANSI/ISA-84.00.01-
2004 (IEC 61511-1:Mod), Instrumenation Systems and Automation Society, Research Triangle
Park, NC, 2004.
"Functional Safety: Safety Instrumented Systems for the Process Industry Sector," IEC 61511-1,
International Electrotechnical Commission, Final Standard, 2003.
"Functional safety of electrical/ electronic/ programmable electronic safety related systems," IEC 61508,
International Electrotechnical Commission, Final Standard, December 1999.
“Safety Instrumented Functions (SIF) – Safety Integrity Level (SIL) Evaluation Techniques,” ISA-
TR84.00.02-2002, Instrumenation Systems and Automation Society, Research Triangle Park, NC,
2002.
“The Application of ANSI/ISA 84.00.012004 Parts 1-3 (IEC 61511 Parts 1-3 Modified) for Safety
Instrumented Functions (SIFs) in Fire, Combustible Gas, & Toxic Gas Systems,” ISA-TR84.00.07,
Instrumenation Systems and Automation Society, Research Triangle Park, NC, December 2009.
Marszal, Edward and Scharpf, Eric. Safety Integrity Level Selection with Layer of Protection Analysis.
Instrumentation Systems and Automation Society, Research Triangle Park, NC, 2002.
“Petroleum Refinery Process Safety Management National Emphasis Program,” Occupational Safety and
Health Administration (OSHA), Washington DC, 2007.
Risk Management Program Guidance for Offsite Consequence Analysis. Environmental Protection Agency,
Washington DC, 1996.
Smith, David J. Reliability Maintainability and Risk. Butterworth-Heinemann, London, UK. (2007).
Lees, F.P., Loss prevention in the process industry, Butterworth-Heinemann, London, UK. (1980).
Nonelectronic Parts Reliability Data. Reliability Analysis Center, Rome, NY, 1995.
OREDA-84: Offshore Reliability Data handbook, 1st edition, PennWell Publishing Company and distributed
by DNV Technia, contact Andy Wolford, at DNV Technia, 16340 park Ten Place, Suite 100 Houston,
TX 7784, phone 713-647-4225, FAX 713-647-2858.
Guidelines for Process Equipment Reliability Data, with Data Tables. Center for Chemical Process Safety
(CCPS), American Institute of Chemical Engineers (AIChE), New York, NY, 1989.
Layer of Protection Analysis, Simplified Process Risk Assesment. Center for Chemical Process Safety
(CCPS), American Institute of Chemical Engineers (AIChE), New York, NY, 2001.