KENANGA GLOBAL OPPORTUNITIES FUND (FORMERLY …...KENANGA GLOBAL OPPORTUNITIES FUND (FORMERLY KNOWN...
38
KENANGA GLOBAL OPPORTUNITIES FUND (FORMERLY KNOWN AS ING GLOBAL OPPORTUNITIES) ANNUAL REPORT For the Financial Year Ended 28 February 2014 Kenanga Investors Berhad (353563-P)
Transcript of KENANGA GLOBAL OPPORTUNITIES FUND (FORMERLY …...KENANGA GLOBAL OPPORTUNITIES FUND (FORMERLY KNOWN...
KENANGA GLOBAL OPPORTUNITIES FUND(FORMERLY KNOWN AS ING GLOBAL OPPORTUNITIES)
ANNUAL REPORT
For the Financial Year Ended 28 February 2014
Investor Services CenterToll Free Line: 1 800 88 3737Fax: +603 2057 3722Email: [email protected]
Head Office, Kuala LumpurSuite 12.02, 12th Floor, Kenanga International, Jalan Sultan Ismail, 50250 Kuala Lumpur, Malaysia.Tel: 03-2057 3688 Fax: 03-2161 8807
Kenanga Investors Berhad (353563-P)

KENANGA GLOBAL OPPORTUNITIES FUND(FORMERLY KNOWN AS ING GLOBAL OPPORTUNITIES)
Contents Page
Corporate Directory iiDirectory of Manager’s Offices iiiFund Information 1Manager’s Report 2-4Fund Performance 5-7Trustee’s Report 8Independent Auditor’s Report 9-10Statement by the Manager 11Financial Statement 12-31

ii Kenanga Global Opportunities Fund Annual Report
CORPORATE DIRECTORY
Manager: Kenanga Investors Berhad (Company No. 353563-P)Registered office
Kenanga Investors Berhad (KIB)8th Floor, Kenanga International, Jalan Sultan Ismail,50250 Kuala Lumpur, Malaysia.Tel: 03-2162 1490 Fax: 03-2161 4990
Business OfficeSuite 12.02, 12th Floor, Kenanga International, Jalan Sultan Ismail, 50250 Kuala Lumpur, Malaysia.Tel: 03-2057 3688 Fax: 03-2161 8807E-mail: [email protected] Website: www.KenangaInvestors.com.my
Board Of DirectorsDatuk Syed Ahmad Alwee Alsree (Chairman)Syed Zafilen Syed Alwee (Independent Director)YM Raja Dato’ Seri Abdul Aziz bin Raja Salim (Independent Director)Vivek Sharma (Independent Director)Peter John Rayner (Independent Director)Bruce Kho Yaw HuatAbdul Razak bin Ahmad
Investment Committee Bruce Kho Yaw Huat (Chairman) Syed Zafilen Syed Alwee (Independent Member)Vivek Sharma (Independent Member)Peter John Rayner (Independent Member)Abdul Razak bin Ahmad
Company Secretary: Norliza Abd Samad (MAICSA 7011089)9th Floor, Kenanga International, Jalan Sultan Ismail, 50250 Kuala Lumpur, Malaysia.Tel: 03-2162 1490 Fax:03-2161 4990
Trustee: CIMB Commerce Trustee Berhad (Company No. 167913 M)Registered Office
Level 13, Menara CIMBJalan Stesen Sentral 2Kuala Lumpur Sentral50490 Kuala Lumpur.Tel: 03-2261 8888Fax: 03-2261 0099Website: www.cimb.com
Business Office Level 21, Menara CIMBJalan Stesen Sentral 2Kuala Lumpur Sentral50490 Kuala Lumpur.Tel: 03-2261 8888Fax: 03-2261 9889
Auditor: Ernst & Young (AF: 0039)Level 23A, Menara Milenium, Jalan Damanlela, Pusat Bandar Damansara, 50490 Kuala Lumpur.Tel: 03-7495 8000 Fax: 03-2095 5332
Tax Adviser: Ernst & Young Tax Consultants Sdn Bhd (Company No. 179793-K)Level 23A, Menara Milenium, Jalan Damanlela, Pusat Bandar Damansara, 50490 Kuala Lumpur.Tel: 03-7495 8000 Fax: 03-2095 5332
Membership: Federation Of Investment Managers Malaysia (FIMM)19-06-1, 6th Floor, PNB Damansara, 19, Lorong Dungun, Damansara Heights, 50490 Kuala Lumpur, Malaysia. Tel: 03-2093 2600 Fax: 03-2093 2700 Website: www.fimm.com.my

Kenanga Global Opportunities Fund Annual Report iii
DIRECTORY OF MANAGER’S OFFICES
REGIONAL BRANCH OFFICES:
Kuala LumpurSuite 12.02, 12th Floor, Kenanga InternationalJalan Sultan Ismail,50250 Kuala Lumpur, MalaysiaTel: 03-2057 3688Fax: 03-2161 8807
Johor BahruLot 11.03, 11th Floor, Menara MSC Cyberport5 Jalan Bukit Meldrum80300 Johor Bahru, JohorTel: 07-223 7505/4798 Fax: 07-223 4802
MelakaNo. 25-1 Jalan Kota Laksamana 2/17Taman Kota Laksamana Seksyen 275200 MelakaTel: 06-281 8913, 282 0518 Fax: 06-281 4286
Kuching1st Floor, No 71, Lot 7Lot 10900, Jalan Tun Jugah93350 Kuching, SarawakTel: 082-572 228 Fax: 082-572 229
KlangNo. 12 Jalan Batai Laut 3, Taman Intan41300 Klang, Selangor Darul EhsanTel:03-3341 8818, 3348 7889 Fax:03-3341 8816
Kota KinabaluA-03-11, 3rd FloorBlock A Warisan SquareJalan Tun Fuad Stephens88000 Kota Kinabalu, SabahTel: 088-447 089/448 106 Fax: 088-447 039
PenangBlok A, Aras 3,Wisma PerkesoNo. 269, Jalan Burma10538 George Town, PenangTel: 04-226 4880 Fax: 04-226 5120
IpohNo. 5A, Persiaran Greentown 9Greentown Business Centre30450 Ipoh,Perak Darul RidzuanTel: 05-254 7573/7570 Fax: 05-254 7606
Agency OfficeMiri (Sarawak)c/o Lot 1084, 2nd Floor,Jalan Merpati98000 MiriSarawak, MalaysiaTel: 085-427 782


Kenanga Global Opportunities Fund Annual Report 1
1. FUND INFORMATION
1.1 Fund Name
Kenanga Global Opportunities Fund (KGOPF or the Fund) (formerly known as ING Global Opportunities)
1.2 Fund Type / Category
Feeder / Growth
1.3 Investment Objective
The Fund aims to achieve capital growth by investing, via a target fund, in a diversified portfolio of global equities that are likely to yield higher earnings growth than the global average.
1.4 Investment Strategy
The Fund will invest a minimum of 95% of its NAV in ING (L) Invest Global Opportunities (IIGO) denominated in Euro, domiciled in Luxembourg. The remaining will be invested in liquid assets including money market instruments and deposits with licensed financial institutions.
1.5 Duration
The Fund was launched on 21 June 2010 and it shall exist as long as it appears to the Manager and the Trustee that it is in the interests of the unit holders for it to continue.
1.6 Performance Benchmark
MSCI World AC Index
1.7 Distribution Policy
Income (if any) will be distributed annually on the best effort basis.
1.8 Breakdown of unit holdings of KGOPF as at 28 February 2014
Size of holdings No. of unitholders No. of units held5,000 and below 0 05,001 - 10,000 4 33,39910,001-50,000 11 220,28850,001-500,000 4 467,987500,001 and above 2 1,235,518Total 21 1,957,192

2 Kenanga Global Opportunities Fund Annual Report
2. MANAGER’S REPORT
2.1 Explanation on whether the Fund has achieved its investment objective.
For the period under review, the Fund fulfilled its investment objective, having invested in ING (L) Invest Global Opportunities (“Target Fund”) with a diversified portfolio of global equities that are likely to yield higher earnings growth than the global average.
2.2 Comparison between the Fund’s performance and performance of the benchmark
Performance Chart Since Launch (21/06/2010– 28/02/2014)Kenanga Global Opportunities Fund vs MSCI World AC Index
% Growth, Cum, TR, ExD, MYR From Launch to 28/2/2014
-10.00
-20.00
0.00
10.00
20.00
30.00
40.00
50.00
30/6
/201
0
30/9
/201
0
31/1
2/20
10
30/6
/201
1
30/9
/201
1
31/1
2/20
11
31/3
/201
1
30/6
/201
2
30/9
/201
2
31/1
2/20
12
31/3
/201
2
30/6
/201
3
30/9
/201
3
31/1
2/20
13
28/2
/201
4
31/3
/201
3
Kenanga Global Opportunities : 17.04 MSCI AC World CR USD : 46.23
Source: Lipper
2.3 Investment strategies and policies employed during the period under review
For the period under review, the Fund’s investment strategy and policy were to invest nearly all its assets into the Target Fund and the remaining in liquid assets. The strategy employed was in line with that disclosed in the prospectus.
2.4 The Fund’s asset allocation (% of NAV) as at 28 February 2014 and comparison with the previous financial year
Asset 28 Feb 2014 28 Feb 2013Collective investment scheme - foreign 96.5% 96.8%Short term deposits and cash 3.5% 3.2%
Reason for the differences in asset allocation
The difference in asset allocation is due to fluctuations in the value of the Target Fund.
Kenanga Global Opportunities Fund Annual Report 3
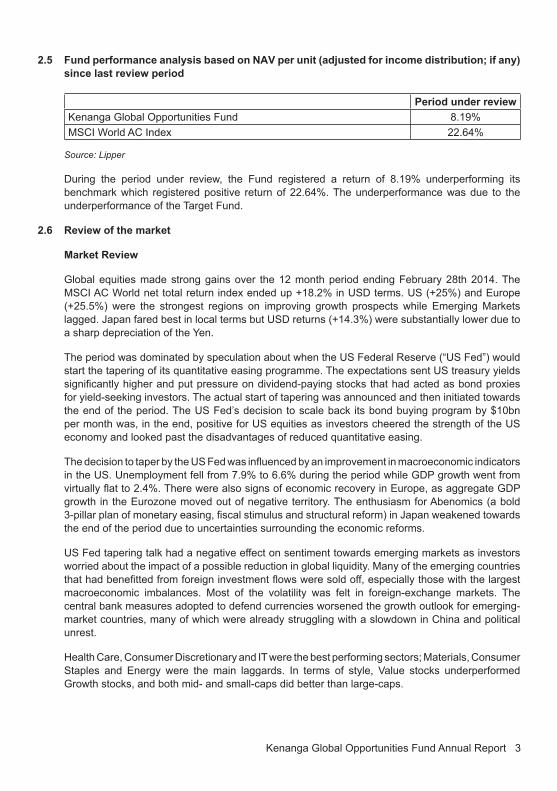
2.5 Fund performance analysis based on NAV per unit (adjusted for income distribution; if any) since last review period
Period under reviewKenanga Global Opportunities Fund 8.19%MSCI World AC Index 22.64%
Source: Lipper
During the period under review, the Fund registered a return of 8.19% underperforming its benchmark which registered positive return of 22.64%. The underperformance was due to the underperformance of the Target Fund.
2.6 Review of the market
Market Review
Global equities made strong gains over the 12 month period ending February 28th 2014. The MSCI AC World net total return index ended up +18.2% in USD terms. US (+25%) and Europe (+25.5%) were the strongest regions on improving growth prospects while Emerging Markets lagged. Japan fared best in local terms but USD returns (+14.3%) were substantially lower due to a sharp depreciation of the Yen.
The period was dominated by speculation about when the US Federal Reserve (“US Fed”) would start the tapering of its quantitative easing programme. The expectations sent US treasury yields significantly higher and put pressure on dividend-paying stocks that had acted as bond proxies for yield-seeking investors. The actual start of tapering was announced and then initiated towards the end of the period. The US Fed’s decision to scale back its bond buying program by $10bn per month was, in the end, positive for US equities as investors cheered the strength of the US economy and looked past the disadvantages of reduced quantitative easing.
The decision to taper by the US Fed was influenced by an improvement in macroeconomic indicators in the US. Unemployment fell from 7.9% to 6.6% during the period while GDP growth went from virtually flat to 2.4%. There were also signs of economic recovery in Europe, as aggregate GDP growth in the Eurozone moved out of negative territory. The enthusiasm for Abenomics (a bold 3-pillar plan of monetary easing, fiscal stimulus and structural reform) in Japan weakened towards the end of the period due to uncertainties surrounding the economic reforms.
US Fed tapering talk had a negative effect on sentiment towards emerging markets as investors worried about the impact of a possible reduction in global liquidity. Many of the emerging countries that had benefitted from foreign investment flows were sold off, especially those with the largest macroeconomic imbalances. Most of the volatility was felt in foreign-exchange markets. The central bank measures adopted to defend currencies worsened the growth outlook for emerging-market countries, many of which were already struggling with a slowdown in China and political unrest.
Health Care, Consumer Discretionary and IT were the best performing sectors; Materials, Consumer Staples and Energy were the main laggards. In terms of style, Value stocks underperformed Growth stocks, and both mid- and small-caps did better than large-caps.

4 Kenanga Global Opportunities Fund Annual Report
2.6 Review of the market (Contd.)
Market Outlook
Despite the fact that the US Fed has started to taper monetary actions of the central banks still are important for equities. The US is still easing, Japan is involved in massive quantitative easing and we expect that Europe will follow suit. In our opinion longer term structural trends are the most important factors that determine the success of a company going forward. We are however aware that in the short term money flows can be the dominant factor determining equity prices. We are therefore hesitant at this moment in time to increase our holdings in emerging markets and wait for more progress on structural imbalances. In the mean time we see that China is committed to change the economy from an export led to a domestic led economy. The change however will take time.
Meanwhile in India hopes are growing that BJP prime ministerial candidate Narendi Modi can win the general elections in May 2014. If so business confidence will rise dramatically and will be very favourable for the Indian stock market. We expect GDP growth rates in emerging markets to stay higher than in developed markets for the foreseeable future.
2.7 Income Distribution
For the financial year under review, the Fund did not declare any income distribution.
2.8 Details of any unit split exercise
The Fund did not carry out any unit split exercise during the financial year under review.
2.9 Significant changes in the state of affair of the Fund during the period
Pursuant to the acquisition of ING Funds Berhad by Kenanga Investors Berhad on 19th April 2013, Kenanga Investors Berhad had written to the Securities Commission to seek the Securities Commission’s approval to become the Management Company of the Fund.
The Securities Commission had approved the application. With effect from 8th June 2013, Kenanga Investors Berhad has become the Management Company of the Fund.
2.10 Circumstances that materially affect any interests of the unitholders
During the period under review, there are no circumstances that materially affect any interests of the unitholders. However, there was a change in the Management Company of the Fund on 8th June 2013 as detailed in 2.9.
2.11 Rebates & Soft commissions
Any rebates received are channeled back to the Fund. On the other hand, soft commissions received from the stockbrokers for goods and services such as technical analysis software, fundamental database, financial wire services, stock quotation system and portfolio management software incidental to investment management of the Fund shall be retained by the Manager. For the period under review, the Manager did not receive any rebates or soft commissions from stockbrokers.

Kenanga Global Opportunities Fund Annual Report 5
3. FUND PERFORMANCE
3.1 Details of portfolio composition of Kenanga Global Opportunities Fund (“the Fund”) as at 28/29 February for the last 3 financial years are as follows:
a. Distribution among industry sectors and category of investments:
FY FY FY2014 2013 2012
% % %
Collective investment scheme - foreign 96.5 96.8 95.9Short term deposits and cash 3.5 3.2 4.1
100.0 100.0 100.0
Note: The above mentioned percentages are based on total investment market value plus cash.
b. Distribution among markets
As at 28 February 2014, the target fund ING (L) Invest Global Opportunities has invested in the following markets:
38.90%18.33%
11.51%6.10%5.99%
4.73%4.43%4.34%
3.02%2.64%
United StatesOthers
United KingdomNetherlands
JapanSwitzerland
CanadaFrance
Hong KongIndonesia
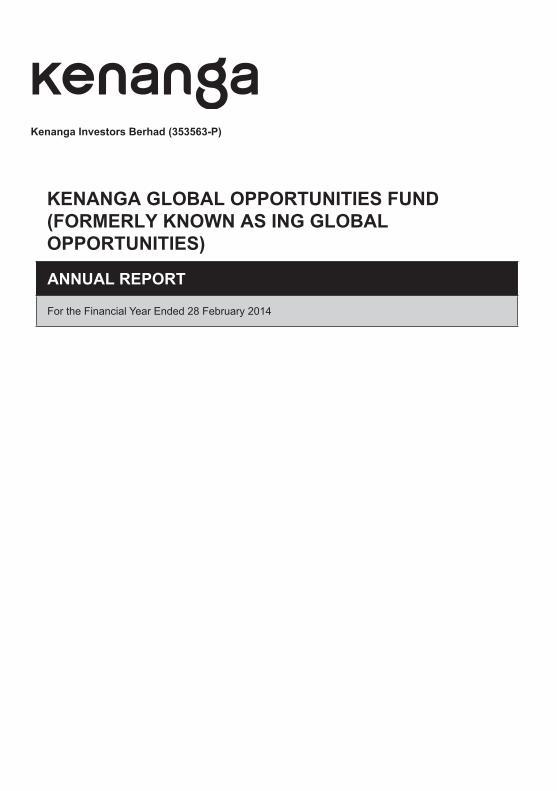
c. Distribution among industry sectors
As at 28 February 2014, the target fund ING (L) Invest Global Opportunities has invested in the following industry sectors.
19.04%17.78%
16.72%12.48%
10.11%8.66%
8.34%5.34%
0.84%0.69%
ITHealth Care
FinancialsConsumer Discretionary
Consumer StaplesEnergy
MaterialsIndustrials
UtilitiesTelecoms
6 Kenanga Global Opportunities Fund Annual Report
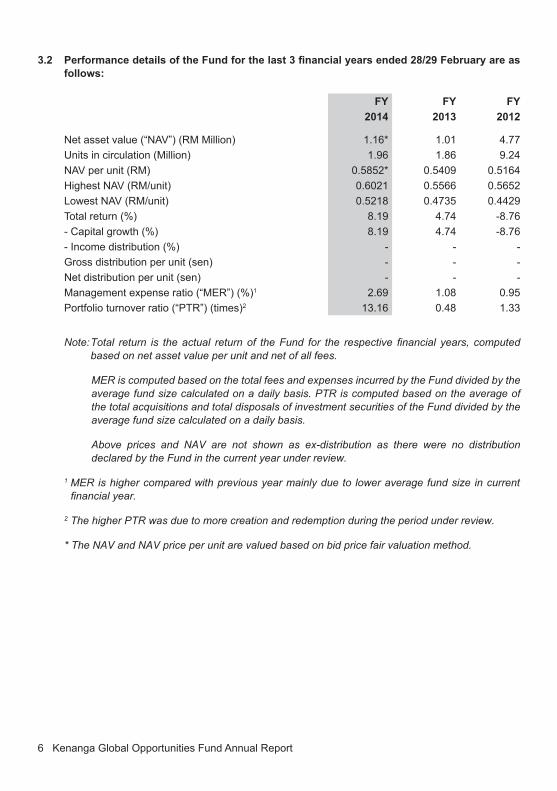
3.2 Performance details of the Fund for the last 3 financial years ended 28/29 February are as follows:
FY FY FY2014 2013 2012
Net asset value (“NAV”) (RM Million) 1.16* 1.01 4.77Units in circulation (Million) 1.96 1.86 9.24NAV per unit (RM) 0.5852* 0.5409 0.5164Highest NAV (RM/unit) 0.6021 0.5566 0.5652Lowest NAV (RM/unit) 0.5218 0.4735 0.4429Total return (%) 8.19 4.74 -8.76- Capital growth (%) 8.19 4.74 -8.76- Income distribution (%) - - -Gross distribution per unit (sen) - - -Net distribution per unit (sen) - - -Management expense ratio (“MER”) (%)1 2.69 1.08 0.95Portfolio turnover ratio (“PTR”) (times)2 13.16 0.48 1.33
Note:Total return is theactual returnof theFund for the respective financial years, computedbased on net asset value per unit and net of all fees.
MER is computed based on the total fees and expenses incurred by the Fund divided by the average fund size calculated on a daily basis. PTR is computed based on the average of the total acquisitions and total disposals of investment securities of the Fund divided by the average fund size calculated on a daily basis.
Above prices and NAV are not shown as ex-distribution as there were no distribution declared by the Fund in the current year under review.
1 MER is higher compared with previous year mainly due to lower average fund size in current financialyear.
2 The higher PTR was due to more creation and redemption during the period under review.
* The NAV and NAV price per unit are valued based on bid price fair valuation method.
Kenanga Global Opportunities Fund Annual Report 7
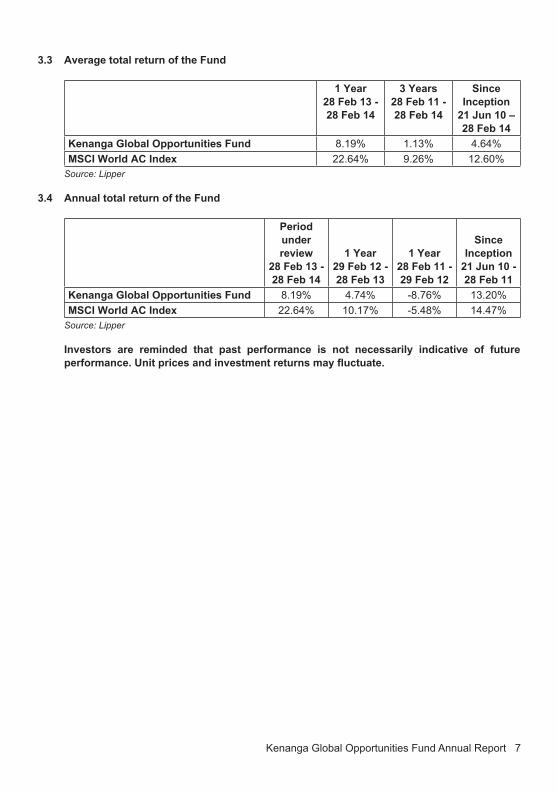
3.3 Average total return of the Fund
1 Year28 Feb 13 - 28 Feb 14
3 Years28 Feb 11 - 28 Feb 14
Since Inception
21 Jun 10 – 28 Feb 14
Kenanga Global Opportunities Fund 8.19% 1.13% 4.64%MSCI World AC Index 22.64% 9.26% 12.60%
Source: Lipper
3.4 Annual total return of the Fund
Period under review
28 Feb 13 - 28 Feb 14
1 Year29 Feb 12 - 28 Feb 13
1 Year28 Feb 11 - 29 Feb 12
Since Inception
21 Jun 10 - 28 Feb 11
Kenanga Global Opportunities Fund 8.19% 4.74% -8.76% 13.20%MSCI World AC Index 22.64% 10.17% -5.48% 14.47%
Source: Lipper
Investors are reminded that past performance is not necessarily indicative of future performance. Unit prices and investment returns may fluctuate.

8 Kenanga Global Opportunities Fund Annual Report
4 TRUSTEE’S REPORT TO THE UNITHOLDERS OF KENANGA GLOBAL OPPORTUNITIES FUND
We, CIMB COMMERCE TRUSTEE BERHAD (“the Trustee”), being the Trustee of KENANGA GLOBAL OPPORTUNITIES FUND (“the Fund”) (formerly known as ING Global Opportunities) are of the opinion that KENANGA INVESTORS BERHAD (“the Manager”), acting in the capacity of Manager of the Fund, has fulfilled its duties in the following manner for the financial year ended 28 February 2014.
a) The Fund has been managed in accordance with the limitations imposed on the investment powers of the Manager and the Trustee under the Deed, the Securities Commission Malaysia’s Guidelines on Unit Trust Funds, the Capital Markets and Services Act 2007 and other applicable laws;
b) Valuation/pricing of units of the Fund has been carried out in accordance with the Deed and relevant regulatory requirements; and
c) Creation and cancellation of units have been carried out in accordance with the Deed and relevant regulatory requirements; and
For and on behalf of CIMB COMMERCE TRUSTEE BERHAD (313031-A)
LEE KOOI YOKE Chief Operating Officer
Kuala Lumpur, Malaysia
25 April 2014

Kenanga Global Opportunities Fund Annual Report 9
5. INDEPENDENT AUDITORS’ REPORT TO THE UNIT HOLDERS OF KENANGA GLOBAL OPPORTUNITIES FUND
Report on the financial statements
We have audited the financial statements of Kenanga Global Opportunities Fund (Formerly known as ING Global Opportunities) (“the Fund”), which comprise the statement of financial position as at 28 February 2014 and the statement of comprehensive income, statement of changes in net asset value and statement of cash flows for the financial year then ended, and a summary of significant accounting policies and other explanatory information, as set out on pages 12 to 31.
Manager’sandTrustee’sresponsibilityforthefinancialstatementsandfairpresentation
The Manager of the Fund is responsible for the preparation of financial statements so as to give a true and fair view in accordance with Malaysian Financial Reporting Standards and International Financial Reporting Standards. The Manager is also responsible for such internal control as the Manager determines is necessary to enable the preparation of financial statements that are free from material misstatement, whether due to fraud or error. The Trustee is responsible for ensuring that the Manager maintains proper accounting and other records as are necessary to enable true and fair presentation of these financial statements.
Auditors’ responsibility
Our responsibility is to express an opinion on these financial statements based on our audit. We conducted our audit in accordance with approved standards on auditing in Malaysia. Those standards require that we comply with ethical requirements and plan and perform the audit to obtain reasonable assurance about whether the financial statements are free from material misstatement.
An audit involves performing procedures to obtain audit evidence about the amounts and disclosures in the financial statements. The procedures selected depend on our judgment, including the assessment of risks of material misstatement of the financial statements, whether due to fraud or error. In making those risk assessments, we consider internal control relevant to the Fund’s preparation of financial statements that give a true and fair view in order to design audit procedures that are appropriate in the circumstances, but not for the purpose of expressing an opinion on the effectiveness of the Fund’s internal control. An audit also includes evaluating the appropriateness of the accounting policies used and the reasonableness of accounting estimates made by the Manager, as well as evaluating the overall presentation of the financial statements.
We believe that the audit evidence we have obtained is sufficient and appropriate to provide a basis for our audit opinion.
10 Kenanga Global Opportunities Fund Annual Report
5. INDEPENDENT AUDITORS’ REPORT TO THE UNIT HOLDERS OF KENANGA GLOBAL OPPORTUNITIES FUND (CONTD.)
Opinion
In our opinion, the financial statements give a true and fair view of the financial position of the Fund as at 28 February 2014 and of its financial performance, changes in net asset value and cash flows of the Fund for the financial year then ended in accordance with Malaysian Financial Reporting Standards and International Financial Reporting Standards.
Other matters
This report is made solely to the unitholders of the Fund, as a body in accordance with the requirements of Securities Commission’s Guideline on Unit Trust Funds, and for no other purpose. We do not assume responsibility to any other person for the content of this report.
Ernst & Young Gloria Goh Ewe GimAF: 0039 No. 1685/04/15(J)Chartered Accountants Chartered Accountant
Kuala Lumpur, Malaysia
25 April 2014

Kenanga Global Opportunities Fund Annual Report 11
6. STATEMENT BY THE MANAGER
I, Abdul Razak Bin Ahmad, being the director of Kenanga Investors Berhad, do hereby state that, in the opinion of the Manager, the accompanying statement of financial position as at 28 February 2014 and the related statement of comprehensive income, statement of changes in net asset value and statement of cash flows for the financial year ended 28 February 2014 together with notes thereto, are drawn up in accordance with Malaysian Financial Reporting Standards and International Financial Reporting Standards so as to give a true and fair view of the financial position of Kenanga Global Opportunities Fund (formerly known as ING Global Opportunities) as at 28 February 2014 and of its financial performance and cash flows for the year then ended and comply with the requirements of the Deed.
For and on behalf of the ManagerKenanga Investors Berhad
Abdul Razak Bin Ahmad
Kuala Lumpur, Malaysia
25 April 2014
12 Kenanga Global Opportunities Fund Annual Report
7. FINANCIAL STATEMENT
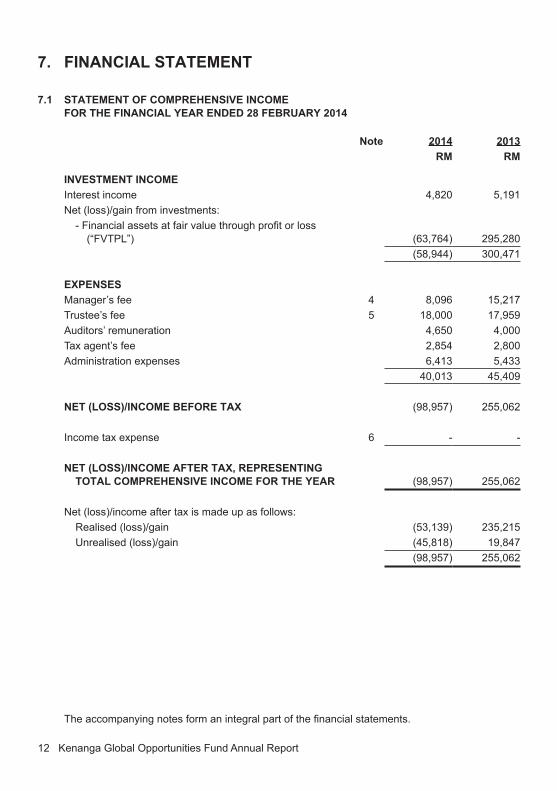
7.1 STATEMENT OF COMPREHENSIVE INCOMEFOR THE FINANCIAL YEAR ENDED 28 FEBRUARY 2014
Note 2014 2013RM RM
INVESTMENT INCOMEInterest income 4,820 5,191Net (loss)/gain from investments:
- Financial assets at fair value through profit or loss (“FVTPL”) (63,764) 295,280
(58,944) 300,471
EXPENSESManager’s fee 4 8,096 15,217Trustee’s fee 5 18,000 17,959Auditors’ remuneration 4,650 4,000Tax agent’s fee 2,854 2,800Administration expenses 6,413 5,433
40,013 45,409
NET (LOSS)/INCOME BEFORE TAX (98,957) 255,062
Income tax expense 6 - -
NET (LOSS)/INCOME AFTER TAX, REPRESENTING TOTAL COMPREHENSIVE INCOME FOR THE YEAR (98,957) 255,062
Net (loss)/income after tax is made up as follows:Realised (loss)/gain (53,139) 235,215Unrealised (loss)/gain (45,818) 19,847
(98,957) 255,062
The accompanying notes form an integral part of the financial statements.

Kenanga Global Opportunities Fund Annual Report 13
7.2 STATEMENT OF FINANCIAL POSITIONAS AT 28 FEBRUARY 2014
Note 2014 2013RM RM
INVESTMENTSCollective investment scheme - foreign 7 1,105,522 975,286
1,105,522 975,286
OTHER ASSETSCash at bank 59,407 58,512
59,407 58,512
TOTAL ASSETS 1,164,929 1,033,798
LIABILITIESAmount due to Manager 765 10,616Amount due to Trustee 2,910 1,381Other payables 15,950 14,200TOTAL LIABILITIES 19,625 26,197
EQUITY
Unitholder’s contribution 1,175,626 938,966 (Accumulated losses)/Retained earnings (30,322) 68,635NET ASSET VALUE (“NAV”) ATTRIBUTABLE
TO UNITHOLDERS 8 1,145,304 1,007,601
TOTAL EQUITY AND LIABILITIES 1,164,929 1,033,798
NUMBER OF UNITS IN CIRCULATION 8(a) 1,957,192 1,862,721
NET ASSET VALUE PER UNIT (RM) 9 0.5852 0.5409
The accompanying notes form an integral part of the financial statements.

14 Kenanga Global Opportunities Fund Annual Report
7.3 STATEMENT OF CHANGES IN NET ASSET VALUEFOR THE FINANCIAL YEAR ENDED 28 FEBRUARY 2014
NoteUnitholders’ contribution
(Accumulated losses)/
Retained earnings
Total net asset value
RM RM RM
2014At beginning of the year 938,966 68,635 1,007,601 Total comprehensive loss - (98,957) (98,957)Creation of units 8(a) 20,258,035 - 20,258,035 Cancellation of units 8(a) (19,972,875) - (19,972,875)Distribution equalisation 8(a) (48,500) - (48,500)At end of the year 1,175,626 (30,322) 1,145,304
2013At beginning of the year 3,620,946 1,148,496 4,769,442Total comprehensive income - 255,062 255,062Creation of units 8(a) 155,566 - 155,566Cancellation of units 8(a) (4,164,787) - (4,164,787)Distribution equalisation 8(a) 1,327,241 (1,334,923) (7,682)At end of the year 938,966 68,635 1,007,601
The accompanying notes form an integral part of the financial statements.

Kenanga Global Opportunities Fund Annual Report 15
7.4 STATEMENT OF CASH FLOWSFOR THE FINANCIAL YEAR ENDED 28 FEBRUARY 2014
2014 2013RM RM
CASH FLOWS FROM OPERATING AND INVESTING ACTIVITIESProceeds from sale of investments 19,476,000 3,955,000Purchase of investments (19,670,000) (60,000)Interest received 4,820 5,208Manager’s fee paid (7,803) (16,162)Trustee’s fee paid (16,471) (18,004)Auditors’ remuneration paid (4,000) (4,000)Tax agent’s fee paid (2,454) -Payment for other fees and expenses (5,713) (4,833)Net cash (used in)/generated from operating and investing activities (225,621) 3,857,209
CASH FLOWS FROM FINANCING ACTIVITIESCash received from units created 20,441,372 176,883Cash paid on units cancelled (20,214,856) (4,188,785)Net cash generated from/(used in) financing activities 226,516 (4,011,902)
NET INCREASE/(DECREASE) IN CASH AND CASH EQUIVALENTS
895 (154,693)
CASH AND CASH EQUIVALENTS AT BEGINNING OF THE YEAR 58,512 213,205CASH AND CASH EQUIVALENTS AT END OF THE YEAR 59,407 58,512
Cash and cash equivalents comprise:Cash at bank 59,407 58,512
59,407 58,512
The accompanying notes form an integral part of the financial statements.

16 Kenanga Global Opportunities Fund Annual Report
7.5 NOTES TO THE FINANCIAL STATEMENTSFOR THE FINANCIAL YEAR ENDED 28 FEBRUARY 2014
1. THE FUND, THE MANAGER AND THEIR PRINCIPAL ACTIVITIES
Kenanga Global Opportunities Fund (formerly known as ING Global Opportunities) (herein after referred to as “The Fund”) was constituted pursuant to the executed Deed dated 13 October 2009 (collectively, together with deeds supplemental thereto, referred to as “the Deed”) between ING Funds Berhad (currently known as Kenanga Funds Berhad) and CIMB Commerce Trustee Berhad as the Trustee. The Fund commenced operations on 21 June 2010 and will continue to be in operation until terminated as provided under Part 12 of the Deed.
Pursuant to the executed Seventh Supplemental Deed dated 15 May 2013 between Kenanga Investors Berhad and CIMB Commerce Trustee Berhad, Kenanga Investors Berhad was appointed as the Manager of the Fund with effect from 8 June 2013 and the name of the Fund was changed from ING Global Opportunities to Kenanga Global Opportunities Fund.
Kenanga Investors Berhad is a wholly-owned subsidiary of Kenanga Investment Bank Berhad, which in turn is a wholly-owned subsidiary of K&N Kenanga Holdings Berhad, listed on the main board of Bursa Malaysia Securities Berhad. All of these companies are incorporated in Malaysia.
The principal place of business of the Manager is Suite 12.02, 12th Floor, Kenanga International, Jalan Sultan Ismail, 50250 Kuala Lumpur.
The Fund is set up with the aim of achieving capital growth by investing, via a target fund, in a diversified portfolio of global equities that are likely to yield higher earning growth than global average. To achieve the objective of the Fund, it will invest a minimum 95% of the net asset value in ING (L) Invest Global Opportunities (“IIGO”), denominated in Euro, domiciled in Luxembourg. The remaining will be invested in liquid assets including money market instruments and deposits with licensed financial institution.
The financial statements were authorised for issue by the Chief Executive Officer of the Manager on 25 April 2014.
2. FINANCIAL RISK AND MANAGEMENT OBJECTIVES AND POLICIES
To the extent that the Fund invests in IIGO which has investments in global equities, it is exposed to market rick (which includes price risk and currency risk) and credit risk.
The Fund Manager monitors the portfolio of IIGO, to ensure that the underlying fund is positioned to meet its investment objectives. The Fund Manager may seek alternative collective investment scheme or any permissible instruments that are consistent with the objective of the Fund.
Kenanga Global Opportunities Fund Annual Report 17
2. FINANCIAL RISK AND MANAGEMENT OBJECTIVES AND POLICIES
a. Market Risk
Market risk is the risk that the fair value or future cash flows of a financial instrument will fluctuate because of changes in market prices. Market risk includes currency risk, interest rate risk, price risk and currency risk.
Market risk arises when the value of the investments fluctuate in response to the activities of individual companies, general market or economic conditions. It stems from the fact that there are other economy-wide perils, which threaten all businesses. Hence, investors are exposed to market uncertainties. Fluctuation in the investment prices caused by uncertainties in the economy, political and social environment will affect the fair value of the Fund.
i. Interest rate risk
The Fund’s has minimal exposure to interest rate risk as placement with financial institutions are on short term basis. In addition, the Fund has indirect exposure to interest rate risk through IIGO.
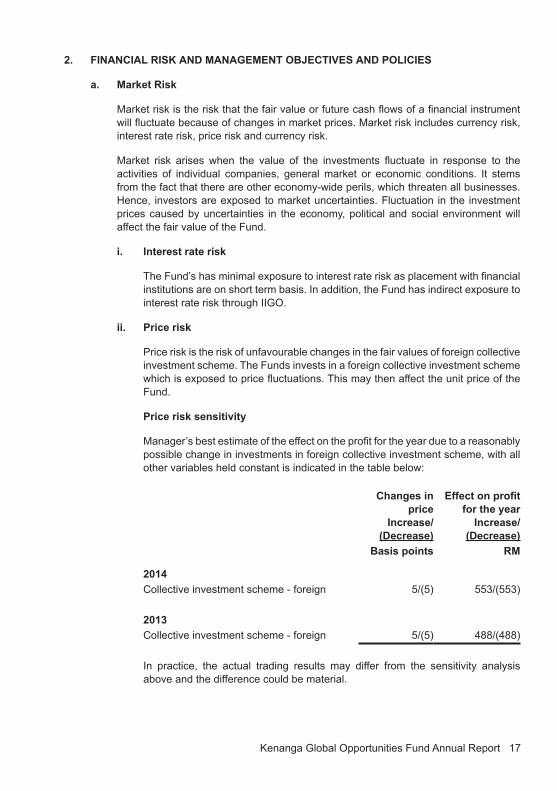
ii. Price risk
Price risk is the risk of unfavourable changes in the fair values of foreign collective investment scheme. The Funds invests in a foreign collective investment scheme which is exposed to price fluctuations. This may then affect the unit price of the Fund.
Price risk sensitivity
Manager’s best estimate of the effect on the profit for the year due to a reasonably possible change in investments in foreign collective investment scheme, with all other variables held constant is indicated in the table below:
Changes in price
Increase/(Decrease)
Effect on profit for the year
Increase/ (Decrease)
Basis points RM
2014Collective investment scheme - foreign 5/(5) 553/(553)
2013Collective investment scheme - foreign 5/(5) 488/(488)
In practice, the actual trading results may differ from the sensitivity analysis above and the difference could be material.
18 Kenanga Global Opportunities Fund Annual Report
2. FINANCIAL RISK AND MANAGEMENT OBJECTIVES AND POLICIES (CONTD.)
a. Market Risk (Contd.)
ii. Price risk (Contd.)
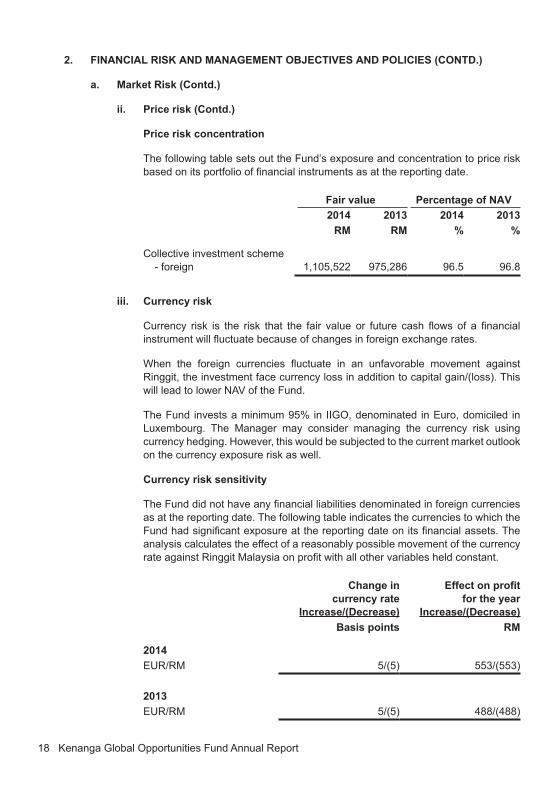
Price risk concentration
The following table sets out the Fund’s exposure and concentration to price risk based on its portfolio of financial instruments as at the reporting date.
Fair value Percentage of NAV2014 2013 2014 2013
RM RM % %
Collective investment scheme - foreign 1,105,522 975,286 96.5 96.8
iii. Currency risk
Currency risk is the risk that the fair value or future cash flows of a financial instrument will fluctuate because of changes in foreign exchange rates.
When the foreign currencies fluctuate in an unfavorable movement against Ringgit, the investment face currency loss in addition to capital gain/(loss). This will lead to lower NAV of the Fund.
The Fund invests a minimum 95% in IIGO, denominated in Euro, domiciled in Luxembourg. The Manager may consider managing the currency risk using currency hedging. However, this would be subjected to the current market outlook on the currency exposure risk as well.
Currency risk sensitivity
The Fund did not have any financial liabilities denominated in foreign currencies as at the reporting date. The following table indicates the currencies to which the Fund had significant exposure at the reporting date on its financial assets. The analysis calculates the effect of a reasonably possible movement of the currency rate against Ringgit Malaysia on profit with all other variables held constant.
Change in currency rate
Increase/(Decrease)
Effect on profit for the year
Increase/(Decrease)Basis points RM
2014EUR/RM 5/(5) 553/(553)
2013EUR/RM 5/(5) 488/(488)

Kenanga Global Opportunities Fund Annual Report 19
2. FINANCIAL RISK AND MANAGEMENT OBJECTIVES AND POLICIES (CONTD.)
a. Market Risk (Contd.)
iii. Currency risk (Contd.)
Currency risk concentration
The following table set out the Fund’s exposure to foreign currency exchange rates on its financial assets as at the reporting date.
Fair value Percentage of NAV2014 2013 2014 2013
RM RM % %
EUR 1,105,522 975,286 96.5 96.8
b. Credit Risk
Prior to investing in IIGO, the Fund Manager has performed an evaluation of the performance and track record of IIGO, as well as the fund management team of IIGO.
i. Credit risk exposure
At the reporting date, the Fund’s maximum exposure to credit risk is represented by the carrying amount of each class of financial assets recognised in the statement of financial position.
ii. Financial assets that are either past due or impaired
As at the reporting date, there are no financial assets that are either past due or impaired.
c. Liquidity Risk
Liquidity risk is defined as the risk that the Fund will encounter difficulty in meeting obligations associated with financial liabilities that are to be settled by delivering cash or another financial asset. Exposure to liquidity risk arises because of the possibility that the Fund could be required to pay its liabilities or cancel its units earlier than expected. The Fund is exposed to cash cancellation of its units on a regular basis. Units sold to unitholders by the Manager are cancellable at the unitholder’s option based on the Fund’s NAV per unit at the time of cancellation calculated in accordance with the Fund’s Trust Deed.
Unit trust funds with principal investment strategies that involve foreign securities, derivatives or securities with substantial market and/or credit risk tend to have the greatest exposure to liquidity risks. IIGO’s Investment Manager manages the risk by adopting ING’s diversification policy that stipulates single and group issuer limits to confine over-exposure to a single company or group of companies.
20 Kenanga Global Opportunities Fund Annual Report
2. FINANCIAL RISK AND MANAGEMENT OBJECTIVES AND POLICIES (CONTD.)
c. Liquidity Risk (Contd.)
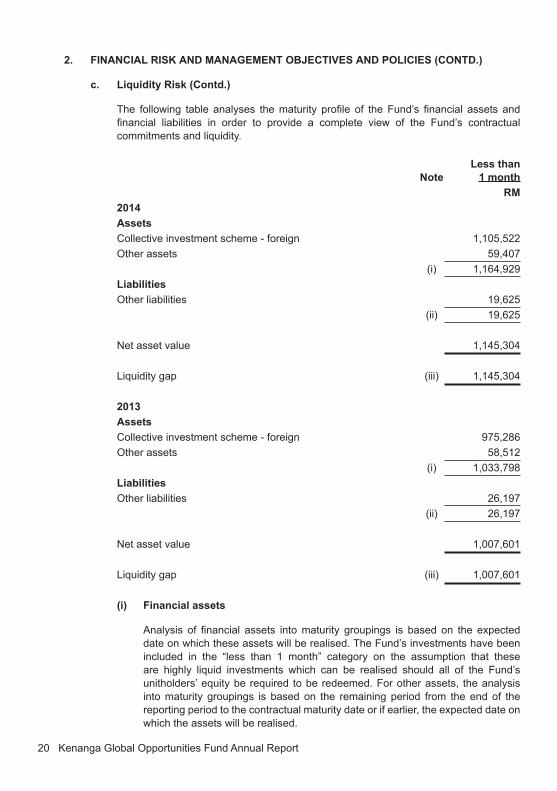
The following table analyses the maturity profile of the Fund’s financial assets and financial liabilities in order to provide a complete view of the Fund’s contractual commitments and liquidity.
NoteLess than
1 monthRM
2014AssetsCollective investment scheme - foreign 1,105,522Other assets 59,407
(i) 1,164,929LiabilitiesOther liabilities 19,625
(ii) 19,625
Net asset value 1,145,304
Liquidity gap (iii) 1,145,304
2013AssetsCollective investment scheme - foreign 975,286Other assets 58,512
(i) 1,033,798LiabilitiesOther liabilities 26,197
(ii) 26,197
Net asset value 1,007,601
Liquidity gap (iii) 1,007,601
(i) Financial assets
Analysis of financial assets into maturity groupings is based on the expected date on which these assets will be realised. The Fund’s investments have been included in the “less than 1 month” category on the assumption that these are highly liquid investments which can be realised should all of the Fund’s unitholders’ equity be required to be redeemed. For other assets, the analysis into maturity groupings is based on the remaining period from the end of the reporting period to the contractual maturity date or if earlier, the expected date on which the assets will be realised.
Kenanga Global Opportunities Fund Annual Report 21
2. FINANCIAL RISK AND MANAGEMENT OBJECTIVES AND POLICIES (CONTD.)
c. Liquidity Risk (Contd.)
(ii) Financial liabilities
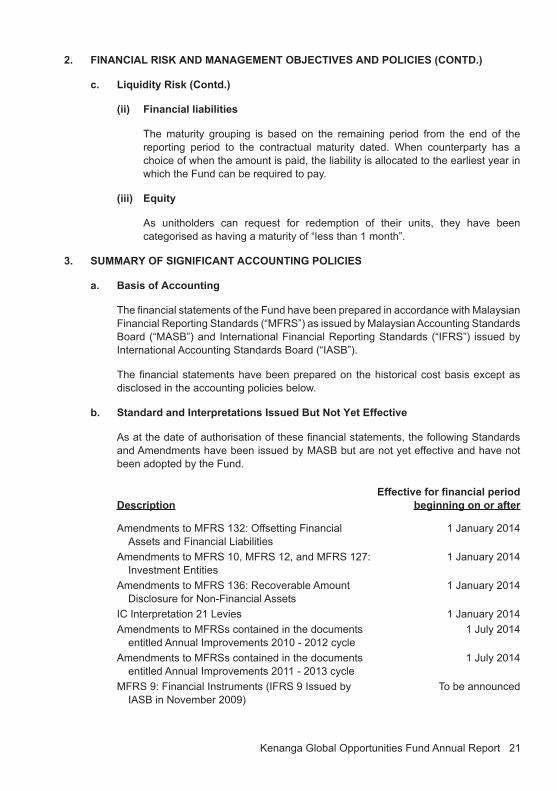
The maturity grouping is based on the remaining period from the end of the reporting period to the contractual maturity dated. When counterparty has a choice of when the amount is paid, the liability is allocated to the earliest year in which the Fund can be required to pay.
(iii) Equity
As unitholders can request for redemption of their units, they have been categorised as having a maturity of “less than 1 month”.
3. SUMMARY OF SIGNIFICANT ACCOUNTING POLICIES
a. Basis of Accounting
The financial statements of the Fund have been prepared in accordance with Malaysian Financial Reporting Standards (“MFRS”) as issued by Malaysian Accounting Standards Board (“MASB”) and International Financial Reporting Standards (“IFRS”) issued by International Accounting Standards Board (“IASB”).
The financial statements have been prepared on the historical cost basis except as disclosed in the accounting policies below.
b. Standard and Interpretations Issued But Not Yet Effective
As at the date of authorisation of these financial statements, the following Standards and Amendments have been issued by MASB but are not yet effective and have not been adopted by the Fund.
DescriptionEffective for financial period
beginning on or after
Amendments to MFRS 132: Offsetting Financial Assets and Financial Liabilities
1 January 2014
Amendments to MFRS 10, MFRS 12, and MFRS 127: Investment Entities
1 January 2014
Amendments to MFRS 136: Recoverable Amount Disclosure for Non-Financial Assets
1 January 2014
IC Interpretation 21 Levies 1 January 2014Amendments to MFRSs contained in the documents
entitled Annual Improvements 2010 - 2012 cycle1 July 2014
Amendments to MFRSs contained in the documents entitled Annual Improvements 2011 - 2013 cycle
1 July 2014
MFRS 9: Financial Instruments (IFRS 9 Issued by IASB in November 2009)
To be announced

22 Kenanga Global Opportunities Fund Annual Report
3. SUMMARY OF SIGNIFICANT ACCOUNTING POLICIES (CONTD.)
b. Standard and Interpretations Issued But Not Yet Effective (Contd.)
DescriptionEffective for financial period
beginning on or after
MFRS 9: Financial Instruments (IFRS 9 Issued by IASB in October 2010)
To be announced
MFRS 9: Financial Instruments: Hedge Accounting and amendments to MFRS 9, MFRS 7 and MFRS 139.
To be announced
The Fund will adopt the above pronouncements when they become effective in the respective financial periods. These pronouncements are not expected to have any significant impact to the financial statements of the Fund upon their initial application, other than MFRS 9.
MFRS 9 reflects the first phase of work on the replacement of MFRS 139 and applies to classification and measurement of financial assets and financial liabilities as defined in MFRS 139. The standard was initially effective for annual periods beginning on or after 1 January 2013, but Amendments to MFRS 9: Mandatory Effective Date of MFRS 9 and Transition Disclosures, issued in March 2012, moved the mandatory effective date to 1 January 2015. Subsequently, on 14 February 2014, it was announced that the new effective date will be decided when the project is closer to completion. The adoption of the first phase of MFRS 9 will have an effect on the classification and measurement of the Fund’s financial assets, but will not have an impact on classification and measurements of the Fund’s financial liabilities. The Fund will quantify the effect in conjunction with the other phases, when the final standard including all phases is issued.
c. Financial Assets
Financial assets are recognised in the statement of financial position when, and only when, the Fund becomes a party to the contractual provisions of the financial instrument.
When financial assets are recognised initially, they are measured at fair value, plus, in the case of financial assets not at FVTPL, directly attributable transaction costs.
The Fund determines the classification of its financial assets at initial recognition, which are receivables.
i. Financial assets at FVTPL
Financial assets are classified as financial assets at FVTPL if they are held for trading or are designated as such upon initial recognition.
Financial assets held for trading include foreign collective investment scheme acquired principally for the purpose of selling in the near term.
Subsequent to initial recognition, financial assets at FVTPL are measured at fair value. Changes in the fair value of those financial instruments are recorded in profit or loss.

Kenanga Global Opportunities Fund Annual Report 23
3. SUMMARY OF SIGNIFICANT ACCOUNTING POLICIES (CONTD.)
c. Financial Assets (Contd.)
i. Financial assets at FVTPL (Contd.)
Interest earned elements of such instruments are recorded separately in “interest income”.
Exchange differences on financial assets at FVTPL are not recognised separately in profit or loss but are included in net gain or net loss on changes in fair value of financial assets at FVTPL.
ii. Receivables
Financial assets with fixed or determinable payment that are not quoted in an active market are classified as receivables.
Subsequent to initial recognition, receivables are measured at amortised cost using the effective interest method. Gain or loss is recognised in profit or loss when the receivable are derecognised or impaired, and through the amortisation process.
A financial asset is derecognised when the contractual right to receive cash flows from the asset has expired. On derecognition of a financial asset, the difference between the carrying amount and the sum of the consideration received is recognised in profit or loss.
d. Impairment of Financial Assets
The Fund assesses at each reporting date whether there is any objective evidence that a financial assets is impaired.
To determine whether there is objective evidence that an impairment loss on financial assets has been incurred the Fund considers factors such as the probability of insolvency or significant financial difficulties of the debtor and default or significant delay in payments.
If any such evidence exists, the amount of impairment loss is measured as the difference between the asset’s carrying amount and the present value of estimated future cash flows discounted at the financial asset’s original effective interest rate. The impairment loss is recognised in profit or loss.
The carrying amount of the financial asset is reduced by the impairment loss directly for all financial assets, with the exception of receivables, where the carrying amount is reduced through the use of an allowance account. When a receivable becomes uncollectible, it is written off against the allowance account.
If in a subsequent year, the amount of the impairment loss decreases and the decrease can be related objectively to an event occurring after the impairment was recognised, the previously recognised impairment loss is reversed to the extent that the carrying amount of the assets does not exceed its amortised cost at the reversal date. The amount of reversal is recognised in profit or loss.

24 Kenanga Global Opportunities Fund Annual Report
3. SUMMARY OF SIGNIFICANT ACCOUNTING POLICIES (CONTD.)
e. Income
Income is recognised to the extent that it is probable that the economic benefits will flow to the Fund and the income can be reliably measured. Income is measured at the fair value of consideration received or receivable.
Interest income is recognised using the effective interest rate method.
f. Cash and Cash Equivalents
For the purposes of the statement of cash flows, cash and cash equivalent include cash at bank and short term deposits with financial institutions.
g. Income Tax Expense
Income tax on the profit or loss for the year comprises current tax. Current tax is the expected amount of income taxes payable in respect of the taxable profit for the year.
h. Unrealised Reserves
Unrealised reserves represent the net gain or loss arising from carrying investments at their fair values and unrealised gain or loss from translating foreign currency monetary items at exchange rates prevailing at reporting date. This reserve is not distributable in nature.
i. Financial Liabilities
Financial liabilities are classified according to the substance of the collateral arrangements entered into and the definitions of a financial liability.
Financial liabilities are recognised in the statement of financial position when and only when, the Fund becomes a party to the contractual provisions of the financial instrument. The Fund’s financial liabilities are classified as other financial liabilities. The Fund’s financial liabilities are recognised initially at fair value and subsequently measured at amortised cost using the effective rate method.
A financial liability is derecognised when the obligation under the liability is extinguished. Gains and losses are recognised in profit or loss when the liabilities are derecognised, and through amortisation process.
j. Unitholders’ Contribution – NAV Attributable to Unitholders
The unitholders’ contribution to the Fund is classified as equity instruments.
Distribution equalisation represents the average amount of undistributed net income included in the creation or cancellation price of units. This amount is either refunded to unitholders by way of distribution and/or adjusted accordingly when units are released back to the Trustee.

Kenanga Global Opportunities Fund Annual Report 25
3. SUMMARY OF SIGNIFICANT ACCOUNTING POLICIES (CONTD.)
k. Foreign Currency
i. Functional and presentation currency
The financial statements of the Fund are measured using the currency of the primary economic environment in which the Fund operates (“the functional currency”). The financial statements are presented in Ringgit Malaysia (RM), which is also the Fund’s functional currency.
ii. Foreign currency transactions
In preparing the financial statements of the Fund, transactions in currencies other than the Fund’s functional currency (foreign currencies) are recorded in the functional currency using exchange rates prevailing at the dates of the transactions. At each reporting date, monetary items denominated in foreign currencies are translated at the rates prevailing on the reporting date. All exchange gain or loss is recognised in the statement of comprehensive income.
Exchange differences arising on the settlement of monetary items, and on the translation of monetary items, are included in statement of comprehensive income for the year.
The principal exchange rate for each respective units of foreign currency ruling at statement of financial position date is as follows:
28.2.14 28.2.13RM RM
1 EUR 4.5235 4.0395
l. Distribution
Distributions are at the discretion of the Fund Manager. A distribution to the Fund’s unitholders is accounted for as a deduction from retained earnings.
m. Significant Accounting Judgments and Estimates
The preparation of financial statements requires the use of certain accounting estimates and exercise of judgment. Estimates and judgments are continually evaluated and are based on past experience, reasonable expectations of future events and other factors.
i. Critical judgments made in applying accounting policies
There are no major judgments made by the Manager in applying the Fund’s accounting policies.
26 Kenanga Global Opportunities Fund Annual Report
3. SUMMARY OF SIGNIFICANT ACCOUNTING POLICIES (CONTD.)
m. Significant Accounting Judgments and Estimates (Contd.)
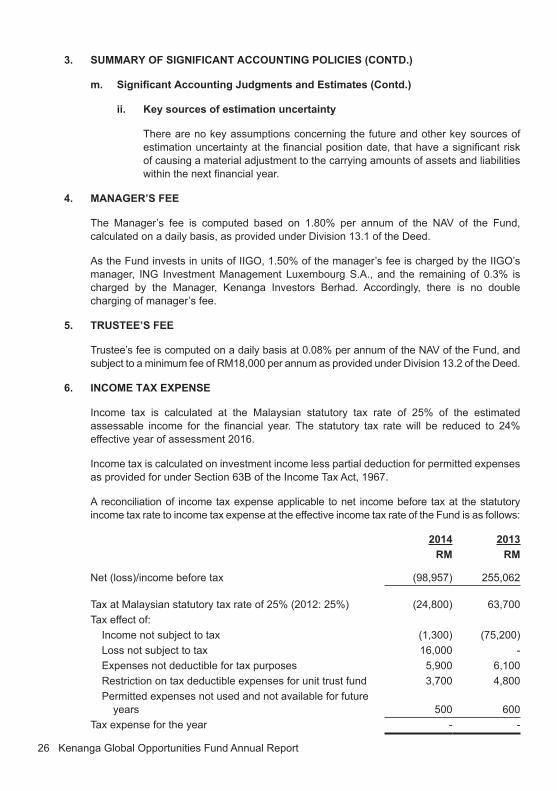
ii. Key sources of estimation uncertainty
There are no key assumptions concerning the future and other key sources of estimation uncertainty at the financial position date, that have a significant risk of causing a material adjustment to the carrying amounts of assets and liabilities within the next financial year.
4. MANAGER’S FEE
The Manager’s fee is computed based on 1.80% per annum of the NAV of the Fund, calculated on a daily basis, as provided under Division 13.1 of the Deed.
As the Fund invests in units of IIGO, 1.50% of the manager’s fee is charged by the IIGO’s manager, ING Investment Management Luxembourg S.A., and the remaining of 0.3% is charged by the Manager, Kenanga Investors Berhad. Accordingly, there is no double charging of manager’s fee.
5. TRUSTEE’S FEE
Trustee’s fee is computed on a daily basis at 0.08% per annum of the NAV of the Fund, and subject to a minimum fee of RM18,000 per annum as provided under Division 13.2 of the Deed.
6. INCOME TAX EXPENSE
Income tax is calculated at the Malaysian statutory tax rate of 25% of the estimated assessable income for the financial year. The statutory tax rate will be reduced to 24% effective year of assessment 2016.
Income tax is calculated on investment income less partial deduction for permitted expenses as provided for under Section 63B of the Income Tax Act, 1967.
A reconciliation of income tax expense applicable to net income before tax at the statutory income tax rate to income tax expense at the effective income tax rate of the Fund is as follows:
2014 2013RM RM
Net (loss)/income before tax (98,957) 255,062
Tax at Malaysian statutory tax rate of 25% (2012: 25%) (24,800) 63,700Tax effect of:
Income not subject to tax (1,300) (75,200)Loss not subject to tax 16,000 -Expenses not deductible for tax purposes 5,900 6,100Restriction on tax deductible expenses for unit trust fund 3,700 4,800Permitted expenses not used and not available for future
years 500 600Tax expense for the year - -
Kenanga Global Opportunities Fund Annual Report 27
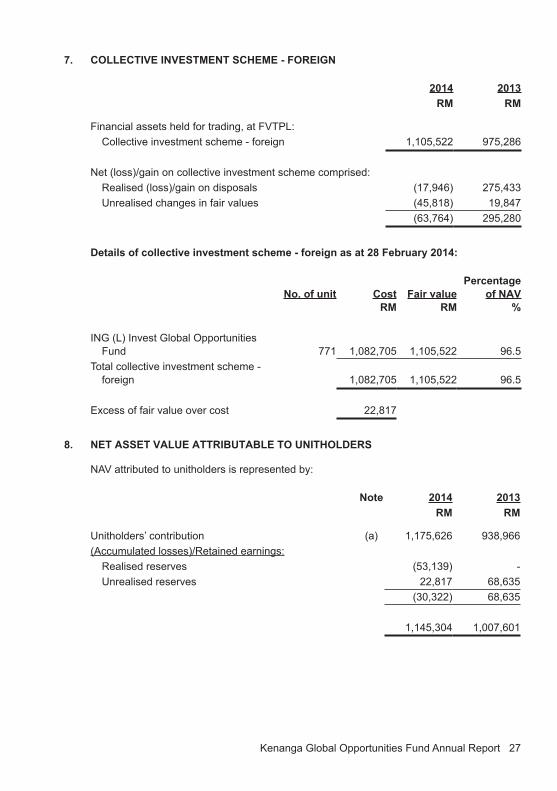
7. COLLECTIVE INVESTMENT SCHEME - FOREIGN
2014 2013RM RM
Financial assets held for trading, at FVTPL: Collective investment scheme - foreign 1,105,522 975,286
Net (loss)/gain on collective investment scheme comprised:Realised (loss)/gain on disposals (17,946) 275,433Unrealised changes in fair values (45,818) 19,847
(63,764) 295,280
Details of collective investment scheme - foreign as at 28 February 2014:
No. of unit Cost RM
Fair value RM
Percentage of NAV
%
ING (L) Invest Global Opportunities Fund 771 1,082,705 1,105,522 96.5
Total collective investment scheme - foreign 1,082,705 1,105,522 96.5
Excess of fair value over cost 22,817
8. NET ASSET VALUE ATTRIBUTABLE TO UNITHOLDERS
NAV attributed to unitholders is represented by:
Note 2014 2013RM RM
Unitholders’ contribution (a) 1,175,626 938,966(Accumulated losses)/Retained earnings:
Realised reserves (53,139) -Unrealised reserves 22,817 68,635
(30,322) 68,635
1,145,304 1,007,601

28 Kenanga Global Opportunities Fund Annual Report
8. NET ASSET VALUE ATTRIBUTABLE TO UNITHOLDERS (CONTD.)
(a) Unitholders’ contribution
2014 2013No. of units RM No. of units RM
At beginning of the year 1,862,721 938,966 9,235,817 3,620,946Distribution equalisation - (48,500) - 1,327,241Add: Creation of units 34,380,820 20,258,035 304,403 155,566Less: Cancellation of
units (34,286,349) (19,972,875) (7,677,499) (4,164,787)At end of the year 1,957,192 1,175,626 1,862,721 938,966
The number of units legally or beneficially held by the Manager, Kenanga Investors Berhad, and parties related to the Manager as of 28 February 2014 were nil (2013: nil).
9. NET ASSET VALUE PER UNIT
NAV attributable to unitholders is classified as equity in the statement of financial position.
The NAV per unit is calculated by dividing the NAV of RM1,145,304 by the 1,957,192 units in issue as at 28 February 2014 (2013: RM1,007,601 by 1,862,721 units in issue).
10. INCOME DISTRIBUTION
No income distribution was declared by the Fund for the financial year ended 28 February 2014 (2013: nil).
11. PORTFOLIO TURNOVER RATIO
The portfolio turnover ratio (“PTR”) for the current financial year is 13.16 times (2013: 0.48 times).
PTR is the ratio of the average of the acquisitions and disposals of investments of the Fund for the year to the average NAV of the Fund, calculated on a daily basis.
12. MANAGEMENT EXPENSE RATIO
The management expense ratio (“MER”) for the current financial year is 2.69% (2013: 1.08%).
MER is the ratio of total fees and recovered expenses of the Fund expressed as a percentage of the Fund’s average NAV, calculated on a daily basis.

Kenanga Global Opportunities Fund Annual Report 29
13. TRANSACTIONS WITH TARGET FUND MANAGER
Transaction value
Percentage of total
RM %
ING Investment Management Luxembourg S.A. * 39,146,000 100.0
The above transaction values are in respect of investments in foreign collective investment scheme. Transactions in this security do not involve any commission or brokerage fees.
* As the Fund is in its nature a feeder fund to a global fund, IIGO, hence most of the transactions were made with the global fund manager, ING Investment Management Luxembourg S.A.
14. SEGMENTAL REPORTING
As stated in Note 1 to the financial statements, the Fund is a feeder fund whereby at least 95% of the Funds’ NAV will be invested in IIGO while maintaining up to a maximum of 5% of the Fund’s NAV in liquid assets. IIGO is an open unit trust fund in Luxembourg and is managed by ING Investment Management Luxembourg S.A.
As the Fund is by nature a feeder fund to an underlying fund, it is not required at the Fund level to disclose its investments by business or geographical segments at the Fund level.
15. FINANCIAL INSTRUMENTS
a. Classification of financial instruments
The Fund’s financial assets and financial liabilities are measured on an ongoing basis at either fair value or at amortised cost based on their respective classification. The significant accounting policies in Note 3 describe how the classes of financial instruments are measured, and how income and expenses, including fair value gain and loss, are recognised.
The following table analyses the financial assets and liabilities of the Fund in the statement of financial position by the class of financial instrument to which they are assigned and therefore by the measurement basis.
Financial assets at
FVTPL ReceivablesFinancial liabilities Total
RM RM RM RM
2014AssetsCollective investment
scheme - foreign 1,105,522 - - 1,105,522Cash at bank - 59,407 - 59,407
1,105,522 59,407 - 1,164,929
30 Kenanga Global Opportunities Fund Annual Report
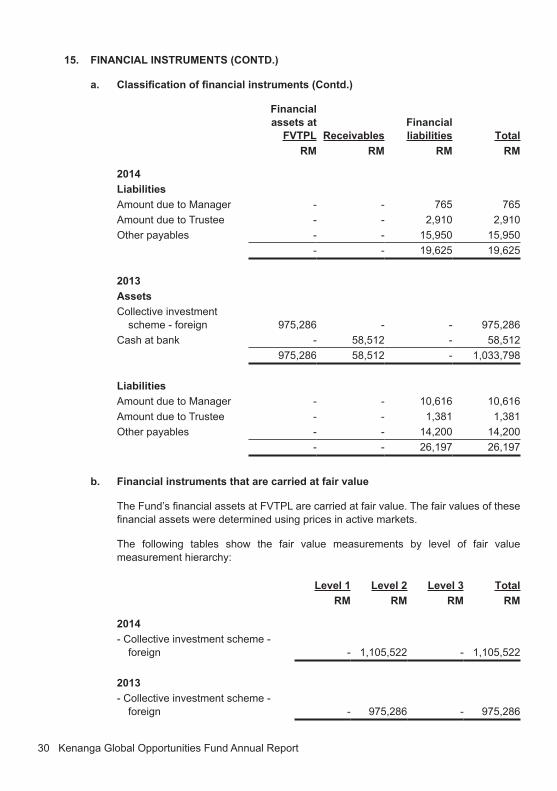
15. FINANCIAL INSTRUMENTS (CONTD.)
a. Classification of financial instruments (Contd.)
Financial assets at
FVTPL ReceivablesFinancial liabilities Total
RM RM RM RM
2014LiabilitiesAmount due to Manager - - 765 765 Amount due to Trustee - - 2,910 2,910 Other payables - - 15,950 15,950
- - 19,625 19,625
2013AssetsCollective investment
scheme - foreign 975,286 - - 975,286Cash at bank - 58,512 - 58,512
975,286 58,512 - 1,033,798
LiabilitiesAmount due to Manager - - 10,616 10,616Amount due to Trustee - - 1,381 1,381Other payables - - 14,200 14,200
- - 26,197 26,197
b. Financial instruments that are carried at fair value
The Fund’s financial assets at FVTPL are carried at fair value. The fair values of these financial assets were determined using prices in active markets.
The following tables show the fair value measurements by level of fair value measurement hierarchy:
Level 1 Level 2 Level 3 TotalRM RM RM RM
2014- Collective investment scheme -
foreign - 1,105,522 - 1,105,522
2013- Collective investment scheme -
foreign - 975,286 - 975,286

Kenanga Global Opportunities Fund Annual Report 31
15. FINANCIAL INSTRUMENTS (CONTD.)
b. Financial instruments that are carried at fair value (Contd.)
Level 1: Quoted prices in active marketLevel 2: Model with all significant inputs which are observable market dataLevel 3: Model with inputs not based on observable market date
The fair value of foreign collective investment scheme is stated based on the NAV of the collective investment scheme at the reporting date.
c. Financial instruments not carried at fair value and whose carrying amounts are reasonable approximation of fair value
The carrying amounts of the Fund’s other financial assets and liabilities that are not carried at fair value approximate fair values due to the relatively short term maturity of these financial instruments.
16. CAPITAL MANAGEMENT
The capital of the Fund can vary depending on the demand for creation and cancellation of units to the Fund.
The Fund’s objectives for managing capital are:
a. To invest in investments meeting the description, risk exposure and expected return indicated in its prospectus;
b. To maintain sufficient liquidity to meet the expenses of the Fund, and to meet cancellation requests as they arise; and
c. To maintain sufficient fund size to make the operation of the Fund cost-efficient.
No changes were made to the capital management objectives, policies or processes during the current and previous financial year.

This page has been intentionally left blank

KENANGA GLOBAL OPPORTUNITIES FUND(FORMERLY KNOWN AS ING GLOBAL OPPORTUNITIES)
ANNUAL REPORT
For the Financial Year Ended 28 February 2014
Investor Services CenterToll Free Line: 1 800 88 3737Fax: +603 2057 3722Email: [email protected]
Head Office, Kuala LumpurSuite 12.02, 12th Floor, Kenanga International, Jalan Sultan Ismail, 50250 Kuala Lumpur, Malaysia.Tel: 03-2057 3688 Fax: 03-2161 8807
Kenanga Investors Berhad (353563-P)