KENA COVID-19 MARKET MONITORING INITIATIVE IN MOMBASA ...
5
KENYA COVID-19 MARKET MONITORING INITIATIVE IN MOMBASA INFORMAL SETTLEMENTS November 2020 BACKGROUND ASSESSMENT COVERAGE The total number of positive COVID-19 cases in Kenya stands at 83,316 as of 29 November 2020. Social distancing measures, including the temporary closing of venues and large public gatherings, were put in place to prevent the spread of the virus. These measures, while necessary from a public health perspective, are likely to negatively impact market systems on which vulnerable populations in Mombasa informal settlements depend. In an urgent response to the growing humanitarian needs in light of COVID-19, the Kenya Cash Consortium (KCC), led by OXFAM in partnership with Concern Worldwide, ACTED, the Kenya Red Cross, Wangu Kanja Foundation and Centre for Rights Education and Awareness (CREAW) are implementing an emergency cash assistance programme for the affected populations in the 39 informal settlements in Changamwe, Jomvu, Kisauni, Likoni, Mvita and Nyali sub-counties. The World Food Programme (WFP) is also providing cash transfers to approximately 24,000 targeted households (HHs) in informal settlements in Mombasa County, who have lost their income and livelihoods, as a result of COVID-19. To understand the market systems and inform humanitarian programming in light of COVID-19, IMPACT Initiatives on behalf of the KCC and WFP, conducted a joint market monitoring exercise in the informal settlements in the six sub-counties where the KCC and WFP are implementing cash assistance programs. The second round of joint market monitoring followed round one conducted in October by IMPACT Initiatives and will be followed by the third round of joint market monitoring that will be conducted in December 2020. This factsheet presents an overview of median prices of food and non-food items, stock levels, days required to restock and challenges experienced by the community and retailers in light of COVID-19. These findings are indicative for the assessed locations and time frame in which the data was collected. Data collection for the second round of monthly market monitoring was conducted through key informant interviews with 437 purposively selected retailers (who purchase items from wholesalers and manufacturers then sell to the general public) from 18 to 20 November 2020. The interviews were conducted with retailers selling food and non-food items in the informal settlements. The retailers were asked about the price of fuel, water, critical non-food items (NFIs) and all food components of the minimum expenditure basket (MEB). In addition, retailers were asked about their stock levels, days required for restocking and challenges relating to supply. A total of 32 items were assessed. Data was collected remotely through phone based interviews in order to reduce the risk of contracting and spreading COVID-19. All findings are indicative, rather than representative, of key item prices and retailers’ experiences at the time of data collection. For more information on the methodology, please refer to the terms of reference. METHODOLOGY
Transcript of KENA COVID-19 MARKET MONITORING INITIATIVE IN MOMBASA ...

KENYA COVID-19 MARKET MONITORING INITIATIVE IN MOMBASA INFORMAL SETTLEMENTS November 2020
BACKGROUND
ASSESSMENT COVERAGE
The total number of positive COVID-19 cases in Kenya stands at 83,316 as of 29 November 2020. Social distancing measures, including the temporary closing of venues and large public gatherings, were put in place to prevent the spread of the virus. These measures, while necessary from a public health perspective, are likely to negatively impact market systems on which vulnerable populations in Mombasa informal settlements depend.
In an urgent response to the growing humanitarian needs in light of COVID-19, the Kenya Cash Consortium (KCC), led by OXFAM in partnership with Concern Worldwide, ACTED, the Kenya Red Cross, Wangu Kanja Foundation and Centre for Rights Education and Awareness (CREAW) are implementing an emergency cash assistance programme for the affected populations in the 39 informal settlements in Changamwe, Jomvu, Kisauni, Likoni, Mvita and Nyali sub-counties. The World Food Programme (WFP) is also providing cash transfers to approximately 24,000 targeted households (HHs) in informal settlements in Mombasa County, who have lost their
income and livelihoods, as a result of COVID-19.
To understand the market systems and inform humanitarian programming in light of COVID-19, IMPACT Initiatives on behalf of the KCC and WFP, conducted a joint market monitoring exercise in the informal settlements in the six sub-counties where the KCC and WFP are implementing cash assistance programs. The second round of joint market monitoring followed round one conducted in October by IMPACT Initiatives and will be followed by the third round of joint market monitoring that will be conducted in December 2020. This factsheet presents an overview of median prices of food and non-food items, stock levels, days required to restock and challenges experienced by the community and retailers in light of COVID-19. These findings are indicative for the assessed locations and time frame in which the data was collected.
Data collection for the second round of monthly market monitoring was conducted through key informant interviews with 437 purposively selected retailers (who purchase items from wholesalers and manufacturers then sell to the general public) from 18 to 20 November 2020. The interviews were conducted with retailers selling food and non-food items in the informal settlements. The retailers were asked about the price of fuel, water, critical non-food items (NFIs) and all food components of the minimum expenditure
basket (MEB). In addition, retailers were asked about their stock levels, days required for restocking and challenges relating to supply. A total of 32 items were assessed. Data was collected remotely through phone based interviews in order to reduce the risk of contracting and spreading COVID-19. All findings are indicative, rather than representative, of key item prices and retailers’ experiences at the time of data collection. For more information on the methodology, please refer to the terms of reference.
METHODOLOGY
KENYA COVID-19 MARKET MONITORING INITIATIVE IN MOMBASA INFORMAL SETTLEMENTS November 2020
Category CommoditiesFood items
Cow peas 1Kg Beans 1Kg Tea leaves 50g Sugar 1Kg Tomatoes 1kg Onions 1Kg Cattle meat 1KgWhite maize 1Kg Vegetable oil 1L Wheat flour 1Kg Salt 500g Cabbages 500g Cattle milk 1L Goat meat 1 Kg
Pigeon peas 1Kg Green grams 1Kg Maize flour 1Kg Rice 1KgNon-food Items
Sanitary pads 8 pack Buckets 20L Firewood 1 bundle Water 20 L Charcoal 2Kg Pens 1 Pc Exercise booksFacial masks 1pc Jerry cans 20L Kerosene 1L Gas 6Kg Bar soaps 200g Pencils 1 Pc Rubber 1Pc
Key food and non-food items assessed
50
200
Change in median prices for non-food items in KES1 (October to November 2020)
85
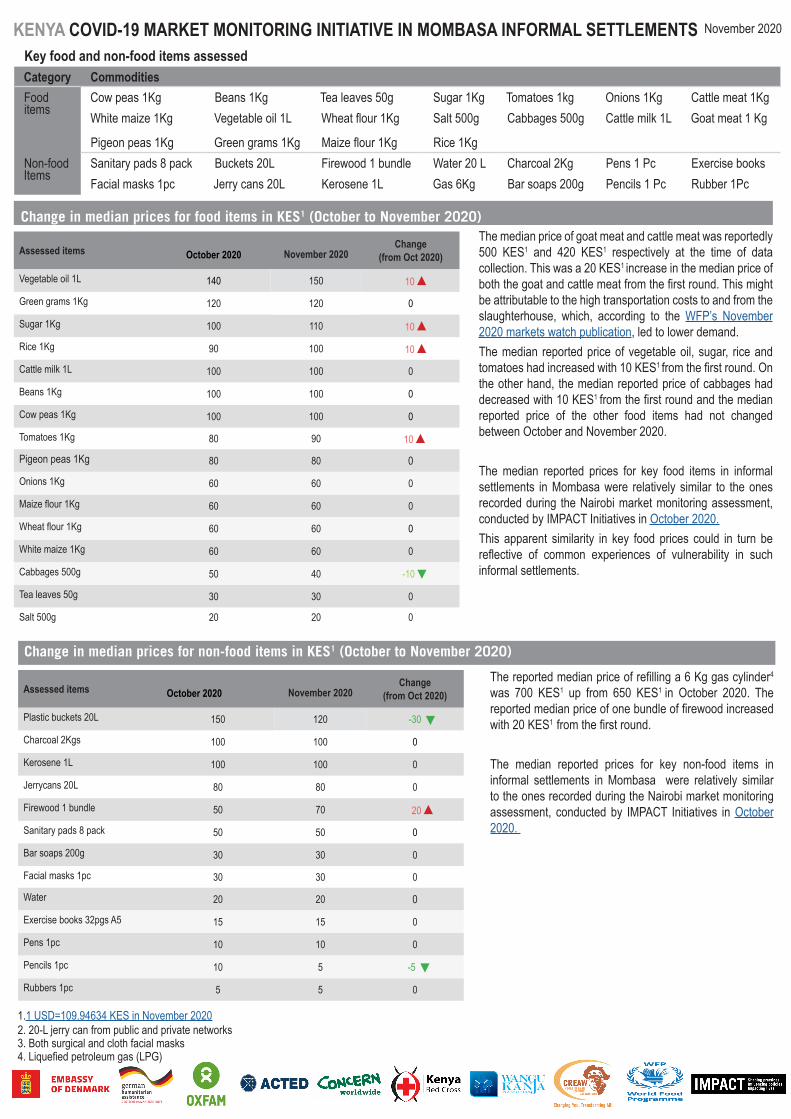
1.1 USD=109.94634 KES in November 20202. 20-L jerry can from public and private networks3. Both surgical and cloth facial masks4. Liquefied petroleum gas (LPG)
Change in median prices for food items in KES1 (October to November 2020)The median price of goat meat and cattle meat was reportedly 500 KES1 and 420 KES1 respectively at the time of data collection. This was a 20 KES1 increase in the median price of both the goat and cattle meat from the first round. This might be attributable to the high transportation costs to and from the slaughterhouse, which, according to the WFP’s November 2020 markets watch publication, led to lower demand.The median reported price of vegetable oil, sugar, rice and tomatoes had increased with 10 KES1 from the first round. On the other hand, the median reported price of cabbages had decreased with 10 KES1 from the first round and the median reported price of the other food items had not changed between October and November 2020.
The median reported prices for key food items in informal settlements in Mombasa were relatively similar to the ones recorded during the Nairobi market monitoring assessment, conducted by IMPACT Initiatives in October 2020.This apparent similarity in key food prices could in turn be reflective of common experiences of vulnerability in such informal settlements.
The reported median price of refilling a 6 Kg gas cylinder4 was 700 KES1 up from 650 KES1 in October 2020. The reported median price of one bundle of firewood increased with 20 KES1 from the first round.
The median reported prices for key non-food items in informal settlements in Mombasa were relatively similar to the ones recorded during the Nairobi market monitoring assessment, conducted by IMPACT Initiatives in October 2020.
Assessed items October 2020 November 2020Change
(from Oct 2020)
Vegetable oil 1L 140 150 10
Green grams 1Kg 120 120 0
Sugar 1Kg 100 110 10
Rice 1Kg 90 100 10
Cattle milk 1L 100 100 0
Beans 1Kg 100 100 0
Cow peas 1Kg 100 100 0
Tomatoes 1Kg 80 90 10
Pigeon peas 1Kg 80 80 0
Onions 1Kg 60 60 0
Maize flour 1Kg 60 60 0
Wheat flour 1Kg 60 60 0
White maize 1Kg 60 60 0
Cabbages 500g 50 40 -10
Tea leaves 50g 30 30 0
Salt 500g 20 20 0
Assessed items October 2020 November 2020Change
(from Oct 2020)
Plastic buckets 20L 150 120 -30
Charcoal 2Kgs 100 100 0
Kerosene 1L 100 100 0
Jerrycans 20L 80 80 0
Firewood 1 bundle 50 70 20
Sanitary pads 8 pack 50 50 0
Bar soaps 200g 30 30 0
Facial masks 1pc 30 30 0
Water 20 20 0
Exercise books 32pgs A5 15 15 0
Pens 1pc 10 10 0
Pencils 1pc 10 5 -5
Rubbers 1pc 5 5 0

KENYA COVID-19 MARKET MONITORING INITIATIVE IN MOMBASA INFORMAL SETTLEMENTS November 2020
Reported stock and supply levels (in days) for food and non-food items:
Sector ItemsNovember days needed to restock
October Stock November stock % change in stock from October to November 2020
Food items Cattle milk 1 3 5 67%Goat meat 1 2 3 50%Tea leaves 1 11 15 36%Salt 1 15 18 20%Onions 1 6 7 17%Sugar 1 8 9 13%White maize 1 11 12 9%Cabbages 1 3 3 0%Cattle meat 1 2 2 0%Green grams 1 10 10 0%Pigeon peas 1 10 10 0%Vegetable oil 1 7 7 0%Wheat flour 1 7 7 0%Cow peas 1 12 11 -8%Beans 1 10 9 -10%Maize flour 1 6 5 -17%Rice 1 10 8 -20%Tomatoes 1 4 3 -25%Average 1 7 8 14%
Non-food-items Rubbers 1 23 31 35%Sanitary pads 1 14 17 21%Pencils 1 22 26 18%Bar soaps 1 11 13 18%Exercise books 1 23 26 13%Pens 1 22 23 9%Jerry cans 2 7 7 0%Kerosene 1 9 9 0%Face masks3 1 13 13 0%Gas4 1 11 10 -9%Firewood 4 19 17 -11%Buckets 2 9 8 -11%Charcoal 3 16 12 -25%Average 2 15 16 7%
84+36+1263+42+34+21+13
For all assessed items, the reported stock levels exceeded the number of days it reportedly took to restock, indicating that there were no imminent shortages of any of the assessed key items at the time of data collection.
On average, the number of days retailers reported expecting their current stock to last increased from 7 days in October to 8 days in November for food items and from 15 days in October to 16 days in November for non-food items. The average reported number of days needed to restock food items had remained the same for all the assessed food items (1 day on average) between October and November. The average reported number of days
needed to restock most of the non-food items went down from 2 days on average to 1 day on average except for charcoal (3 days on average, down from 4 days), firewood (4 days on average, up from 3 days) and buckets and jerry cans remained at 2 days on average.
Overall, most interviewed retailer key informants (42%) reported usually purchasing goods from wholesalers in the Mombasa central business district, while some reportedly purchase from wholesalers within their own sub-counties (30%), or mainly import goods from abroad (23%).

KENYA COVID-19 MARKET MONITORING INITIATIVE IN MOMBASA INFORMAL SETTLEMENTS November 2020
5. Multiple answers could be selected and thus findings might exceed 100%6. The retailers were asked if they knew any retailers that closed down their business. There is a possibility of duplication in the number of retailers who closed down their business because several interviewed retailers from the same settlement could have been referring to the same retailers that reportedly closed down their businesses.7. This was a sub-set of the 82% of retailers that reported their number of customers had changed in the 30 days prior to data collection.
Overall, 82% of retailers reported their number of customers had changed in the 30 days prior to data collection. Of those, 81% reported having perceived a decrease in customers (90% reported this in October) while 16% reported having perceived an increase (up from 10% in October). Of the retailers that reported an increase in the number of customers, 95% attributed the increase to people adapting to the COVID-19 situation. Of the retailers that reported a decrease in the number of customers, 88% attributed the decrease to a low purchasing power among community members.
Most commonly reported reported demand and supply challenges by retailers reporting facing such challenges at the time of data collection:5
39%32%33%26%
Most commonly reported challenges for community in accessing markets, by % of retailers reporting that community members face challenges accessing markets:5
The proportion of retailers reporting that community members were facing challenges in accessing markets increased from 61% in October to 67% in November. Of the retailers reporting community members faced challenges, 91% attributed this to a low purchasing power (among other reasons). Notably, among those retailers reporting challenges, the proportion indicating a “lack of items” to be a challenge decreased considerably, from 26% in October to 3% in November.
Low purchasing powerItems are too expensiveLack of items
81%24%26%
Increased price Lack of money to restockDecreased demand Lack of commodities from the supplier
Reported market challenges for retailers and community members in light of COVID-19
91+26+3
42+33+33+30Retailers were asked if they knew of any businesses that had closed down close to their stand as a result of COVID-19 related challenges. In October, an estimated 7086 businesses had reportedly closed down, followed by an additional 4566 in November. In Mvita, the number of retailers that had reportedly closed their business(es) due to COVID-19 in October and November was relatively high compared to other assessed locations, which might be due to the fact that Mvita sub-county recorded a higher number of COVID-19 cases than other sub-counties as of 29 November 2020.The estimated number of businesses reportedly closed down in November had decreased in Mvita, Kisauni and Changamwe but had increased in Jomvu, Nyali and Likoni.
Total number of businesses reportedly closed in October and November due to COVID-19 restrictions, per sub-county:
310
128 132
46
92
32
91
156
73 74
10 18
Octo
ber
Nove
mbe
r
Octo
ber
Nove
mbe
r
Octo
ber
Nove
mbe
r
Octo
ber
Nove
mbe
r
Octo
ber
Nove
mbe
r
Octo
ber
Nove
mbe
r
Mvita Kisauni Changamwe Jomvu Nyali Likoni
91%26%
3%
October November
The proportion of retailers that reported encountering challenges while restocking some of the items that they sell increased from 54% in October to 71% in November. Out of these retailers, 15% specifically reported encountering challenges in restocking firewood, commonly mentioning the high prices for firewood (45%), the lack of money to restock firewood (45%), and the unavailability of firewood (40%).
In addition, 75% of retailers reported facing demand and supply challenges at the time of data collection (up from 63% in October), most commonly attributing such challenges to an increase in key item prices.
Most commonly reported reasons for the increase in number of customers buying from retailers in the 30 days prior to data collection:5, 7
95%35%18%
People adapting to the COVID-19 situationPublic education on protection against COVID-19 Community members received cash transfers
80+35+18
88%4%3%
Low purchasing powerItems are too expensiveLack of items
70+4+3Most commonly reported reasons for the decrease in number of customers buying from retailers in the 30 days prior to data collection:5, 7
October November42%33%33%30%
KENYA COVID-19 MARKET MONITORING INITIATIVE IN MOMBASA INFORMAL SETTLEMENTS November 2020
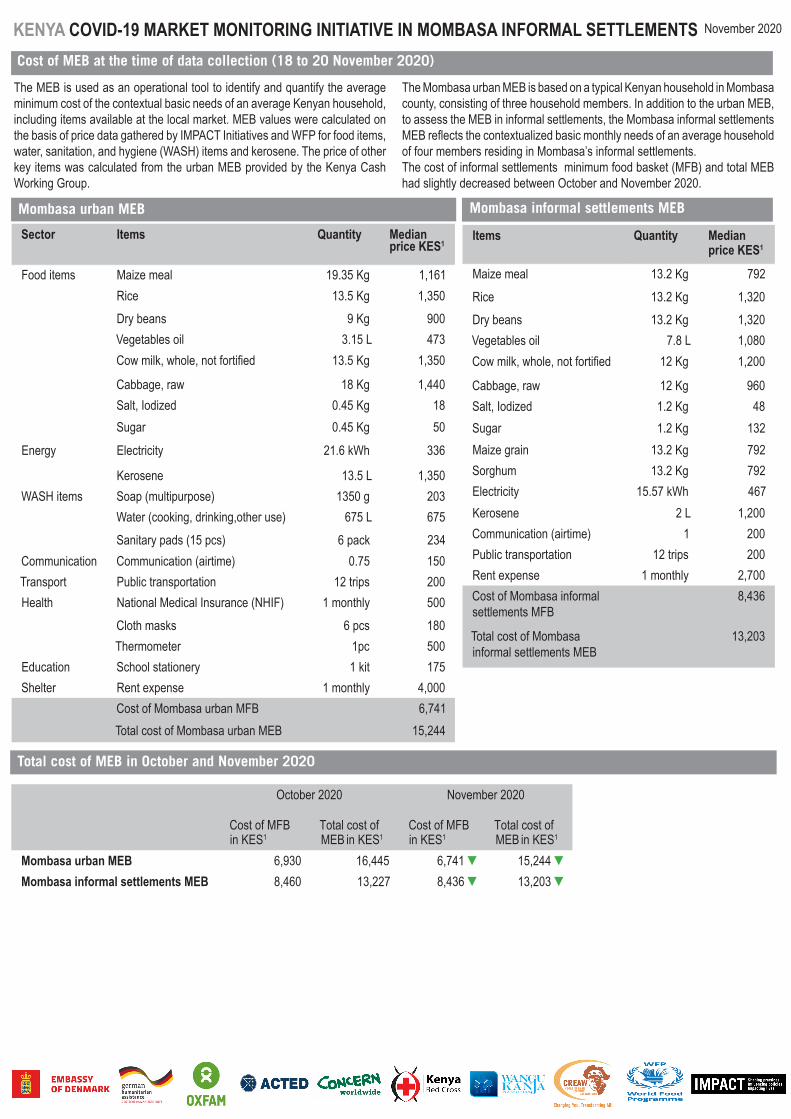
Cost of MEB at the time of data collection (18 to 20 November 2020)
The MEB is used as an operational tool to identify and quantify the average minimum cost of the contextual basic needs of an average Kenyan household, including items available at the local market. MEB values were calculated on the basis of price data gathered by IMPACT Initiatives and WFP for food items, water, sanitation, and hygiene (WASH) items and kerosene. The price of other key items was calculated from the urban MEB provided by the Kenya Cash Working Group.
The Mombasa urban MEB is based on a typical Kenyan household in Mombasa county, consisting of three household members. In addition to the urban MEB, to assess the MEB in informal settlements, the Mombasa informal settlements MEB reflects the contextualized basic monthly needs of an average household of four members residing in Mombasa’s informal settlements.The cost of informal settlements minimum food basket (MFB) and total MEB had slightly decreased between October and November 2020.
Sector Items Quantity Median price KES1
Food items Maize meal 19.35 Kg 1,161 Rice 13.5 Kg 1,350Dry beans 9 Kg 900Vegetables oil 3.15 L 473Cow milk, whole, not fortified 13.5 Kg 1,350
Cabbage, raw 18 Kg 1,440Salt, Iodized 0.45 Kg 18Sugar 0.45 Kg 50
Energy Electricity 21.6 kWh 336
Kerosene 13.5 L 1,350WASH items Soap (multipurpose) 1350 g 203
Water (cooking, drinking,other use) 675 L 675Sanitary pads (15 pcs) 6 pack 234
Communication Communication (airtime) 0.75 150Transport Public transportation 12 trips 200Health National Medical Insurance (NHIF) 1 monthly 500
Cloth masks 6 pcs 180Thermometer 1pc 500
Education School stationery 1 kit 175Shelter Rent expense 1 monthly 4,000
Cost of Mombasa urban MFB 6,741Total cost of Mombasa urban MEB 15,244
Items Quantity Median price KES1
Maize meal 13.2 Kg 792 Rice 13.2 Kg 1,320Dry beans 13.2 Kg 1,320Vegetables oil 7.8 L 1,080Cow milk, whole, not fortified 12 Kg 1,200
Cabbage, raw 12 Kg 960Salt, Iodized 1.2 Kg 48Sugar 1.2 Kg 132Maize grain 13.2 Kg 792Sorghum 13.2 Kg 792Electricity 15.57 kWh 467Kerosene 2 L 1,200Communication (airtime) 1 200Public transportation 12 trips 200Rent expense 1 monthly 2,700Cost of Mombasa informal settlements MFB
8,436
Total cost of Mombasa informal settlements MEB
13,203
Mombasa urban MEB Mombasa informal settlements MEB
October 2020 November 2020
Cost of MFB in KES1
Total cost of MEB in KES1
Cost of MFB in KES1
Total cost of MEB in KES1
Mombasa urban MEB 6,930 16,445 6,741 15,244 Mombasa informal settlements MEB 8,460 13,227 8,436 13,203
Total cost of MEB in October and November 2020