Ken Black QA ch10
47
Business Statistics, 5 th ed. by Ken Black Chapter 10 Statistical Inferences about Two Populations Discrete Distributions PowerPoint presentations prepared by Lloyd Jaisingh, Morehe ad State Univ ersity
-
Upload
rushabh-vora -
Category
Documents
-
view
243 -
download
2
Transcript of Ken Black QA ch10
8/3/2019 Ken Black QA ch10
http://slidepdf.com/reader/full/ken-black-qa-ch10 1/47
Business Statistics, 5th ed.
by Ken Black
Chapter 10
Statistical Inferences about
Two Populations
Discrete Distributions
PowerPoint presentations prepared by Lloyd Jaisingh, Morehead State University
8/3/2019 Ken Black QA ch10
http://slidepdf.com/reader/full/ken-black-qa-ch10 2/47
Learning Objectives
• Test hypotheses and construct confidenceintervals about the difference in two
population means using the Z statistic.• Test hypotheses and construct confidence
intervals about the difference in twopopulation means using the t statistic.
8/3/2019 Ken Black QA ch10
http://slidepdf.com/reader/full/ken-black-qa-ch10 3/47
Learning Objectives
• Test hypotheses and construct confidenceintervals about the difference in tworelated populations.
• Test hypotheses and construct confidenceintervals about the differences in twopopulation proportions.
• Test hypotheses and construct confidence
intervals about two population variances.
8/3/2019 Ken Black QA ch10
http://slidepdf.com/reader/full/ken-black-qa-ch10 4/47
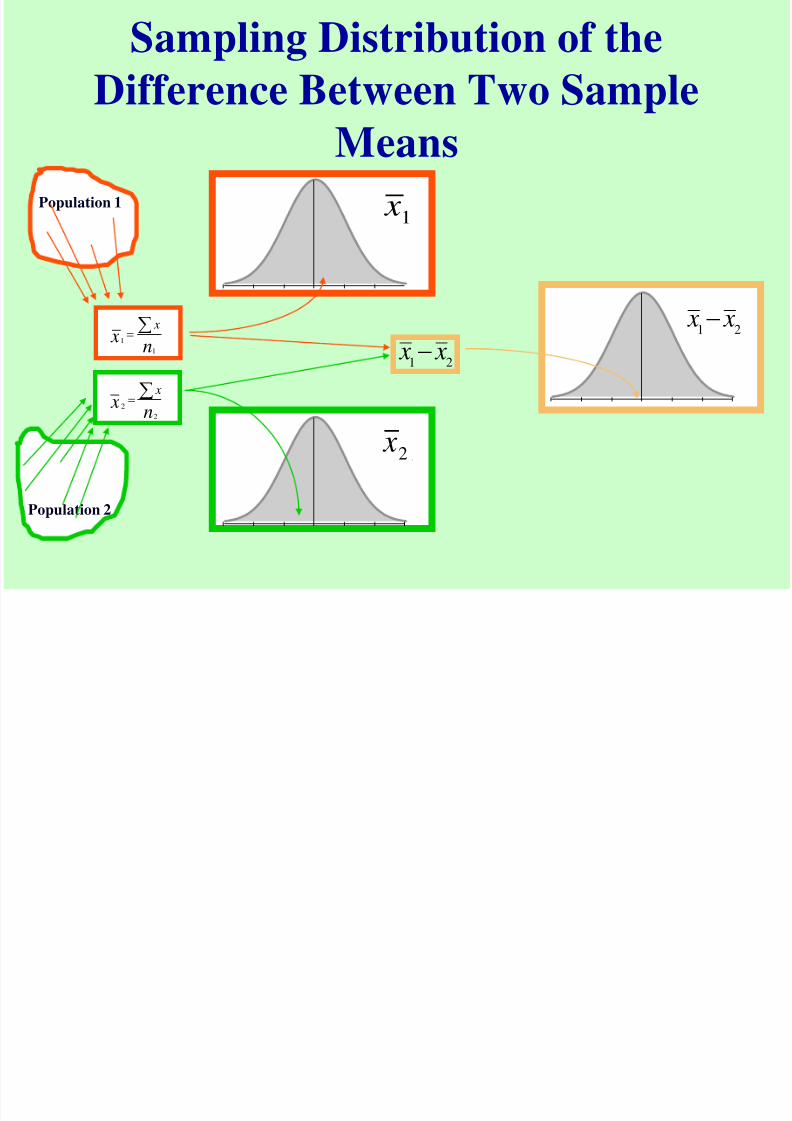
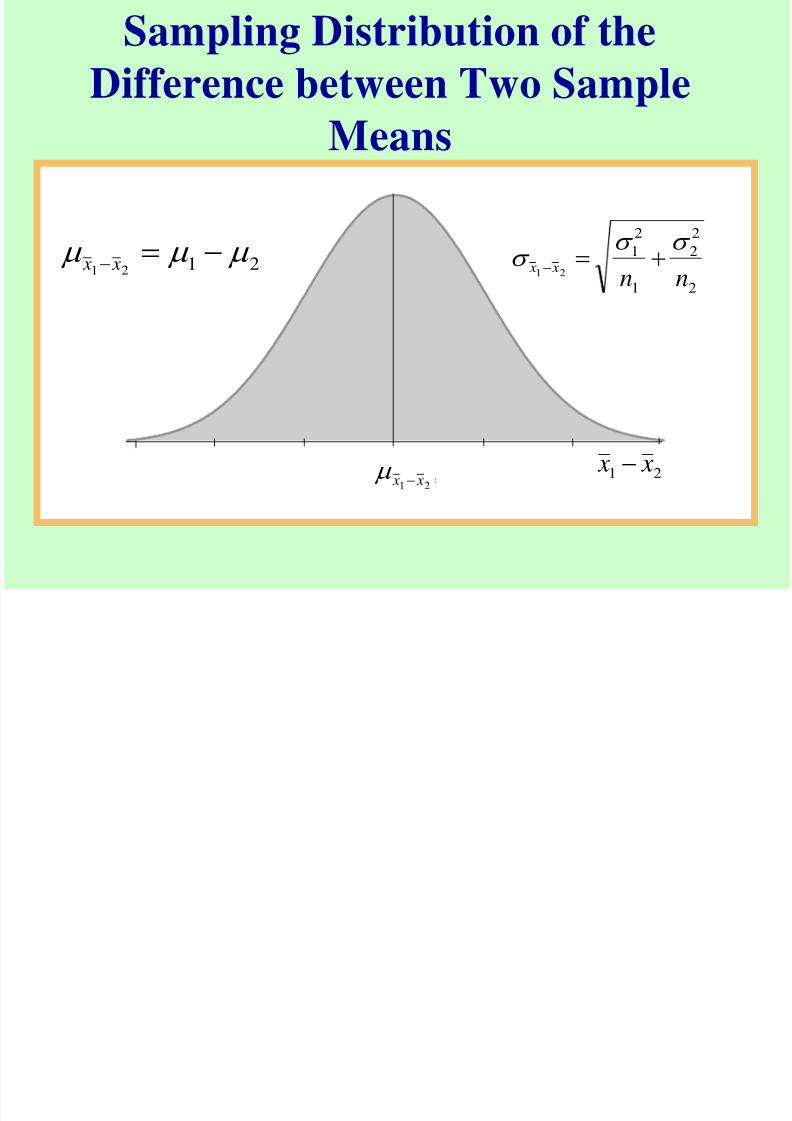
Sampling Distribution of the
Difference Between Two Sample
Means
n x
x
1
1
Population 1
Population 2
n x
x
2
2
1 X
2 X
1 x
2 x
21x x
21x x
8/3/2019 Ken Black QA ch10
http://slidepdf.com/reader/full/ken-black-qa-ch10 5/47
Sampling Distribution of the
Difference between Two Sample
Means
1 2 X X
1 2 X X
1 2
1
2
1
2
2
2 X X n n
1 2
1 2 X X
2121
x x
2
2
2
1
2
1
21 nn x x
21 x x 21 x x
8/3/2019 Ken Black QA ch10
http://slidepdf.com/reader/full/ken-black-qa-ch10 6/47
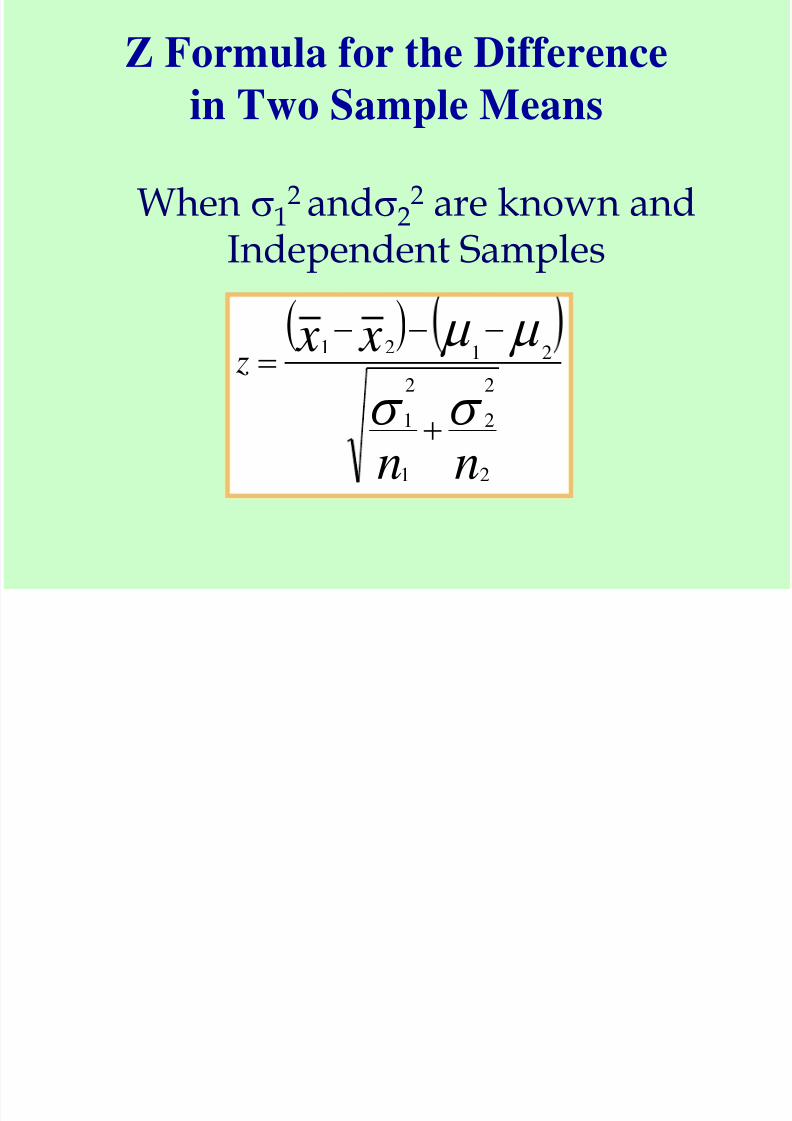
Z Formula for the Difference
in Two Sample Means
nn
x x z
2
2
2
1
2
1
2121
When 12 and2
2 are known andIndependent Samples
8/3/2019 Ken Black QA ch10
http://slidepdf.com/reader/full/ken-black-qa-ch10 7/47
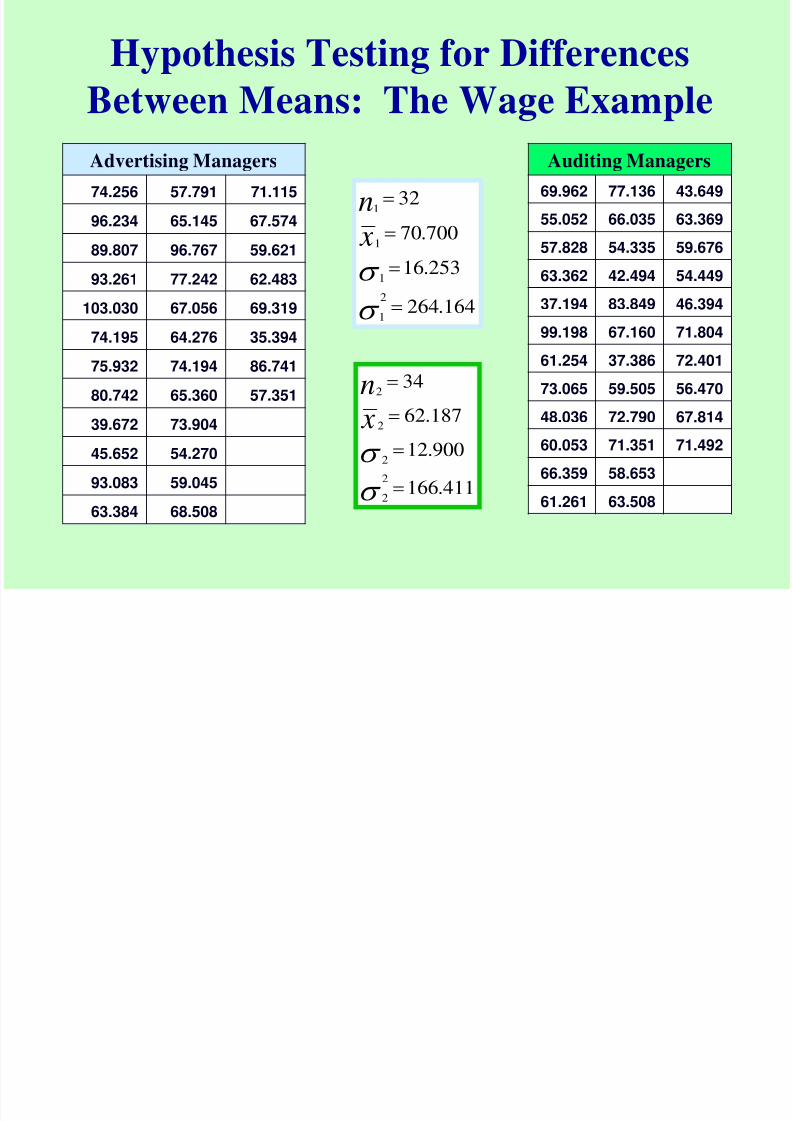
Hypothesis Testing for Differences
Between Means: The Wage Example
Advertising Managers
74.256 57.791 71.115
96.234 65.145 67.574
89.807 96.767 59.621
93.261 77.242 62.483
103.030 67.056 69.319
74.195 64.276 35.394
75.932 74.194 86.741
80.742 65.360 57.351
39.672 73.904
45.652 54.270
93.083 59.045
63.384 68.508
164.264
253.16
700.70
32
2
1
1
1
1
x
n
411.166
900.12
187.62
34
2
2
2
2
2
x
n
Auditing Managers
69.962 77.136 43.649
55.052 66.035 63.369
57.828 54.335 59.676
63.362 42.494 54.449
37.194 83.849 46.394
99.198 67.160 71.804
61.254 37.386 72.401
73.065 59.505 56.470
48.036 72.790 67.814
60.053 71.351 71.492
66.359 58.653
61.261 63.508
8/3/2019 Ken Black QA ch10
http://slidepdf.com/reader/full/ken-black-qa-ch10 8/47
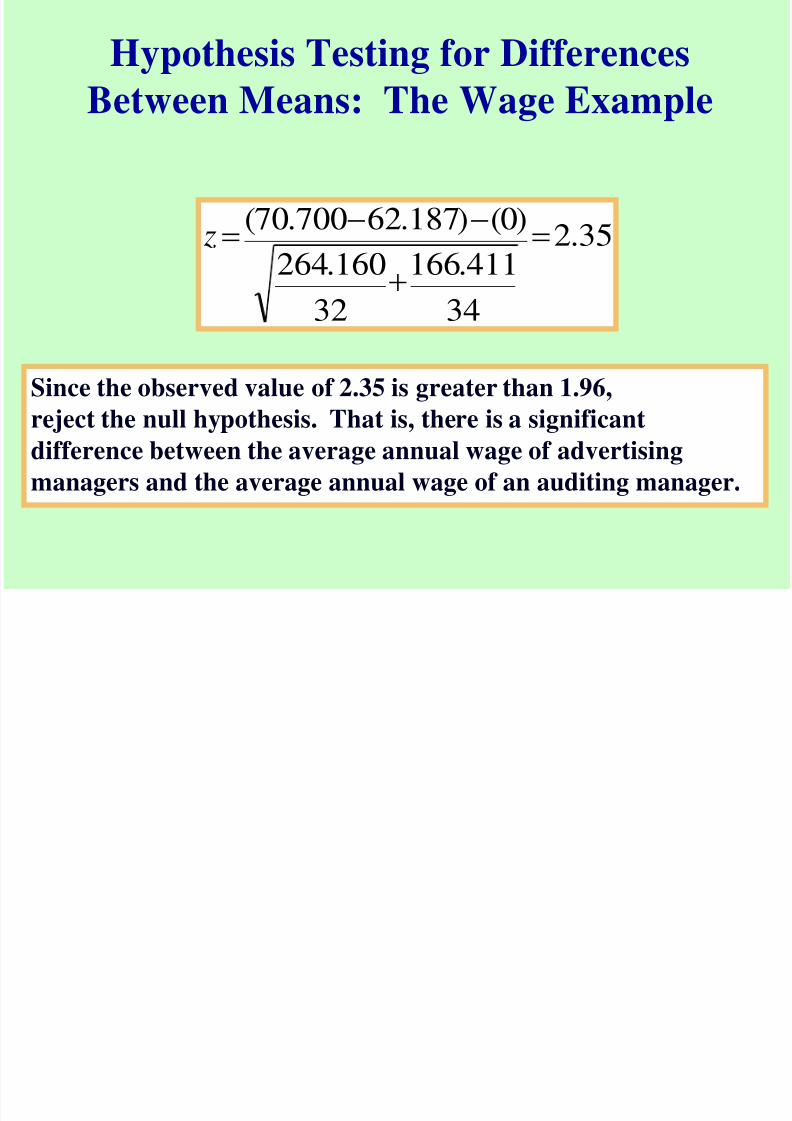
Hypothesis Testing for Differences
Between Means: The Wage Example
21
21
:
:0
a H
H
=0.05, /2 = 0.025, z0.025 = 1.96
8/3/2019 Ken Black QA ch10
http://slidepdf.com/reader/full/ken-black-qa-ch10 9/47
Hypothesis Testing for Differences
Between Means: The Wage Example
35.2
34411.166
32160.264
)0()187.62700.70(
z
Since the observed value of 2.35 is greater than 1.96,
reject the null hypothesis. That is, there is a significantdifference between the average annual wage of advertising
managers and the average annual wage of an auditing manager.
8/3/2019 Ken Black QA ch10
http://slidepdf.com/reader/full/ken-black-qa-ch10 10/47
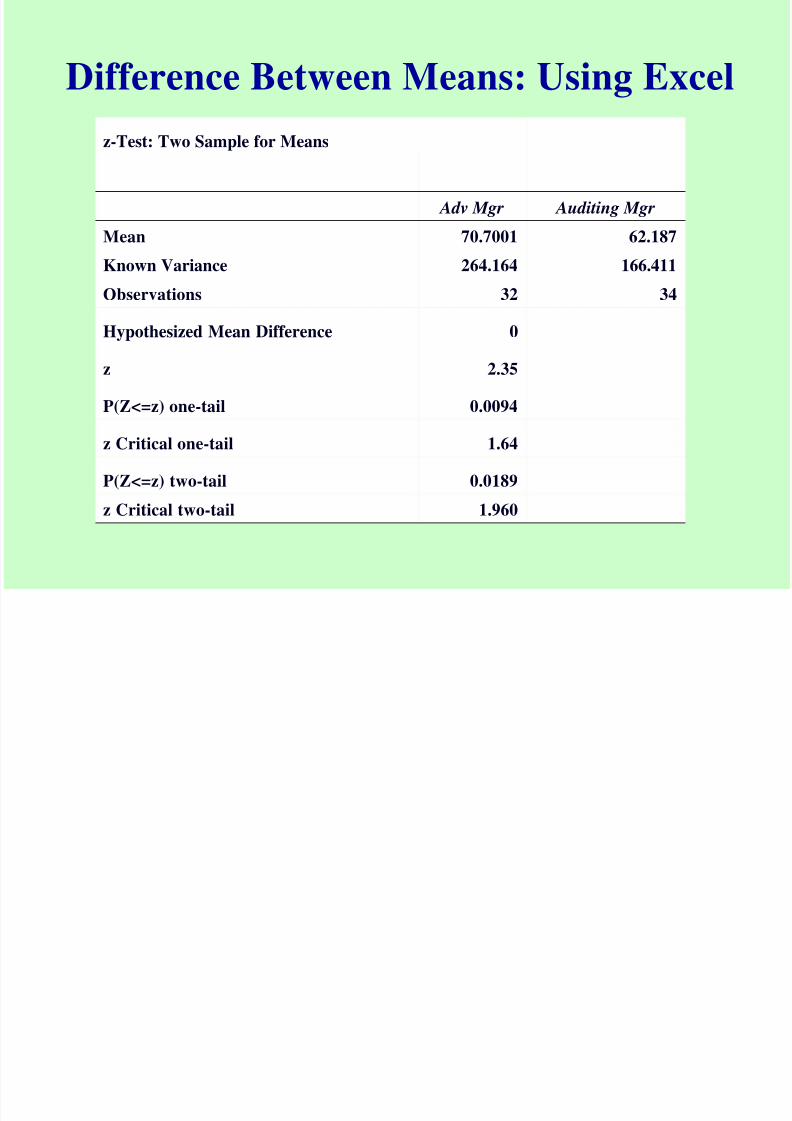
Difference Between Means: Using Excel
z-Test: Two Sample for Means
Adv Mgr Auditing Mgr
Mean 70.7001 62.187
Known Variance 264.164 166.411
Observations 32 34
Hypothesized Mean Difference 0
z 2.35
P(Z<=z) one-tail 0.0094
z Critical one-tail 1.64
P(Z<=z) two-tail 0.0189
z Critical two-tail 1.960
8/3/2019 Ken Black QA ch10
http://slidepdf.com/reader/full/ken-black-qa-ch10 11/47
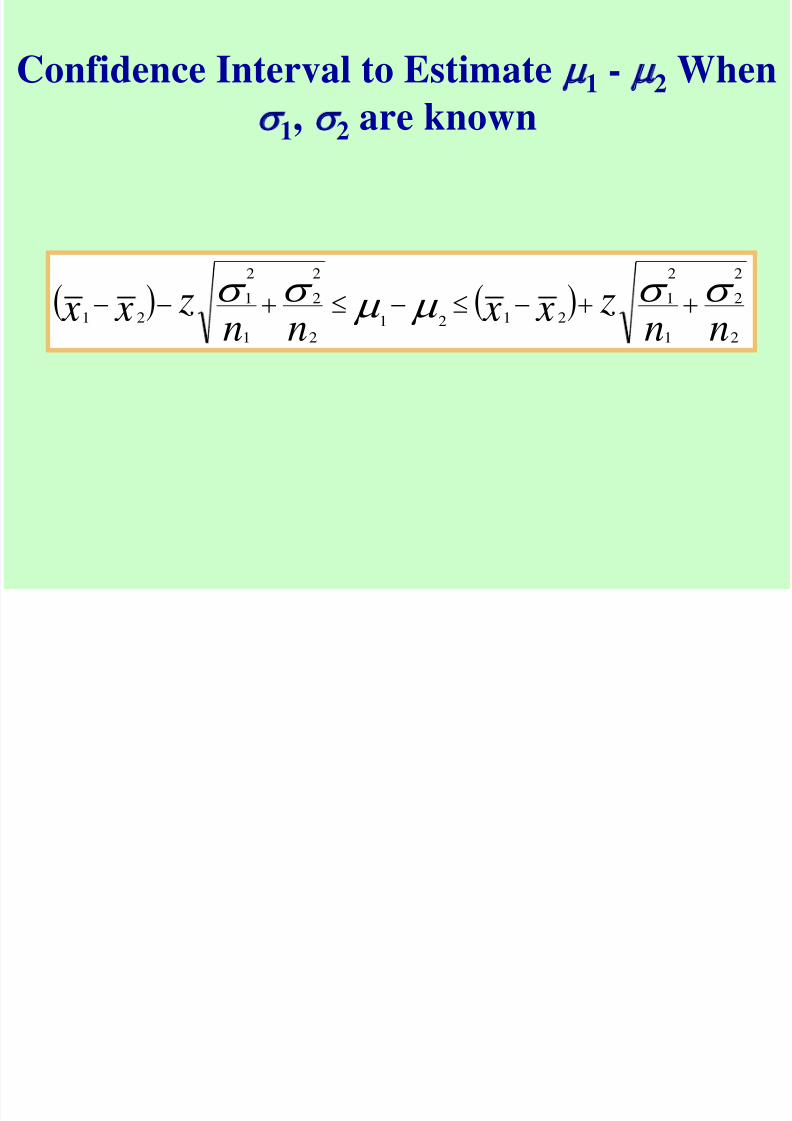
Confidence Interval to Estimate 1 - 2 When
1,
2are known
nn
z x xnn
z x x2
22
1
21
21212
22
1
21
21
8/3/2019 Ken Black QA ch10
http://slidepdf.com/reader/full/ken-black-qa-ch10 12/47
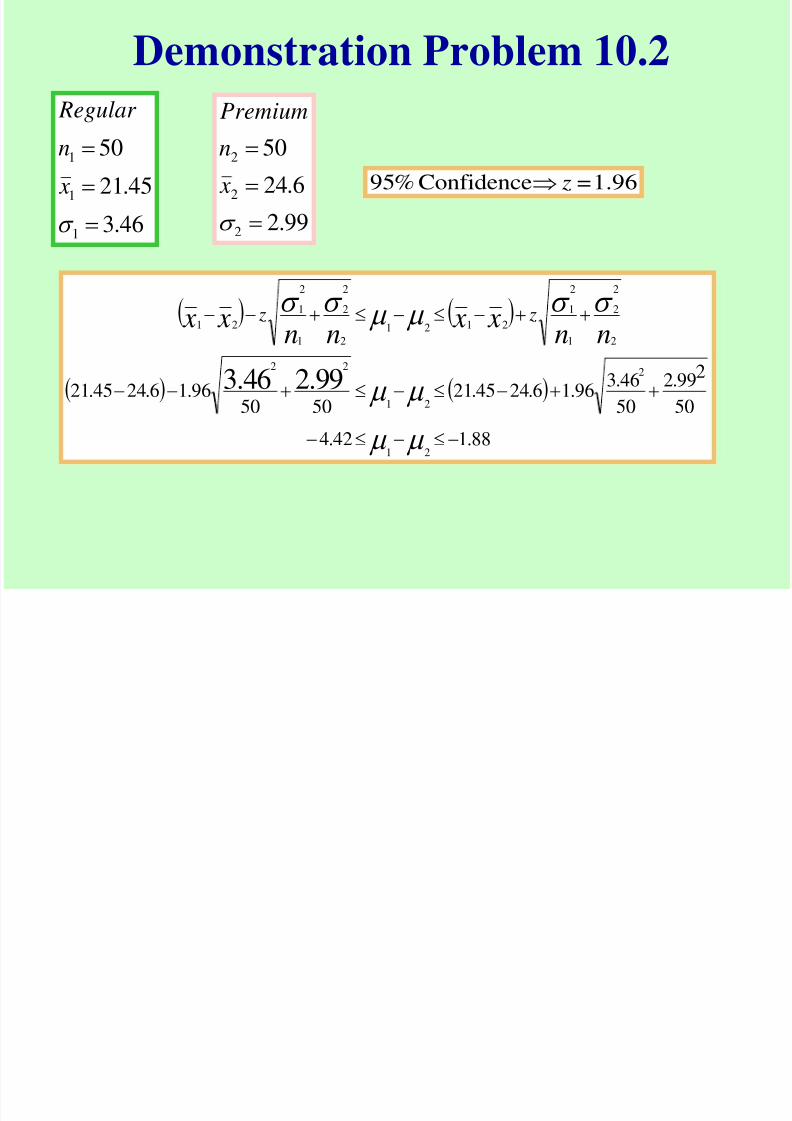
Demonstration Problem 10.2
88.142.450
99.2 2
50
46.396.16.2445.21
5050
96.16.2445.21
21
2
21
22
2
2
2
1
2
1
2121
2
2
2
1
2
1
21
99.246.3
nn x x
nn x x z z
46.3
45.21
50
1
1
1
x
n
Regular
99.2
6.24
50
2
2
2
x
n
Premium
1.96=Confidence%95 z
8/3/2019 Ken Black QA ch10
http://slidepdf.com/reader/full/ken-black-qa-ch10 13/47
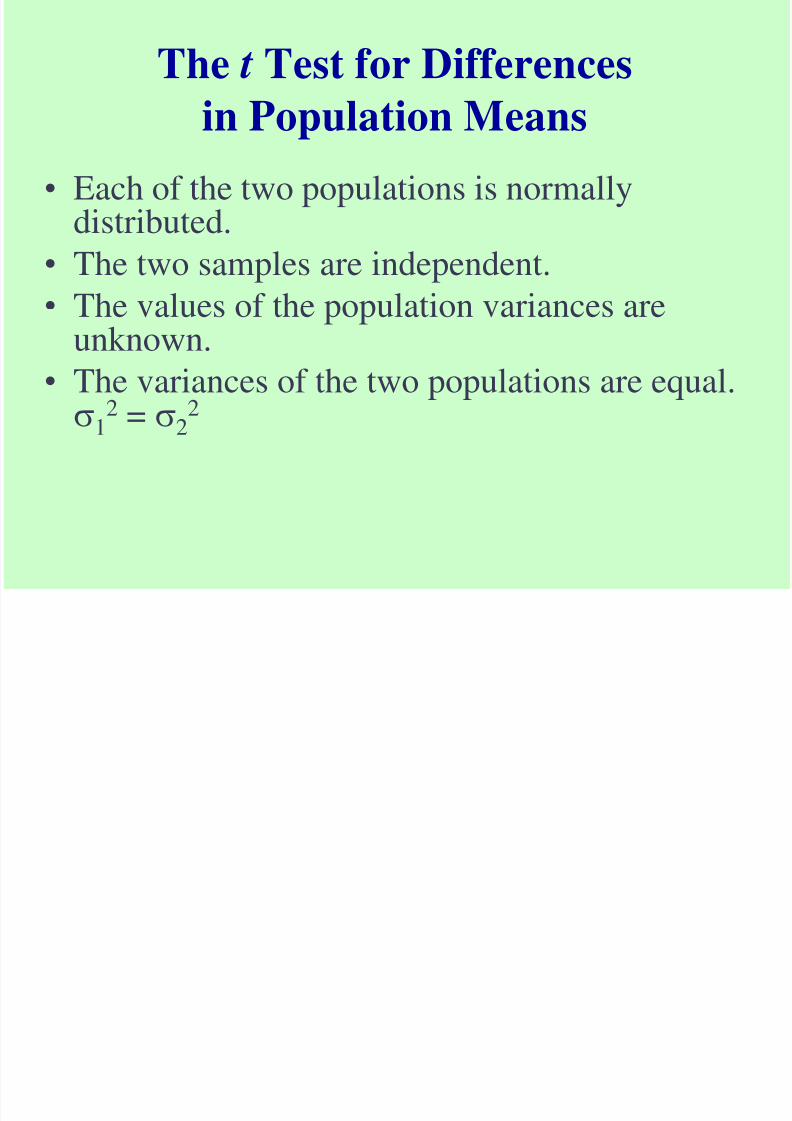
The t Test for Differences
in Population Means
• Each of the two populations is normallydistributed.
•
The two samples are independent.• The values of the population variances are
unknown.
• The variances of the two populations are equal.
12 = 22
8/3/2019 Ken Black QA ch10
http://slidepdf.com/reader/full/ken-black-qa-ch10 14/47
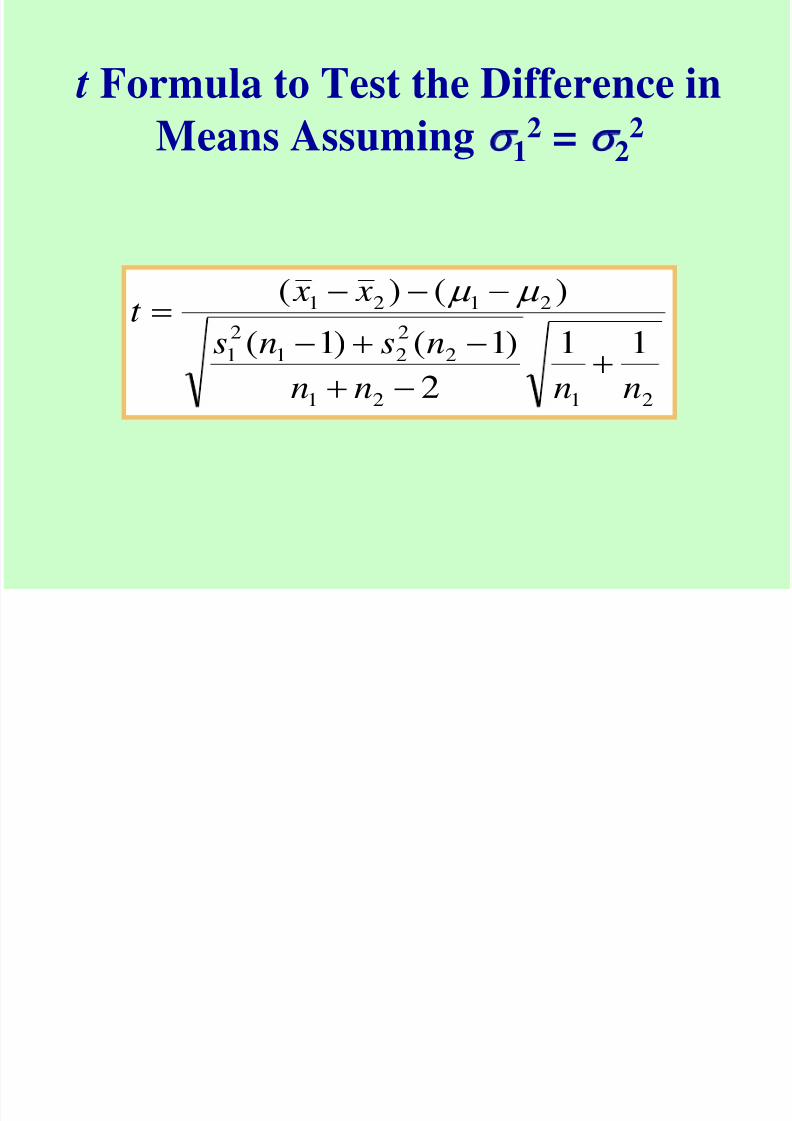
t Formula to Test the Difference in
Means Assuming 12 = 22
2121
2
2
21
2
1
2121
11
2
)1()1(
)()(
nnnn
nsns
x xt
8/3/2019 Ken Black QA ch10
http://slidepdf.com/reader/full/ken-black-qa-ch10 15/47
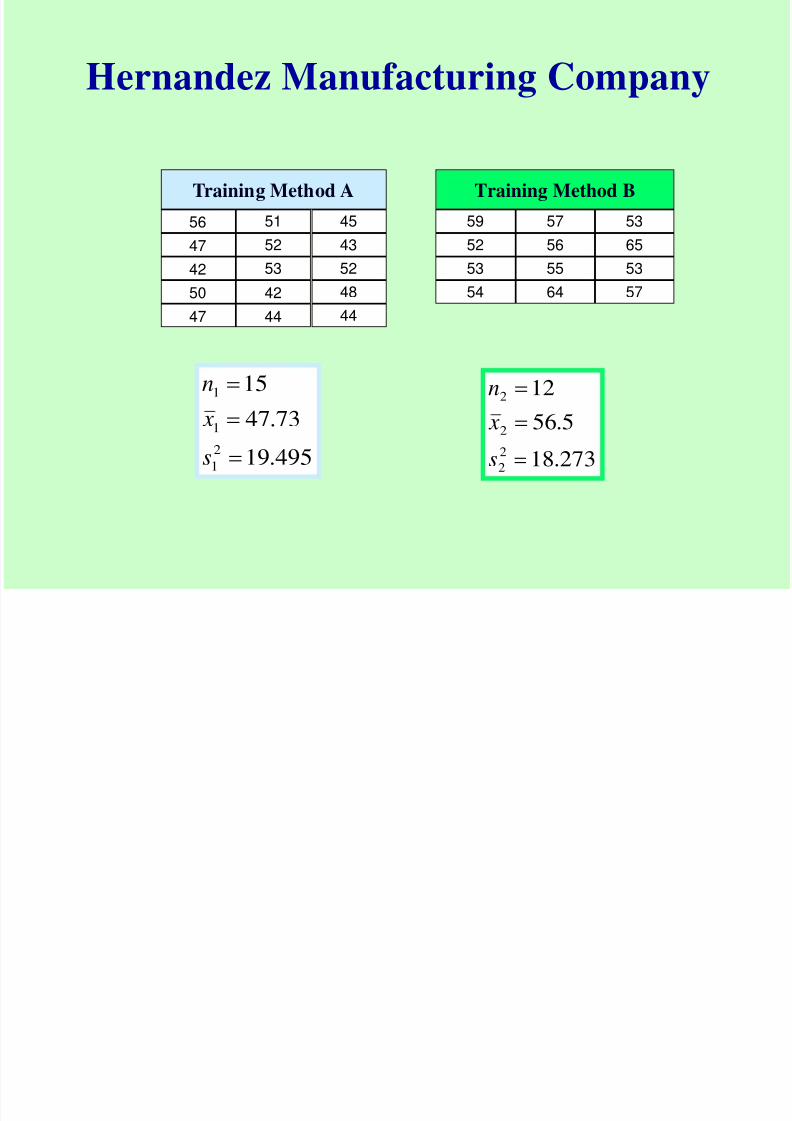
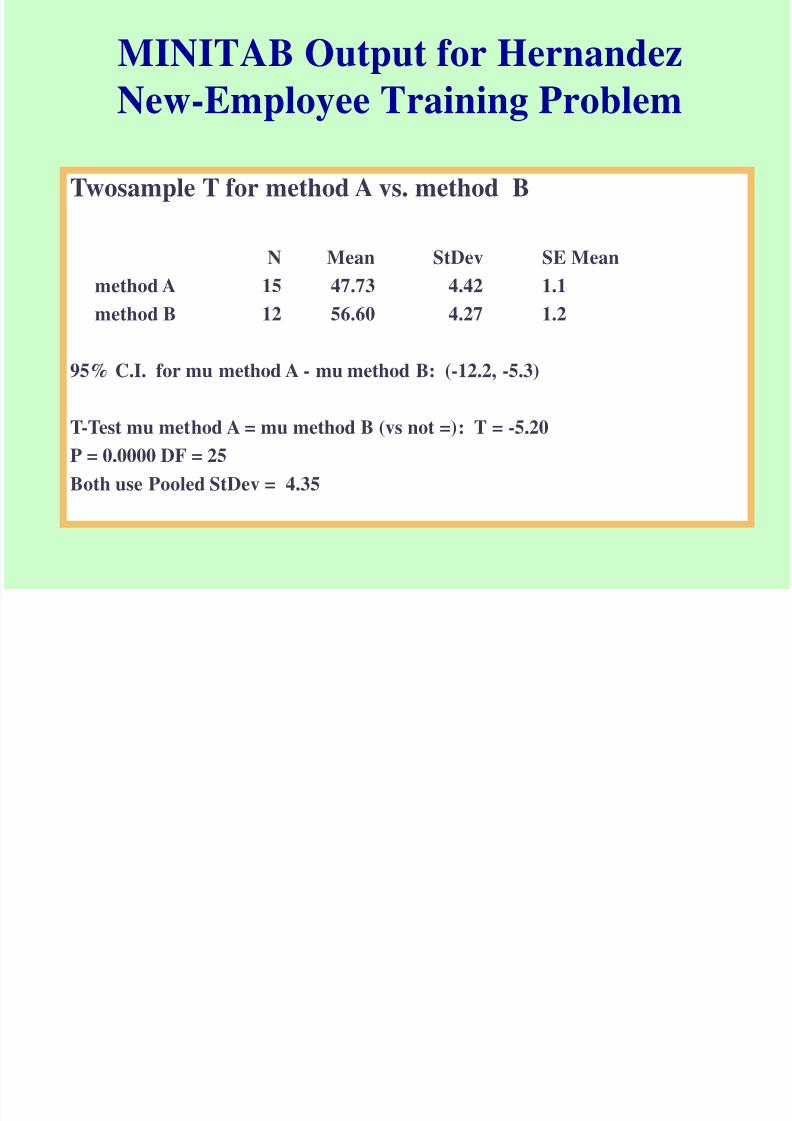
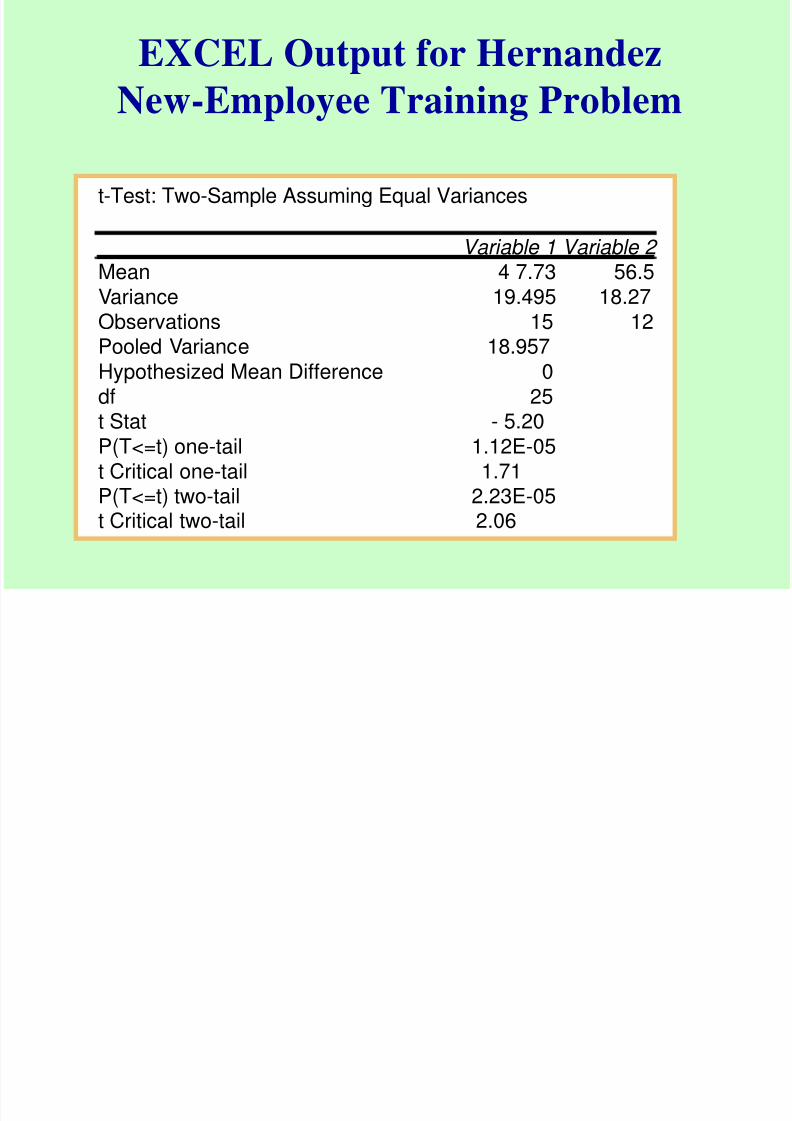
Hernandez Manufacturing Company
Training Method A
56 51 45
47 52 43
42 53 52
50 42 48
47 44 44
Training Method B
59
52
53
54
57
56
55
64
53
65
53
57
495.19
73.47
15
2
1
1
1
s
x
n
273.18
5.56
12
2
2
2
2
s
x
n
8/3/2019 Ken Black QA ch10
http://slidepdf.com/reader/full/ken-black-qa-ch10 16/47
Hernandez Manufacturing Company
(part 3)
. H t oreject-2.060,<-5.20=Since
20.5
12
1
15
1
21215
11273.1814495.19050.5673.47
11
2
)1()1(
)()(
2121
2
2
21
2
1
2121
nnnn
nsns
x xt
. H t
. H t t
o
o
rejectnotdo2.060,2.060-If
reject2.060,>or2.060-<If
8/3/2019 Ken Black QA ch10
http://slidepdf.com/reader/full/ken-black-qa-ch10 17/47
MINITAB Output for Hernandez
New-Employee Training Problem
Twosample T for method A vs. method B
N Mean StDev SE Mean
method A 15 47.73 4.42 1.1
method B 12 56.60 4.27 1.2
95% C.I. for mu method A - mu method B: (-12.2, -5.3)
T-Test mu method A = mu method B (vs not =): T = -5.20
P = 0.0000 DF = 25
Both use Pooled StDev = 4.35
8/3/2019 Ken Black QA ch10
http://slidepdf.com/reader/full/ken-black-qa-ch10 18/47
EXCEL Output for Hernandez
New-Employee Training Problem
t-Test: Two-Sample Assuming Equal Variances
Variable 1 Variable 2
Mean 4 7.73 56.5Variance 19.495 18.27Observations 15 12Pooled Variance 18.957
Hypothesized Mean Difference 0df 25
t Stat - 5.20P(T<=t) one-tail 1.12E-05t Critical one-tail 1.71P(T<=t) two-tail 2.23E-05t Critical two-tail 2.06
8/3/2019 Ken Black QA ch10
http://slidepdf.com/reader/full/ken-black-qa-ch10 19/47
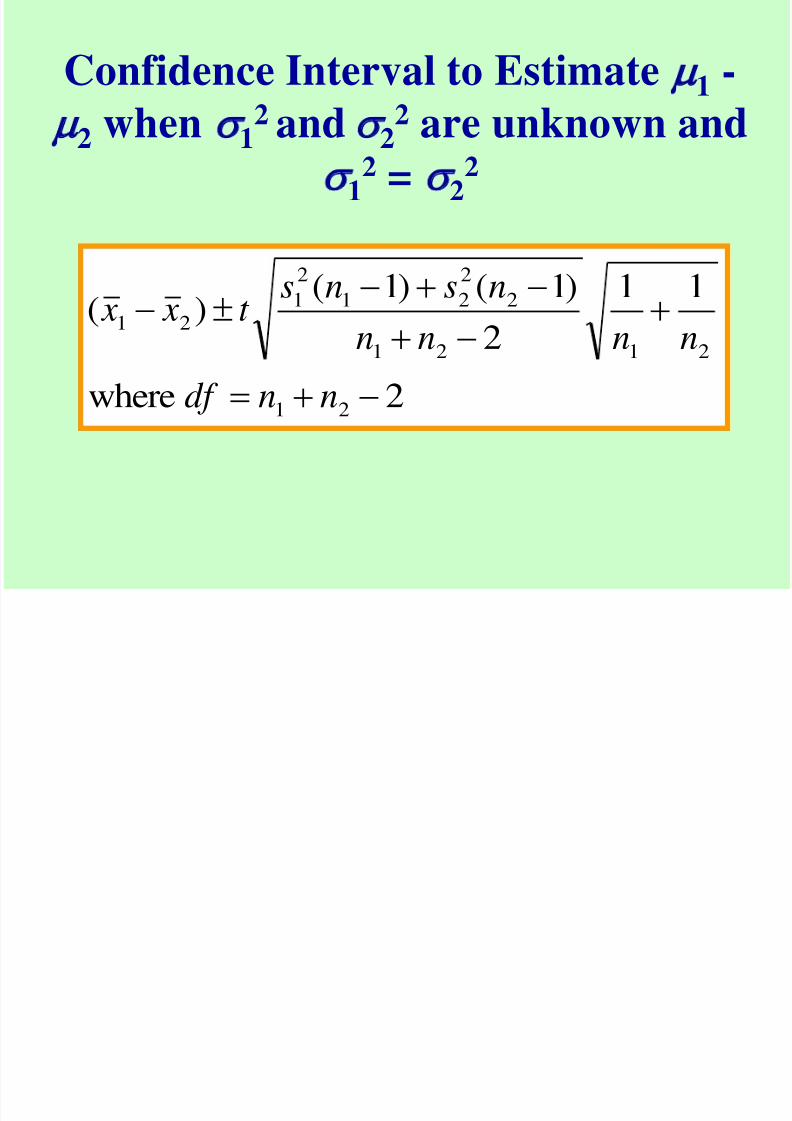
Confidence Interval to Estimate 1 -
2 when 1
2
and
2
2
are unknown and1
2 = 22
2where
11
2
)1()1()(
21
2121
2221
21
21
nndf
nnnn
nsnst x x
8/3/2019 Ken Black QA ch10
http://slidepdf.com/reader/full/ken-black-qa-ch10 20/47
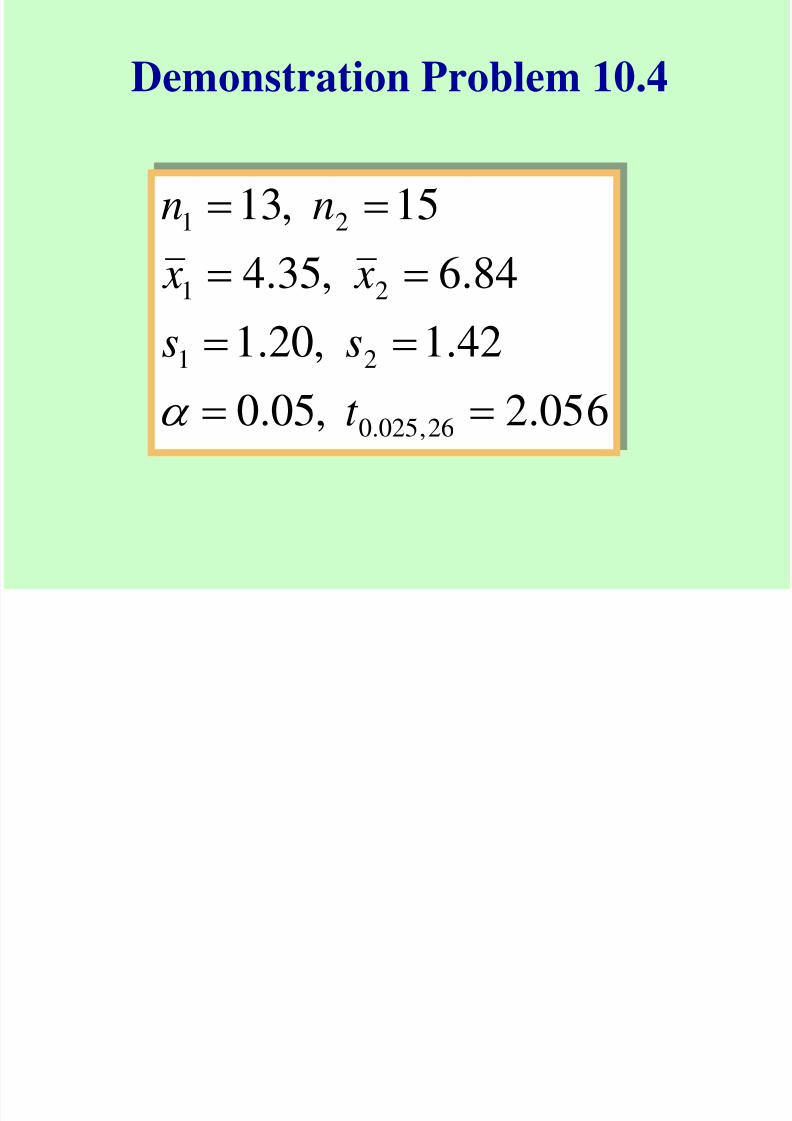
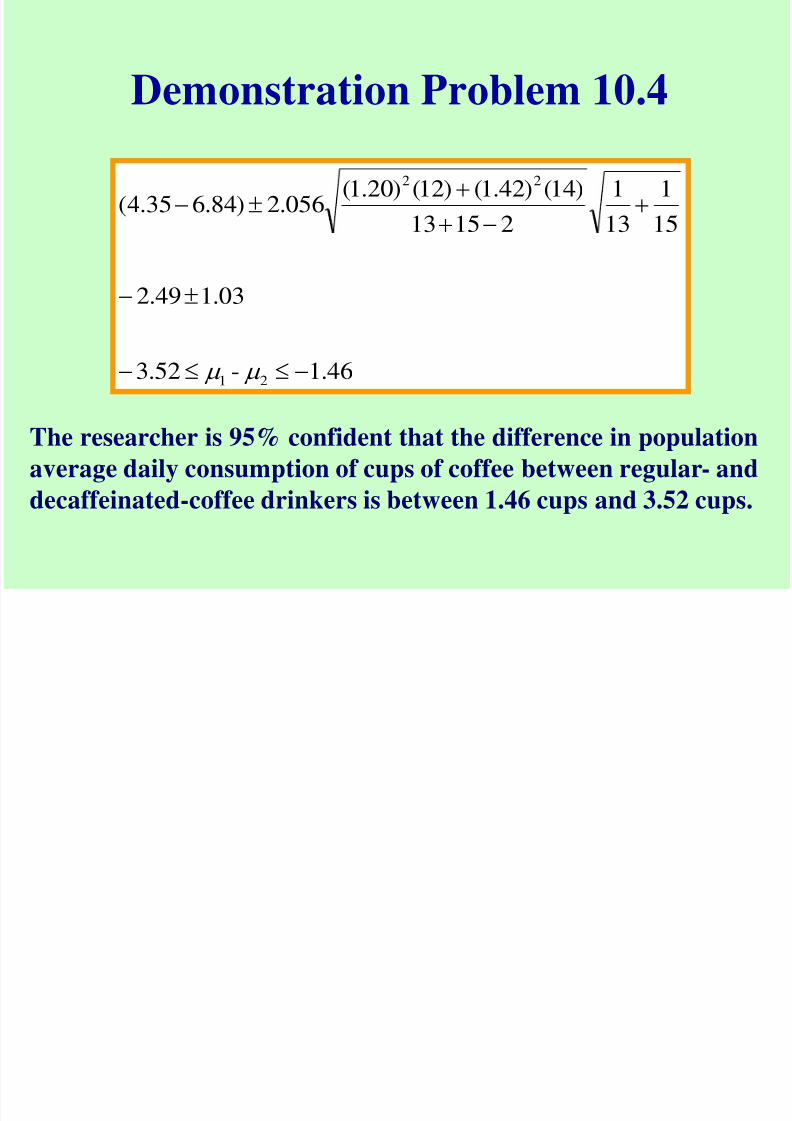
Demonstration Problem 10.4
056.2 ,05.0
42.1 ,20.184.6 ,35.4
15 ,13
26,025.0
21
21
21
t
ss x x
nn
8/3/2019 Ken Black QA ch10
http://slidepdf.com/reader/full/ken-black-qa-ch10 21/47
Demonstration Problem 10.4
46.1-52.3
03.149.2
15
1
13
1
21513
)14()42.1()12()20.1(056.2)84.635.4(
21
22
The researcher is 95% confident that the difference in population
average daily consumption of cups of coffee between regular- and
decaffeinated-coffee drinkers is between 1.46 cups and 3.52 cups.
8/3/2019 Ken Black QA ch10
http://slidepdf.com/reader/full/ken-black-qa-ch10 22/47
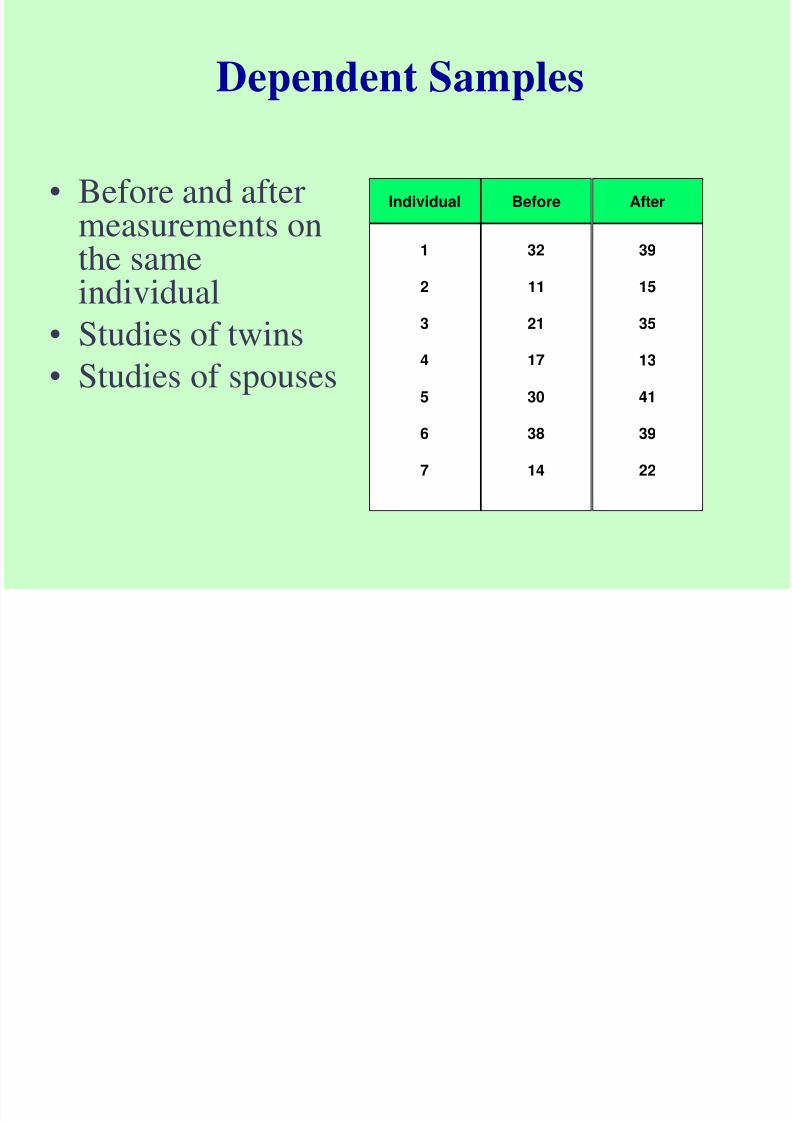
Dependent Samples
• Before and aftermeasurements onthe sameindividual
• Studies of twins
• Studies of spouses
Individual
1
2
3
4
5
6
7
Before
32
11
21
17
30
38
14
After
39
15
35
13
41
39
22
8/3/2019 Ken Black QA ch10
http://slidepdf.com/reader/full/ken-black-qa-ch10 23/47
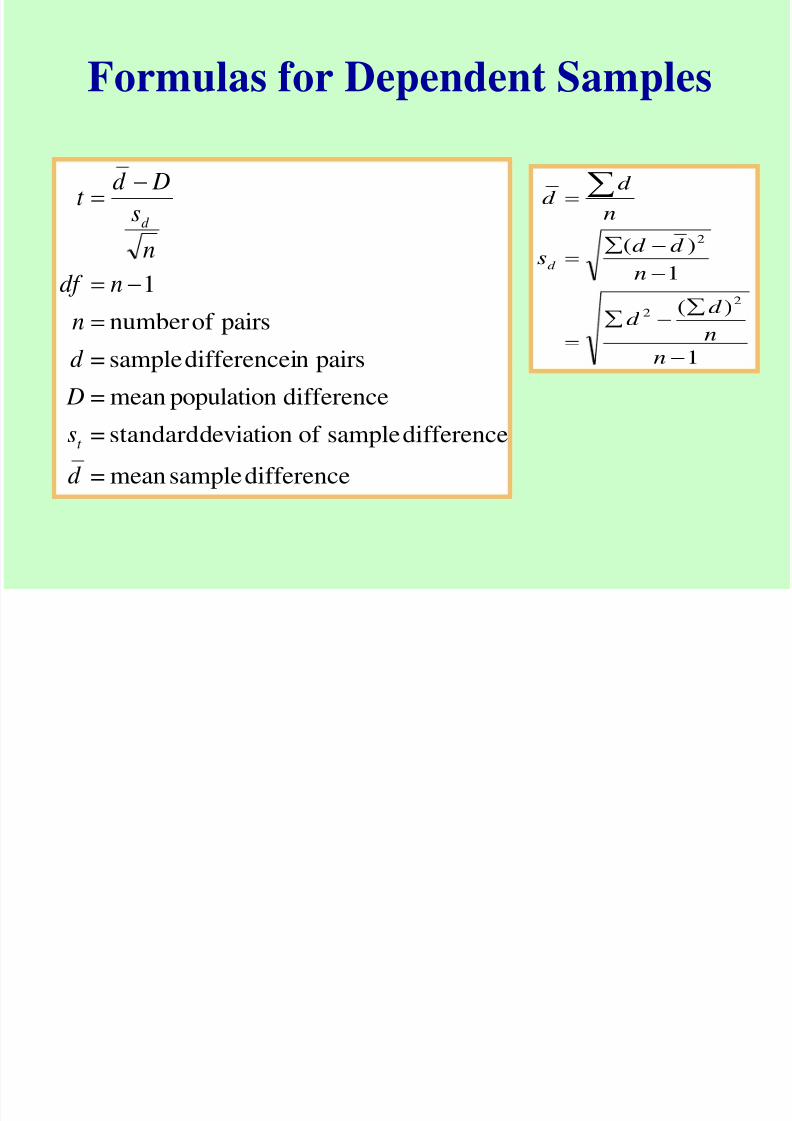
Formulas for Dependent Samples
differencesamplemean=
differencesampleof deviationstandard=
differencepopulationmean=
pairsindifferencesample=
pairsof number
1
d
s
D
d
n
ndf
n
s
Dd t
t
d
1
)(1
)(
22
2
n
n
d d
n
d d s
n
d d
d
8/3/2019 Ken Black QA ch10
http://slidepdf.com/reader/full/ken-black-qa-ch10 24/47
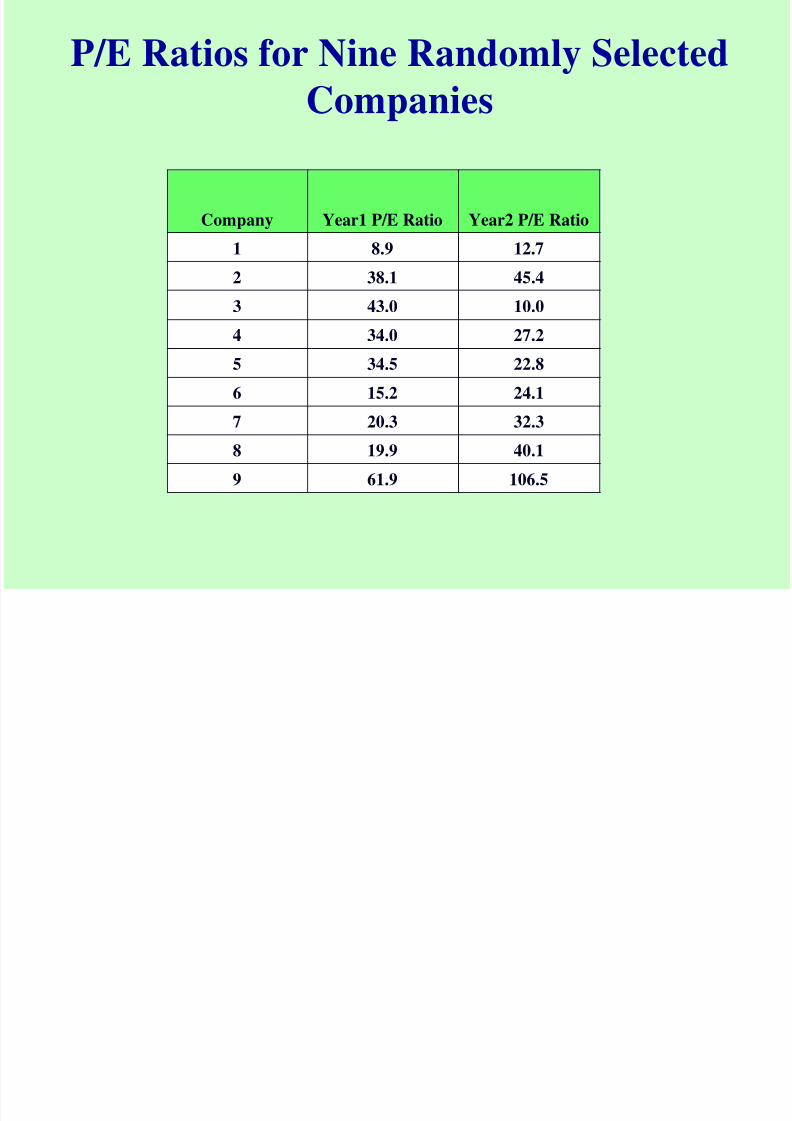
P/E Ratios for Nine Randomly Selected
Companies
Company Year1 P/E Ratio Year2 P/E Ratio
1 8.9 12.7
2 38.1 45.4
3 43.0 10.0
4 34.0 27.2
5 34.5 22.8
6 15.2 24.1
7 20.3 32.3
8 19.9 40.1
9 61.9 106.5
8/3/2019 Ken Black QA ch10
http://slidepdf.com/reader/full/ken-black-qa-ch10 25/47
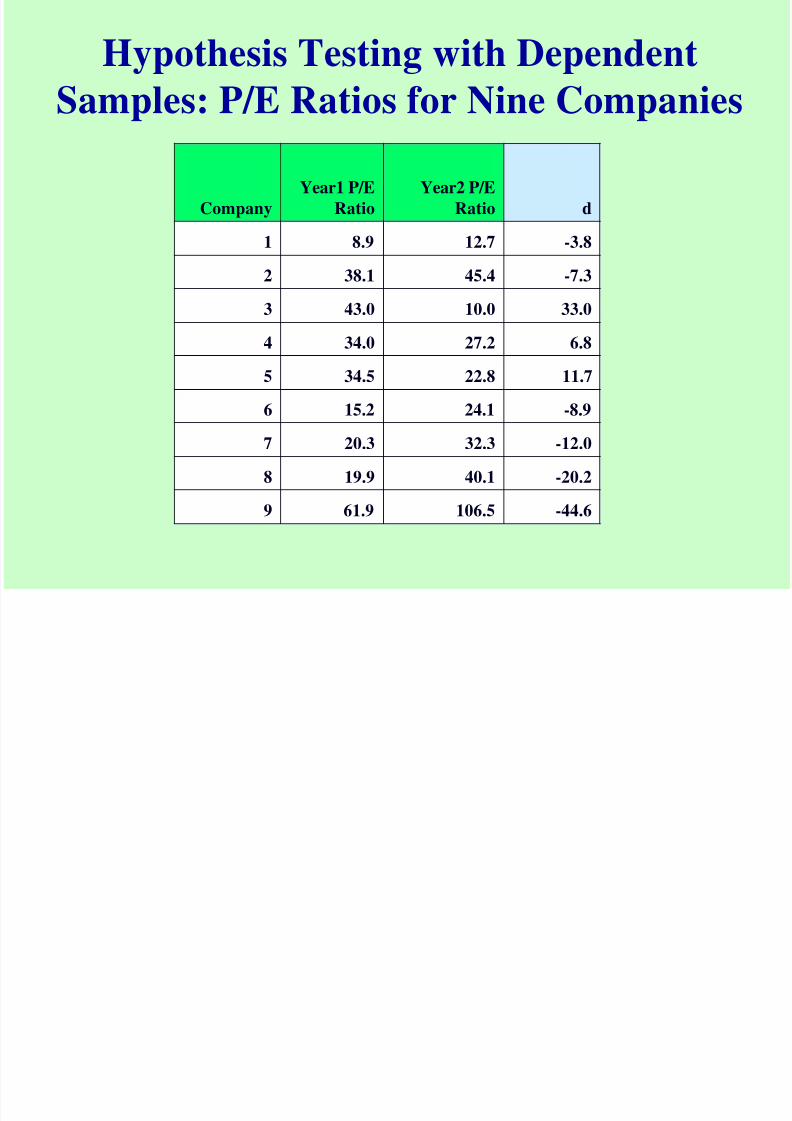
Hypothesis Testing with Dependent
Samples: P/E Ratios for Nine Companies
Company
Year1 P/E
Ratio
Year2 P/E
Ratio d
1 8.9 12.7 -3.8
2 38.1 45.4 -7.3
3 43.0 10.0 33.0
4 34.0 27.2 6.8
5 34.5 22.8 11.7
6 15.2 24.1 -8.97 20.3 32.3 -12.0
8 19.9 40.1 -20.2
9 61.9 106.5 -44.6
8/3/2019 Ken Black QA ch10
http://slidepdf.com/reader/full/ken-black-qa-ch10 26/47
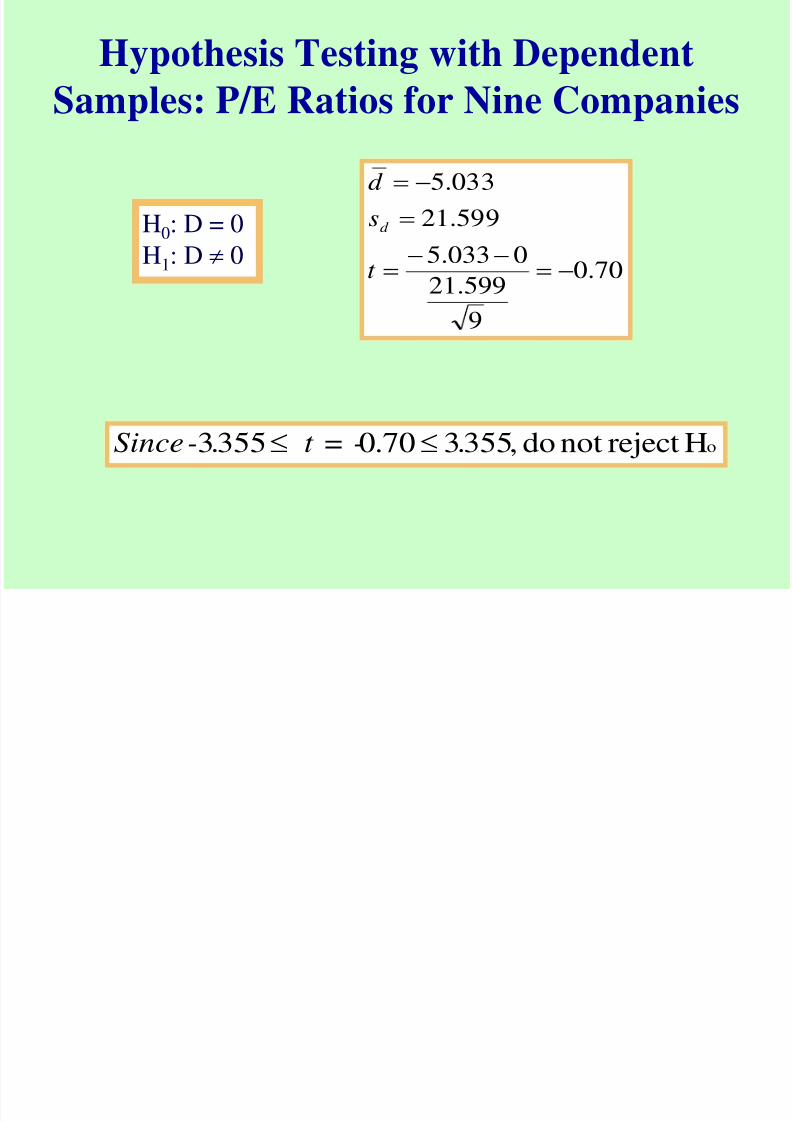
Hypothesis Testing with Dependent
Samples: P/E Ratios for Nine Companies
70.0
9
599.21
0033.5
599.21
033.5
t
s
d
d
oHrejectnotdo,355370.03553 .t = -.-Since
H0: D = 0
H1: D 0
8/3/2019 Ken Black QA ch10
http://slidepdf.com/reader/full/ken-black-qa-ch10 27/47
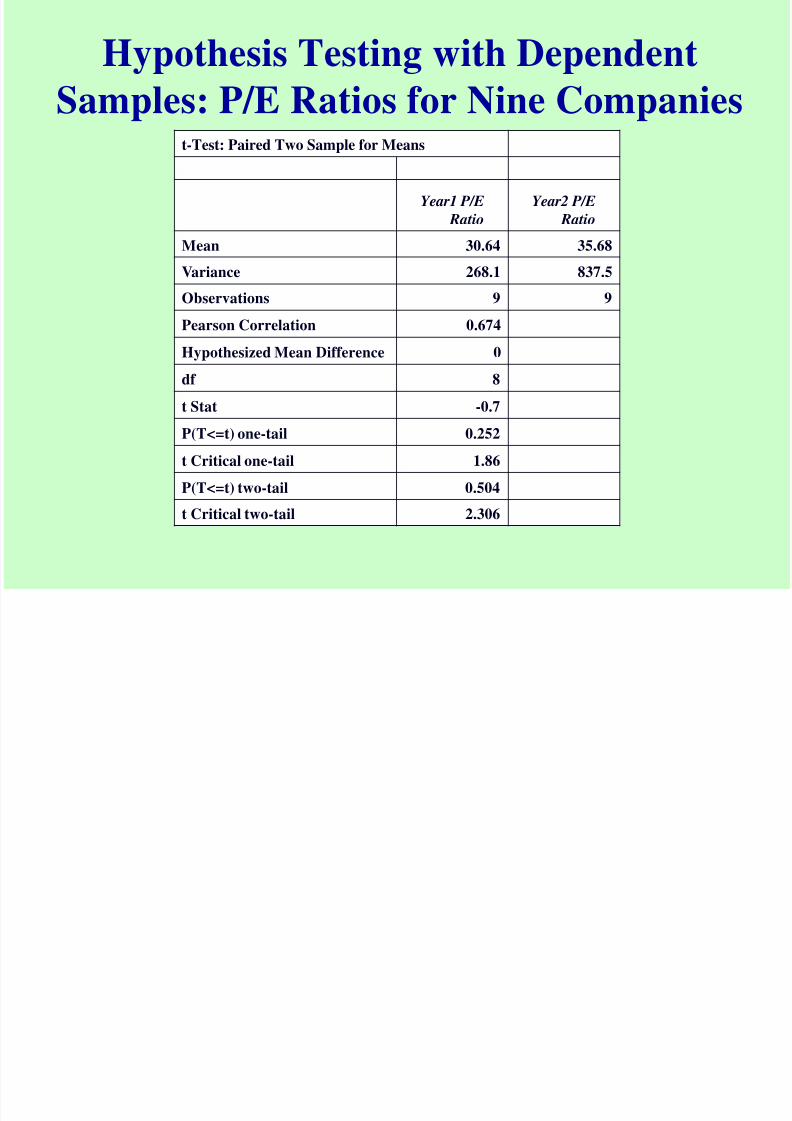
Hypothesis Testing with Dependent
Samples: P/E Ratios for Nine Companiest-Test: Paired Two Sample for Means
Year1 P/E
Ratio
Year2 P/E
Ratio
Mean 30.64 35.68
Variance 268.1 837.5
Observations 9 9
Pearson Correlation 0.674
Hypothesized Mean Difference 0
df 8
t Stat -0.7
P(T<=t) one-tail 0.252
t Critical one-tail 1.86
P(T<=t) two-tail 0.504
t Critical two-tail 2.306
8/3/2019 Ken Black QA ch10
http://slidepdf.com/reader/full/ken-black-qa-ch10 28/47
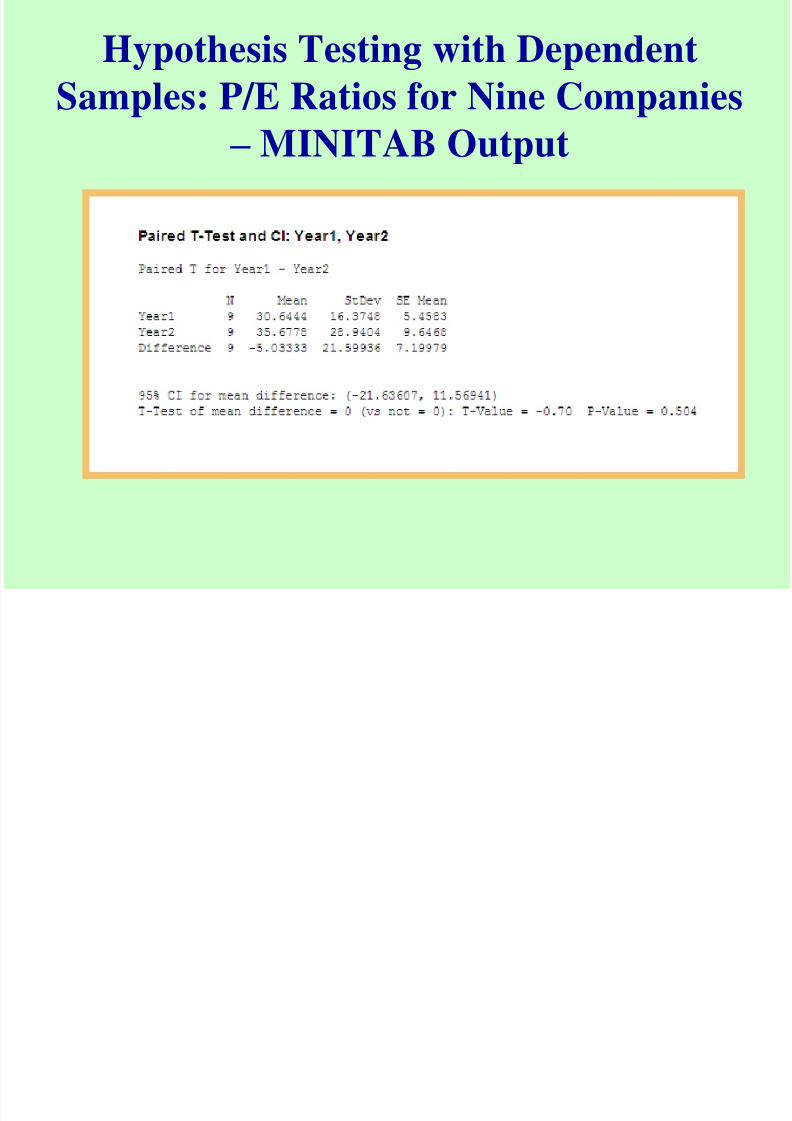
Hypothesis Testing with Dependent
Samples: P/E Ratios for Nine Companies
– MINITAB Output
8/3/2019 Ken Black QA ch10
http://slidepdf.com/reader/full/ken-black-qa-ch10 29/47
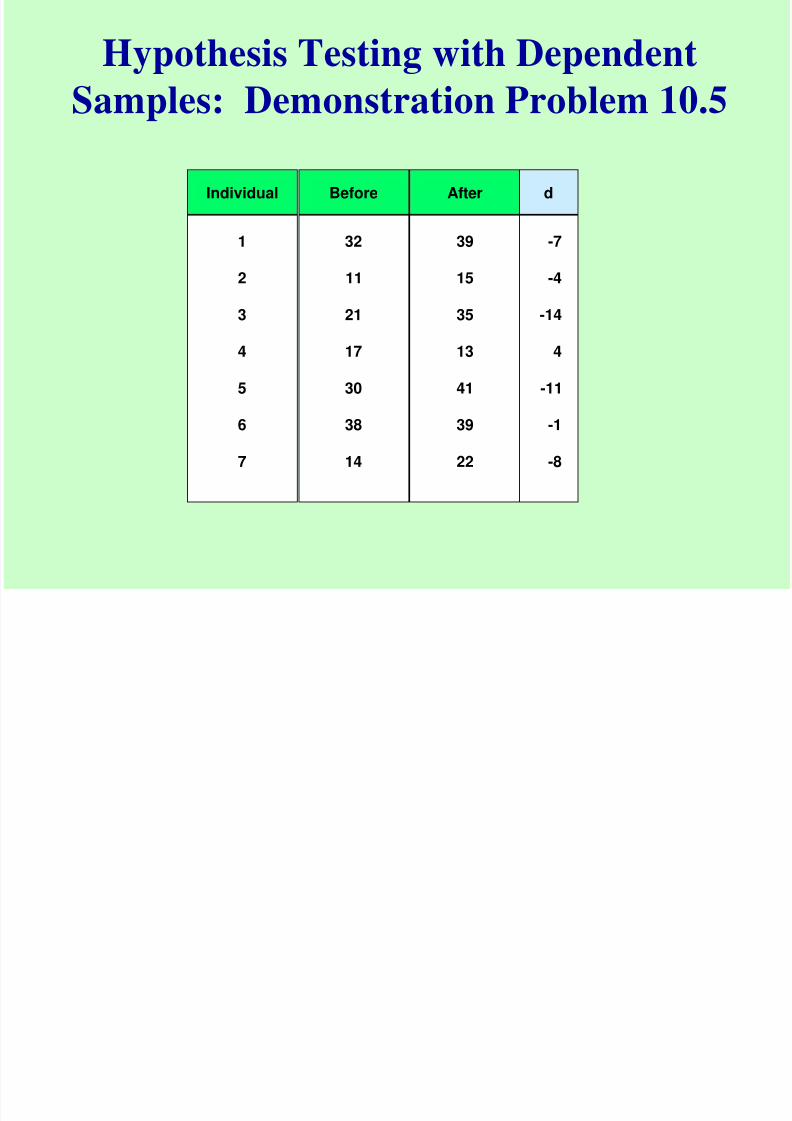
Hypothesis Testing with Dependent
Samples: Demonstration Problem 10.5
Individual
1
2
3
4
5
6
7
Before
32
11
21
17
30
38
14
After
39
15
35
13
41
39
22
d
-7
-4
-14
4
-11
-1
-8
H pothesis Testing ith Dependent
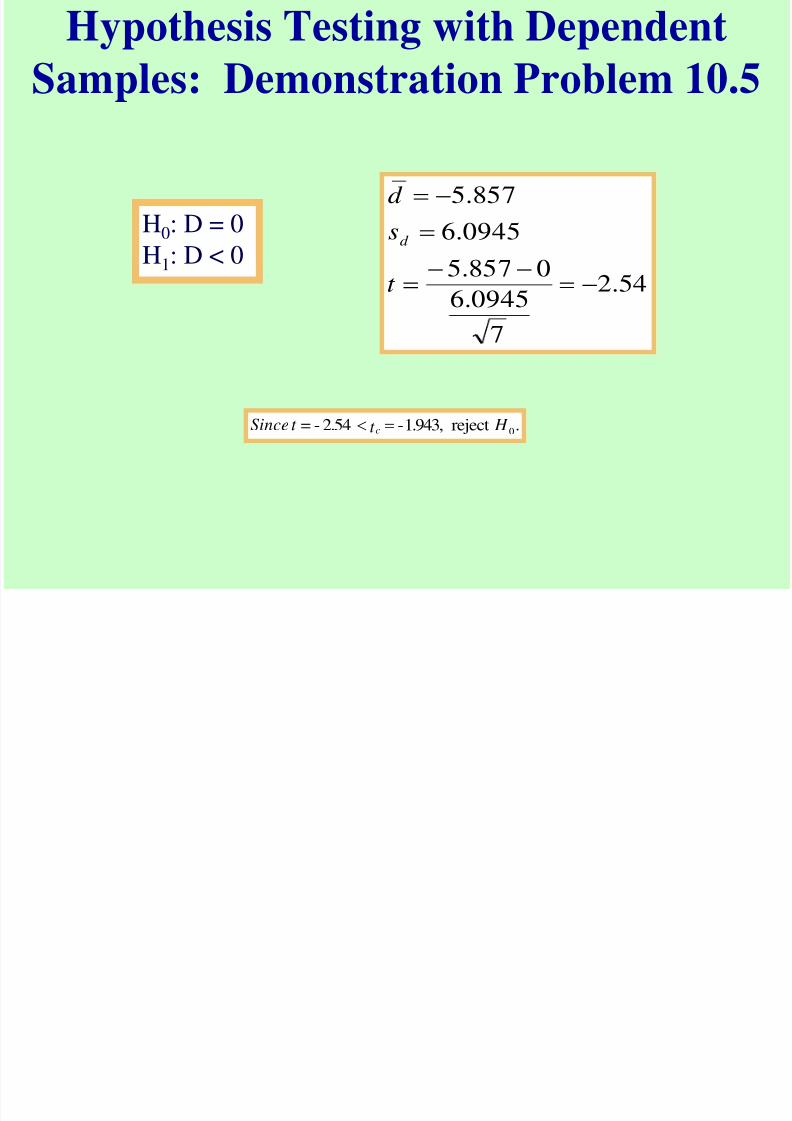
8/3/2019 Ken Black QA ch10
http://slidepdf.com/reader/full/ken-black-qa-ch10 30/47
Hypothesis Testing with Dependent
Samples: Demonstration Problem 10.5
54.2
7
0945.6 0857.5
0945.6
857.5
t
s
d
d
.reject1.943,-2.54-= 0 H t t Since c
H0: D = 0
H1: D < 0
8/3/2019 Ken Black QA ch10
http://slidepdf.com/reader/full/ken-black-qa-ch10 31/47
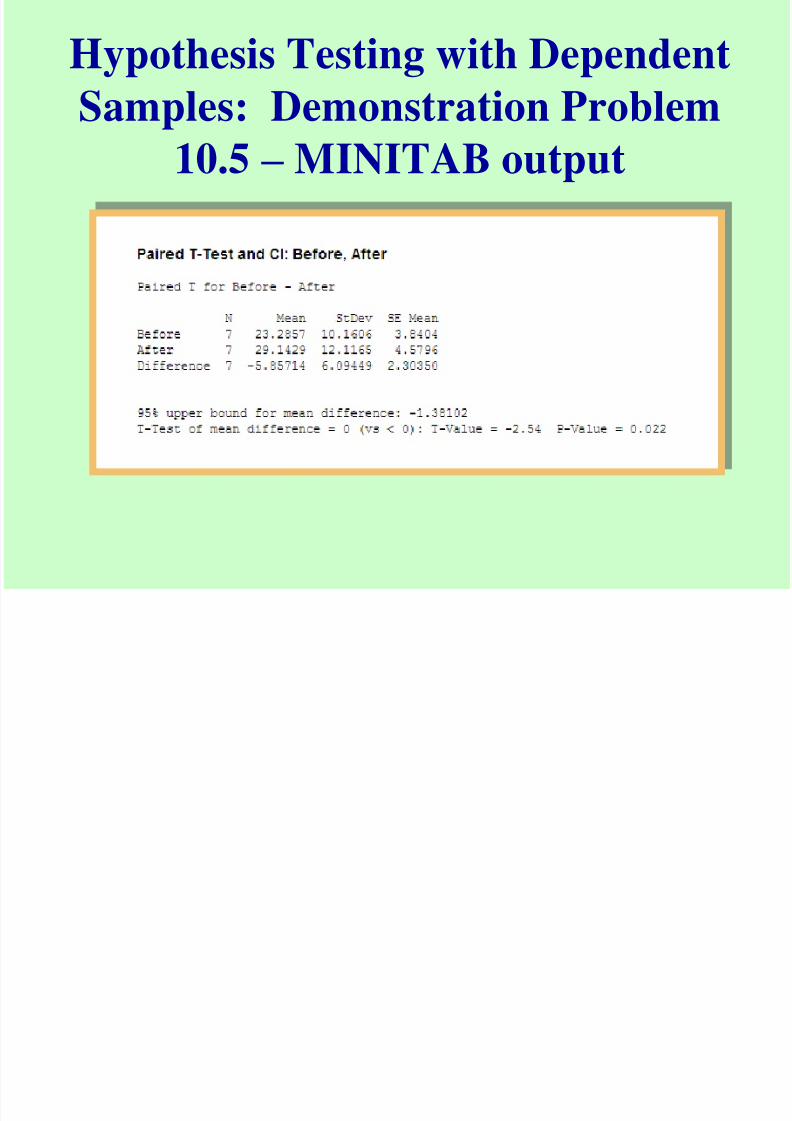
Hypothesis Testing with Dependent
Samples: Demonstration Problem
10.5 –
MINITAB output
8/3/2019 Ken Black QA ch10
http://slidepdf.com/reader/full/ken-black-qa-ch10 32/47
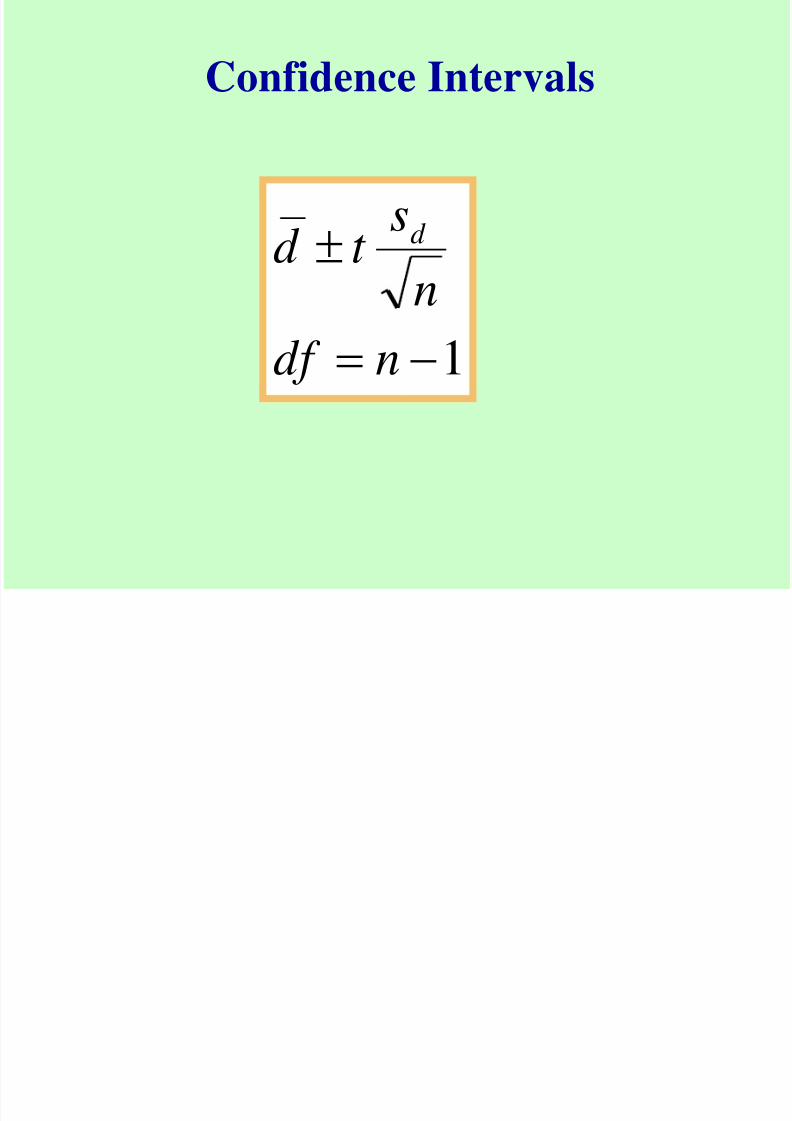
Confidence Intervals
1
ndf
n
st d d

8/3/2019 Ken Black QA ch10
http://slidepdf.com/reader/full/ken-black-qa-ch10 33/47
INSERT TABLE 10.8
Confidence Intervals
8/3/2019 Ken Black QA ch10
http://slidepdf.com/reader/full/ken-black-qa-ch10 34/47
Confidence Intervals
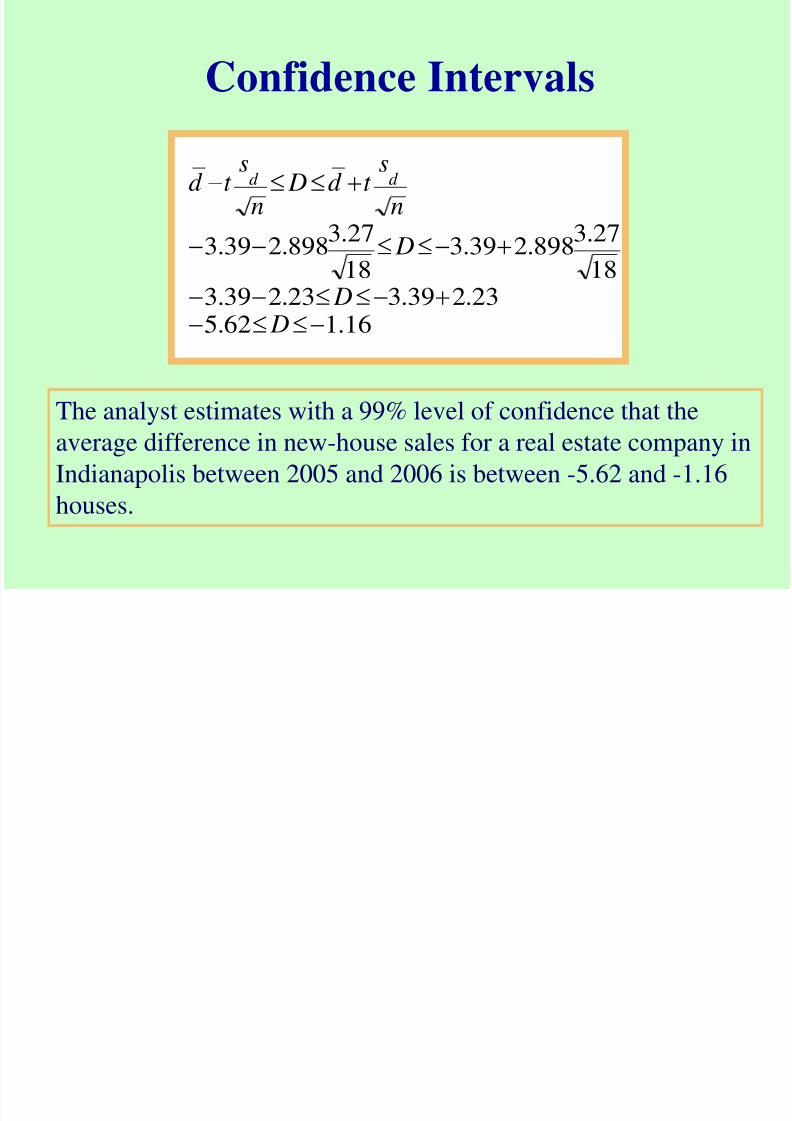
16.162.5 23.239.323.239.3 18
27.3898.239.3
18
27.3898.239.3
D D
D
n
st d D
n
st d d d
The analyst estimates with a 99% level of confidence that theaverage difference in new-house sales for a real estate company in
Indianapolis between 2005 and 2006 is between -5.62 and -1.16
houses.
8/3/2019 Ken Black QA ch10
http://slidepdf.com/reader/full/ken-black-qa-ch10 35/47
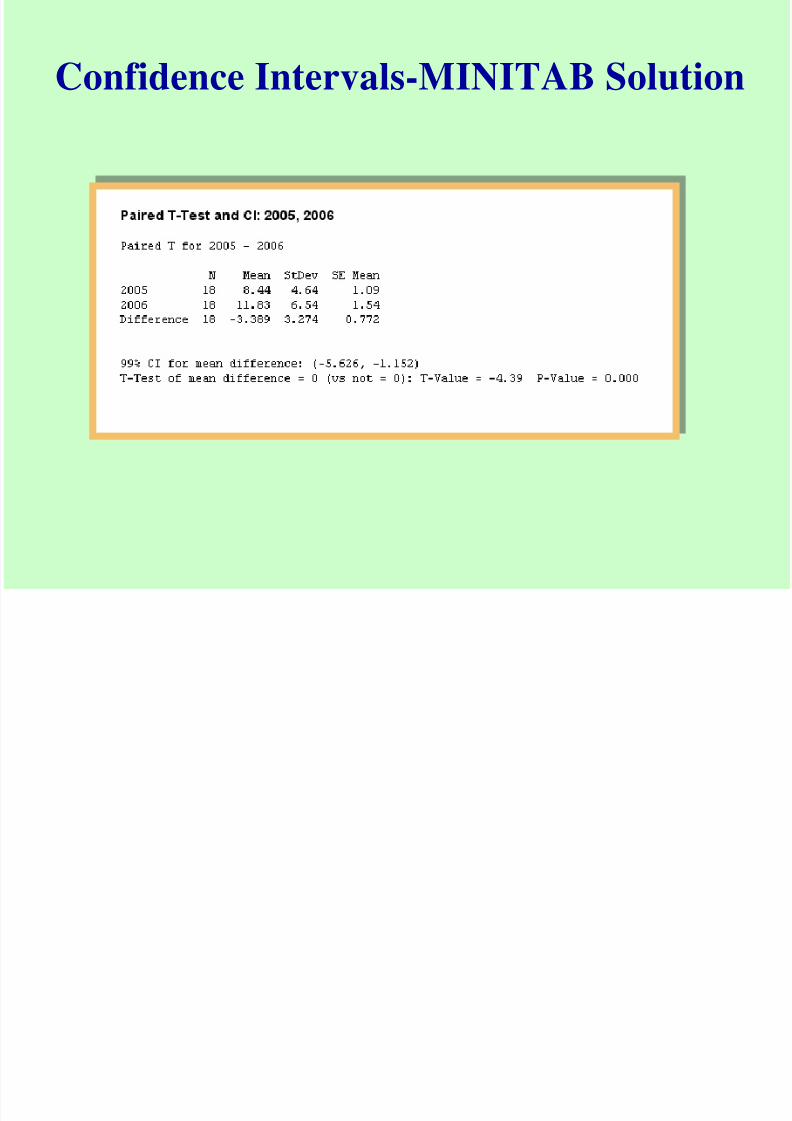
Confidence Intervals-MINITAB Solution
8/3/2019 Ken Black QA ch10
http://slidepdf.com/reader/full/ken-black-qa-ch10 36/47
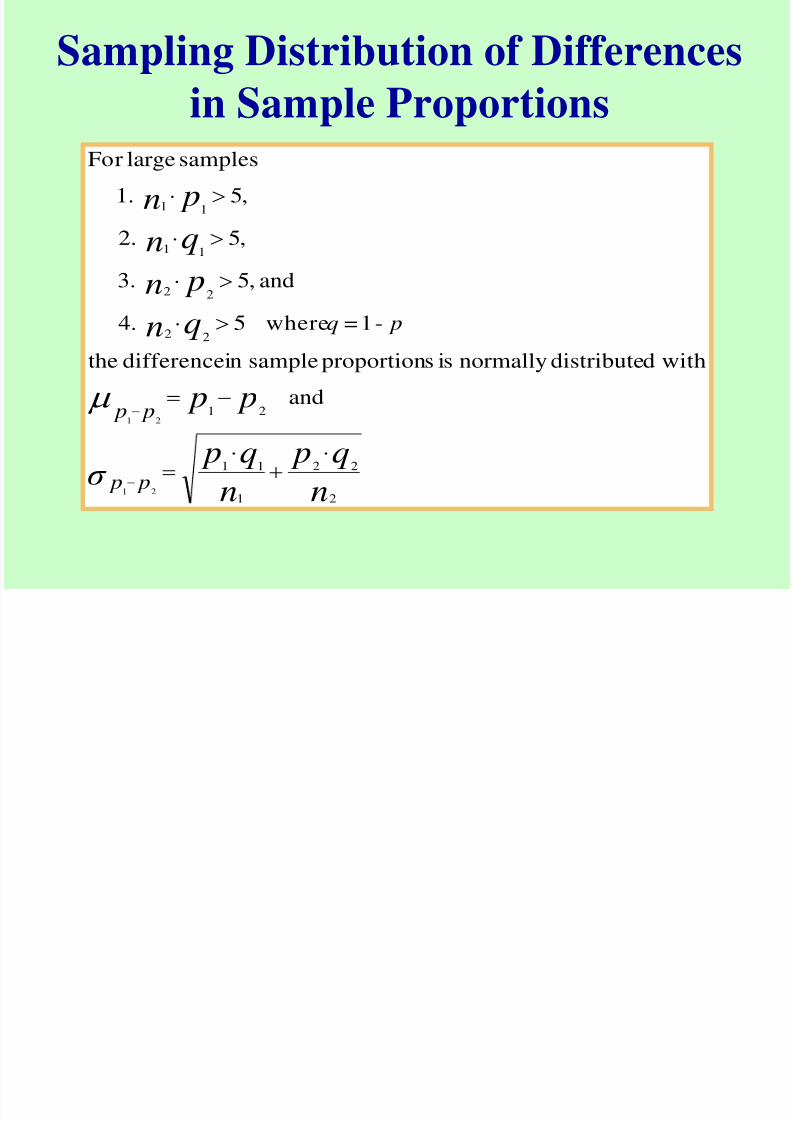
Sampling Distribution of Differences
in Sample Proportions
n
q p
n
q pσ
p p
qn pn
qn
pn
p p
p p
pq
2
22
1
11
21
22
22
11
11
ˆˆ
and ˆˆ
withddistributenormallyissproportionsampleindifferencethe
ˆ-1=ˆwhere5 4.
and,5 3.
,5 2.
,5 1.
sampleslargeFor
21
21
ˆ
ˆ
ˆ
ˆ
8/3/2019 Ken Black QA ch10
http://slidepdf.com/reader/full/ken-black-qa-ch10 37/47
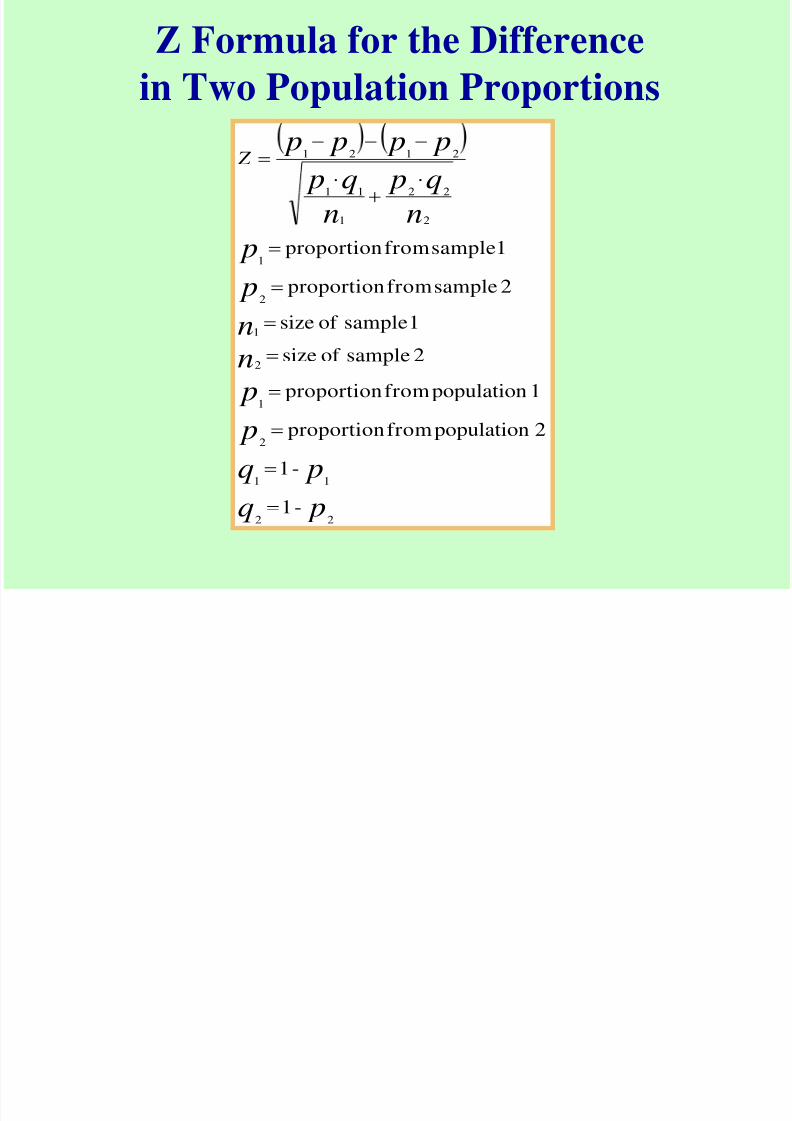
Z Formula for the Difference
in Two Population Proportions
pq
pq
p
p
n
n
p
p
n
q p
n
q p p p p p Z
22
11
2
1
2
1
2
1
2
22
1
11
2121
-1
-1
2populationfromproportion
1populationfromproportion
2sampleof size
1sampleof size
2samplefromproportion
1samplefromproportion
ˆ
ˆ
ˆˆ
8/3/2019 Ken Black QA ch10
http://slidepdf.com/reader/full/ken-black-qa-ch10 38/47
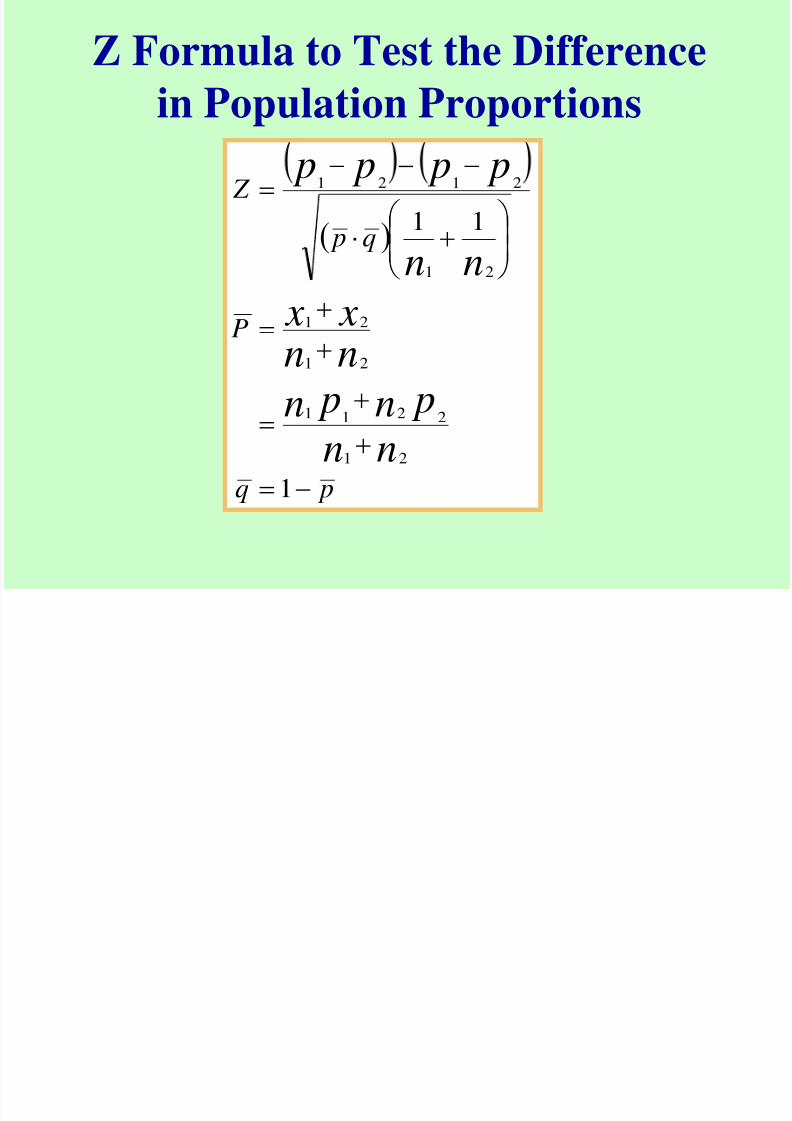
Z Formula to Test the Difference
in Population Proportions
pq
P
q p
Z
nn pn pn
nn x x nn
p p p p
1
11
21
2211
21
21
21
2121
ˆˆ
ˆˆ
T ti th Diff i P l ti
8/3/2019 Ken Black QA ch10
http://slidepdf.com/reader/full/ken-black-qa-ch10 39/47
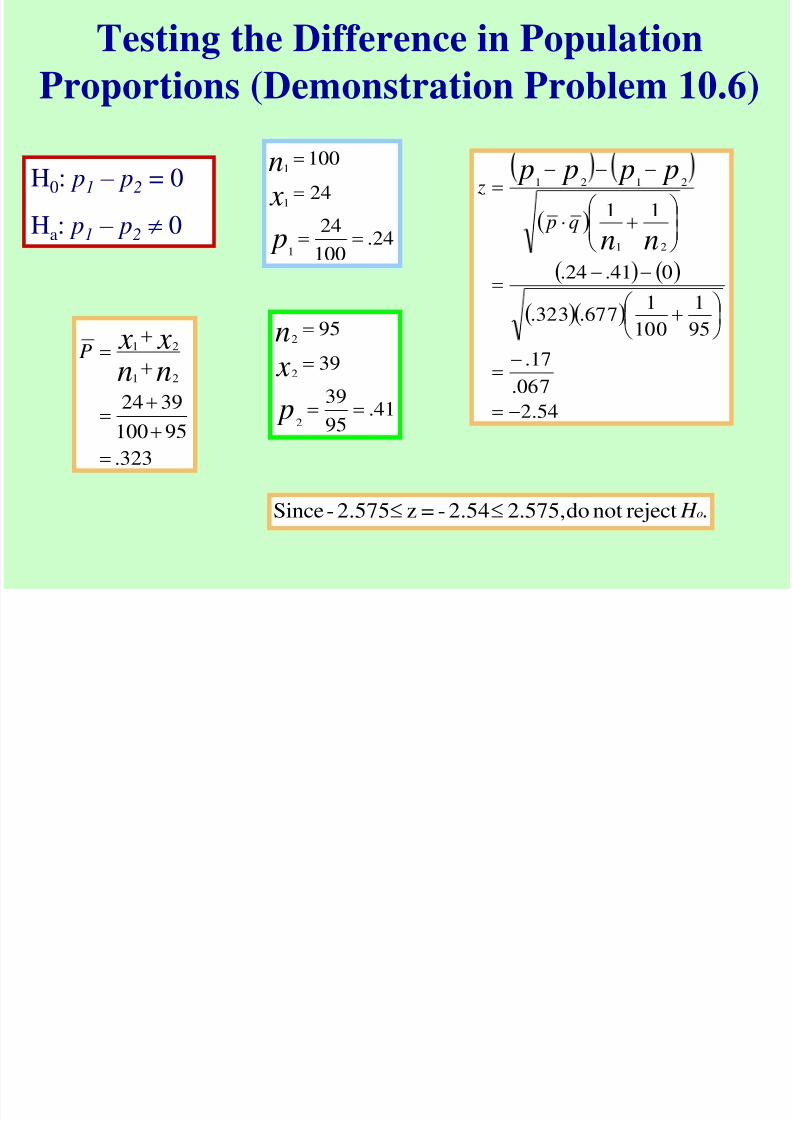
Testing the Difference in Population
Proportions (Demonstration Problem 10.6)
24.100
24
24
100
ˆ1
1
1
p
x
n
41.95
39
39
95
ˆ2
2
2
p
x
n
323.
95100
3924
21
21
nn x x
P
54.2
067.
17.
95
1
100
1677.323.
041.24.
11
21
2121ˆˆ
nn
p p p p
q p
z
. H orejectnotdo2.575,2.54-=z2.575-Since
H0: p1 – p2 = 0
Ha: p1 – p2 0
8/3/2019 Ken Black QA ch10
http://slidepdf.com/reader/full/ken-black-qa-ch10 40/47
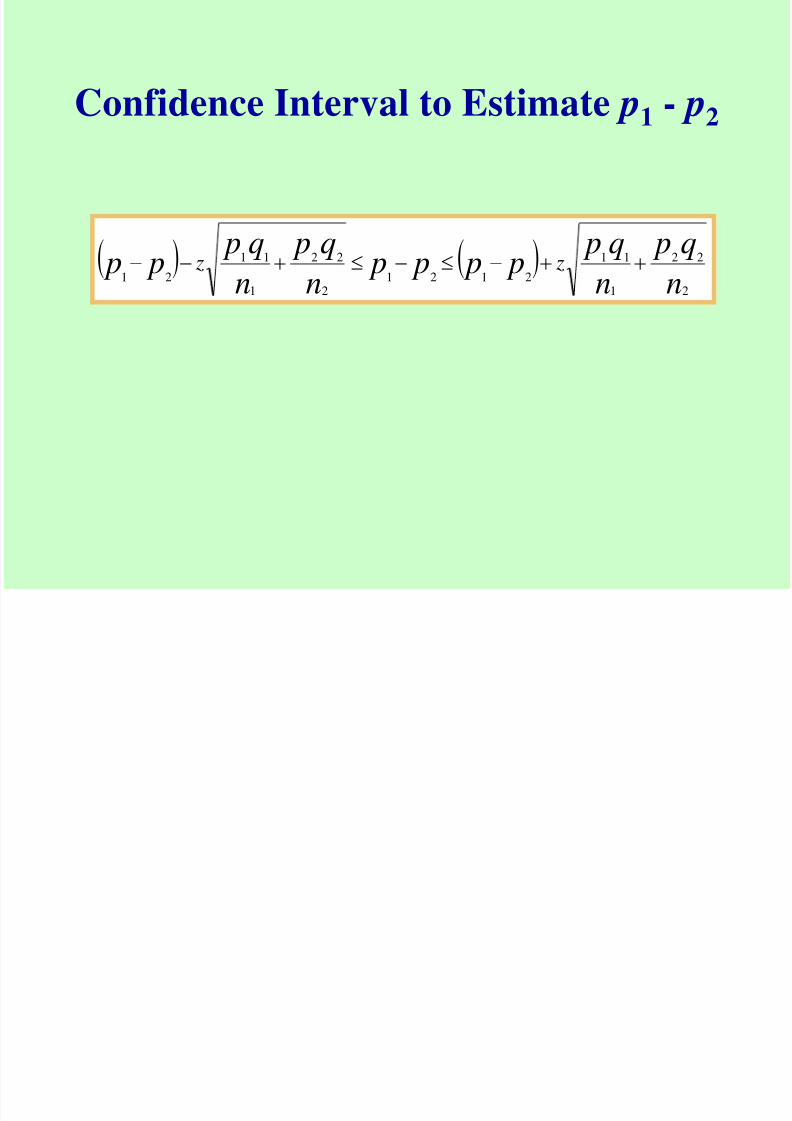
Confidence Interval to Estimate p1 - p2
n
q p
n
q p p p p p
n
q p
n
q p p p z z
2
22
1
11
21212
22
1
11
21
ˆˆˆˆ
ˆˆ
ˆˆˆˆ
ˆˆ
8/3/2019 Ken Black QA ch10
http://slidepdf.com/reader/full/ken-black-qa-ch10 41/47
Example Problem:
When do men shop
for groceries?
88.1
12.400
48
48
400
ˆˆ
ˆ
11
1
1
1
pq
p
x
n
61.1
39.480
187
187
480
ˆˆ
ˆ
22
2
2
2
pq
p
xn
206.334.
064.27.064.27.
480
61.39.
400
88.12.33.239.12.
480
61.39.
400
88.12.33.239.12.
21
21
21
2
22
1
11
21212
22
1
11
21
ˆˆˆˆ
ˆˆ
ˆˆˆˆ
ˆˆ
p p
p p
p p
n
q p
n
q p p p p p
n
q p
n
q p p p Z Z
For a 98% level of confidence
z = 2.33.
8/3/2019 Ken Black QA ch10
http://slidepdf.com/reader/full/ken-black-qa-ch10 42/47
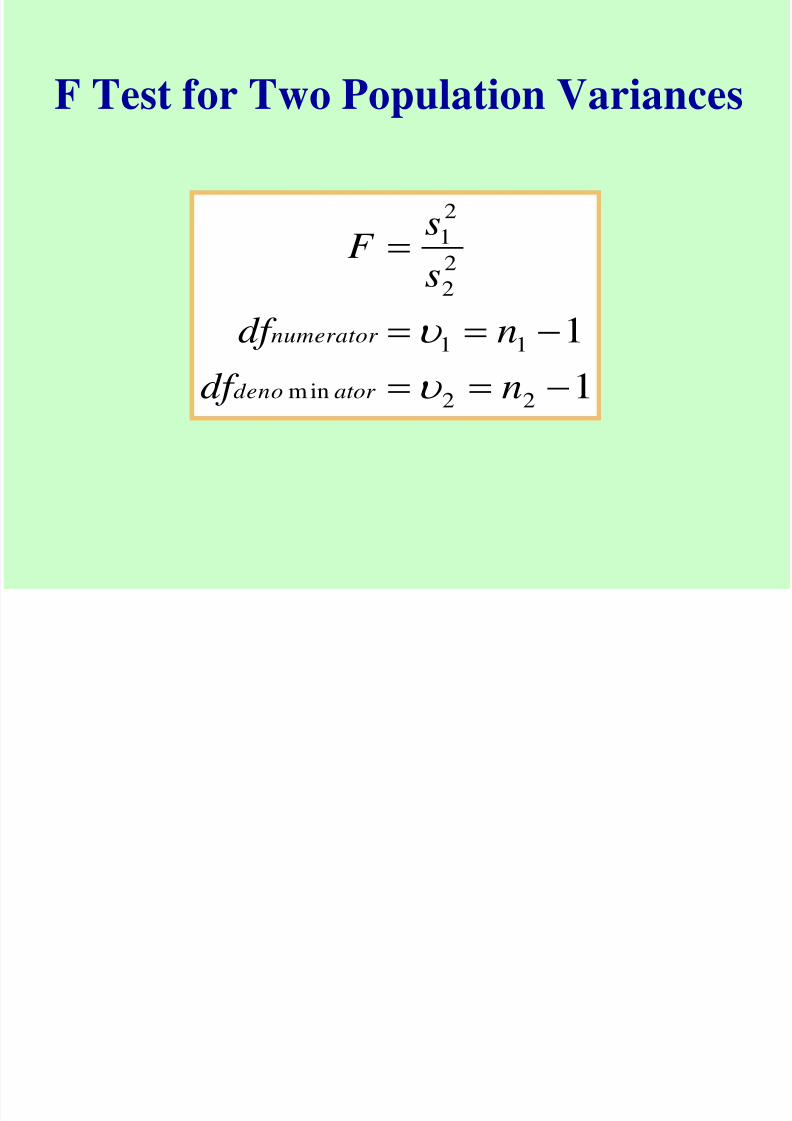
F Test for Two Population Variances
1
1
22min
11
2
2
2
1
ndf
ndf s
sF
ator deno
numerator
8/3/2019 Ken Black QA ch10
http://slidepdf.com/reader/full/ken-black-qa-ch10 43/47
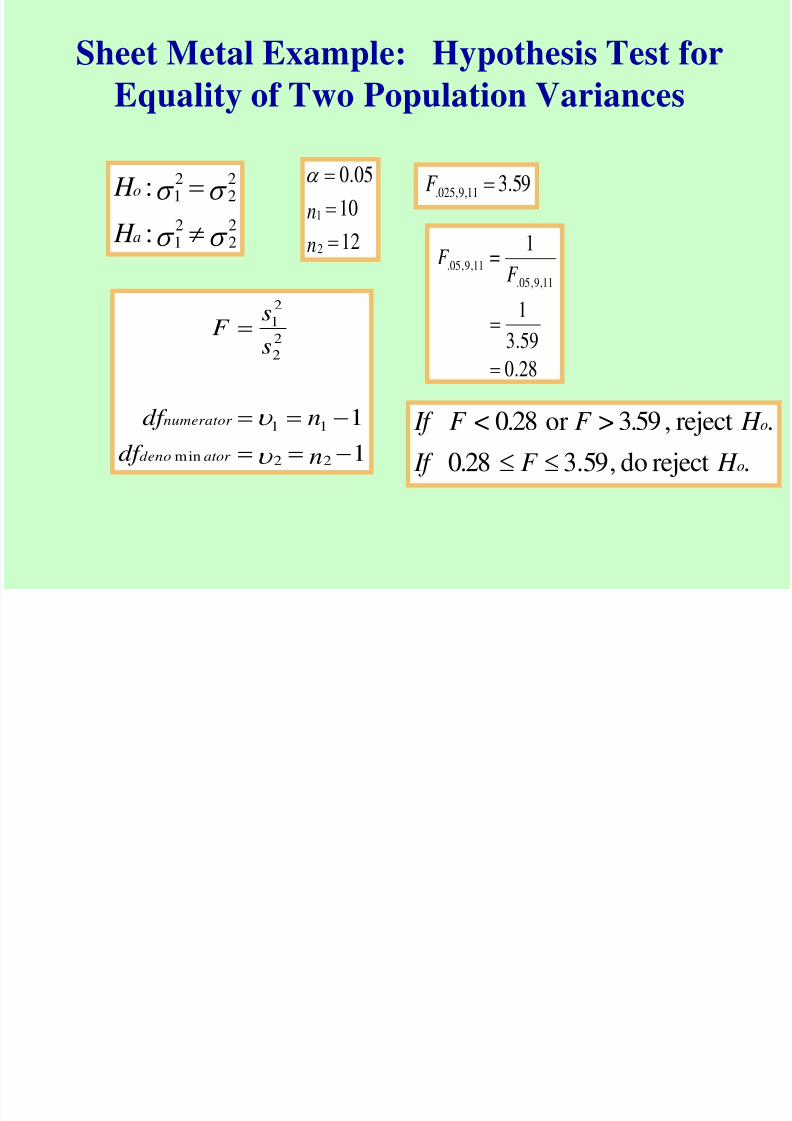
Sheet Metal Example: Hypothesis Test for
Equality of Two Population Variances
22
21
22
21
:
:
a
o
H
H 59.311,9,025.
F
. H F If
. H F F If
o
o
rejectdo,59.30.28
reject,3.59>or0.28<
28.0
59.3
1
1 =
11,9,05.
11,9,05.
F F
11
22min
11
2
2
2
1
ndf ndf
s
sF
ator deno
numerator
12
10
05.0
2
1
n
n
8/3/2019 Ken Black QA ch10
http://slidepdf.com/reader/full/ken-black-qa-ch10 44/47
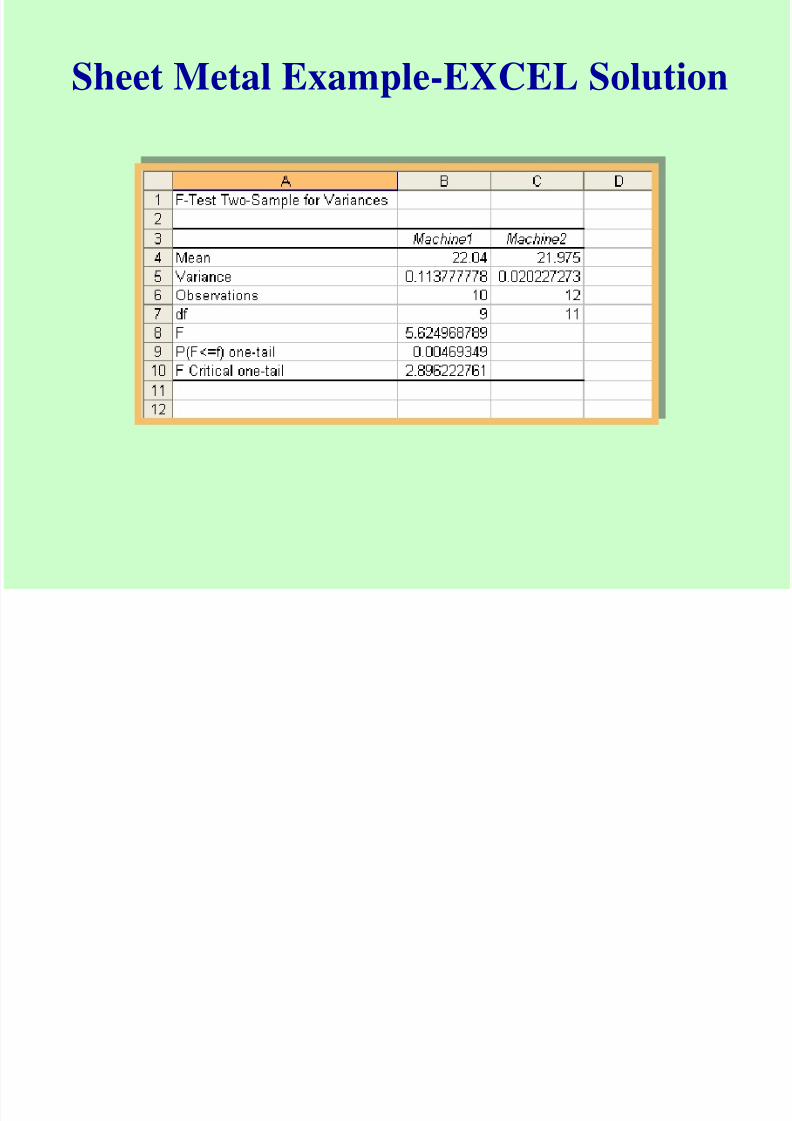
Sheet Metal Example
Machine 1
22.3 21.8 22.2
21.8 21.9 21.6
22.3 22.4
21.6 22.5
Machine 222.0
22.1
21.8
21.9
22.2
22.0
21.7
21.9
22.0
22.1
21.9
22.1
1138.0
10
2
1
1
s
n
0202.0
12
2
2
2
s
n63.5
0202.0
1138.02
2
2
1
s
sF
. H F F oc reject3.59,=>5.63=Since
8/3/2019 Ken Black QA ch10
http://slidepdf.com/reader/full/ken-black-qa-ch10 45/47
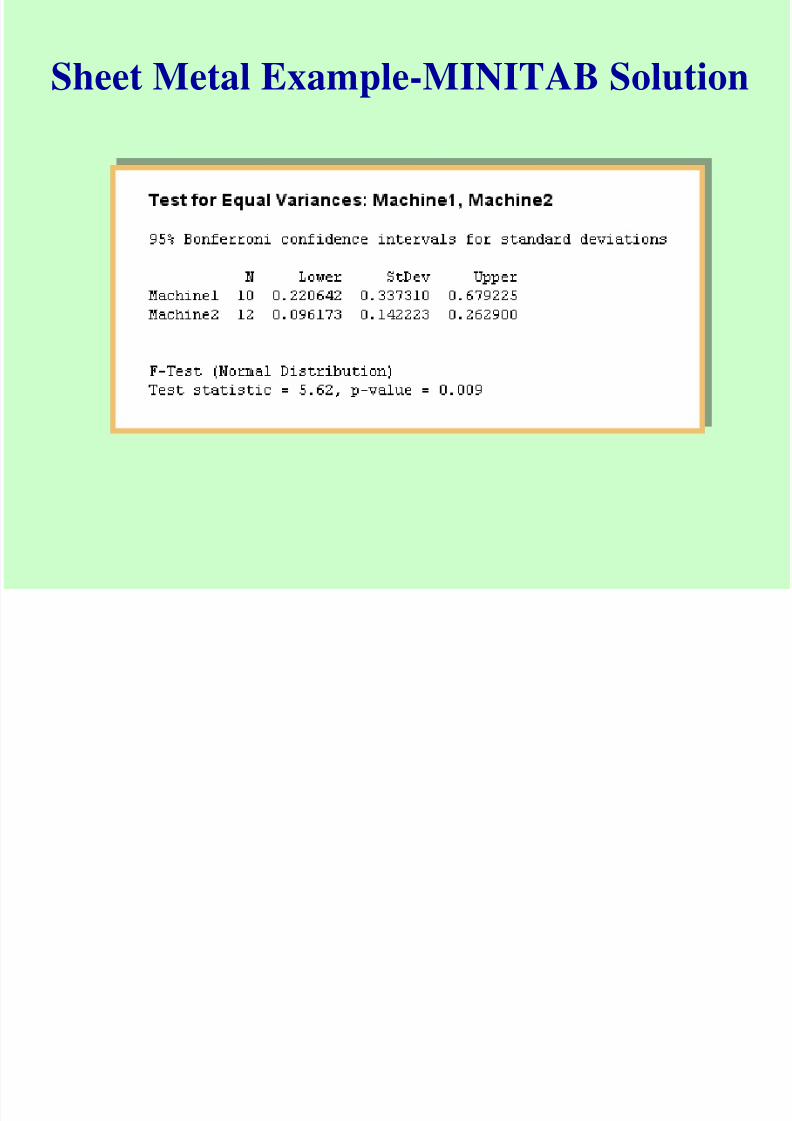
Sheet Metal Example-MINITAB Solution
8/3/2019 Ken Black QA ch10
http://slidepdf.com/reader/full/ken-black-qa-ch10 46/47
Sheet Metal Example-EXCEL Solution
8/3/2019 Ken Black QA ch10
http://slidepdf.com/reader/full/ken-black-qa-ch10 47/47
Copyright 2008 John Wiley & Sons, Inc. All rights reserved. Reproduction or translation
of this work beyond that permitted in section 117of the 1976 United States Copyright Act without
express permission of the copyright owner isunlawful. Request for further information shouldbe addressed to the Permissions Department, JohnWiley & Sons, Inc. The purchaser may makeback-up copies for his/her own use only and notfor distribution or resale. The Publisher assumes
no responsibility for errors, omissions, or damagescaused by the use of these programs or from theuse of the information herein.