Kemess North Tailings and Waste Rock Management Alternatives Study.
37
Kemess North Kemess North Tailings and Waste Rock Tailings and Waste Rock Management Management Alternatives Study
-
Upload
julian-fitzgerald -
Category
Documents
-
view
223 -
download
2
Transcript of Kemess North Tailings and Waste Rock Management Alternatives Study.
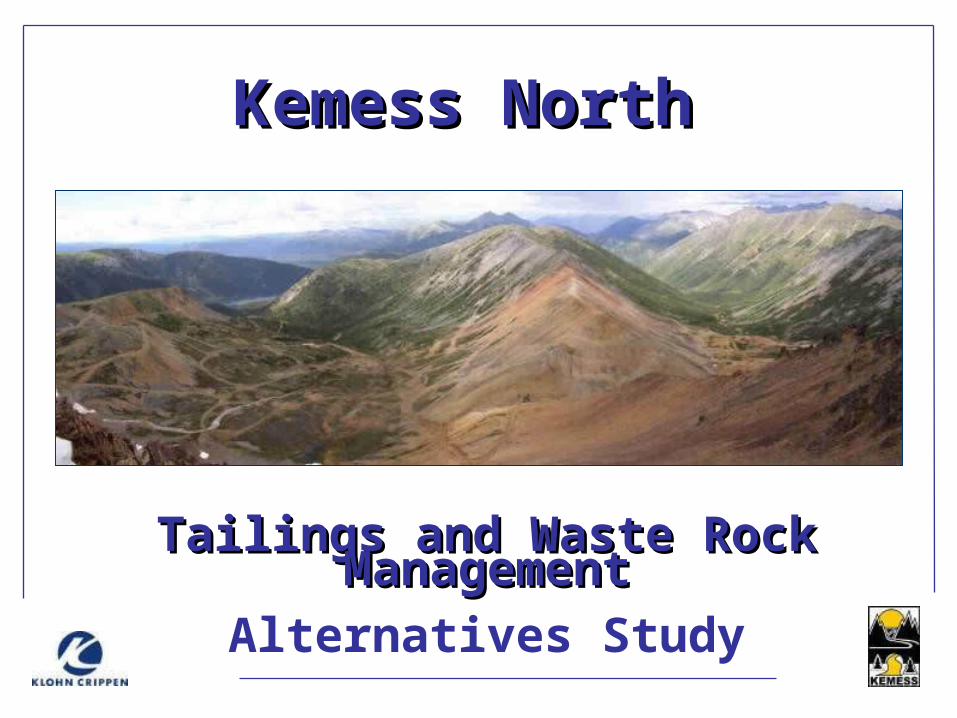
Kemess NorthKemess North
Tailings and Waste Rock Tailings and Waste Rock ManagementManagement
Alternatives Study
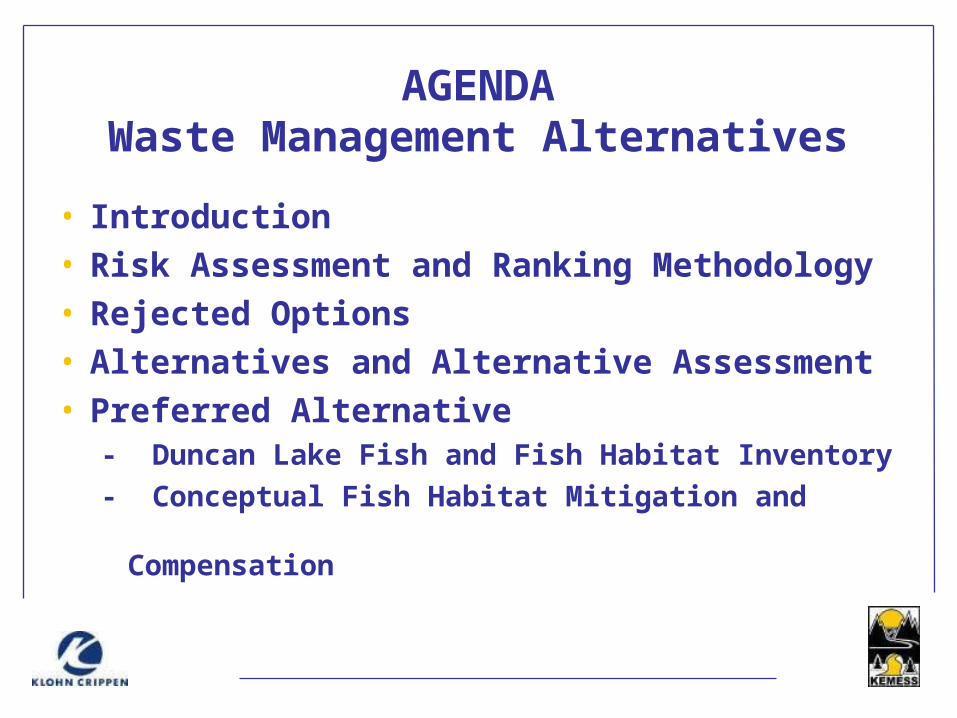
AGENDAWaste Management Alternatives
• Introduction• Risk Assessment and Ranking Methodology• Rejected Options• Alternatives and Alternative Assessment• Preferred Alternative
- Duncan Lake Fish and Fish Habitat Inventory
- Conceptual Fish Habitat Mitigation and Compensation

Kemess North Project
• Open pit copper/gold (similar to Kemess South)
• Potential to extend mine life by at least 11 years
• Reserves estimated at 4 million ounces gold and 1.5 billion pounds copper
• 250 Mt waste rock and 330 Mt tailings

Open Pit Mining• Grades too low
for underground mining (0.34 g/t gold, 0.18% copper)
• Highest grade ore at bottom of ultimate pit
• Potential to increase reserves and/or to mill other deposits in the region

Waste Alternatives Criteria
Safe & Environmentally Sound Containment and ARD Control for waste rock and tailings, for both Operations and for Long-Term Closure
• Design – accessible, “robust” dams with minimum heights, minimize # of facilities that could require long-term monitoring, minimize risk of failure, zero discharge
• Location – minimize environmental footprint and catchment areas.
• ARD Control – long-term disposal for both tailings and waste rock (minimal, if any, requirement for long term treatment of acid drainage)

Waste Characterization
• Kemess North contains elevated sulphides (as compared to Kemess South)
• Two streams draining the deposit are naturally acidic
• > 90% of waste rock will become acid generating if allowed to oxidize.
• 100% of tailings potentially acid generating
Existing DrainageStream Water Quality
pH < 5Copper 0.24 mg/LIron 21 mg/L
Waste Rock
NP/AP 95% of samples less than 2:1
Tailings
NP/AP 1:1
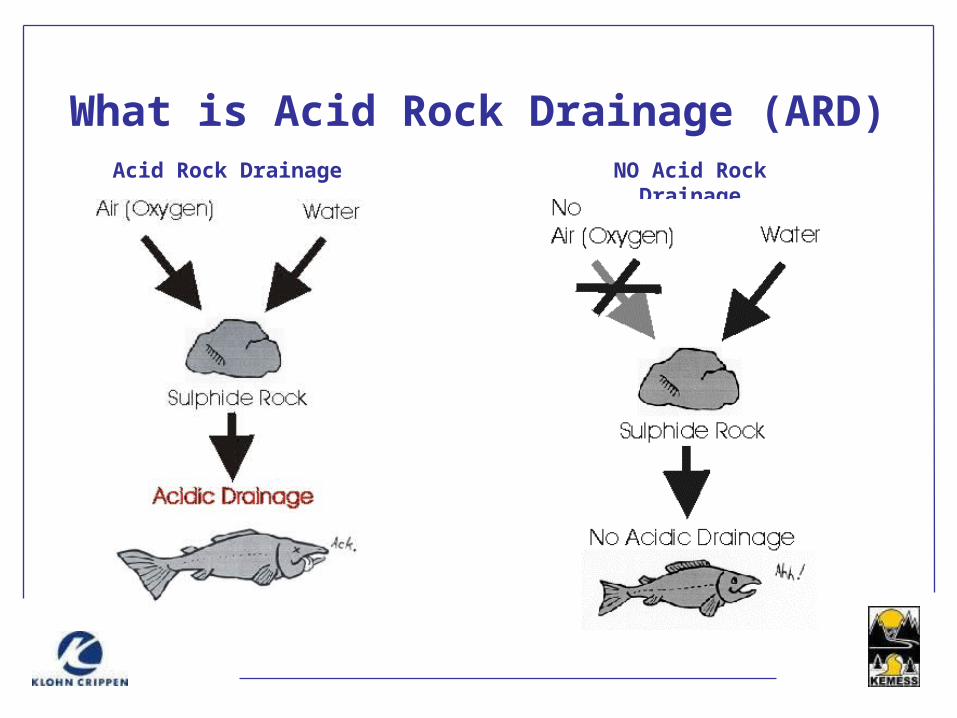
What is Acid Rock Drainage (ARD)Acid Rock Drainage NO Acid Rock
Drainage

Options to Control ARD• Remove oxygen by submerging tailings and waste rock
• e.g. Voiseys Bay Tambogrande
Equity Silver tailingsSnip and Eskay Mines
• Cover to reduce water inflow• e.g. Equity Silver waste rock
• Treat runoff for hundreds of yearsARD + Lime = Sludge + Clean Water
e.g Inco, Elliot Lake, Britannia? Samatosum, Equity Silver
• ARD Control for waste rock is more difficult than tailings, which are conventionally stored in a saturated state.

Framework for Alternatives Assessment
• “Brainstorming” session on all potential alternatives and pre-screening of alternatives
• Conceptual layouts of alternatives• Risk Assessment and cost comparison• Multiple accounts analysis and
compensation planning• Alternative Selection

Location Plan of Rejected Screening Sites
Pre-Screening Considerations• Topographically capable of
storing waste rock and/or tailings.
• Minimize catchment areas to reduce long term water management risks.
• Proximity to mine• Management ease (eg. Avoid
multiple sites)• Acid Rock Drainage
management• Sustainability and future
extensions to ore reserves
Kemess North Area

Location Plan of Selected Screening Sites
• Tailing Alternatives (330 Mt)• Raise existing tailings dam• Infill existing open pit (25% of
tailings)• Raise open pit• Sites L & M (close to Kemess
South Mine)• Site C and Kemess Lake• Duncan Lake (25% of tailings)
• Waste Rock Alternatives (250 Mt)• North & Northeast Dumps• Site C• Duncan Lake (50% of waste
rock)

Kemess North Area

Risk Assessment Methodology
• Based on the failure modes effects analysis (FMEA).
• Quantification basis developed for US Forest Service : New World Mine EIS. Modified to address issues with Kemess

Risk Assessment Methodology
• Workshop “Brainstorm” Session on Conceptual Designs• Identify potential problems (hazards)• Identify consequence• Quantify Likelihood (5 level scale)• Quantify Consequences (5 level scale)• Quantify Level of Confidence• Identify Compensating factors that could reduce risk
• Binning of Risks and Classification into Risk Levels (1 to 5)
• Risk Management to reduce risk

Quantification of Likelihood Levels
LEVEL ANNUAL PROBABILITY
RETURN PERIOD
(YR) TYPICAL EXAMPLES
E <10-4 > 10,000 Conceivable but improbable.
D 10-3 to 10-4 1,000 to 10,000
Rare, unlikely to happen. Eg. lightning death, Probable maximum flood, maximum credible
earthquake.
C 10-2 to 10-3 100 to 1,000 Possible: suicide, intermediate earthquakes & floods.
B 10-1 to 10-2 10 to 100 Likely: open pit slope failures, concrete degradation, death in a vehicle accident, cancer.
A > 10-1 < 10 Certain: pump shutdown, pipeline breakage, vehicle accidents, QA/QC excursions.

Definition of Consequence LevelsCATEGORY WATER QUALITY BIOPHYSICAL COMMUNITY -
SOCIAL COST
INSIGNIFICANT (1)
No detectable changes relative to “background” conditions. No measurable change of biological productivity. No measurable changes No measurable
changes
MINOR (2)
Minor changes, occasional exceedance of water quality standards1. Minimal impacts on aquatic life, less than <50% mortality2.
Reduction (<50%) in biological productivity lasting less than 1 year. Area affected is <0.1 to 1 km2. (Eg. Release of up to 10,000 t tailings/waters causing a reduction in algae and invertebrates, and fish migration out of the adjacent stream).
No negative effect in the socio-economics of local communities. Effects last less than 1 year. Affects < 10 people
Less than $1 million in costs. Local public image concern.
MODERATE (3)
Exceedance of water quality standards on a regular basis; sediment load between twice and 5 times baseline. Localized, short term, reversible impact on aquatic life with 50% mortality. Sulphate concentrations increased between 250 mg/L and 500 mg/L3.
Reduction (>50%) in biological productivity lasting from 1 to 5 years. Area affected is 1 to 10 km2. (Eg. Release of 10,000 to 100,000 t of tailings/water causing scouring of substrate that reduces algal and invertebrate populations for more than a year. Fish populations reduced in the watershed for more than 1 year.)
Reduction in the social and economic conditions of local communities. Effects lasting 1-5 years. Affects 10 to 100 people. Potential for 1 life lost.
$1 to 10 million in costs. Regional public image concern.
MAJOR (4)
Up to 10 times water quality standards for more than 7 days. Widespread, long-term impact on aquatic life with 50% to 90% mortality. Sediment load between 5 and 100 times baseline. Sulphate concentrations greater than 1,000 mg/L.
Reduction (>50%) in biological productivity lasting 5 to 30 years, and long-term change in biological populations. Area affected is 10 to 100 km2. (Eg. Release of 100,000 t to 1Mt of tailings/water causing a long-term reduction in algal and invertebrate populations, and a change in the fish community.)
Reduction in the social and economic conditions of regional communities. Affects 100 to 1,000 people. Potential for <10 lives lost.
$10 to 50 million in costs. National public image concern.
CATASTROPHIC (5)
Over 100 times water quality standards. Severe, potentially irreversible impact on aquatic life with over 90% mortality. Sediment loads greater than 100 times baseline. Sulphate concentrations between 1,000 mg/L and 10,000 mg/L, with sustained depressed pH and elevated metals present.
Reduction (>50%) in biological productivity lasting more than 30 years. Area affected is >100 km2. (Eg. Release of >1 Mt tailings and water filling downstream valley habitat that will take >30 years to recover forest, riparian, and stream habitat.)
Reduction in the social and economic conditions of national communities. Affects > 1,000 people. Potential for 10 or more lives lost.
>$50 million in costs. International public image concern.
Notes: 1. Water quality as defined by CCME guidelines for receiving water quality. 2. Impact on aquatic is quantified by bioassay tests to determine the mortality rate. 3. Sulphate concentrations are used as an indicator of acid rock drainage.
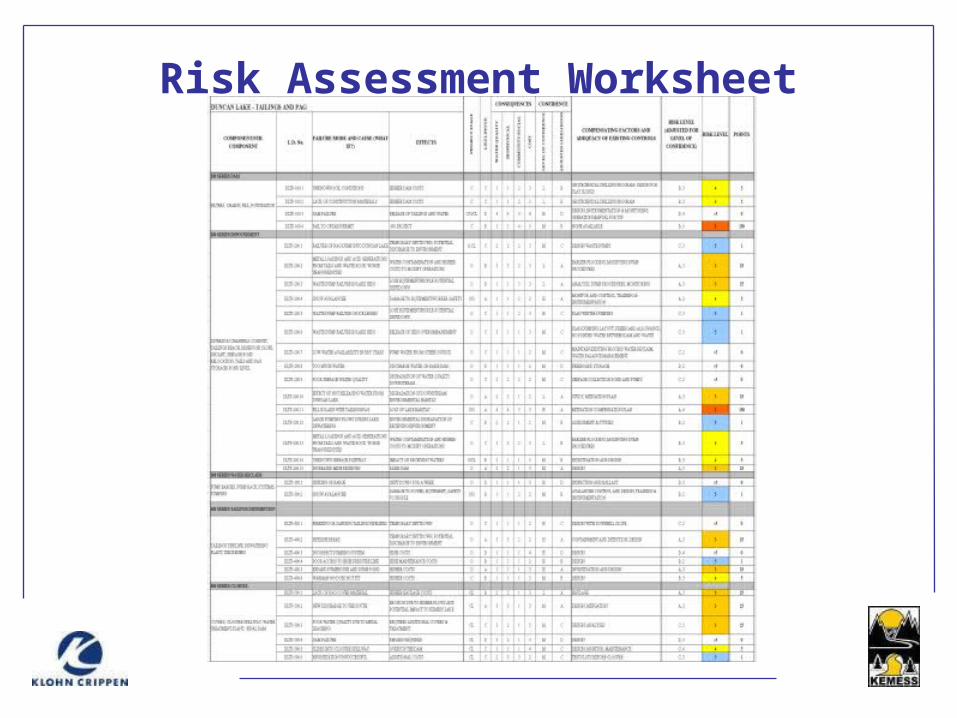
Risk Assessment Worksheet
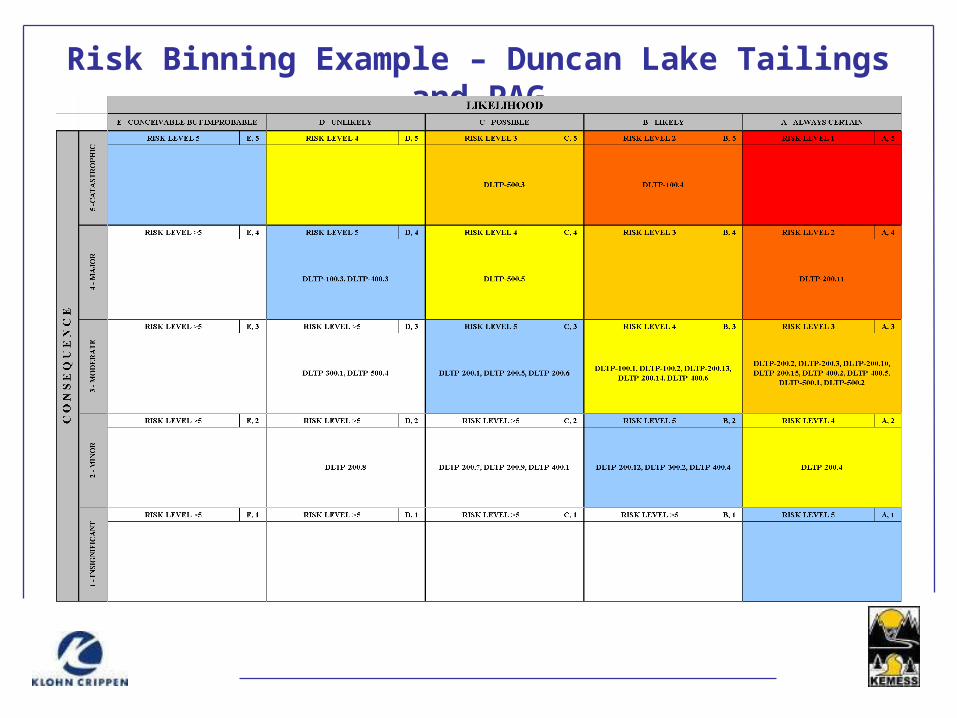
Risk Binning Example – Duncan Lake Tailings and PAG

Screening of Tailings Only Alternatives

Risk Points(Numerical Accounting for Risk
Levels)Assignment of risk points to each risk level
provides a qualification of the importance of higher risk levels. Risk Level Points
Level 1 750Level 2 150Level 3 25Level 4 5Level 5 1

Screening of Tailings Only Alternatives
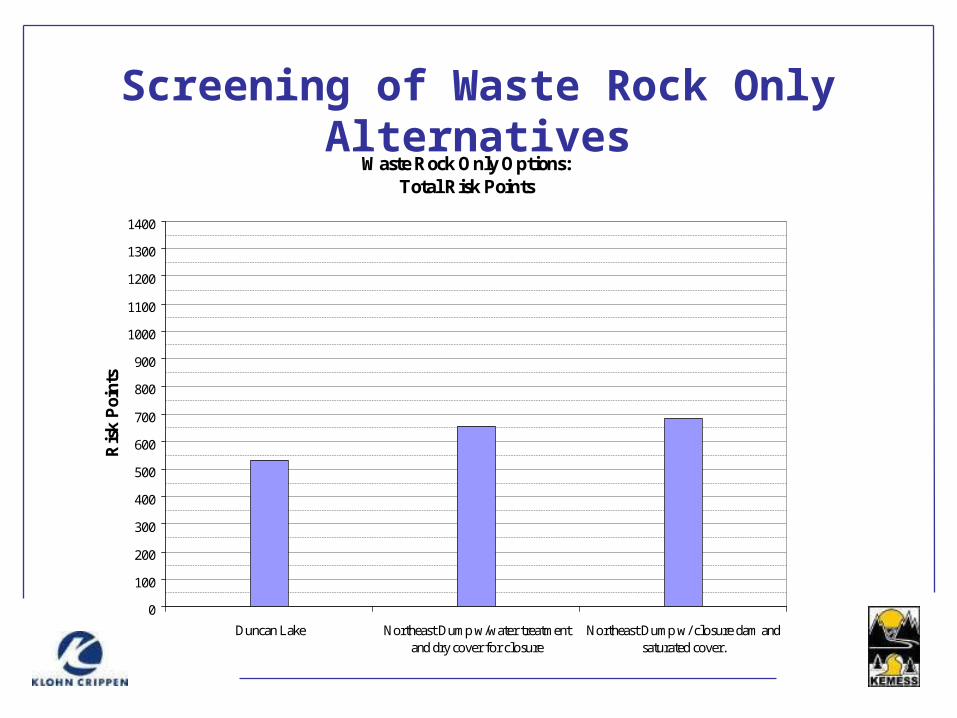
Screening of Waste Rock Only Alternatives
Waste Rock Only Options: Total Risk Points
0
100
200
300
400
500
600
700
800
900
1000
1100
1200
1300
1400
Duncan Lake Northeast Dump w/water treatmentand dry cover for closure
Northeast Dump w/ closure dam andsaturated cover.
Ris
k P
oin
ts

Open Pit Raising – Tailings Alternative
Main Risk Issues
• 100 m high dam stores 250 Mt (now need storage for +70 Mt)
• Removing sulphides from cycloned sand

Raise Existing Tailings Storage Facility Alternative
Main Risk
Issues• Dam
stability (raise from 145 m to 185 m)
• Water management
• Removing sulphides from cyclone sand.
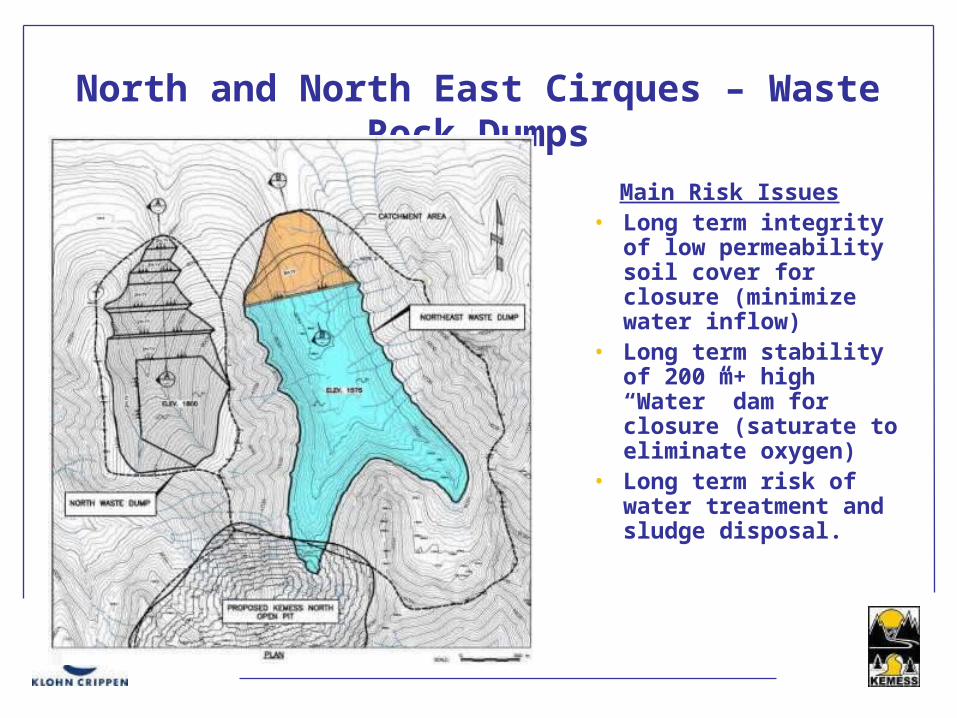
North and North East Cirques – Waste Rock Dumps
Main Risk Issues• Long term integrity
of low permeability soil cover for closure (minimize water inflow)
• Long term stability of 200 m+ high “Water” dam for closure (saturate to eliminate oxygen)
• Long term risk of water treatment and sludge disposal.
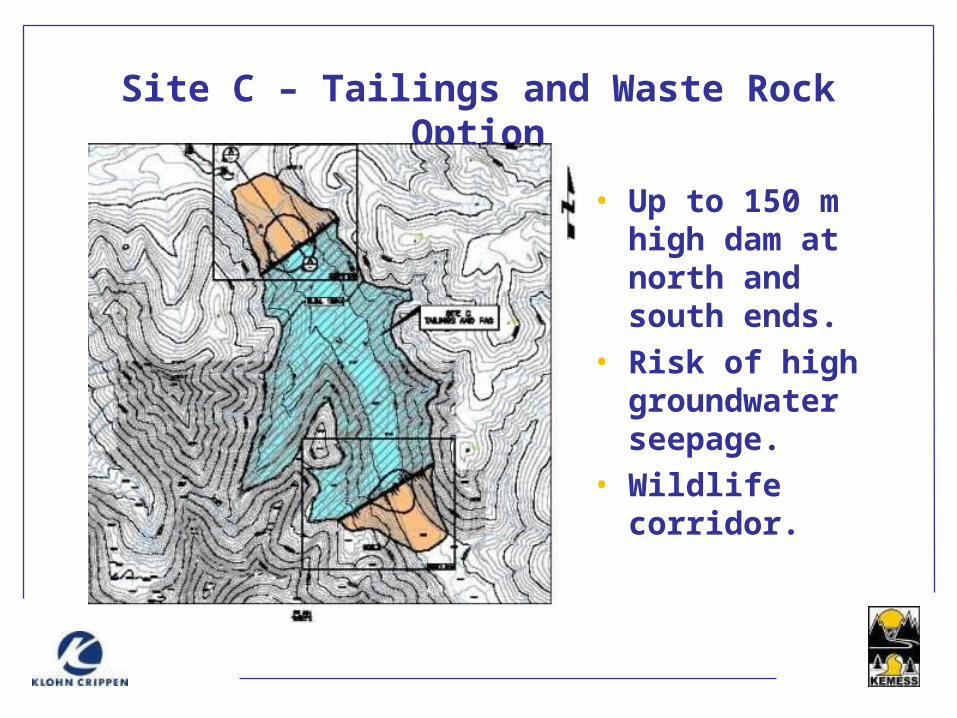
Site C – Tailings and Waste Rock Option
• Up to 150 m high dam at north and south ends.
• Risk of high groundwater seepage.
• Wildlife corridor.

Duncan Lake Tailings and PAG Storage Option
• Up to 70 m high dam
at north end.• 10m and 30 m high
dams at south end.• Existing Lake would
store• 50% of waste rock or• 25% of tailings
• Raise dams 40 m to store 100% more volume (future ore reserve potentials)
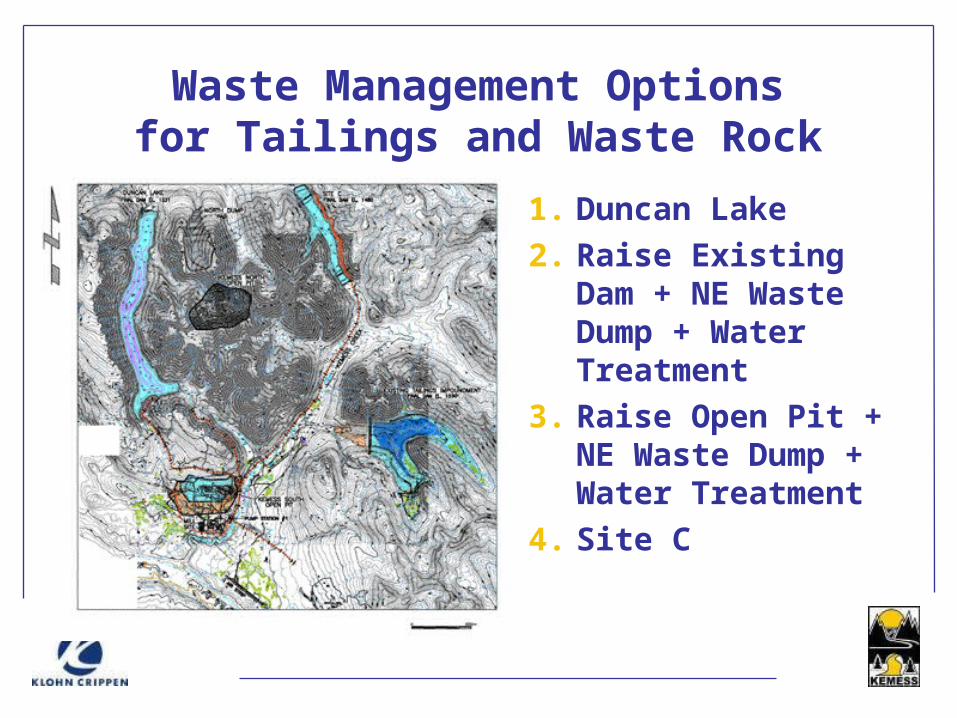
Waste Management Optionsfor Tailings and Waste Rock
1. Duncan Lake2. Raise Existing
Dam + NE Waste Dump + Water Treatment
3. Raise Open Pit + NE Waste Dump + Water Treatment
4. Site C

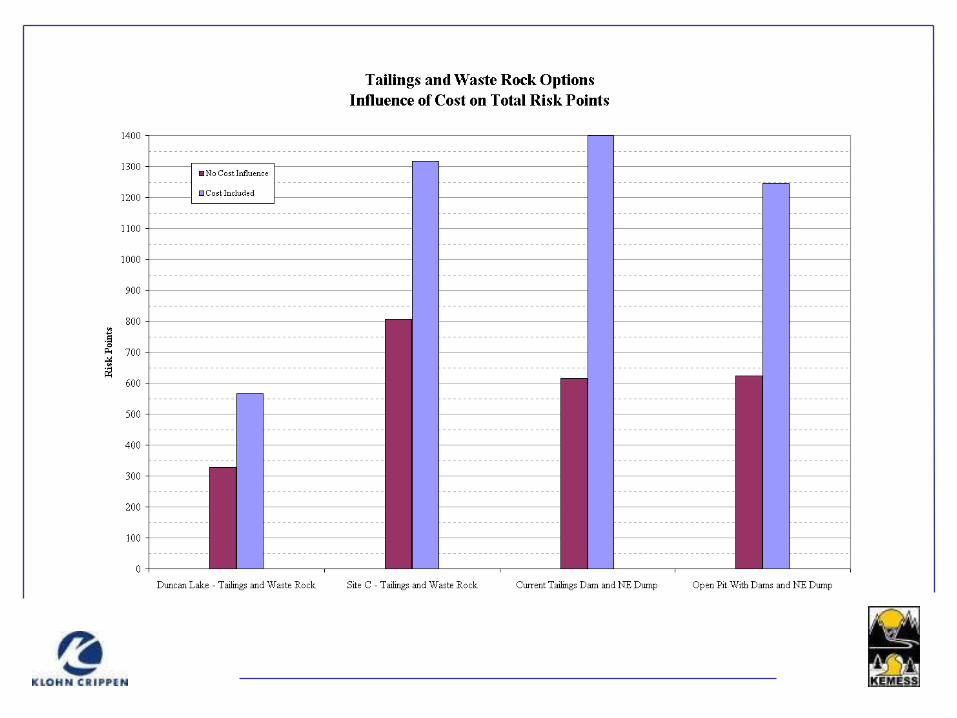
Tailings and Waste Rock Alternatives
Summary of Risk Counts
LO
W
O
VE
RA
LL
RIS
K
HIG
H

Tailings and Waste Rock Alternatives
Cost / Tonne of ore milled• Duncan Lake ($1.14)• Site C (5 km east of Kemess North
pit) ($4.63)• Existing Tailings Storage Facility and
NE Dump ($3.09)• Kemess South Pit Raised and NE
Dump ($1.95)

Multiple Accounts AnalysisDetermine Differentiating Accounts that affect
Environment, First Nations, Socio-economics, Project Viability and Sustainability
• Water Quality – Long-term water quality protection for aquatic life and downstream communities.
• Biophysical Environment – Fisheries, physical changes to aquatic and terrestrial habitats, traditional resources.
• Community / Social – Local First Nation communities and communities beyond.
• Project Viability – Cost
• Closure – Long-term sustainability and protection of traditional resources.

Multiple Accounts Analysis

Conclusions of Multiple Accounts and Risk Assessment
• Water quality risks are lower for Duncan Lake (trade off between aquatic risks during operation of Duncan Lake versus longer term risks with ARD from “on-Land” waste dumps.
• Biophysical risks are lower for Duncan Lake due to smaller footprint. However, aquatic impacts during operations are higher due to the use of the lake.
• Long term closure risks are lower for Duncan Lake.
• The cost risk for Duncan Lake is lower because of the lower dams and lower uncertainty for closure.

Kemess North Post Closure

Conclusions
• Duncan Lake is the lowest risk and the best technical and cost alternative to store all waste rock and tailings.
• The next “best” alternative is to raise the existing open pit and construct “on-land” waste rock dumps that will require:
• Long term closure liability and closure risk of ARD from “on-land” waste rock dumps
• Limitation of raising of dam that would require raising the existing tailings facility to use the latest ore reserve estimates.
• Limitation on mining future ore reserves and longer term sustainability of mining in the project area.
• Additional $300 million cost

Conclusion (continued)
• Duncan Lake habitat will be destroyed and this requires:• Quantification of aquatic habitat of Duncan Lake and
potentially affected streams (Duncan and Attycelley Creeks)• Mitigation of Duncan Creek stream flow reduction and
reclamation of aquatic habitat for closure of Duncan Lake; and • Compensation for loss of productive habitat by construction of
new habitat and enhancement of existing habitat.
• The Environmental Design and Environmental Impact Assessment Teams are currently carrying out detailed analyses of aquatic habitat and compensation planning and a preliminary update on this work is summarized in the following presentation by Hatfield Consultants.