Kelvin H. Lee - UCLAhelper.ipam.ucla.edu/publications/protws2/protws2_4645.pdf · Kelvin H. Lee...
58
Proteomics and the Antemortem Diagnosis of Neurodegenerative Disease (and a vignette) Kelvin H. Lee Kelvin H. Lee Chemical and Biomolecular Engineering Cornell Proteomics Program Cornell University
Transcript of Kelvin H. Lee - UCLAhelper.ipam.ucla.edu/publications/protws2/protws2_4645.pdf · Kelvin H. Lee...
Proteomics and the Antemortem Diagnosis of Neurodegenerative Disease
(and a vignette)
Kelvin H. LeeKelvin H. Lee
Chemical and Biomolecular EngineeringCornell Proteomics Program
Cornell University

+hrpL∆hrp/hrc

lysate aliquots
cells
sample preparation
IPG strips100µg
100µg
100µg
100µg
100µg x 4
70µg each
130µg each
4 Prep
1 Prep
Var Load
But is it reproducible ?

Melanie 3 AnalysisSpots Matched in 2 out of 4 gels
Expt #spots 0.3 0.4 0.5 0.6 0.7 0.8 0.9 11 Prep 815 76% 88% 94% 97% 99% 99% 100% 100%4 Prep 842 65% 79% 90% 96% 98% 99% 100% 100%
Var Load 919 72% 85% 92% 97% 98% 99% 100% 100%
Spots Matched in 3 out of 4 gelsExpt #spots 0.3 0.4 0.5 0.6 0.7 0.8 0.9 1
1 Prep 793 76% 88% 94% 97% 99% 99% 99% 100%4 Prep 757 65% 79% 90% 96% 99% 99% 100% 100%
Var Load 879 73% 85% 93% 97% 99% 99% 100% 100%
Spots Matched in 4 out of 4 gelsExpt #spots CV=0.3 0.4 0.5 0.6 0.7 0.8 0.9 1
1 Prep 771 76% 88% 94% 97% 99% 99% 99% 100%4 Prep 641 65% 79% 90% 96% 99% 100% 100% 100%
Var Load 824 74% 86% 93% 97% 99% 99% 100% 100%
Expt Qual CV1 Prep 0.034 Prep 0.14
Var Load 0.05
Bottom line (with various caveats) :95% of the spots exhibit a CV < 0.52.

SYPRO Rubystained gels
56.1
46.5
42.0
33.6
15.8
17.0
19.0
22.9
25.8
ODP2RS1
DNAK
CH60TIG
ATPB
OPPA
IMDHDPPA
DLDHATPA
GLYAGLYA
CARA
DEGQ,ENO
ALF
LIVJSERC
EFTSTALB
POTD
FABD
HISJFLIY
GRPE
TPIS
G3P1
PYRBHYPB
SUCD
IPYR,AHPC
UPP SODM
RL9
PYRI
RL9
FUR
BCCP SGAH
AROK
CYPBDKSA DKSA
CH10USPA
RS6
LEU2
NUSA
PTGAPTGA
4.68 5.14 5.34 5.55 5.93 6.856.446.17
MW(kDa)
pI

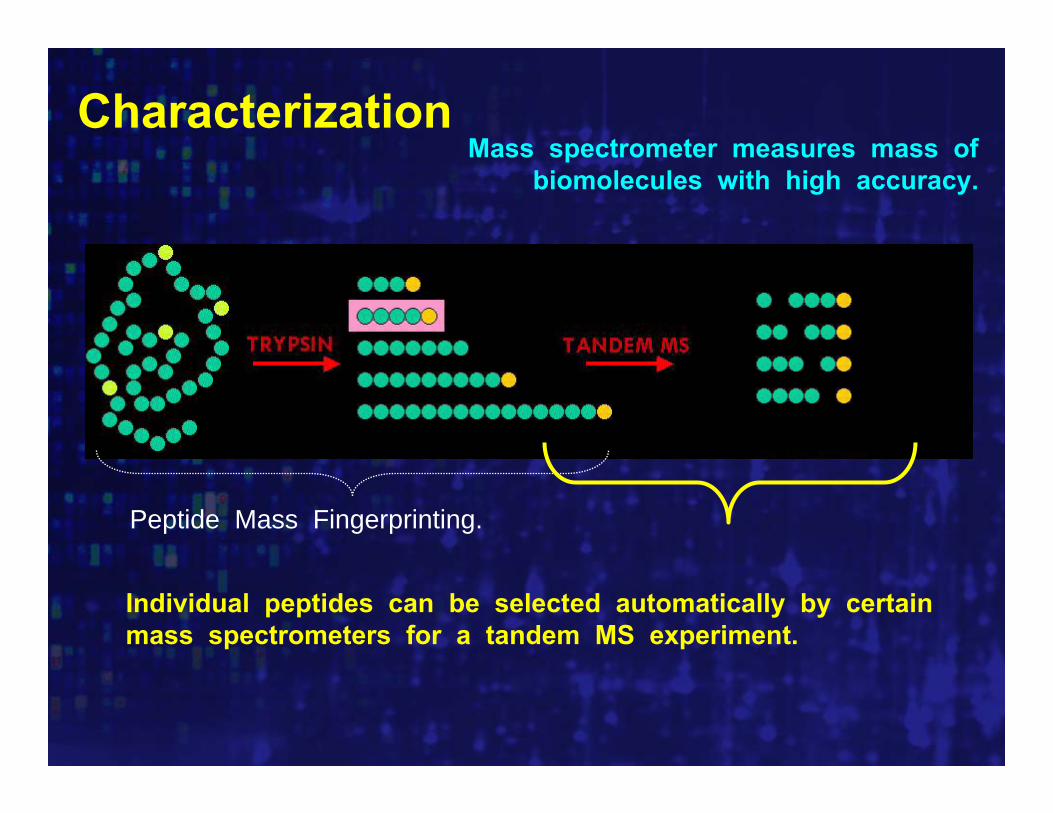
Characterization
Accurate mass measurement (ppm) of resulting tryptic peptides can be compared to in silico tryptic digests of sequence databases - Peptide Mass Fingerprinting.
Mass spectrometer measures mass of biomolecules with high accuracy.
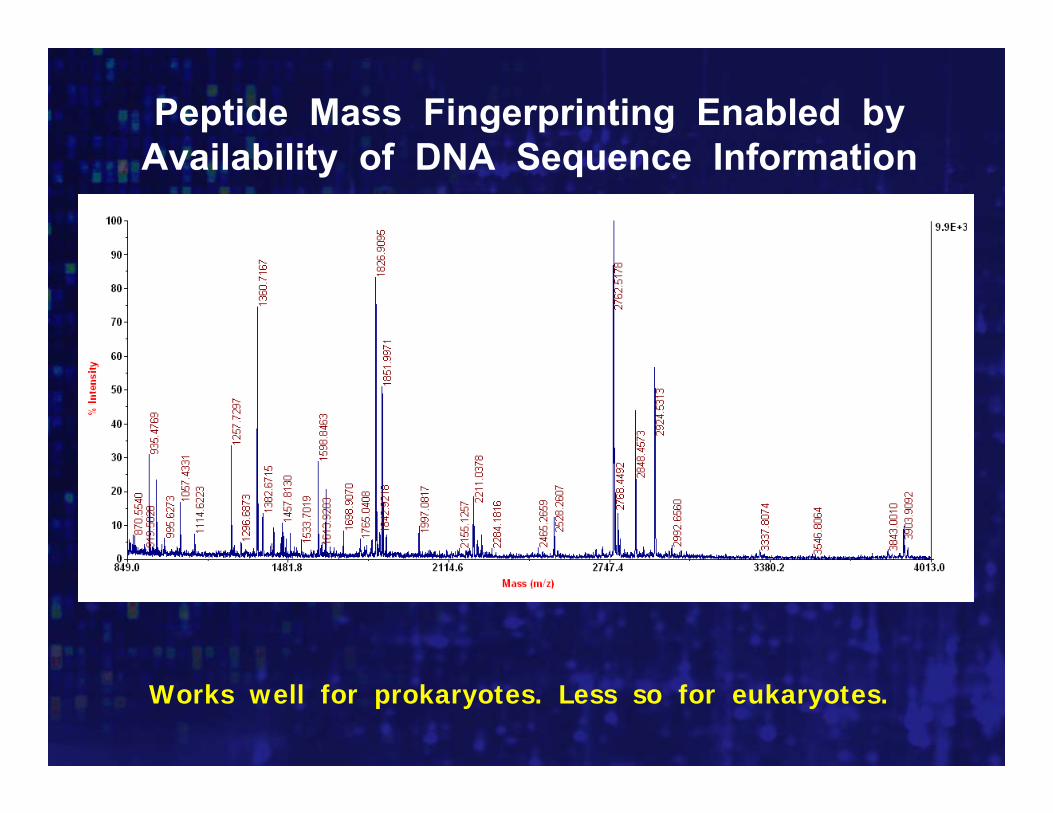
Peptide Mass Fingerprinting Enabled by Availability of DNA Sequence Information
Works well for prokaryotes. Less so for eukaryotes.
Characterization
Peptide Mass Fingerprinting.
Individual peptides can be selected automatically by certain mass spectrometers for a tandem MS experiment.
Mass spectrometer measures mass of biomolecules with high accuracy.

MS/MS Analysis ofMS/MS Analysis ofHOHO22CC--RR--TT--LL--EE--SS--SS--MM--AA--TT--FF--EE--NHNH22
L E S STR M T F EA

Tandem MS enables sequencing & high confidence characterization.MALDI facilitates simplicity.

MOWSE scores representMOWSE scores representprobabilityprobability of random matchof random match1030 1030 ⇒⇒ P = 1.85P = 1.85xx1010--4343

Cerebrospinal Spinal Fluid (CSF)Cerebrospinal Spinal Fluid (CSF)Proteins as Central NervousProteins as Central Nervous
System Disease MarkersSystem Disease Markers
LumbarLumbarCSFCSF
NormalNormal
DifferentDifferent
disease specificdisease stage (early/late)symptom specificpathology specificseverityresponse to therapysample specific
AnalysisAnalysis

Vascular dementia - noneDementia with Lewy bodies - noneFrontotemporal dementia - noneAlzheimer’s disease - Aβ1-42, Tau, AD7C-NTP
Neurology ( 2001) v56: 1143 Practice Parameter: Diagnosis of Dementia.
Aβ1-42 83% sens, 82% specTau 88% sens, 92% specAβ1-42 + Tau 85% sens, 87% specAD7C-NTP 70% sens, 87% spec
Are there any dementia biomarkers in CSF ?
Sensitivity - true positiveSpecificity - true negative

200
100
70
50
30
20
4.5 5.0 5.5 6.0 6.5 7.0 8.0
pI
kDa
1 Albumin2 Gelsolin3 a-1-antitrypsin4 Ceruloplasmin5 a-1-B gylcoprotein6 Hemopexin7 a2-HS glycoprotein8 Leucine-rich a-2-glycoprotein9 Haptoglobin10 Zinc-a-2-glycoprotein11 Apolipoprotein J12 Apolipoprotein E13 Apolipoprotein A-I14 Hp2-a-haptoglobin15 Transthyretin16 Apolipoprotein A-IV17 EPC-118 Antithrombin III19 Complement componenet 4A20 Complement component 321 Prostaglandin D2 synthase22 Kallikrein 623 Transferrin24 Complement factor B25 Vitamin D binding protein26 β-2-glycoprotein27 Retinal binding protein28 Collagenase type IV29 Fibrinogen beta30 Fibrinogen gamma31 Ig heavy chain32 Serum amyloid P33 Ig light chain34 Angiotensinogen35 Cu/Zn superoxide dismutase36 Fibronectin37 Inter-α-trypsin inhibitor heavy chain38 Plasminogen39 Complement factor H40 Glutathione S-transferase41 α-1-antichymotrypsin42 kininogen43 Perlecan
1
10
7
61
1
2
4
3
1
1
3
33
3
5
25
99
8
19
18
16
14
13
12
11
12
15
15
15
17 17
19
2121
21
21
20
24
23
23
22
21
28
27
26
25
31
32
30
30
29
34
25 21 33
453837
36
35
4241
40
391
1
1
3
13
43
17
1
123
10
1
1
17
30
15

www.leelab.org/csfmap


TransmissibleTransmissible Spongiform EncephalopathySpongiform Encephalopathy(TSE)(TSE)
In humans:In humans:Creutzfeldt–Jakob disease (CJD)New variant CJDKuruothers
In animals:In animals:Scrapie (sheep)Bovine spongiform encephalopathy (BSE)Transmissible mink encephalopathy (TME)others
KuruKuru

Molecular PathologyMolecular Pathology-- An EnigmaAn Enigma
• Normal• Normal prion prion protein (protein (PrPPrP))has unknown function.has unknown function.
• In• In TSEsTSEs,, PrP PrP is “is “misfoldedmisfolded” (” (PrP PrPPrP PrPresres))and amplified.and amplified.
• BUT, one cannot reconstitute the disease• BUT, one cannot reconstitute the diseasewith this purewith this pure PrPPrPresres and different strainsand different strainsofof PrPPrPresres appear to exist.appear to exist.
• Heat, denaturants and proteases do not• Heat, denaturants and proteases do noteliminate transmissibility.eliminate transmissibility.
PrPPrPresres

Unifying Characteristics ofUnifying Characteristics of TSEsTSEsTransmissible (inter andTransmissible (inter and intraspeciesintraspecies) ) -- agentagent
is very resistant to decontaminationis very resistant to decontaminationPrionPrion -- no inflammatory responseno inflammatory responseExposure, long incubation, onset of symptomsExposure, long incubation, onset of symptomsFatalFatalSpongiform Spongiform pathologypathology

TransmissibleTransmissible Spongiform EncephalopathySpongiform Encephalopathy(TSE)(TSE)
In humans:In humans:
Sporadic CJD
New variant CJD
others
In animals:In animals:
Scrapie (sheep)
“Mad Cow disease” (BSE)
others
many yearsmany years
since 1996since 1996
many yearsmany years
since 1986since 1986
?
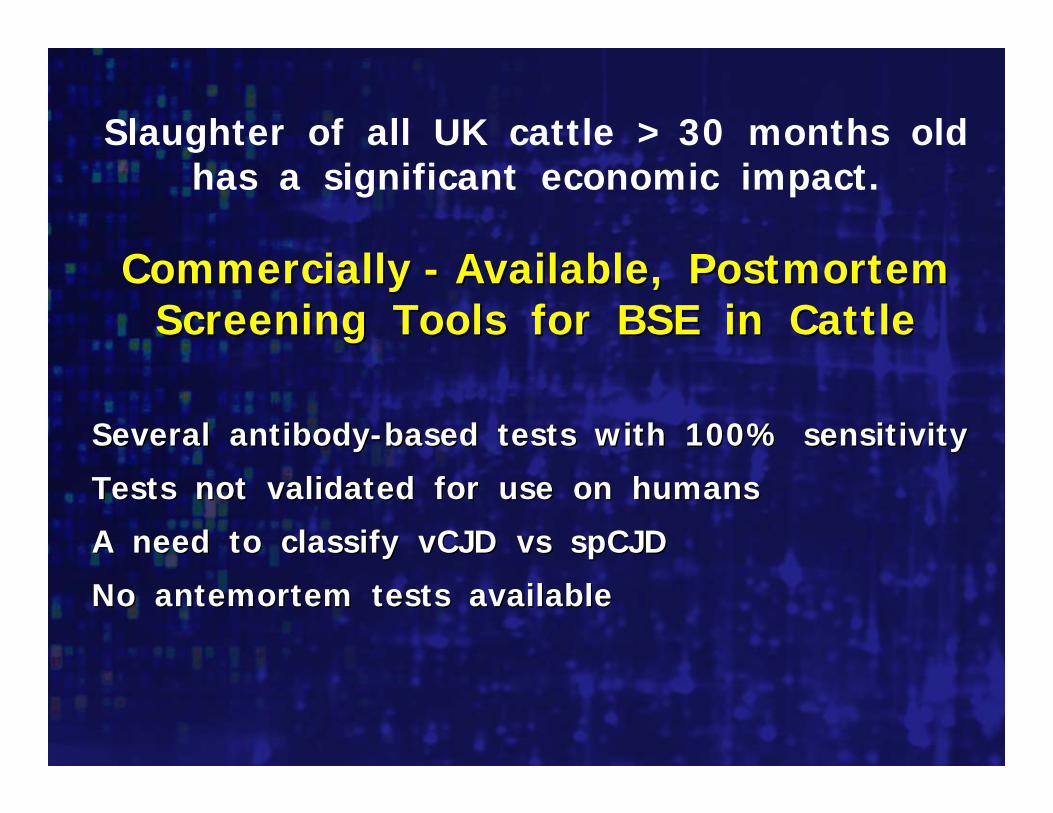
Commercially Commercially -- Available, PostmortemAvailable, PostmortemScreening Tools for BSE in CattleScreening Tools for BSE in Cattle
Several Several antibodyantibody--based tests with 100% sensitivitybased tests with 100% sensitivity
Tests not validated for use on humansTests not validated for use on humans
A need to classifyA need to classify vCJD vs spCJDvCJD vs spCJD
No No antemortem antemortem tests availabletests available
Slaughter of all UK cattle > 30 months oldhas a significant economic impact.

Total def & pr vCJD = 139 in UK
CJD in UK (since 1993)CJD in UK (since 1993)
spCJD
iatrogenic CJD
other CJD
prob vCJD (alive)
vCJD (pending PM)
vCJD (confirmed)
Total
1993
38
4
4
0
0
0
46
1994
51
1
7
0
0
0
59
1995
35
4
5
0
0
3
47
1996
40
4
6
0
0
10
60
1997
59
6
5
0
0
10
80
1998
63
3
5
0
0
18
89
1999
62
6
2
0
0
15
84
2000
49
1
3
0
0
28
81
2001
55
3
4
0
0
20
82
2002
73
0
5
0
0
17
95
2003
57
4
4
0
0
18
83

Differential Diagnosis: Alzheimer’s, AIDS dementia,Differential Diagnosis: Alzheimer’s, AIDS dementia,multimulti––infarct dementia, etc.infarct dementia, etc.
Antemortem Antemortem Diagnosis Diagnosis -- HumansHumans
Clinical DiagnosisClinical Diagnosis• Atypical,• Atypical, subacute subacute dementiadementia• Startle • Startle myoclonusmyoclonus• “At risk” populations• “At risk” populations• Brain biopsy• Brain biopsy• Characteristic EEG• Characteristic EEG
Iatrogenic transmission and may miss site of pathology
Not for atypical cases like vCJD
( Misdiagnosis of BSE and of animal TSEs )

Silver Stain Silver Stain 2DE2DE––SeparatedSeparated
Proteins in Proteins in Cerebrospinal Cerebrospinal
FluidFluidfrom a “Normal” from a “Normal”
VolunteerVolunteer
Fibrinogen γchain
transthyretin
Apo A-1Ig light chains
α1 Antitrypsin
ApoJ
IgG heavy chains
serotransferrinalbumin
α2-HSglycoprotein
α1-antichymotrypsin
200
100
70
50
30
20
4.5 5.0 5.5 6.0 6.5 7.0 8.0
pI
kDaplasminogen

Proteomics Identifies Two Creutzfeldt–JakobDisease Associated Proteins
Normal CSFNormal CSF CJD CSFCJD CSF
130 (5.2, 26 kD)131 (5.1, 29 kD)

Results with the 130/131 Assay in theResults with the 130/131 Assay in theDifferential Diagnosis of Demented PatientsDifferential Diagnosis of Demented Patients
69 of 70 (>98%)69 of 70 (>98%)
CJD patients were positiveCJD patients were positive
297 of 298 (>99%)*297 of 298 (>99%)*
control patients were negativecontrol patients were negative
*primary CNS lymphoma*primary CNS lymphoma
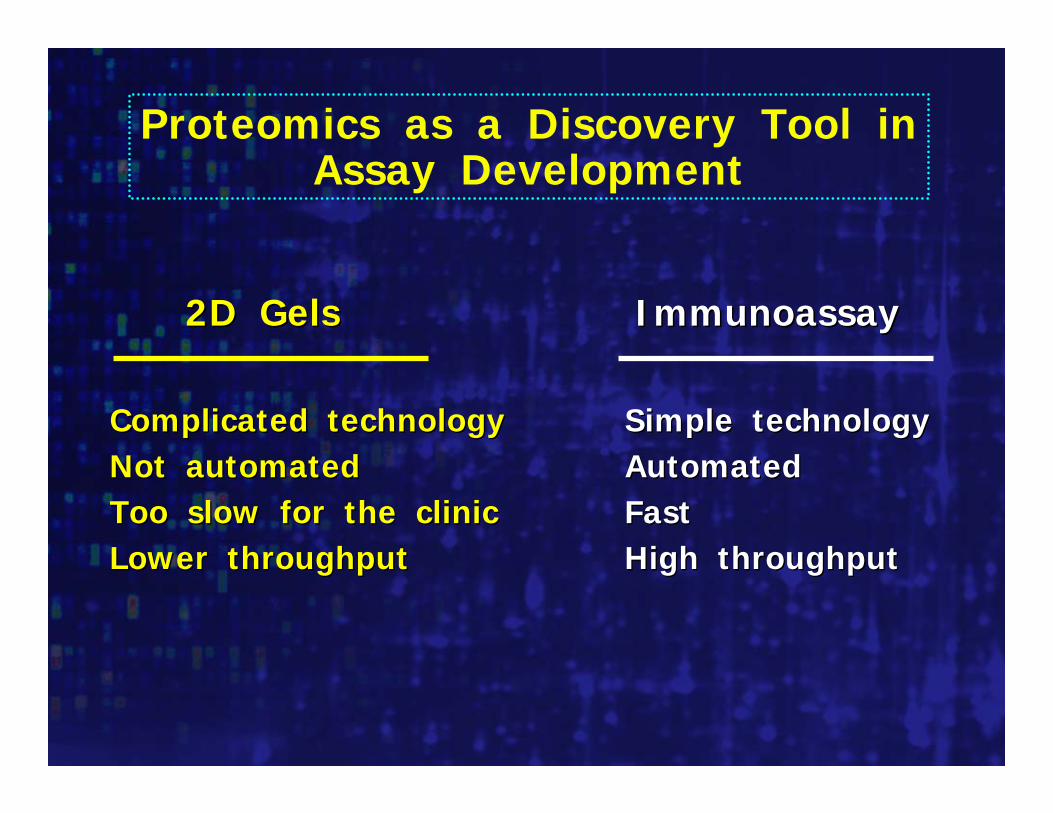
Proteomics as a Discovery Tool inAssay Development
ImmunoassayImmunoassay
Simple technologySimple technologyAutomatedAutomatedFastFastHigh throughputHigh throughput
2D Gels2D Gels
Complicated technologyComplicated technologyNot automatedNot automatedToo slow for the clinicToo slow for the clinicLower throughputLower throughput

How can we purify enoughHow can we purify enoughmaterial for sequencing ?material for sequencing ?
Hypothesis:Hypothesis:The appearance of 130/131 in CSF of CJD patientsis a result of spongiform pathology. As neurons aredestroyed their protein content leaks into the CSF.
Can we find 130/131 in brain extractCan we find 130/131 in brain extractfrom normal individuals?from normal individuals?

130
131
Identification of CSF Proteins 130/131Identification of CSF Proteins 130/131in Normal Brain Extractin Normal Brain Extract
CJDCSF
NormalBrain
NormalBrain

Characterization of Spot 130Characterization of Spot 130
Brain spot corresponding to CSF 130 pooled from 10 blotsLysC digestion4 sequences obtained (initial yield 4 ± 2 pmol):
VTELNEPLXNEDXNLLSVA
DYYXYLAEVATGEK
NVVXARRSSXRVISSIEQ
YSEAXEIS
human 14human 14––33––33γㆆ
††Sequence information from A.Sequence information from A. AitkenAitken

1414––33––3 Family of Proteins3 Family of Proteins
SevenSeven isoformsisoforms
Highly conserved sequenceHighly conserved sequence
Variety of functions:Variety of functions:signal transductioncell cycle controlexocytosismelatonin biosynthesis
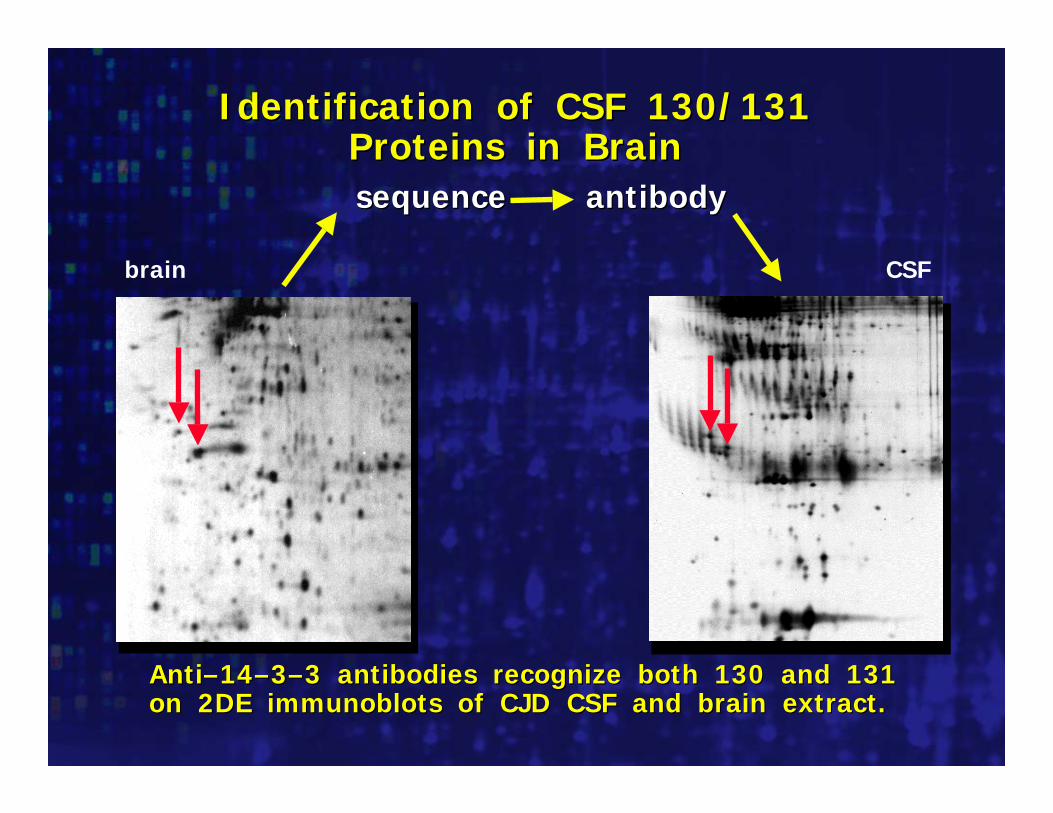
Identification of CSF 130/131Identification of CSF 130/131Proteins in BrainProteins in Brainsequencesequence antibodyantibody
brain CSF
AntiAnti––1414––33––3 antibodies recognize both 130 and 1313 antibodies recognize both 130 and 131on 2DEon 2DE immunoblots immunoblots of CJD CSF and brain extract.of CJD CSF and brain extract.

1D Assay for 1D Assay for TSEsTSEsincluding BSEincluding BSE
1: Alzheimer’s2 & 3: CJD4: normal cow5: experimental TME in cow6: normal human serum7: CJD serum8: normal human brain9: PrP–pur. brain extract – CJD
3030 kDkD
BSEBSE controlcontrol+
1 2 3 4 5 6 7 8 9
3030 kDkD

Cattle: induced TME+ pathology– pathology
Cattle: induced scrapieCattle: normal controlsCattle: BSECattle: BSE normal controls
Sheep: scrapieSheep: normal controls
Chimps: induced TSEChimps: normal controls
Total animals with + pathTotal animals with – path
5 31* 1*4 315 010 106 1
6 51 0
15 1577 0
40 36100 2
ANIMALSTOTAL POSITIVESAMPLES SAMPLES
*This cow had clinical symptoms of TSE but normal histopathology

Effectiveness of Assays for TSE
2DE - HumanOverall SensitivityOverall Specificity
> 98 % (69/70)> 99 % (297/298)
1D - HumanOverall SensitivityOverall Specificity
> 96 % (68/71)> 99 % (90/91)
1D - AnimalOverall SensitivityOverall Specificity
90 % (36/40)98 % (98/100)
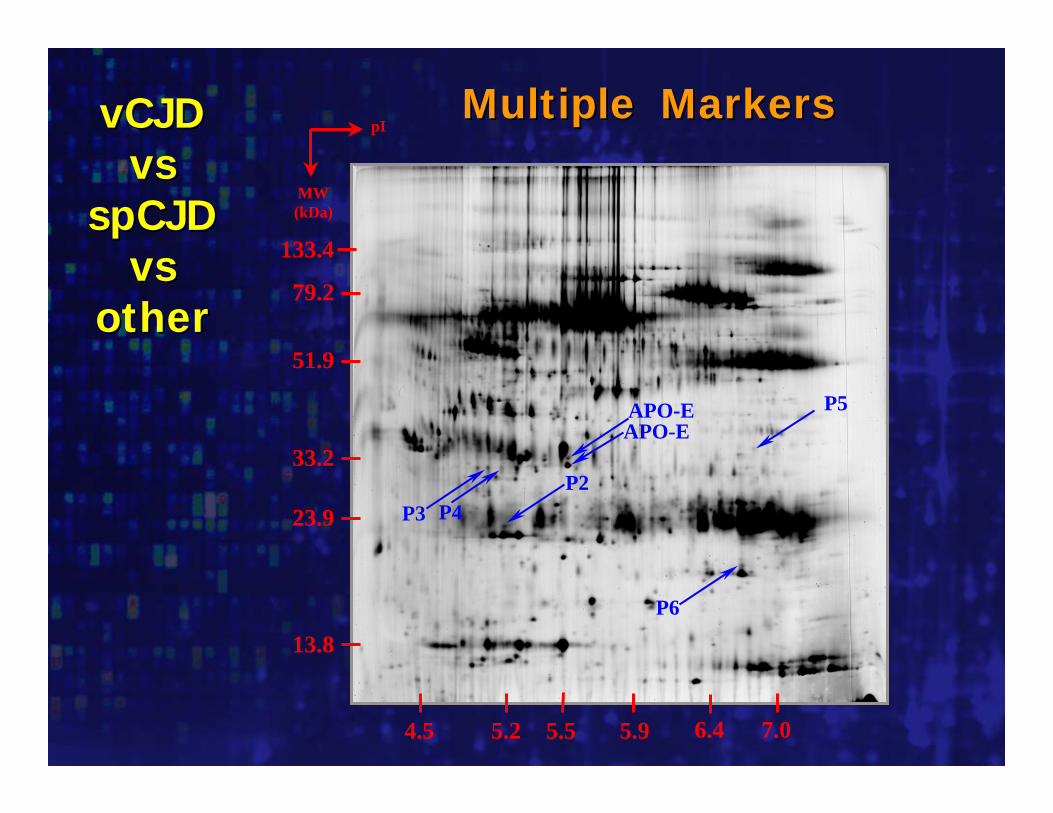
pI
MW(kDa)
P3 P4P2
APO-EAPO-E
P6
P5
7.06.45.95.2 5.54.5
79.2
51.9
33.2
23.9
13.8
133.4
vCJDvCJDvsvs
spCJDspCJDvsvs
otherother
Multiple MarkersMultiple Markers

Heuristic Clustering Heuristic Clustering –– Class Level 2Class Level 2
vCJD vCJD AD AD spCJD spCJD spCJD Pick’s
Non developed branchDeveloped branch
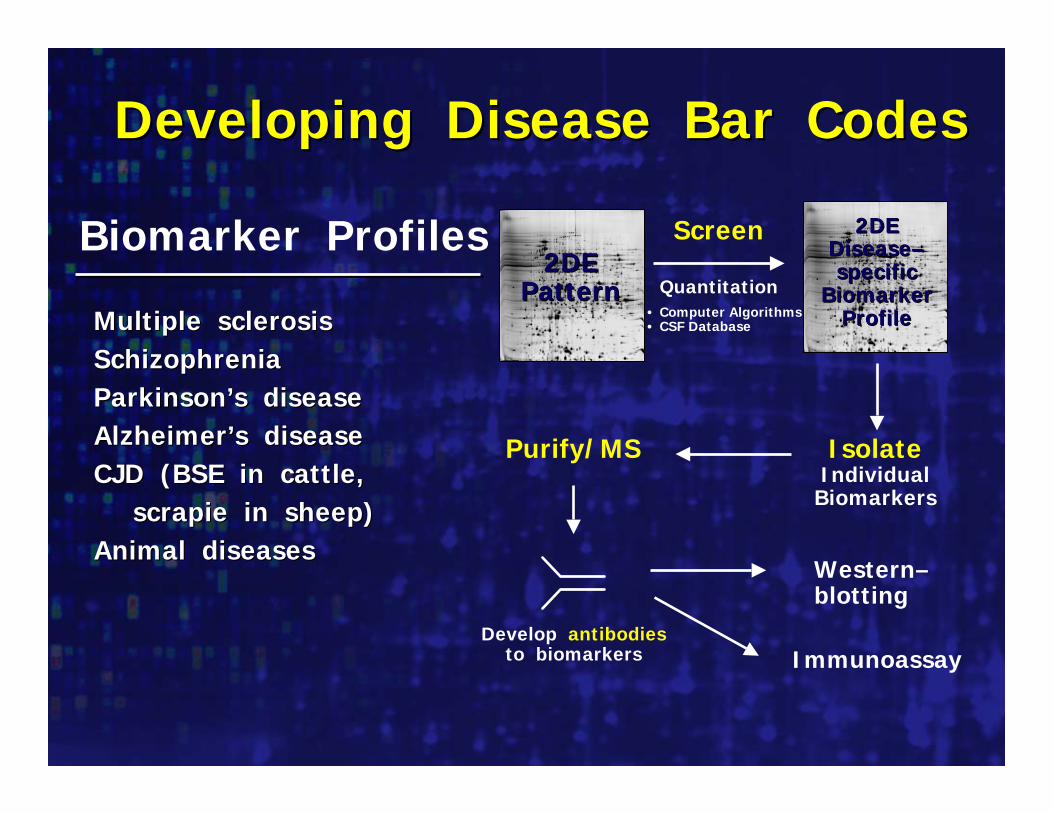
Developing Disease Bar CodesDeveloping Disease Bar Codes
Multiple sclerosisMultiple sclerosisSchizophreniaSchizophreniaParkinson’s diseaseParkinson’s diseaseAlzheimer’s diseaseAlzheimer’s diseaseCJD (BSE in cattle,CJD (BSE in cattle,
scrapie scrapie in sheep)in sheep)Animal diseasesAnimal diseases
Biomarker Profiles
IsolateIndividual
Biomarkers
Purify/MS
Develop antibodiesto biomarkers
Western–blotting
Immunoassay
2DE2DEPatternPattern
Screen
Quantitation• Computer Algorithms• CSF Database
2DE2DEDiseaseDisease––specificspecific
BiomarkerBiomarkerProfileProfile

The “Central Dogma” (?)DNADNA
mRNAmRNA
proteinprotein
activities / functionsactivities / functions
genome sequencing effortsgenome sequencing efforts
chips,chips, beads & othersbeads & others
2D electrophoresis,2D electrophoresis,MSMS & others& others
metabolites,metabolites,f(x)al interactions, etc.f(x)al interactions, etc.
transcription
translation
The machine does not isolate us from the great problems of nature but plunges us more deeply into them.
The Wind, Sand and Stars, Antoine de Saint-Exupéry, 1939

Chip to Gel MappingChip to Gel Mapping
f?
A second story

DNADNA
mRNAmRNA
proteinprotein
activitiesactivities
Gygi Gygi et alet al 19991999
YeastYeast

If mRNA for gene X increases 2-fold when the system is perturbed, how much does the protein for gene X increase by?
oj
jpj
ojT
jTmj P
Pf
M
Mf
,
?
,,
, ≡≈≡
“mRNA amplification factor”
“protein amplification factor”

mi
oiRoo
oioopi f
QskrfMr
rr
QskrMrfT
⋅⎟⎟⎟⎟
⎠
⎞
⎜⎜⎜⎜
⎝
⎛
⋅⋅+⋅
⋅⋅+= ~
~
SOLVING THE SYSTEM : A KEY RESULT
oT
TR
RRf T
,
≡where ratio of total # ribosomes
mRNA amplification factor
protein amplification factor
effective ribosome binding constant
free ribosomes

COMPUTATIONAL STUDIES
mif
pif
0 0.5 1 1.5 20
0.5
1
1.5
2
0 0.5 1 1.5 20
0.5
1
1.5
2
↑↑↓ miioi frp asand κ,
1.0=mif
0 0.5 1 1.5 20
0.5
1
1.5
2
0 0.5 1 1.5 20
0.5
1
1.5
2
↑↑↑ miioi frp asand κ,
1.0=mif
mif
pif
0 1 2 3 4 50
1
2
3
4
5
0 1 2 3 4 50
1
2
3
4
5
0
1
2
3
4
5
0 1 2 3 4 50
1
2
3
4
5
0
1
2
3
4
5
0 1 2 3 4 50
1
2
3
4
5
0
1
2
3
4
5
1.20=mif
mif
pif
0 0.5 1 1.5 2 2.50
0.5
1
1.5
2
2.5
0 0.5 1 1.5 2 2.50 0.5 1 1.5 2 2.50
0.5
1
1.5
2
2.5
0
0.5
1
1.5
2
2.5
0 0.5 1 1.5 2 2.50 0.5 1 1.5 2 2.50
0.5
1
1.5
2
2.5
0
0.5
1
1.5
2
2.5
0 0.5 1 1.5 2 2.50 0.5 1 1.5 2 2.50
0.5
1
1.5
2
2.5
0
0.5
1
1.5
2
2.5
0.80=mif
mif
pif
m
if total mRNA in the cell

Experimental Results - E. coli
• Induction of parallel cultures with 0, 0.1, 1.0 mM IPTG.
• Comparison of Hly super-secreting mutant vs controls.
• Studies on the effect of Fis expression level.
• mRNA analysis by Affymetrix Genechips - 3 metrics.
• Protein measurements by 2DE/MS & ICAT - 4 metrics.
• Biological Replicates

yig yig F F -- hypo. proteinhypo. proteinabsentabsent
uxaCuxaC -- uronate uronate isomeraseisomerasepresentpresent
yghQyghQ -- hypo. proteinhypo. proteinpresentpresent
cspAcspA -- cold shock protein 7.4cold shock protein 7.4presentpresent
rfaB - a lipopoly sugar transferaseabsent
probe pair
probe setmismatch
perf. match

leuC (P30127; B0072)
leuC protein is downregulated (~25% for the culture) for shift from 0 mM IPTG to 0.1 mM IPTG to 1.0 mM IPTG.
OPPAIMDHDPPA
DLDH ATPA
GLYAGLYA
CARALEUC
Ammonical Silver
OPPA
IMDHDPPA
DLDHATPA
GLYACARALEUC
SYPRO Ruby
GLYA
OPPAIMDHDPPA
DLDHATPA
GLYACARALEUC
35S methionine
GLYAGLYA
Colloidal Blue
LEUC
IMDH
OPPAATPADLDH
CARA GLYA
DPPA
Fold change (fp) (low) (high)Ruby (%vol) 1.14 0.88Silver (%vol) 1.99 1.75Blue (%vol) 0.97 0.58S35 (vol/stds) 0.76 0.35
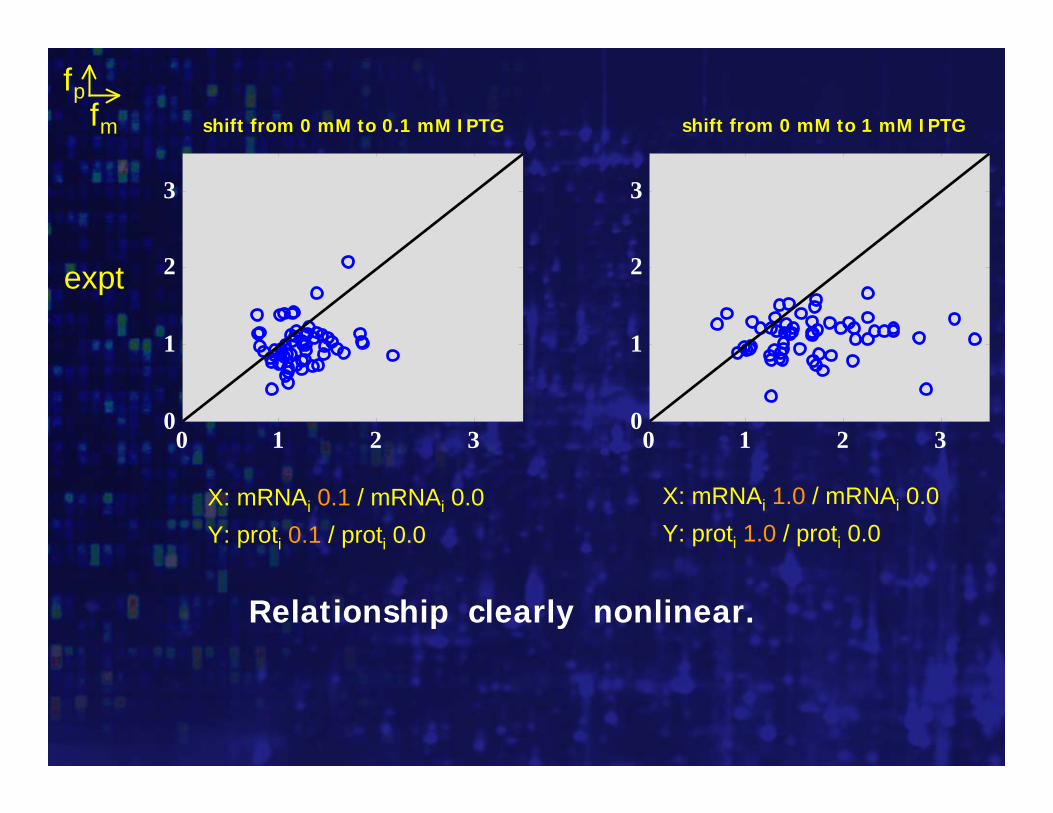
fpfm
expt
0 1 2 30
1
2
3
0 1 2 30
1
2
3
shift from 0 mM to 0.1 mM IPTG shift from 0 mM to 1 mM IPTG
X: mRNAi 0.1 / mRNAi 0.0Y: proti 0.1 / proti 0.0
Relationship clearly nonlinear.
X: mRNAi 1.0 / mRNAi 0.0Y: proti 1.0 / proti 0.0

fpfm
expt
model
0 1 2 30
1
2
3
0 1 2 30
1
2
3
0 1 2 30
1
2
3
0 1 2 30
1
2
3
shift from 0 mM to 0.1 mM IPTG shift from 0 mM to 1 mM IPTG
Model captures nonlinearityModel predicts only half the story
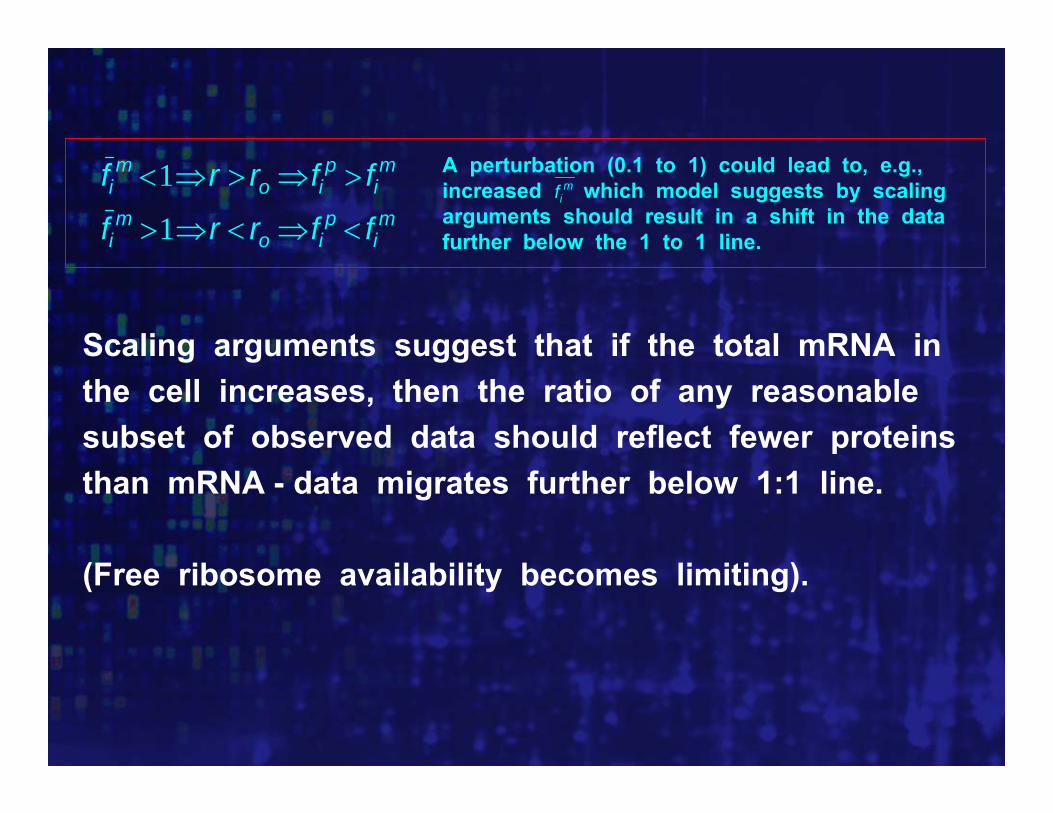
A perturbation (0.1 to 1) could lead to, e.g., increased which model suggests by scaling arguments should result in a shift in the data further below the 1 to 1 line.
mi
pio
mi
mi
pio
mi
ffrrf
ffrrf
<⇒<⇒>
>⇒>⇒<
1
1 mif
Scaling arguments suggest that if the total mRNA in the cell increases, then the ratio of any reasonable subset of observed data should reflect fewer proteins than mRNA - data migrates further below 1:1 line.
(Free ribosome availability becomes limiting).

fpfm
expt
model
0 1 2 30
1
2
3
0 1 2 30
1
2
3
0 1 2 30
1
2
3
0 1 2 30
1
2
3
shift from 0 mM to 0.1 mM IPTG shift from 0 mM to 1 mM IPTG
1.15=mif 1.29=m
if
Model captures nonlinearityModel predicts only half the story
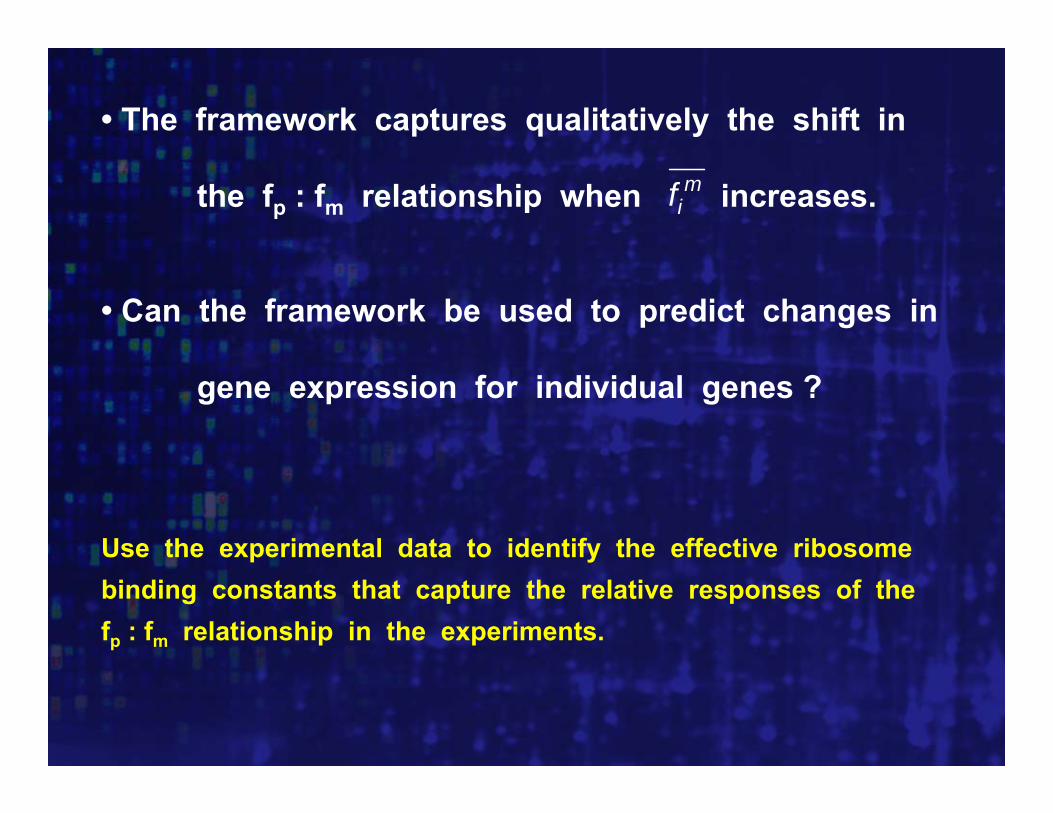
Use the experimental data to identify the effective ribosome binding constants that capture the relative responses of the fp : fm relationship in the experiments.
• The framework captures qualitatively the shift in
the fp : fm relationship when increases.
• Can the framework be used to predict changes in
gene expression for individual genes ?
mif

0.75
1
1.25
0.75 1 1.25
trpAfusA
enotufAppiB
fliY
rpoA
talB
envY
ppa
lpdA
As culture conditions change (0.1mM/0mM to 1mM/0mM),the relative fp:fm ratio will shift.Can the framework predict this shift for individual genes?

fpfm
expt
model
0 1 2 30
1
2
3
0 1 2 30
1
2
3
0 1 2 30
1
2
3
0 1 2 30
1
2
3
52 of 60 (87%) observed genes agreeshift from 0 mM to 0.1 mM IPTG shift from 0 mM to 1 mM IPTG

LA,i
LT,i
2,ik
3,ik
kkinitkkterm
Translation Depends on the Codon Usage
We know sequence / codon usage, [aa-tRNA].Assume 100 copies compete for 4500 ribosomes.Continuous time Monte Carlo simulations ...
We just saw impact of ribosome competition and binding constants.

kterm
L
kelongkinit
Single lattice model
• mRNA modeled as a lattice• ribosomes have steric hindrance• parameters
– ribosome length L (=12)– Initiation rate kinit=k×[free ribosomes]– Elongation rates kelong=k×[free aa-tRNA]– termination rate kterm

araC (rare), max current 1.59/min
0
0.1
0.2
0.3
0.4
0.5
0.6
0.7
0.8
0.9
1
1 19 37 55 73 91 109
127
145
163
181
199
217
235
253
271
codon
ribos
ome
dens
ity
0
5
10
15
20
25
30
rate
(12
aa's
/min
) (m
in 2
.12)
ompA (abundant), max current 3.52/min
0
0.1
0.2
0.3
0.4
0.5
0.6
0.7
0.8
0.9
11 22 43 64 85 106
127
148
169
190
211
232
253
274
295
316
codon
ribo
som
e de
nsity
0
5
10
15
20
25
30
rate
(12
aa's
/min
) (m
in 4
.51)
term liminit limelong limrate for 12 codons
Higher density of ribosomes
Fewer ribosomes
A slow site
Higher density
Lower densityA slow site

The mRNA - Protein Relationship Depends on the DNA sequence.
Ribosome binding affinity
Length of message
Ribosome velocityCodon usage and frequencymRNA secondary structure