Keeping Seniors Connected to the Labor Market Benefits to working longer Work patterns and trends at...
23
Keeping Seniors Connected to the Labor Market • Benefits to working longer • Work patterns and trends at older ages • Work impediments at older ages
-
Upload
julius-coomber -
Category
Documents
-
view
216 -
download
0
Transcript of Keeping Seniors Connected to the Labor Market Benefits to working longer Work patterns and trends at...

Keeping Seniors Connected to the Labor Market
• Benefits to working longer
• Work patterns and trends at older ages
• Work impediments at older ages

The U.S. Population is Aging Rapidly
Age Distribution of the Adult U.S. Population, 1950-2050
0%
10%
20%
30%
40%
50%
60%
70%
80%
90%
100%
1950 1980 2000 2020 2050
Sh
are
of
Po
pu
lati
on
85+
65-84
55-64
25-54
18-24
Source: U.S. Census Bureau.

Population Aging Could Pose Problems for Economy and Government Finances
• If current employment patterns persist, the share of adults that is employed will fall over time
• Would slow growth in national output, government revenues
• Strain government’s ability to cover rising cost of retirement programs, other public services
• Could result in worker shortages or skill gaps

Working Longer Would Address These Economy Wide Concerns as Well as
Increase Individuals’ Retirement Income Security

Increased Employment at Older Ages Would Increase the Number of Workers
per RetireeNo. of Workers Age 18+ Per Nonworking Adult Age 65+ in 2000 & 2020, by Assumed Participation Rates for Men 55+
4.51
3.253.55
4.08
2000 rates formen 55+
1970 rates formen 55+
1950 rates formen 55+
2000 2020
Source: Johnson and Steuerle (2004)

People Can Raise Retirement Incomes by Working Longer
• Accumulate more Savings
• Accumulate more Social Security
• Build more wealth in employer pensions
• Extend retirement savings– reduce years over which Social Security,
pensions, other wealth are spread

Annual Income at Age 75, Net of Federal Income Taxes and Health Insurance
Premiums, by Retirement Age
$17,338
$22,920
$27,256
$34,790
62 65 67 70
Source: Butrica, Johnson, Smith, and Steuerle (2004).
Notes: Amounts are in constant 2004 dollars. Estimates refer to an unmarried man who turned 55 in 2005, spent some time in college, worked continuously after age 22 earning average wages, participated in a DC plan since age 35, and does not otherwise save. He purchases a single-life annuity at retirement and a Medigap policy. Tax estimates assume the federal tax cuts enacted in 2001 and 2003 expire in 2010.

Keeping Seniors Connected to the Labor Market
• Benefits to working longer
• Work patterns and trends at older ages
• Work impediments at older ages
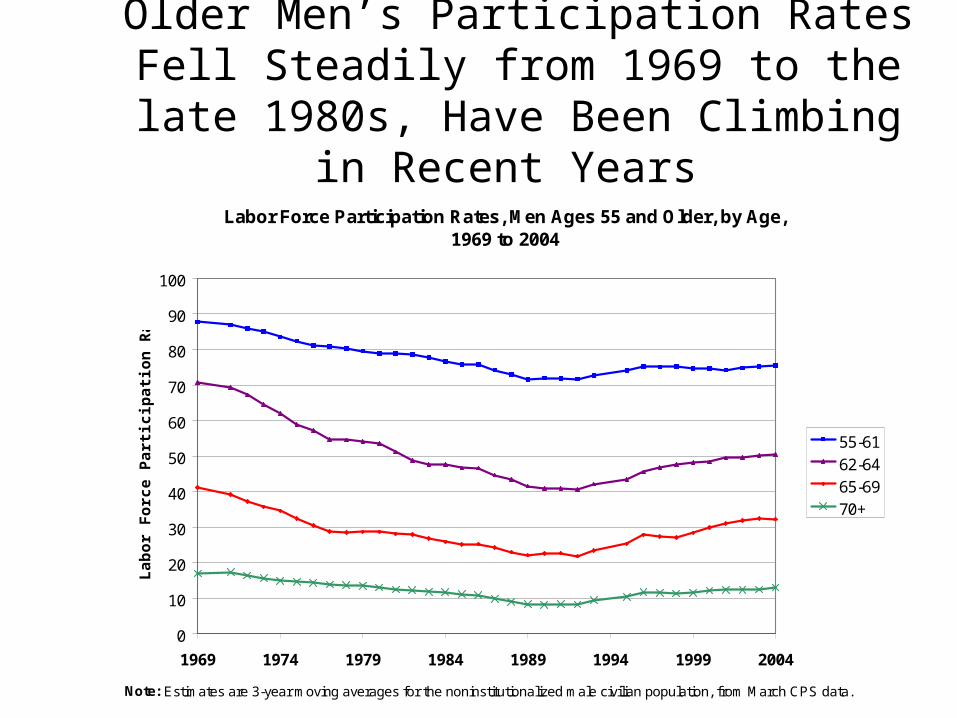
Older Men’s Participation Rates Fell Steadily from 1969 to the late 1980s, Have Been
Climbing in Recent Years
Labor Force Participation Rates, Men Ages 55 and Older, by Age, 1969 to 2004
0
10
20
30
40
50
60
70
80
90
100
1969 1974 1979 1984 1989 1994 1999 2004
Lab
or
Fo
rce
Par
tici
pat
ion
Rat
e (%
)
55-6162-6465-6970+
Note: Estimates are 3-year moving averages for the noninstitutionalized male civilian population, from March CPS data.

Older Women’s Participation Rates Have Increased Sharply Since the Late 1980s
Labor Force Participation Rates, Women Ages 55 and Older, by Age, 1969 to 2004
0
10
20
30
40
50
60
70
1969 1974 1979 1984 1989 1994 1999 2004
La
bo
r F
orc
e P
art
icip
ati
on
Ra
te (
%)
55-6162-6465-6970+
Note: Estimates are 3-year moving averages for the noninstitutionalized female civilian population, from March CPS data.

Labor Force Participation Rates for Older Men Increase With Education
Labor Force Participation Rates, Men Age 55 and Older, by Age and Education, 2003-2005
58.7
37.4
23.3
8.1
71.6
44.5
28.0
11.5
76.1
53.1
31.8
16.1
83.3
61.4
43.2
18.4
0
10
20
30
40
50
60
70
80
90
55-61 62-64 65-69 70+Age
LF
PR
(%
)
Not HS Grad
HS Grad
Some College
College Grad
Note: Estimates are averages for 2003, 2004, and 2005 for the noninstitutionalized male civilian population, from March CPS data.

Female Participation Rates Also Increased with Education, Especially At Ages 55-64
Labor Force Participation Rates, Women Age 55 and Older, by Age and Education, 2003-2005
39.1
23.2
13.3
3.5
59.2
35.7
23.5
6.9
65.6
43.7
30.8
9.4
73.0
49.1
31.3
9.9
0
10
20
30
40
50
60
70
80
55-61 62-64 65-69 70+Age
La
bo
r F
orc
e P
art
icip
ati
on
Ra
tes
(%
)
Not HS Grad
HS Grad
Some College
College Grad
Note: Estimates are averages for 2003, 2004, and 2005 for the noninstitutionalized female civilian population, from March CPS data.

Employment Rates for Older Men Decline Sharply With Health Problems
Employment Rates by Age and Health Status, Men, 2002
0
10
20
30
40
50
60
70
80
90
55-61 62-64 65-69 70+Age
Em
plo
ym
en
t R
ate
s (
%)
Excellent
Very Good
Good
Fair
Poor
Note: Estimates from the 2002 Health and Retirement Study.

The Relationship Between Health Status and Employment Is Even Stronger among Women
than Men
Employment Rates by Age and Health Status, Women, 2002
0
10
20
30
40
50
60
70
55-61 62-64 65-69 70+Age
Em
plo
ym
en
t R
ate
s (
%)
Excellent
Very Good
Good
Fair
Poor
Note: Estimates from the 2002 Health and Retirement Study.

Part-Time Employment Increases Rapidly with Age among Older Workers
Share of Working Men and Women Who Are Employed Part-Time,by Age, 2003-2005
11.2
27.7
21.9
39.840.0
56.255.9
66.4
0
10
20
30
40
50
60
70
Men Women
Sh
are
Pa
rt-T
ime
(%
)
55-61
62-64
65-69
70+
Note: Estimates are averages for 2003, 2004, and 2005 for the noninstitutionalized civilian population, from March CPS data.

Part-Year Employment Rises With Age After Age 61
Share of Working Men and Women Who Are Employed Part-Year, by Age, 2003-2005
14.3
22.5
16.6
20.7
23.6
29.130.0
34.434.936.2
0
5
10
15
20
25
30
35
40
Men Women
Sh
are
Pa
rt-Y
ea
r (%
)
25-54
55-61
62-64
65-69
70+
Note: Estimates are averages for 2003, 2004, and 2005 for the noninstitutionalized civilian population, from March CPS data.
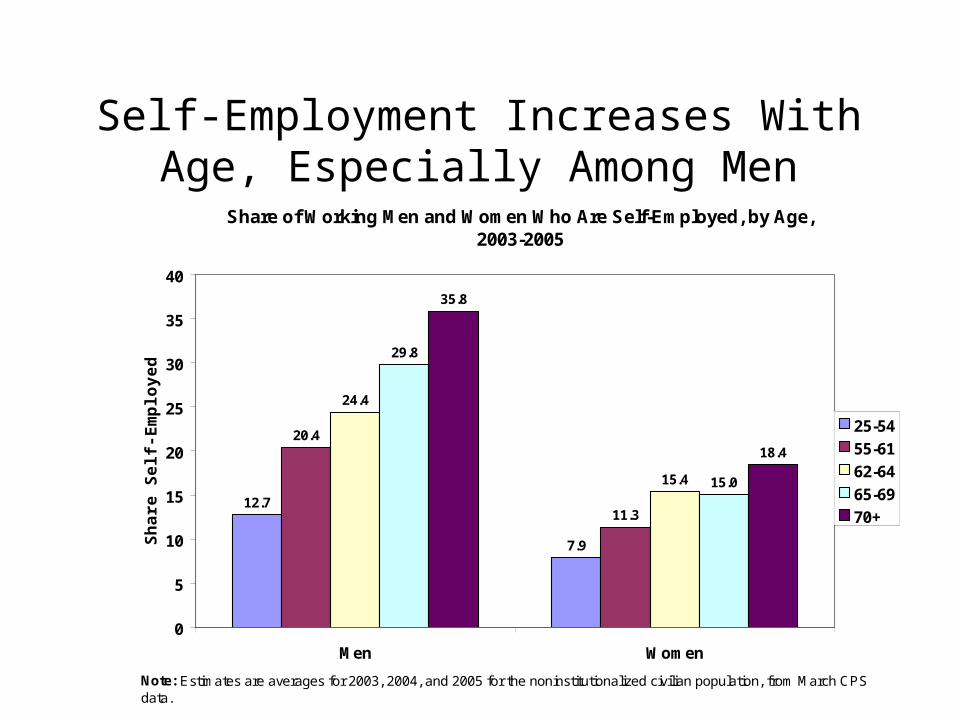
Self-Employment Increases With Age, Especially Among Men
Share of Working Men and Women Who Are Self-Employed, by Age, 2003-2005
12.7
7.9
20.4
11.3
24.4
15.4
29.8
15.0
35.8
18.4
0
5
10
15
20
25
30
35
40
Men Women
Sh
are
Se
lf-E
mp
loy
ed
(%
)
25-54
55-61
62-64
65-69
70+
Note: Estimates are averages for 2003, 2004, and 2005 for the noninstitutionalized civilian population, from March CPS data.

“Traditional” Retirements Are Now Quite Rare
• Retirement is increasingly a gradual process– not an abrupt transition
• About two-thirds of older people work after retiring from career jobs
• About one-third of older adults “unretire”– return to work after leaving the labor force
What Do Older Americans Want From Work in Retirement?
According to an AARP Survey they want:
• Flexible schedules and/or reduced hours
• Less stress
• Mental engagement
• Social engagement
• Pension and health benefits

Reasons to Think Trend Towards Increased Work at Older Ages Will Continue
• Baby Boomers report they are more likely to work at older ages than earlier generations
• Health is improving and educational attainment is likely to increase at older ages
• Trend away from traditional defined benefit pensions to defined contribution pensions is likely to continue
• Trend away from employer provided retiree health insurance is likely to continue
• Social Security retirement age is scheduled to increase from 66 to 67.

Keeping Seniors Connected to the Labor Market
• Benefits to working longer
• Work patterns and trends at older ages
• Work impediments at older ages

Important to Consider Work Impediments at Older Ages
• Some workers can’t work longer for health reasons
• Evidence suggests older workers have more difficulty getting re-employed
• Traditional pensions often penalize workers who remain on the job after they can receive benefits
• Social Security discourages work at older ages by providing few rewards for workers who have spent 35+ yrs at work
• Higher health costs make older workers more expensive

Conclusion
• Working longer would benefit the economy and individuals’ retirement security
• Labor Force Participation has recently been increasing at older ages
• Still there are some impediments to working longer