Keeping Our Edge:
41
Copyright © 2006 Educational Testing Service Keeping Our Edge: HART HART RESEARCH RESEARCH P e t e r D P e t e r D ASSO TES C IA & & THE WINSTON GROUP THE WINSTON GROUP Listening. Learning. Leading. Americans Speak On Education & Competitiveness
-
Upload
emery-faulkner -
Category
Documents
-
view
23 -
download
0
description
THE WINSTON GROUP. P e t e r D. &. HART. RESEARCH. A. S. S. O. C. I. A. T. E. S. Keeping Our Edge:. Americans Speak On Education & Competitiveness. Listening. Learning. Leading. Research Methods. - PowerPoint PPT Presentation
Transcript of Keeping Our Edge:

Copyright © 2006 Educational Testing Service
Keeping Our Edge:
HARTHARTRESEARCHRESEARCH
P e t e r DP e t e r D
AA SS SS OO TT EE SSCC II AA
&&THE WINSTON GROUPTHE WINSTON GROUP
Listening. Learning. Leading.
Americans Speak On Education & Competitiveness

Copyright © 2006 Educational Testing Service2
Research MethodsResearch Methods
Surveys were conducted May 22 – June 8, 2006, among 1,215 adults nationwide, including 703 members of the general public and 512 parents of K-12 students (301 parents of public high school students), and among 150 high school administrators, 150 high school teachers, 231 public high school students, 151 college faculty, and 151 business and opinion leaders. At the 95% confidence level, the data’s margin of error is ±3.1 percentage points among all adults, and higher among smaller populations and subgroups.
Seven focus groups were conducted from late April through early May 2006: two groups in Richmond, VA; two in Encino, CA; one in Rosemont, IL; and two in Atlanta, GA. One group each was conducted among male high school students, female high school students, parents of middle and high school students, high school teachers, high school administrators, college professors, and business leaders and HR professionals. In addition, seven in-depth-interviews were conducted among leading competitiveness experts.

Copyright © 2006 Educational Testing Service3
Grading School QualityGrading School Quality
Listening. Learning. Leading.

Copyright © 2006 Educational Testing Service4
Assessing The Nation’s SchoolsAssessing The Nation’s Schools
58%
41%
51%53%56%
58%
45%
50%52%
50%
45%48%
53%
45%
52%
45% 45%48%
42% 41%
2001 2002 2003 2004 2005 2006 2001 2004 2005 2006
Working well/need some changes but basically keep as isNeed major changes/complete overhaul
All adults Parents
How well do you think our K-12 schools are working?
67% teachers 71% administrators
Working well/some changes
Q.6a

Copyright © 2006 Educational Testing Service5
Grades For Nation’s Schools Grades For Nation’s Schools Remain At “C”Remain At “C”
A
B
C
D
F
GPA
2001
2%
18%
51%
16%
3%
2.0
2003
2%
29%
47%
13%
2%
2.2
2004
2%
20%
48%
14%
3%
2.0
2001
8%
35%
33%
13%
4%
2.3
- - - - - - All adults - - - - - - Parents
The Public’s Report CardThe Nation’s Schools
Spring 2006
2006
5%
26%
45%
14%
4%
2.1
2005
4%
27%
46%
12%
2%
2.2
2005
3%
23%
46%
15%
4%
2.1
2006
5%
26%
44%
15%
5%
2.1
Q.10a

Copyright © 2006 Educational Testing Service6
Grades For Nation’s Schools Grades For Nation’s Schools Remain At “C”Remain At “C”
A
B
C
D
F
GPA
High schoolteachers
3%
34%
47%
9%
0%
2.3
Education Professionals’/Leaders’ Report CardThe Nation’s Schools
Spring 2006
Q.10a
High schooladministrators
3%
31%
53%
10%
0%
2.3
Collegefaculty
2%
18%
49%
23%
1%
1.9
Business/opinionleaders
1%
16%
56%
18%
1%
2.0

Copyright © 2006 Educational Testing Service7
Grades For One’s Own Schools Grades For One’s Own Schools Better – Still Not GreatBetter – Still Not Great
Parents’/Students’ Report CardMy Children’s School/My High School
Spring 2006
A
B
C
D
F
GPA
2001
27%
38%
25%
6%
3%
2.8
2004
24%
43%
21%
7%
3%
2.8
2005
30%
42%
20%
5%
2%
2.9
2006
23%
43%
24%
5%
1%
2.9
- - - - - - - All K-12 parents - - - - - - - Public high schoolparents
18%
49%
23%
5%
3%
2.8
High school
students
19%
52%
20%
7%
2%
2.8
Q.7a,b/Q.9

Copyright © 2006 Educational Testing Service8
Many Parents Believe They Have Many Parents Believe They Have Exercised Choice In SchoolsExercised Choice In Schools
33%
46%
21%
Public school parents
We moved to a different residence to
be in a different school district
We chose a residence based on the school
district it is in
We have not moved/ chosen residence
based on school district
62% have transferred a child out of one school into a better school, or have moved/chosen a residence based on school district.
54%
Q.5

Copyright © 2006 Educational Testing Service9
16%23%
16%
16% 20%
17%
22%
9%
21%
10%20%
28%
Divided Views Of Divided Views Of No Child Left BehindNo Child Left Behind
All adults K-12 parents High schoolstudents
Business/opinion leaders
Don’t know enough to form an opinion/neutral/not sure
Very favorable Somewhat favorableVery unfavorable Somewhat unfavorable
Q.13
43% 41%44%
39%34%
38%
All adults 2005
45% favorable38% unfavorable
Parents 2005
46% favorable39% unfavorable
58%
21%

Copyright © 2006 Educational Testing Service10
7%
43%
5%4%
38%
5%3%
40%
9%
Views Of No Child Left BehindViews Of No Child Left BehindAmong Education ProfessionalsAmong Education Professionals
High school teachers
Collegefaculty
Q.13
23%
72%
17%
74%
HS teachers 2005
19% favorable75% unfavorable
HS admin 2005
48% favorable43% unfavorable
High school administrators
29%
66%
Don’t know enough to form an opinion/neutral/not sure
Very favorable Somewhat favorableVery unfavorable Somewhat unfavorable

Copyright © 2006 Educational Testing Service11
11%
48%
37%
Few Believe High School Few Believe High School Students Are ChallengedStudents Are Challenged
Perceptions of academic expectations for students in public high schools in the nation as a whole
High expectations/students significantly
challenged
Moderate expectations/
students somewhat challenged
Low expectations/students not challenged
High expectations/students challenged
12% high school teachers
17% high school administrators
2% college faculty
8% business/opinion leaders
All adultsQ.12a
Copyright © 2006 Educational Testing Service12
5%
7%
5%
7%
14%
Doing as much as possible (9-10 ratings) Doing quite a bit (7-8)
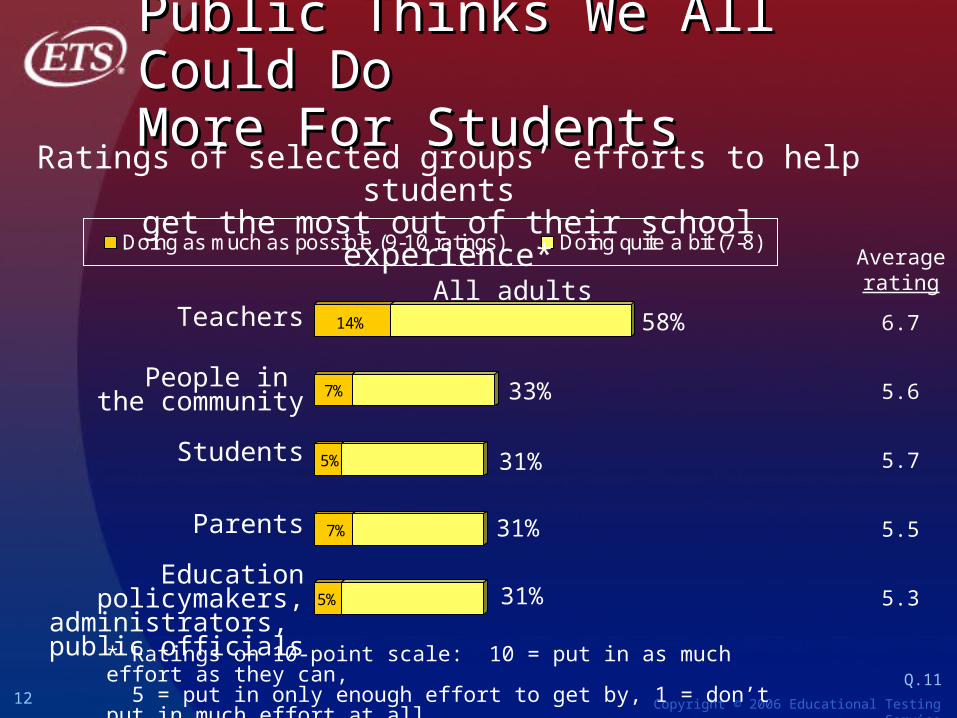
Public Thinks We All Could Do Public Thinks We All Could Do More For StudentsMore For Students
Teachers
People in the community
Students
Parents
Education policymakers,administrators,
public officials
All adults58% 6.7
33% 5.6
Ratings of selected groups’ efforts to help students get the most out of their school experience*
* Ratings on 10-point scale: 10 = put in as much effort as they can, 5 = put in only enough effort to get by, 1 = don’t put in much effort at all Q.11
31% 5.7
31% 5.5
31% 5.3
Averagerating

Copyright © 2006 Educational Testing Service13
27%
5%
45%
9%
7%
Doing as much as possible (9-10 ratings) Doing quite a bit (7-8)
Each Group Rates Its Own EffortsEach Group Rates Its Own Efforts
Adults’ ratings of their community
K-12 parents’ ratingsof parents
HS teachers’ ratings of teachers
HS students’ ratings of students
HS administrators’ ratings of education
policymakers, adminis-trators, public officials
90%
Ratings of selected groups’ efforts to help students get the most out of their school experience*
* Ratings on 10-point scale: 10 = put in as much effort as they can, 5 = put in only enough effort to get by, 1 = don’t put in much effort at all Q.11
43%
75%
34%
33% 5.6
5.6
8.3
6.1
7.4
Averagerating

Copyright © 2006 Educational Testing Service14
81%
13%
22%
However, Most Students Describe However, Most Students Describe Selves As Motivated/Hard-WorkingSelves As Motivated/Hard-Working
Feel motivated
and inspired to work hard in school
High school studentsQ.10b,c
Don’t feel motivated
Do you feel motivated/inspiredto work hard in school?
How much effort do you put into school work?
High school students
Great deal of effort(9-10)
Quite a bit of effort
(7-8)
(Ratings on 10-point scale)
Less effort(1-6)
78%

Copyright © 2006 Educational Testing Service15
Raising StandardsRaising Standards
Listening. Learning. Leading.

Copyright © 2006 Educational Testing Service16
13%
15%
16%
21%
19%
21%
22%
31%
34%
35%
U.S. public high schools falling behind U.S. public high schools coming up short
Public Sees Room Public Sees Room For ImprovementFor Improvement
All adults
73%
71%
70%
63%
58%
57%
55%
49%
46%
44%
Support struggling students/ prevent dropouts
Enable students to compete globally for tech jobs
Engage bored students/prevent dropouts
Maintain high standards/challenge all students
Training/skills to enter workforce
Measure schools to ensure students learning
Teach basics: math, science, writing
Prepare students for college
Challenge/push best students
Choice of classes to meet individual needs Q.15

Copyright © 2006 Educational Testing Service17
8%
6%
4%
6%
6%
9%
8%
16%
14%
21%
U.S. public high schools falling behind U.S. public high schools coming up short
Students See High SchoolsStudents See High SchoolsIn More Positive LightIn More Positive Light
High school students
53%
39%
38%
36%
25%
31%
17%
16%
19%
21%
Q.15
Support struggling students/ prevent dropouts
Enable students to compete globally for tech jobs
Engage bored students/prevent dropouts
Maintain high standards/challenge all students
Training/skills to enter workforce
Measure schools to ensure students learning
Teach basics: math, science, writing
Prepare students for college
Challenge/push best students
Choice of classes to meet individual needs

Copyright © 2006 Educational Testing Service18
29%
20% 20%
32%
22%
16%
34%
26%
13%10%
22%
42%
Elementary schools Middle schools High schools
Reforming Elementary Schools Reforming Elementary Schools Is Highest Priority For MostIs Highest Priority For Most
When it comes to training our best students to complete globally, at which level would changes make the biggest difference?
All adults K-12 parents
High school students
Q.16a
High school parents

Copyright © 2006 Educational Testing Service19
36%
20%18%
38%
26%
9%
35%
22%
12%
43%
24%
13%
Elementary schools Middle schools High schools
Reforming Elementary Schools Reforming Elementary Schools Is Highest Priority For MostIs Highest Priority For Most
When it comes to training our best students to complete globally, at which level would changes make the biggest difference ?
High schooladministrators
High schoolteachers
Collegefaculty
Business/opinionleaders
Q.16a

Copyright © 2006 Educational Testing Service20
21%
53%
11%
All adults
2005: Focus On The Middle2005: Focus On The Middle
Most important and productive focus for improving high school education
The top: Challenge top students so those going on to college or high-skilled jobs are ready to compete in the global economy
The middle: Raise standards in high schools so a diploma means more and students are not getting passed through the system without the skills they need for college and work
The bottom: Support students who are struggling; make high schools relevant to all in order to reduce the number of students who drop out

Copyright © 2006 Educational Testing Service21
2006: Students In The Middle 2006: Students In The Middle Should Be The Highest PriorityShould Be The Highest Priority
Gifted students who aren’t being challenged/
are not ready to compete globally
Students getting passed through the system
without the skills they need for college/work
Struggling students who drop out of high school
All adults
66%
Q.18
47%
63%
Proportions who regard selected problems with America’s high schools as the highest priority or a very big problem
14% highest priority
24% highest priority
21% highest priority

Copyright © 2006 Educational Testing Service22
The Importance of The Importance of
Math and ScienceMath and Science
Listening. Learning. Leading.

Copyright © 2006 Educational Testing Service23
9%
13%
17%
17%
20%
40%
Math And Science Are Key To Math And Science Are Key To Continuing America’s SuccessContinuing America’s Success
Math, science, and technology skills
Reasoning and problem-solving
Writing and communicating effectively
Understanding other people’s history and culture
Creative thinking
Speaking and understanding foreign languages
Which one or two skills taught in high school will be most important to America’s ability to compete in the global economy?
All adults
Q.1c

Copyright © 2006 Educational Testing Service24
55%
9%
53%
6%
Very important Fairly importantNot that important Just somewhat important
People Understand Importance People Understand Importance Of High School Math/ScienceOf High School Math/Science
All adults High schoolstudents Q.17a,b
71%
28%
How important is what you learned/are learning in high school math and science classes to your life after high school?
76%
24%

Copyright © 2006 Educational Testing Service25
72%
3%
63%
4%
Very important Fairly importantNot that important Just somewhat important
Students Should Take Most Students Should Take Most Advanced Math/Science AvailableAdvanced Math/Science Available
All adults High schoolstudents Q.16c,d
84%
14%
How important is it for students to take the most advanced math and science classes they can each and every year of high school?
83%
15%

Copyright © 2006 Educational Testing Service26
59%
54%
55%
53%
61%
62%
60%
I wish I had taken more challenging math andscience classes in high school
All Groups Wish They Had Taken All Groups Wish They Had Taken Tougher Math/ScienceTougher Math/Science
All adults
K-12 parents
High school parents
High school teachers
High school administrators
College faculty
Business/opinion leaders
Q.17c

Copyright © 2006 Educational Testing Service27
7%
12%
13%
13%
15%
19%
25%
What Would Encourage You To What Would Encourage You To Take Harder Math/Science?Take Harder Math/Science?
More qualified/engaging HS math/science teachers
More qualified/engaging math/science teachers in
elementary/middle schoolBest jobs today require/
reward math/science skills
Requiring more high level math/science to graduate
Allowing advanced students to take college classes
Need these skills to be successful in career
Most recent grads wish they had taken more
math/science in high schoolQ.19a,b
One/two factors that would have persuaded me to take more challenging math/science classes in high school
All adultsHigh school
students
22%
12%
17%
12%
11%
24%
12%

Copyright © 2006 Educational Testing Service28
Best Reasons: To Get Good Jobs Best Reasons: To Get Good Jobs In The Modern EconomyIn The Modern Economy
In today’s economy, jobs in technical fields are growing five times faster than others: if students don’t improve their skills in math and science, they may be first U.S. generation worse off than their parents
While U.S. students are learning how to use computers, their competition in China, Japan, and India are learning how to design computers: if U.S. students continue to fall behind, they will end up working for foreign companies instead of creating their own companies
American students are falling behind in critical fields such as math, science, and engineering: if this continues, we will lose out on high-skill jobs, will become dependent on innovation/workers in other countries, over time our economy will weaken
Taking advanced math and science helps students learn analytical thinking they will need to succeed in any career
Adults rating each as a very/fairly convincing reason to take most advanced math and science classes possible in high school*
* Ratings of 7 to 10 on 10-point scale: 10 = very convincing reason,
1 = not at all convincing reasonQ.21
76%
70%
68%
65%

Copyright © 2006 Educational Testing Service29
52%
59%
62%
47%
30%
40%
45%
44%
Very convincing reason (9-10) Convincing reason (7-8)
Modern Jobs Strong Reason Modern Jobs Strong Reason For All GroupsFor All Groups
* Ratings on 10-point scale: 10 = very convincing reason, 1 = not at all convincing reasonQ.21
76%
74%
In today’s economy, jobs in technical fields are growing five times faster than others: if students don’t improve their skills in math and science, they may be first U.S. generation worse off than their parents
79%
81%
92%
92%
88%
All adults
K-12 parents
HS parents
HS students
HS teachers
HS administrators
College faculty
Business/opinionleaders
64%

Copyright © 2006 Educational Testing Service30
Proposals for Proposals for
Reforming High SchoolsReforming High Schools
Listening. Learning. Leading.

Copyright © 2006 Educational Testing Service31
49%
50%
58%
66%
61%
69%
74%
All Proposals Receive SupportAll Proposals Receive Support
Increase parent involvement: appeals to limit TV/videos,
more discipline/love of learningEnsure teachers expert in
subject: more training/ certification test
Emphasize real-world learning: work study, community service,
vocational coursesOverhaul hiring: more teachers
with passion/talent; master teachers, mentors, rewards
More resources, smaller classes, raise expectations for students at risk of dropping out
More academically rigorous standards: focus on college prep, honors, AP/IB classes
Attract math/science teachers to most challenging school through financial incentives
93%
92%
92%
91%
88%
87%
All adults
Strongly favor Somewhat favor
Q.23
85%

Copyright © 2006 Educational Testing Service32
42%
39%
43%
45%
46%
52%
All Proposals Receive SupportAll Proposals Receive Support
Statewide test on mastery of core subjects to graduate
Smaller class size especiallyK-6, expand after-school, even
if cost is thousands per pupilIncrease per-pupil spending in
low-income schools, even if takes $$ from richer schools
Federal funding for computers/ computer training, even if taxes
significantly raisedMore college courses/work
apprenticeships available in HS, even if fewer core classesDramatically increase teacher salaries to hire/retain qualified
teachers, even if taxes increase
81%
81%
77%
All adults
Strongly favor Somewhat favor
Q.23
77%
75%
73%

Copyright © 2006 Educational Testing Service33
74%
Parental InvolvementParental Involvement
More parent involvement with children’s education:
appeal to them to limit TV/ video game time, instill
discipline and love of reading and learning
93%
All adults
Strongly favor Somewhat favor
Q.23
97% of high school teachers and 95% of high school administrators favor increased parental involvement. 93% of K-12 parents favor parents’ being more involved. Only 65% of high school students favor this.

Copyright © 2006 Educational Testing Service34
42%
49%
66%
69%
Teacher QualityTeacher Quality
Ensure teachers expert in subject: more subject matter training, subject
certification test
Hire teachers of passion, talent, curiosity, who will
instill love of learning; master teacher ladder to
reward teaching as career
More students pursuing math/science by attracting
math and science teachers through financial incentives esp. to challenging schools
Dramatically increase salaries to hire/retain
qualified teachers, even if education costs/taxes substantially increase
92%
73%
All adults
Strongly favor Somewhat favor
85%
91%
77% of people who think schools need a complete overhaul strongly favor this proposal.
Q.23
90% of high school administrators and 85% of high school teachers favor this proposal.

Copyright © 2006 Educational Testing Service35
39%
61%
Real-World LearningReal-World Learning
Greater emphasis on real-world learning by
allowing students to participate in work study, community service, and
vocational courses
92%
75%
All adults
Strongly favor Somewhat favor
More college courses/work apprenticeships available to high school students, even if it means students spend
less time learning core curriculum
Q.23
82% of high school students favor this approach.
64% of high school teachers favor this approach.

Copyright © 2006 Educational Testing Service36
52%
50%
58%
Higher StandardsHigher Standards
88%
All adults
Strongly favor Somewhat favor
More resources, lower class size, raise expecta-
tions for students at risk of dropping out, to challenge
and inspire them
More academically rigorous standards for
high school, more emphasis on college prep,
honors, AP/IB courses
Ensure students master core subjects by requiring
them to pass statewide test before they can receive HS diploma
87%
81%
Q.23
93% of college faculty and 92% of business/opinion leaders favor this approach.
79% of students favor this approach.

Copyright © 2006 Educational Testing Service37
43%
45%
46%
Improve/Modernize InfrastructureImprove/Modernize Infrastructure
81%
All adults
Strongly favor Somewhat favor
Lower number of students per teacher (especially in
elem. school), expand after-school programs,
even if this adds several thousand to per-pupil cost
Higher per-pupil spending in low-income areas for books, facilities, better
teachers, even if takes tax money from richer areas
Federal funds to modern-ize buildings, computers,
technical learning aids, train teachers/students, even if upgrades mean significant tax increase
77%
77%
Q.23
59% of Americans who want a complete overhaul of schools strongly favor this, while just 41% of those who think the schools are fine or need only some changes strongly favor it.
53% of Americans living in cities say they strongly favor this proposal, compared with 35% of suburbanites who say the same.

Copyright © 2006 Educational Testing Service38
17%
6%
Status Quo Would Have Status Quo Would Have Negative Impact On AmericaNegative Impact On America
If 25 years from now high schools haven’t changed, what effect will this have on America’s ability to compete?
Won’t makea difference
Very negativeimpact48%
Somewhatnegativeimpact25%
73%
Positiveimpact
All adultsQ.25
85% of college faculty, 82% of business/opinion leaders believe status quo will have negative impact.

Copyright © 2006 Educational Testing Service39
13%17%
Most Believe Negative Impact Most Believe Negative Impact Will Be Felt SoonWill Be Felt Soon
If changes are not made to our education system, will it have a negative impact on America’s global competitiveness
and strength of our economy: if so, how soon?
Negative impact, but more than
10 years from now
Within a year16%
64%
Won’t havenegative
impact
All adults
Q.24
Negative impact, within 10 years
3 to 5 years20%
5 to 10 years28%

Copyright © 2006 Educational Testing Service40
ConclusionsConclusions Math and science are crucial
Americans view math and science as vital to our ability to maintain an edge in the global economy.
“Good Enough” is not good enough We view our public schools as somewhat better than average but do
not feel they are providing students with the skills necessary to compete for jobs in the expanding global economy.
The need for inspirational leadership The public is eager for someone to assume a leadership position and
ask all Americans – students, parents, teachers, administrators, employers, the entire community – to help transform our public schools.
A call to action Americans are calling for higher academic standards for schools and
teachers and more challenging experiences for students.

Copyright © 2006 Educational Testing Service
Keeping Our Edge:
HARTHARTRESEARCHRESEARCH
P e t e r DP e t e r D
AA SS SS OO TT EE SSCC II AA
&&THE WINSTON GROUPTHE WINSTON GROUP
Listening. Learning. Leading.
Americans Speak On Education & Competitiveness