Keep CALM and Improve Visual Feature Attribution
19
Keep CALM and Improve Visual Feature Attribution Jae Myung Kim 1 * Junsuk Choe 2 * Zeynep Akata 1,3,4 Seong Joon Oh 5† 1 University of T¨ ubingen 2 Department of Computer Science and Engineering, Sogang University 3 Max Planck Institute for Intelligent Systems 4 Max Planck Institute for Informatics 5 NAVER AI Lab Abstract The class activation mapping, or CAM, has been the cor- nerstone of feature attribution methods for multiple vision tasks. Its simplicity and effectiveness have led to wide appli- cations in the explanation of visual predictions and weakly- supervised localization tasks. However, CAM has its own shortcomings. The computation of attribution maps relies on ad-hoc calibration steps that are not part of the train- ing computational graph, making it difficult for us to un- derstand the real meaning of the attribution values. In this paper, we improve CAM by explicitly incorporating a la- tent variable encoding the location of the cue for recogni- tion in the formulation, thereby subsuming the attribution map into the training computational graph. The result- ing model, class activation latent mapping, or CALM, is trained with the expectation-maximization algorithm. Our experiments show that CALM identifies discriminative at- tributes for image classifiers more accurately than CAM and other visual attribution baselines. CALM also shows performance improvements over prior arts on the weakly- supervised object localization benchmarks. Our code is available at https://github.com/naver-ai/calm. 1. Introduction Interpretable AI [25, 40, 24, 52] is becoming an abso- lute necessity in safety-critical and high-stakes applications of machine learning. Along with good recognition and pre- diction accuracies, we require models to be able to trans- parently communicate the inner mechanisms with human users. In visual recognition tasks, researchers have devel- oped various feature attribution methods to inspect contri- butions of individual pixels or visual features towards the fi- nal model prediction. Input gradients [55, 56, 58, 5, 63, 39, 28] and input perturbation methods [59, 70, 20, 43, 23, 47] have been actively researched. In this paper, we focus on the class activation mapping (CAM) [68] method, which has been the cornerstone of * Equal contribution. Majority of work done at NAVER AI Lab. † Corresponding author. CAM for class A CAM for class B Why class A not B? CALM for class A CALM for class B Why class A not B? GT class: A How is A ≠ B ? wing head Figure 1. CAM vs CALM. CALM is better at locating the actual cues used for the recognition than CAM. Two bird classes A and B only differ in their head and wing attributes. Attributions for class A, B, and their difference are shown. While CAM fails to detect the head and wing, CALM captures them accurately. the feature attribution research. CAM starts from the ob- servation that many CNN classifiers make predictions by aggregating location-wise signals. For example, p(y|x)= softmax ( 1 HW ∑ hw f yhw ) where f = f (x) is the extracted feature map in R C×H×W where C, H, W are the number of classes, height, and width of the feature map, respec- tively. CAM considers the pre-GAP feature map f yhw as the attribution, after scaling it to the [0, 1] range by dropping the negative values and dividing through by the maximum value: s := (max hw f hw ) -1 f + ∈ [0, 1] H×W . Thanks to the algorithmic simplicity and reasonable effectiveness, CAM has been a popular choice as an attribution method with many follow-up variants [53, 9, 6, 69, 61, 45, 22]. Despite its popularity and contributions to the inter- pretability community, CAM still has its own limitations. What does the attribution map s really mean? We fail to find a reasonable linguistic description because s hardly encodes anything essential in the recognition process. s also violates key minimal requirements, or “axioms” [40, 59, 22], for an attribution method. For example, its dependence on the pre- softmax values f make it ill-defined: translating f 7→ f + c yields an identical model because of the translation invari- ance of softmax, but it changes the attribution map s. We thus introduce a novel attribution method, class ac- arXiv:2106.07861v3 [cs.CV] 12 Aug 2021
Transcript of Keep CALM and Improve Visual Feature Attribution

Keep CALM and Improve Visual Feature Attribution
Jae Myung Kim1* Junsuk Choe2* Zeynep Akata1,3,4 Seong Joon Oh5†
1University of Tubingen 2Department of Computer Science and Engineering, Sogang University3Max Planck Institute for Intelligent Systems 4Max Planck Institute for Informatics 5NAVER AI Lab
Abstract
The class activation mapping, or CAM, has been the cor-nerstone of feature attribution methods for multiple visiontasks. Its simplicity and effectiveness have led to wide appli-cations in the explanation of visual predictions and weakly-supervised localization tasks. However, CAM has its ownshortcomings. The computation of attribution maps relieson ad-hoc calibration steps that are not part of the train-ing computational graph, making it difficult for us to un-derstand the real meaning of the attribution values. In thispaper, we improve CAM by explicitly incorporating a la-tent variable encoding the location of the cue for recogni-tion in the formulation, thereby subsuming the attributionmap into the training computational graph. The result-ing model, class activation latent mapping, or CALM, istrained with the expectation-maximization algorithm. Ourexperiments show that CALM identifies discriminative at-tributes for image classifiers more accurately than CAMand other visual attribution baselines. CALM also showsperformance improvements over prior arts on the weakly-supervised object localization benchmarks. Our code isavailable at https://github.com/naver-ai/calm.
1. IntroductionInterpretable AI [25, 40, 24, 52] is becoming an abso-
lute necessity in safety-critical and high-stakes applicationsof machine learning. Along with good recognition and pre-diction accuracies, we require models to be able to trans-parently communicate the inner mechanisms with humanusers. In visual recognition tasks, researchers have devel-oped various feature attribution methods to inspect contri-butions of individual pixels or visual features towards the fi-nal model prediction. Input gradients [55, 56, 58, 5, 63, 39,28] and input perturbation methods [59, 70, 20, 43, 23, 47]have been actively researched.
In this paper, we focus on the class activation mapping(CAM) [68] method, which has been the cornerstone of
*Equal contribution. Majority of work done at NAVER AI Lab.†Corresponding author.
CAM for class A CAM for class B Why class A not B?
CALM for class A CALM for class B Why class A not B?
GT class: A
How is A ≠ B ?
winghead
Figure 1. CAM vs CALM. CALM is better at locating the actualcues used for the recognition than CAM. Two bird classes A and Bonly differ in their head and wing attributes. Attributions for classA, B, and their difference are shown. While CAM fails to detectthe head and wing, CALM captures them accurately.
the feature attribution research. CAM starts from the ob-servation that many CNN classifiers make predictions byaggregating location-wise signals. For example, p(y|x) =softmax
(1
HW
∑hw fyhw
)where f = f(x) is the extracted
feature map in RC×H×W where C,H,W are the numberof classes, height, and width of the feature map, respec-tively. CAM considers the pre-GAP feature map fyhw asthe attribution, after scaling it to the [0, 1] range by droppingthe negative values and dividing through by the maximumvalue: s := (maxhw fhw)
−1f+ ∈ [0, 1]H×W . Thanksto the algorithmic simplicity and reasonable effectiveness,CAM has been a popular choice as an attribution methodwith many follow-up variants [53, 9, 6, 69, 61, 45, 22].
Despite its popularity and contributions to the inter-pretability community, CAM still has its own limitations.What does the attribution map s really mean? We fail to finda reasonable linguistic description because s hardly encodesanything essential in the recognition process. s also violateskey minimal requirements, or “axioms” [40, 59, 22], for anattribution method. For example, its dependence on the pre-softmax values f make it ill-defined: translating f 7→ f + cyields an identical model because of the translation invari-ance of softmax, but it changes the attribution map s.
We thus introduce a novel attribution method, class ac-
arX
iv:2
106.
0786
1v3
[cs
.CV
] 1
2 A
ug 2
021

tivation latent mapping (CALM). It builds a probabilisticgraphical model on the last layers of CNNs, involving threevariables: input image X , class label Y ∈ {1, · · · , C}, andthe location of the cue for recognition Z ∈ {1, · · · , HW}.Since there is no observation for Z, we consider latent-variable training algorithms like marginal likelihood (ML)and expectation-maximization (EM). After learning the de-pendencies, we define the attribution map for image x ofclass y as p(y, z|x) ∈ [0, 1]H×W , the joint likelihoodof the recognition cue being at z and the class being y.CALM has many advantages over CAM. (1) It has a human-understandable probabilistic definition; (2) it satisfies theaxiomatic requirements for attribution methods; (3) it is em-pirically more accurate and useful than CAM.
In our experimental analysis, we study how well CALMlocalizes the “correct cues” for recognizing the given classof interest. The “correct cues” for recognition are ill-definedin general, making the evaluation of attribution methods dif-ficult. We build a novel evaluation benchmark on pairs ofbird classes in CUB-200-2011 [62] where the true cue loca-tions are given by the parts where the attributes for the classpair differ (Figure 1). Under this benchmark and a widely-used remove-and-classify type of benchmark, CALM showsbetter attribution performances than CAM and other base-lines. We also show that CALM advances the state of the artin the weakly-supervised object localization (WSOL) task,where CAM has previously been one of the best [13, 12].
In summary, our paper contributes (1) analysis on thelack of interpretability for CAM, (2) a new attributionmethod CALM that is more interpretable and communica-ble than CAM, and (3) experimental results on real-worlddatasets where CALM outperforms CAM in multiple tasks.Our code is available at https://github.com/naver-ai/calm.
2. Related WorkInterpretable AI is a big field. The general aim is to en-
hance the transparency and trustworthiness of AI systems,but different sub-fields are concerned with different partsof the system and application domains. In this paper, wedevelop a visual feature attribution method for image clas-sifiers based on deep neural networks. It is the task of an-swering the question: “how much does each pixel or visualfeature contribute towards the model prediction?”Gradient-based attribution. Feature attribution with gra-dients dates back to the pioneering works by Sung [60] andBaehrend et al. [7]. The first explicit application to CNNs isthe work by Simonyan et al. [55]. Input gradients considerlocal linearization of the model, but it is often not suitablefor CNNs because the local behavior hardly encodes thecomplex mechanisms in CNNs for e.g. more global pertur-bations on the input. Follow-up works have customized thebackpropagation algorithm to improve the attribution per-formances: Guided Backprop [57], LRP [5], Deep Taylor
Decomposition [39], SmoothGrad [56], Full-Gradient [58],and others [65, 30, 54, 63, 3, 28]. We make an empiricalcomparison against key prior methods in this domain.Perturbation-based attribution. Researchers have devel-oped methods for measuring the model response to non-local perturbations. Integrated Gradients [59] measure thepath integral of model responses to global input shifts. An-other set of methods consider model responses to redactedinput parts: sliding windows of an occlusion mask [70]and random-pixel occlusion masks [43]. Since the occlud-ing patterns introduce artefacts that may mislead attribu-tions, different options for redaction have been considered:“meaningful perturbations” like image blurring [20, 19], in-painting [70], and cutting-and-pasting a crop from anotherimage of a different class [23]. Some of the key methodsabove are included as baselines for our experiments.CAM-based attribution. Gradients and perturbations an-alyze the model by establishing the input-output relation-ships. Class activation mapping (CAM) [68] takes a differ-ent approach. Many CNNs have a global average pooling(GAP) layer towards the end. CAM argues that the pre-GAP features represent the discriminativeness in the image.Related works have considered variants of the last-layermodifications like max pooling [41] and various thresh-olding strategies [17, 16, 6]. GradCAM [53] and Grad-CAM++ [9] have later expanded the usability of CAMto networks of any last-layer modules by combining thewidely-applicable gradient method with CAM. In this work,we identify issues with CAM and suggest an improvement.Self-explainable models. Above attribution methods pro-vide interpretations of a complex, black-box model in apost-hoc manner. Another paradigm is to design modelsthat are interpretable by design in the first place [18]. Thereis a trade-off between interpretability and performance [34];researchers have sought ways to push the boundary onboth fronts. One line of work distills the complex, per-formant model into an interpretable surrogate model suchas decision trees [21], sparse linear models [44, 46, 4].Other works pursue a hybrid approach, where a small in-terpretable module of a neural network is exposed to hu-mans, while the complex, less interpretable modelling isperformed in the rest of the network. ProtoPNet [10] trainsan interpretable linear map over prototype neural activa-tions. Concept or semantic bottleneck models [36, 31] en-forces an intermediate layer to explicitly encode seman-tic concepts. Our work is a hybrid self-explainable modelbased on the interpretable probabilistic treatment of the lastlayers of CNNs.Evaluating attribution is challenging because of the lackof ground truths. Early works have resorted to qualita-tive [23] or human-in-the-loop evaluations [46, 53, 48, 33]with limited reproducibility. Wojciech et al. [51] and sub-sequent works [30, 43, 46, 26] have proposed a quantita-

tive measure based on the remove-and-classify framework.Along a different axis, researchers have focused on the nec-essary conditions for attribution methods. They can be ei-ther theoretical properties, referred to as “axioms” [59, 22]or empirical properties, referred to as “sanity checks” [2]. Inour work, we analyze CALM in terms of the axioms (§4.2)and evaluate it on a remove-and-classify benchmark (§5.3).Additionally, we contribute a new type of evaluation; wecompare the attribution map against the known ground-truthattributions on a real-world dataset [62] (§5.2).Weakly-supervised object localization (WSOL) is simi-lar yet different from the feature attribution task. While thelatter is focused on detecting the small, class-discriminativecues in the input, the former necessitates the detection of thefull object extents. Despite the discrepancy in the objective,CAM has been widely used for both tasks without modifica-tion [13, 12]. We show that CALM, despite being proposedfor the attribution task, outperforms CAM on the WSOLtask after some additional aggregation operations (§5.4).
3. Class Activation Mapping (CAM)We cover the background for the class activation map-
ping (CAM) [68] and analyze its problems. CAM is a fea-ture attribution method for CNN image classifiers. It is ap-plicable to CNNs with the following last layers:
p(y|x) = softmax
(1
HW
∑
hw
fyhw(x)
)(1)
where f(x) is feature map from a fully-convolutional net-work [35] with dimensionality C ×H ×W ; each channelcorresponds to a class-wise feature map. The network istrained with the negative log-likelihood (NLL), also knownas cross-entropy, loss.
At test time, the attribution map is computed by firstfetching the pre-GAP feature map fy=y(x) ∈ RH×W forthe ground-truth class y. CAM then normalizes the featuremap f y to the interval [0, 1] in either ways:
s =
{(f ymax)
−1 max(0, f y) max [68](f ymax − f ymin)
−1(f y − f ymin) min-max [53](2)
where f{min,max} := {minhw,maxhw}fhw.Note that the original CAM paper [68] considers CNNs
with an additional linear layerW ∈ RC×L after the pooling(e.g. ResNet). It is known that such networks are equivalentto Equation 1 when we swap the linear and the GAP lay-ers (which are commutative) and treat the linear layer as aconvolutional layer with 1× 1 kernels [53].
3.1. Limitations of CAM
CAM lacks interpretability. How can we succinctly com-municate the attribution value shw at pixel index (h,w) toothers? The best we can come up with is:
“The pixel-wise pre-GAP, pre-softmax featurevalue at (h,w), measured in relative scale withinthe range of values [0, A] where A is the maxi-mum of the feature values in the entire image.”
This description is hardly communicable even to experts inimage recognition systems, not to mention general users.The difficulty of communication stems from the fact thatthe attribution scores shw are not the quantities used bythe recognition system; the computational graph for CAM(Equation 2) is not part of the training graph (Equation 1).
We present the issues with CAM according to the set ofaxiomatic criteria for attribution methods [40, 59, 22].Implementation-invariance axiom [59] states that twomathematically identical functions, φ1 ≡ φ2, shall pos-sess the same attribution maps, regardless of their im-plementations. CAM violates this axiom. Assumeφ1(f) := softmax( 1
HW
∑hw fyhw) and φ2(f) :=
softmax( 1HW
∑hw fyhw + C) for some constant C. Since
the softmax function is translation invariant, φ1 ≡ φ2 forany C. However, the CAM attribution map for φ2 variesarbitrarily with C: s = (maxhw fhw + C)−1(f + C)+.Min-max normalization is a solution to the problem, but italone does not let CAM meet other axioms. This observa-tion reveals the inherent limitation of utilizing feature val-ues before softmax (often called “logits”) as attribution.Sensitivity axiom [59, 22] states that if the function re-sponse φ(x) changes as the result of altering an input valuexhw at (h,w), then the corresponding attribution value shwshall be non-zero. Conversely, if the response is not af-fected, then shw shall be zero. CAM fails to satisfy the sen-sitivity axiom. Depending on the normalization type, CAMassigns zero attributions to (h,w) where fhw is either neg-ative (for max normalization) or smallest (for min-max nor-malization). However, being assigned a negative or smallestfeature value fhw has little connection to the insensitivity ofthe model to the input value xhw.Completeness (or conservation) axiom [59, 22, 54, 5]states that the sum of attributions
∑hw shw shall add up to
the function output φ(x) = p(y|x). The completeness crite-rion is violated by CAM in general because the summation∑hw shw for s in Equation 2 do not match φ(x) = p(y|x)
in Equation 1. In conclusion, CAM fails to satisfy key min-imal requirements for an attribution method.
4. Class Activation Latent Mapping (CALM)We fix the above issues by introducing a probabilistic
learning framework involving input image X , class labelY , and the cue location Z. We set up a probabilistic graphi-cal model and discuss how each component is parametrizedwith a CNN. We then introduce learning algorithms to ac-count for the unobserved latent variable Z. An overview ofour method is provided in Figure 2.

(d) Training phase
CALMML
CALMEM
Image CNNxp(y, z|x)
C
H
W
(a) Joint distribution computation
Intermediatefeature map
Joint distribution
H
WL
Pseudo-targetpθ′(z|x, y)
Pixel-wise NLL (segmentation loss)
(d) CALMEM
p(y, z|x)Joint distribution
H
W
H
W
Joint likelihoodpθ′(y, z|x)
T.detach() L1 normalizeGAP Slice
(b)
CALM Attribution
C
H
W
C
H
W
(b) Testing phase
p(y|x)PredictionC
C
Prediction
p(y|x)p(y, z|x) p(y, z|x)
(c)
p(y, z|x)
Probabilistic framework for CALM: inference and learning.
GT Class yNLLGAP
(d) CALMML
C
H
W
p(y, z|x)Joint distribution
C
Predictionp(y|x)
ForwardSupervision
§4.1.1
§4.1.2
(c) Interpretation phase
p(y, z|x)CALM Attribution
§4.1.3
g(x)
h(x)
�
p(y, z|x)
Joint distribution
(a)
Intermediatefeature map
H
WL
Conv
Conv
Class-wisesoftmax
Spatial L1 normalization
C
H
WC
H
W
H
W
H
W
C
H
W
p(z|x)hz=
gyz=p(y|x, z)
C
H
W
H
WL C
H
W
Figure 2. Main components of CALM. We show the computational pipeline for CALM during testing, interpretation, and training phases.We zoom into different components. See the relevant sections for more details.
4.1. Probabilistic inference with latent Z
We define Z as the location index (h,w) of the cue forrecognizing the imageX as the class Y . Our aim is to let themodel explicitly depend its prediction on the features corre-sponding to the location Z and later on use the distributionof possible cue locations Z as the attribution provided bythe model. Z is a random variable over indices (h,w); forsimplicity, we use the integer indices Z ∈ {1, · · · , HW}.
Z
X Y
Without loss of generality, we fac-torize p(x, y, z) as p(y, z|x)p(x) =p(y|x, z)p(z|x)p(x) (graph on theleft). The recognition task is then per-formed via p(y|x) =∑z p(y, z|x).
4.1.1 Representing joint distribution with CNNs.
We factorize the joint distribution p(y, z|x) into p(y, z|x) =p(y|x, z)p(z|x) and parametrize p(y|x, z) and p(z|x) astwo convolutional branches of a CNN trunk (Figure 2a).Since Y ∈ {1, · · · , C} and Z ∈ {1, · · · , HW}, we rep-resent p(y|x, z) as a CNN branch g(x) with output dimen-sionality C × HW . Likewise, we represent p(z|x) witha CNN branch h(x) with output dimensionality HW . Tomake sure that the outputs of the two branches are properdistributions, we normalize the outputs with softmax for gand `1 normalization followed by the softplus for h. Webroadcast h to all class indices Y and multiply it element-wise with g to get p(y, z|x) (Figure 2a).
4.1.2 Training algorithms
Training a latent variable model is challenging because ofthe unobserved variable Z. We consider two methods fortraining such a model: (1) marginal likelihood (ML) [37]and (2) expectation-maximization (EM) [15].
CALMML directly minimizes the marginal likelihood
− log pθ(y|x) = − log∑
z
pθ(y|x, z)pθ(z|x) (3)
= − log∑
z
gyz · hz. (4)
which is tractable for the discrete Z. See Figure 2d.
CALMEM is based on the EM algorithm that gener-ates pseudo-targets for Z to supervise the joint likelihoodp(y, z|x). The EM algorithm introduces two running copiesof the parameter set: θ and θ′. The first signifies the modelof interest, while the latter often refers to a slowly updatedparameter used for generating the pseudo-targets for Z. Thelearning objective is
− log pθ(y|x) ≤ −∑
z
pθ′(z|x, y) log pθ(y, z|x) (5)
= −∑
z
g′yz · h′z∑l g′yl · h′l
log (gyz · hz) (6)

where g′ and h′ denote the parametrization with θ′. Notethat Equation 6 is the pixel-wise negative log likelihood, theloss function for semantic segmentation networks [11]. Onemay interpret the objective as self-supervising the pixel(z)-wise predictions p(y, z|x) with its own estimation of thecue location z for the true class y: pθ′(z|x, y). In prac-tice, we use the current-iteration model parameter θ = θ′
to generate the pseudo-target for Z. See Figure 2d for anoverview of the process. Even with θ = θ′, we need to ap-ply T.detach() to block the gradient flow through thepseudo-target pθ′(z|x, y), as required by Equation 6.
A similar framework appears in the weakly-supervisedsemantic segmentation task. Papandreou et al. [42] havegenerated pseudo-target label maps to train a segmenta-tion network. CALMEM is different because our location-encoding latent Z takes integer values, while their Z takesvalues in the space of all binary masks; our formulation ad-mits an exact computation of Equation 6, while theirs re-quire an additional approximation step.
4.1.3 Inferring feature attributions
Unlike CAM, our probabilistic formulation enables princi-pled computation of the attribution map as part of the prob-abilistic inference on p(y, z|x). Z is explicitly defined asthe location of the cue for recognition. For CALM, the at-tribution score sz for location z is naturally defined as thejoint likelihood given the ground-truth class y
sz := p(y, z|x), (7)
or in human language,
“The probability that the cue for recognition wasat z and the ground truth class y was correctlypredicted for the image x.”
Note that the definition is far more communicable than theone for CAM in §3.1. See Figure 2c for visualization.
Apart from the attribution map, one may compute ad-ditional interesting quantities. We show examples in Fig-ure 3. Treating z as a free variable, the conditional at-tribution p(y|x, z) is explained as the likelihood of thecue being at position z, given the prediction for image xas y. The saliency p(z|x) encodes the likely location ofany cue for recognizing classes y ∈ {1, · · · , C} in imagex. It is the sum over all attribution maps for classes y:p(z|x) =
∑y p(y, z|x). One may also compute the par-
tial sum for classes y ∈ Y to obtain the subset attributionto highlight specific image regions of interest p(z,Y|x) :=∑y∈Y p(z, y|x). Above quantities are later utilized for the
weakly-supervised object localization (WSOL) task in §5.4.It is also possible to reason why the class label for input xis y instead of y′ by computing the counterfactual attribu-tion p(y, z|x) − p(y′, z|x). Such counterfactual reasoningwill be used in our analysis in §5.2.
Image p(z, y|x) p(y|x, z)
p(z|x) y p(z, y|x) p(z, y|x) p(z, y ′|x)
Figure 3. Various attribution maps by CALM on ImageNet. GTclass is “Afghan hound”. For the subset attribution, the classes Ycorrespond to all species of dogs in ImageNet. For the counterfac-tual attribution, the alternative class y′ is “Gazelle hound”.
4.2. Theoretical properties of CALM
Now we revisit the axioms for attribution methods thatCAM fails to fulfill (§3.1). Implementation-invarianceaxiom is satisfied by CALM because the attribution maps := p(y, z|x) is a mathematical object in the probabilis-tic graphical model. CALM attribution also does not de-pend on the fragile logit values. The completeness axiomtrivially follows from CALM because the final predictionp(y|x) is the sum of attribution values p(y, z|x) over z.Likewise, the sensitivity axiom follows trivially from thefact that p(y, z|x) > 0 if and only if it contributes towardsthe sum p(y|x) =∑z p(y, z|x).
The superior interpretability of CALM comes with a costto pay. It alters the formulation of the usual structure forCNN classifiers where the loss function has the structure“NLL ◦ SoftMax ◦ Pool” on the feature map f into the onewith the structure “Pool ◦ NLL ◦ SoftMax” on f . Com-pared to the former, CALM gain additional interpretabilityby making the last layer of the network as simple as a sumover the pixel-wise experts p(y, z|x). The reduced com-plexity in turn increases the representational burden for theearlier layers f(x) and induces a drop in the classificationaccuracies (§5.3).
The interpretability-performance trade-off is unavoid-able [34]. Therefore, it benefits users to provide a diverse ar-ray of models with different degrees of interpretability andperformance [49]. Our work contributes to this diversity ofthe ecosystem of models.
5. ExperimentsWe present experimental results for CALM. We present
two experimental analyses on attribution qualities: evalua-

Image
headwing
GT mask CALM EM(Ours)
CALM ML(Ours)
CAM VanillaGradient
SmoothGradient
VarianceGradient
headtail
Figure 4. Qualitative results on CUB. We compare the counterfactual attributions from CALM and baseline methods against the GTattribution mask. The GT mask indicates the bird parts where the attributes for the class pair (A,B) differ. The counterfactual attributionsdenote the difference between the maps for classes A and B: sA − sB. Red: positive values. Blue: negative values.
tion with respect to estimated ground truth attributions onCUB (§5.2) and the remove-and-classify results on threeimage classification datasets (§5.3). We then show resultson the weakly-supervised object localization task in §5.4.Naver Smart Machine Learning (NSML) platform [29] hasbeen used in the experiments.
5.1. Implementation details and baselines
Backbone. CALM is backbone-agnostic, as long as it isfully convolutional. We use the ResNet50 as the featureextractor f unless stated otherwise. As discussed in §3, wemove the final linear layer before the global average poolinglayer as a convolutional layer with 1× 1 kernels.Datasets. Our experiments are built on three real-world im-age classification datasets: CUB-200-2011 [62], a subsetof OpenImages [8], and ImageNet1K [50]. CUB is a fine-grained bird classification dataset with 200 bird classes. Weuse a subset of OpenImages curated by [12] that consistsof 100 coarse-grained everyday objects. ImageNet1K has1000 classes with mixed granularity, ranging from 116 fine-grained dog species to coarse-grained objects and concepts.Pretraining. We use the ImageNet pre-trained weights forf . The two convolutional layers for computing p(y, z|x) inFigure 2a are trained from scratch.Attribution maps. The attribution maps for CAM andCALM are scaled up to the original image size via bilinearinterpolation. For gradient-based baseline attribution meth-ods, we apply Gaussian blurring and min-max normaliza-tion, following [12].Other training details are in the Supplementary Materials.
5.2. Cue localization results
The difficulty of attribution evaluation comes from thefact that it is difficult to obtain the ground truth cue locationsz. We propose a way to estimate the true cue location usingthe rich attribute and part annotations on the bird images inCUB-200-2011 [62].
#part differences 1 2 3#class pairs 31 64 96 mean
Vanilla Gradient [55] 10.0 13.7 15.3 13.9Integrated Gradient [59] 12.0 15.1 17.3 15.7Smooth Gradient [56] 11.8 15.5 18.6 16.5Variance Gradient [3] 16.7 21.1 23.1 21.4
CAM [68] 24.1 28.3 32.2 29.6CALMML (Ours) 23.6 26.7 28.8 27.3CALMEM (Ours) 30.4 33.3 36.3 34.3
Table 1. Attribution evaluation on CUB. We use the estimatedGT attribution masks (§5.2) to measure the performances of at-tribution methods. Mean pixel-wise average precision (mPxAP)values are reported. See Figure 4 for the setup and examples.
Estimating GT cue locations. We generate the ground-truth cue locations using following intuition: for two classesA and B differing only in one attribute a, the location zfor the cue for predicting A instead of B will correspondto the object part containing the attribute a. We explainalgorithmically how we build the ground-truth attributionmask for an image x with respect to two bird classes Aand B in CUB. We first use the attribute annotations for312 attributes in CUB to compute the set of attributesfor each class: SA and SB. For example, SFish crow ={black crown, black wing, all-purpose bill-shape, · · · }. Wethen compute the symmetric difference of the attributesfor the two classes SA4SB = (SA ∪ SB) \ (SA ∩ SB).Now, we map each attribute in a ∈ SA4SB to the cor-responding bird part p ∈ P among 7 bird parts anno-tated in CUB. For example, the attribute-mismatching birdparts for classes “Fish crow” and “Brandt cormorant” arePA,B = {head,wing}. We locate the parts PA,B in samplesx of classes A and B using the keypoint annotations in CUB:KA,B(x). We expand the keypoint annotations to a binarymask MA,B(x) ∈ {0, 1}H×W using the nearest-neighborassignment of pixels to bird parts. The final maskMA,B(x)for the input x is used as the ground-truth attribution map.See the “GT mask” column in Figure 4 for example binary

masks. For evaluation we use all class pairs in CUB withthe number of attribute-differing parts |PA,B| ≤ 3, resultingin 31 + 64 + 96 = 191 class pairs.
Counterfactual attributions. To predict the difference inneeded cues for recognizing classes A and B, we obtainthe absolute values of counterfactual attributions from eachmethod by computing the difference |sA−sB| ∈ [0, 1]H×W .The underlying assumption is that sA and sB point to cuescorresponding to the attributes for A and B, respectively.Hence, by taking the difference, one removes the attribu-tions on regions that are important for both A and B.
Evaluation metric: mean pixel-wise AP. To measurehow well attribution maps retrieve the ground-truth partpixelsMA,B(x), we measure the average precision for thepixel retrieval task [1, 12]. Given a threshold τ ∈ [0, 1], wedefine the positive predictions as the set of pixels in overmultiple images: {(n, h,w) | |sA
hw(xn) − sBhw(xn)| ≥ τ}
for images xn from classes A and B. With the pixel-wisebinary labels MA,B
hw (xn), we compute the pixel-wise aver-age precision (PxAP) for the class pair (A,B) by computingthe area under the precision-recall curve. We then take themean of PxAP over all the class pairs of interest (e.g. thosewith |PA,B| = 1) to compute the mPxAP.
Qualitative results. See Figure 4 for the qualitative ex-amples of CALM and baselines including CAM. We ob-serve that the counterfactual attribution maps sA − sB gen-erated by CALMEM and CALMML are more accurate thanCAM and gradient-based attribution methods; CALMEMattributions are qualitatively more precise than CALMML.CALM tends to assign close-to-zero attributions on irrele-vant regions, while the baseline methods tend to producenoisy attributions. The sparsity of CALM makes it qualita-tively more interpretable than the baselines.
Quantitative results. Table 1 shows the mPxAP scoresfor CALM and baseline methods for retrieving relevant pix-els as attribution regions. We examine CUB class pairswith the number of parts with attribute differences |PA,B| ∈{1, 2, 3}. We observe that CALMEM outperforms the base-lines in all three sets of class pairs, confirming the quali-tative superiority of CALMEM in Figure 4. CALMEM at-tains 4.7%p better mPxAP than CAM on average over thethree sets. CALMML tends to be sub-optimal, compared toCALMEM (27.3% vs 34.3% mPxAP). The variants of gra-dients perform below a mere 20% mPxAP on average. Inconclusion, the counterfactual attribution by CALM gen-erates precise localization of the important bird parts thatmatter for the recognition task.
0 25 50 75 100k (%)
0.0
0.5
1.0
1.5
k
CUB
0 25 50 75 100k (%)
0.0
0.5
1.0
1.5
2.0
OpenImages
Random erasingInput GradientIntegrated Gradient
Smooth GradientVariance GradientCAM
CALM ML (Ours)CALM EM (Ours)
0 25 50 75 100k (%)
0.0
0.5
1.0
ImageNet
Figure 5. Remove-and-classify results. Classification accuraciesof CNNs when k% of pixels are erased according to the attribu-tion values shw. We show the relative accuracies Rk against therandom-erasing baseline. Lower is better.
5.3. Remove-and-classify results
One of the most widely used frameworks for evaluat-ing the attribution task is the remove-and-classify evalua-tion [51, 30, 43, 46, 26]. Image pixels xhw are erased indescending order of importance dictated by the attributionvalues shw. We write x−k for the image where the top-k%important pixels are removed. We use the meaningful per-turbation of the “blur” type [20] for erasing the pixels. Agood attribution method shall assign high attribution valueson important pixels; erasing them will quickly drop the clas-sification accuracy Ak with increasing k. We set the basereference accuracy Ark as the classifier’s accuracy with k%of the pixels erased at random. For each method, we reportthe relative accuracyRk = Ak/Ark for different k.
Results. We show the remove-and-classify results in Fig-ure 5 for three image classification datasets. We observethat CALM variants show the lowest relative accuracies(lower is better) Rk on cue-removed images in CUB andOpenImages, compared to CAM and other baselines. Forthe two datasets, CALMEM attains values even close to zeroat k ∈ [10, 50]. On ImageNet, CALMEM outperforms thebaselines with a smaller margin. Overall, CALMEM selectsthe important pixels for recognition best.
Methods CUB Open ImNet
Baseline 70.6 72.1 74.5CALMEM 71.8 70.1 70.4CALMML 59.6 70.9 70.6
Table 2. Classification accuracy.
Classification performances.We study the trade-off be-tween interpretability and per-formance. The improved attri-bution performances come atthe cost of decreased classification accuracies. Our modelswill be useful in applications that require great attributionperformances at a small cost in model accuracies.
5.4. Weakly-supervised object localization (WSOL)
WSOL is related to but different from the attributiontask. For WSOL, one learns to detect object foreground re-

Imag
eA
fgha
n ho
und
Dog
Ent
ity
CAM
Imag
eA
fgha
n ho
und
Dog
Ent
ity
CALM (Ours)
Figure 6. Aggregating with class hierarchy. “Afghan hound” isa descendant of “Dog”, which is a descendant of “Entity” in theWordNet hierarchy. Selecting a sensible superset Y for aggrega-tion lets CALM produce a high-quality foreground mask.
Methods ImageNet CUB OpenImages
HaS [32] 62.6 60.6 57.4ACoL [66] 61.1 60.0 56.3SPG [67] 62.2 57.5 59.1ADL [14] 61.6 61.1 56.9CutMix [64] 62.2 60.8 59.5InCA [27] 63.1 63.4 -CAM [68] 62.4 61.1 60.0CAM [68] + Y 60.6 63.4 60.0CALMEM 62.5 52.5 62.7CALMEM + Y 62.8 65.4 62.7CALMML 62.6 61.3 62.3CALMML + Y 62.7 68.0 62.3
Table 3. WSOL results on CUB, OpenImages, and ImageNet.Average for ResNet, Inception, and VGG are reported for eachdataset. CALMEM and CALMEM +Y are compared against thebaseline methods. “+Y” denotes the aggregation.
gions with only image-label pairs. While the ingredients areidentical ((X,Y ) observed), the desired latent Z is differ-ent: the important cues for recognition may not necessarilyagree with the object foreground regions. Nonetheless, theWSOL field benefits from the developments in attributionmethods like CAM, which has remained the state of the artmethod for WSOL for the past few years [12].
We apply CALM to WSOL. Since attribution mapsp(y, z|x) only point to sub-parts relevant for recognition,we aggregate the attributions them over multiple classesp(Y, z|x) =
∑y∈Y p(y, z|x) (subset attribution in §4.1.3)
to fully cover the foreground regions.
Setting the superset Y . For the ground-truth class y, weset the superset Y as the set of classes sharing the samepart composition as y. The intuition is that the attributionsare mostly on object parts and that classes of such Y haveattributions spread across different object parts. For exam-ple, all bird classes in CUB [62] shall share the same super-set Y = {all 200 birds}, as they share the same body partcomposition. On the other extreme, 100 classes in Open-Images [8, 12] do not share part structures across classes.Thus, we always set Y = {y}. ImageNet1K [50] is mixed.Its 1000 classes include 116 dog species, but also manyother objects and concepts that do not share the same partstructure. For ImageNet, we have manually annotated thesupersets Y for every class y, using the WordNet hierar-chy [38]. Details in the Supplementary Materials.
Results. We evaluate WSOL performances based on thebenchmarks and evaluation metrics in [12]. The benchmarkconsiders 3 architectures (VGG, Inception, ResNet) and 3datasets (CUB, OpenImages, ImageNet). Implementationdetails are in Supplementary Materials. We show resultsin Table 3. We observe that the aggregation significantlyenhances the WSOL performances for CALMEM: 52.5% to65.4% on CUB. CALMEM +Y attains the best performanceson CUB and OpenImages and second-best on ImageNet.
Analysis. We study the 116 fine-grained dog species inImageNet more closely. We show the aggregation of attri-bution maps in Figure 6. CALM for y fails to cover the fullextent of the object. As the maps are aggregated over all dogspecies Y , the map precisely covers the full extents of thedogs. However, if Y covers all 1000 classes, the resultingsaliency map p(z|x) starts to include non-dog pixels.
6. ConclusionDespite its great contributions to the field, the class ac-
tivation mapping (CAM) is not as interpretable as it couldbe. It lacks communicability in practice and fails to meetkey theoretical requirements for feature attribution meth-ods. This paper has introduced a novel visual feature at-tribution method, class activation latent mapping (CALM).Based on the probabilistic treatment of the last layers ofCNNs, CALM is interpretable by design. CALM satisfiesthe theoretical requirements as an attribution method andoutperforms CAM and other baselines on attribution tasks.
Acknowledgement
This work has been partially funded by the ERC (853489- DEXIM) and by the DFG (2064/1 – Project number390727645). We thank members of NAVER AI Lab, es-pecially Sanghyuk Chun for their helpful feedback and dis-cussion. Kay Choi designed Figure 2.

References[1] Radhakrishna Achanta, Sheila Hemami, Francisco Estrada,
and Sabine Susstrunk. Frequency-tuned salient region detec-tion. In CVPR, 2009. 7
[2] Julius Adebayo, Justin Gilmer, Michael Muelly, Ian Good-fellow, Moritz Hardt, and Been Kim. Sanity checks forsaliency maps. In NeurIPS, 2018. 3
[3] Chirag Agarwal and Sara Hooker. Estimating example diffi-culty using variance of gradients. ICMLW, 2020. 2, 6
[4] David Alvarez-Melis and Tommi S Jaakkola. Towards ro-bust interpretability with self-explaining neural networks. InNeurIPS, 2018. 2
[5] Sebastian Bach, Alexander Binder, Gregoire Montavon,Frederick Klauschen, Klaus-Robert Muller, and WojciechSamek. On pixel-wise explanations for non-linear classi-fier decisions by layer-wise relevance propagation. PloS one,2015. 1, 2, 3
[6] Wonho Bae, Junhyug Noh, and Gunhee Kim. Rethinkingclass activation mapping for weakly supervised object local-ization. In ECCV, 2020. 1, 2
[7] David Baehrens, Timon Schroeter, Stefan Harmeling, Mo-toaki Kawanabe, Katja Hansen, and Klaus-Robert Muller.How to explain individual classification decisions. JMLR,2010. 2
[8] Rodrigo Benenson, Stefan Popov, and Vittorio Ferrari.Large-scale interactive object segmentation with human an-notators. In CVPR, 2019. 6, 8
[9] Aditya Chattopadhay, Anirban Sarkar, Prantik Howlader,and Vineeth N Balasubramanian. Grad-cam++: General-ized gradient-based visual explanations for deep convolu-tional networks. In WACV, 2018. 1, 2
[10] Chaofan Chen, Oscar Li, Daniel Tao, Alina Barnett, CynthiaRudin, and Jonathan K Su. This looks like that: Deep learn-ing for interpretable image recognition. In NeurIPS, 2019.2
[11] Liang-Chieh Chen, George Papandreou, Iasonas Kokkinos,Kevin Murphy, and Alan L Yuille. Deeplab: Semantic imagesegmentation with deep convolutional nets, atrous convolu-tion, and fully connected crfs. PAMI, 2017. 5
[12] Junsuk Choe, Seong Joon Oh, Sanghyuk Chun, ZeynepAkata, and Hyunjung Shim. Evaluation for weakly super-vised object localization: Protocol, metrics, and datasets.arXiv preprint arXiv:2007.04178, 2020. 2, 3, 6, 7, 8
[13] Junsuk Choe, Seong Joon Oh, Seungho Lee, SanghyukChun, Zeynep Akata, and Hyunjung Shim. Evaluatingweakly supervised object localization methods right. InCVPR, 2020. 2, 3, 12, 13
[14] Junsuk Choe and Hyunjung Shim. Attention-based dropoutlayer for weakly supervised object localization. In CVPR,2019. 8, 13, 14
[15] Arthur P Dempster, Nan M Laird, and Donald B Rubin.Maximum likelihood from incomplete data via the em al-gorithm. JRSS: Series B, 1977. 4
[16] Thibaut Durand, Taylor Mordan, Nicolas Thome, andMatthieu Cord. Wildcat: Weakly supervised learning of deepconvnets for image classification, pointwise localization andsegmentation. In CVPR, 2017. 2
[17] Thibaut Durand, Nicolas Thome, and Matthieu Cord. Wel-don: Weakly supervised learning of deep convolutional neu-ral networks. In CVPR, 2016. 2
[18] Daniel C Elton. Self-explaining ai as an alternative to inter-pretable ai. In AGI, 2020. 2
[19] Ruth Fong, Mandela Patrick, and Andrea Vedaldi. Un-derstanding deep networks via extremal perturbations andsmooth masks. In ICCV, 2019. 2
[20] Ruth C Fong and Andrea Vedaldi. Interpretable explanationsof black boxes by meaningful perturbation. In ICCV, 2017.1, 2, 7
[21] Nicholas Frosst and Geoffrey Hinton. Distilling a neural net-work into a soft decision tree. AIIAW, 2017. 2
[22] Ruigang Fu, Q. Hu, X. Dong, Yulan Guo, Y. Gao, and BiaoLi. Axiom-based grad-cam: Towards accurate visualizationand explanation of cnns. ArXiv, abs/2008.02312, 2020. 1, 3
[23] Yash Goyal, Ziyan Wu, Jan Ernst, Dhruv Batra, Devi Parikh,and Stefan Lee. Counterfactual visual explanations. InICML, 2019. 1, 2
[24] Riccardo Guidotti, Anna Monreale, Salvatore Ruggieri,Franco Turini, Fosca Giannotti, and Dino Pedreschi. A sur-vey of methods for explaining black box models. CSUR,2019. 1
[25] David Gunning. Explainable artificial intelligence (xai).DARPA, 2017. 1
[26] Sara Hooker, Dumitru Erhan, Pieter-Jan Kindermans, andBeen Kim. A benchmark for interpretability methods in deepneural networks. In NeurIPS, 2019. 2, 7
[27] Minsong Ki, Youngjung Uh, Wonyoung Lee, and HyeranByun. In-sample contrastive learning and consistent atten-tion for weakly supervised object localization. In ACCV,2020. 8, 13, 14
[28] Been Kim, Martin Wattenberg, Justin Gilmer, Carrie J. Cai,James Wexler, Fernanda B. Viegas, and Rory Sayres. In-terpretability beyond feature attribution: Quantitative testingwith concept activation vectors (tcav). In ICML, 2018. 1, 2
[29] Hanjoo Kim, Minkyu Kim, Dongjoo Seo, Jinwoong Kim,Heungseok Park, Soeun Park, Hyunwoo Jo, KyungHyunKim, Youngil Yang, Youngkwan Kim, et al. Nsml: Meet themlaas platform with a real-world case study. arXiv preprintarXiv:1810.09957, 2018. 6
[30] Pieter-Jan Kindermans, Kristof T. Schutt, Maximilian Alber,Klaus-Robert Muller, Dumitru Erhan, Been Kim, and SvenDahne. Learning how to explain neural networks: Patternnetand patternattribution. In ICLR, 2018. 2, 7
[31] Pang Wei Koh, Thao Nguyen, Yew Siang Tang, StephenMussmann, Emma Pierson, Been Kim, and Percy Liang.Concept bottleneck models. In ICML, 2020. 2
[32] Krishna Kumar Singh and Yong Jae Lee. Hide-and-seek:Forcing a network to be meticulous for weakly-supervisedobject and action localization. In ICCV, 2017. 8, 13, 14
[33] Isaac Lage, Andrew Ross, Samuel J Gershman, Been Kim,and Finale Doshi-Velez. Human-in-the-loop interpretabilityprior. In NeurIPS, 2018. 2
[34] Pantelis Linardatos, Vasilis Papastefanopoulos, and SotirisKotsiantis. Explainable ai: A review of machine learninginterpretability methods. Entropy, 2021. 2, 5

[35] Jonathan Long, Evan Shelhamer, and Trevor Darrell. Fullyconvolutional networks for semantic segmentation. InCVPR, 2015. 3
[36] Max Losch, Mario Fritz, and Bernt Schiele. Interpretabilitybeyond classification output: Semantic bottleneck networks.arXiv preprint arXiv:1907.10882, 2019. 2
[37] David JC MacKay and David JC Mac Kay. Information the-ory, inference and learning algorithms. 2003. 4
[38] George A Miller. Wordnet: a lexical database for english.Communications of the ACM, 1995. 8, 12
[39] Gregoire Montavon, Sebastian Lapuschkin, AlexanderBinder, Wojciech Samek, and Klaus-Robert Muller. Ex-plaining nonlinear classification decisions with deep taylordecomposition. Pattern Recognition, 2017. 1, 2
[40] Gregoire Montavon, Wojciech Samek, and Klaus-RobertMuller. Methods for interpreting and understanding deepneural networks. Digital Signal Processing, 2018. 1, 3
[41] Maxime Oquab, Leon Bottou, Ivan Laptev, and Josef Sivic.Is object localization for free?-weakly-supervised learningwith convolutional neural networks. In CVPR, 2015. 2
[42] George Papandreou, Liang-Chieh Chen, Kevin P. Murphy,and Alan L. Yuille. Weakly- and semi-supervised learning ofa deep convolutional network for semantic image segmenta-tion. In ICCV, 2015. 5
[43] Vitali Petsiuk, Abir Das, and Kate Saenko. Rise: Random-ized input sampling for explanation of black-box models. InBMVC, 2018. 1, 2, 7
[44] Brett Poulin, Roman Eisner, Duane Szafron, Paul Lu, RussellGreiner, David S. Wishart, Alona Fyshe, Brandon Pearcy,Cam Macdonell, and John Anvik. Visual explanation of evi-dence with additive classifiers. In AAAI, 2006. 2
[45] Harish Guruprasad Ramaswamy et al. Ablation-cam: Visualexplanations for deep convolutional network via gradient-free localization. In WACV, 2020. 1
[46] Marco Tulio Ribeiro, Sameer Singh, and Carlos Guestrin.Why should i trust you?: Explaining the predictions of anyclassifier. In SIGKDD, 2016. 2, 7
[47] Marco Tulio Ribeiro, Sameer Singh, and Carlos Guestrin.Anchors: High-precision model-agnostic explanations. InAAAI, 2018. 1
[48] Andrew Ross and Finale Doshi-Velez. Improving the adver-sarial robustness and interpretability of deep neural networksby regularizing their input gradients. In AAAI, 2018. 2
[49] Cynthia Rudin. Stop explaining black box machine learningmodels for high stakes decisions and use interpretable mod-els instead. NMI, 2019. 5
[50] Olga Russakovsky, Jia Deng, Hao Su, Jonathan Krause, San-jeev Satheesh, Sean Ma, Zhiheng Huang, Andrej Karpathy,Aditya Khosla, Michael Bernstein, et al. Imagenet largescale visual recognition challenge. IJCV, 2015. 6, 8
[51] Wojciech Samek, Alexander Binder, Gregoire Montavon,Sebastian Lapuschkin, and Klaus-Robert Muller. Evaluatingthe visualization of what a deep neural network has learned.IEEE TNNLS, 2016. 2, 7
[52] Wojciech Samek, Gregoire Montavon, Sebastian La-puschkin, Christopher J Anders, and Klaus-Robert Muller.Explaining deep neural networks and beyond: A review ofmethods and applications. Proceedings of the IEEE, 2021. 1
[53] Ramprasaath R Selvaraju, Michael Cogswell, Abhishek Das,Ramakrishna Vedantam, Devi Parikh, and Dhruv Batra.Grad-cam: Visual explanations from deep networks viagradient-based localization. In ICCV, 2017. 1, 2, 3, 11
[54] Avanti Shrikumar, Peyton Greenside, and Anshul Kundaje.Learning important features through propagating activationdifferences. In ICML, 2017. 2, 3
[55] Karen Simonyan, Andrea Vedaldi, and Andrew Zisserman.Deep inside convolutional networks: Visualising image clas-sification models and saliency maps. In ICLRW, 2014. 1, 2,6
[56] Daniel Smilkov, Nikhil Thorat, Been Kim, Fernanda Viegas,and Martin Wattenberg. Smoothgrad: removing noise byadding noise. ICMLW, 2017. 1, 2, 6
[57] Jost Tobias Springenberg, Alexey Dosovitskiy, ThomasBrox, and Martin Riedmiller. Striving for simplicity: Theall convolutional net. In ICLRW, 2015. 2
[58] Suraj Srinivas and Francois Fleuret. Full-gradient represen-tation for neural network visualization. In NeurIPS, 2019. 1,2
[59] Mukund Sundararajan, Ankur Taly, and Qiqi Yan. Axiomaticattribution for deep networks. In ICML, 2017. 1, 2, 3, 6
[60] AH Sung. Ranking importance of input parameters of neuralnetworks. Expert Systems with Applications, 1998. 2
[61] Haofan Wang, Zifan Wang, Mengnan Du, Fan Yang, ZijianZhang, Sirui Ding, Piotr Mardziel, and Xia Hu. Score-cam:Score-weighted visual explanations for convolutional neuralnetworks. In CVPRW, 2020. 1
[62] P. Welinder, S. Branson, T. Mita, C. Wah, F. Schroff, S. Be-longie, and P. Perona. Caltech-UCSD Birds 200. TechnicalReport CNS-TR-2010-001, California Institute of Technol-ogy, 2010. 2, 3, 6, 8
[63] Yiding Yang, Jiayan Qiu, Mingli Song, Dacheng Tao, andXinchao Wang. Learning propagation rules for attributionmap generation. In ECCV. Springer, 2020. 1, 2
[64] Sangdoo Yun, Dongyoon Han, Seong Joon Oh, SanghyukChun, Junsuk Choe, and Youngjoon Yoo. Cutmix: Regu-larization strategy to train strong classifiers with localizablefeatures. In ICCV, 2019. 8, 13, 14
[65] Jianming Zhang, Zhe Lin, Jonathan Brandt, Xiaohui Shen,and Stan Sclaroff. Top-down neural attention by excitationbackprop. In ECCV, 2016. 2
[66] Xiaolin Zhang, Yunchao Wei, Jiashi Feng, Yi Yang, andThomas S Huang. Adversarial complementary learning forweakly supervised object localization. In CVPR, 2018. 8,13, 14
[67] Xiaolin Zhang, Yunchao Wei, Guoliang Kang, Yi Yang,and Thomas Huang. Self-produced guidance for weakly-supervised object localization. In ECCV, 2018. 8, 13, 14
[68] Bolei Zhou, Aditya Khosla, Agata Lapedriza, Aude Oliva,and Antonio Torralba. Learning deep features for discrimi-native localization. In CVPR, 2016. 1, 2, 3, 6, 8, 11, 14
[69] Bolei Zhou, Yiyou Sun, David Bau, and Antonio Torralba.Interpretable basis decomposition for visual explanation. InECCV, 2018. 1
[70] Luisa M Zintgraf, Taco S Cohen, Tameem Adel, and MaxWelling. Visualizing deep neural network decisions: Predic-tion difference analysis. In ICLR, 2017. 1, 2

Supplementary MaterialsSupplementary Materials contain supporting claims, deriva-tions for formulae, and auxiliary experimental results forthe materials in the main paper. The sections are composedsequentially with respect to the contents of the main paper.
A. Equivalence of CAM formulationsIn §3 of the main paper, we have argued that the formu-
lation in Equation 1 copied below,
p(y|x) = softmax
(1
HW
∑
hw
fyhw(x)
)(8)
is equivalent to CNNs with an additional linear layer W ∈RC×L after the global average pooling (e.g. ResNet):
p(y|x) = softmax
(∑
l
Wyl
(1
HW
∑
hw
f lhw(x)
))(9)
where f is a fully-convolutional network with output di-mensionality f(x) ∈ RL×H×C . This follows from the dis-tributive property of sums and multiplications:
∑
l
Wyl
(1
HW
∑
hw
f lhw(x)
)=
1
HW
∑
hw
∑
l
Wylf lhw(x)
(10)
where we may re-define fyhw :=∑lWylf lhw as another
fully-convolutional network with a convolutional layer with1× 1 kernels (Wyl) at the end.
For networks of the form in Equation 9, the originalCAM algorithm computes the attribution map by first takingthe sum
fhw =∑
l
Wylf lhw(x) (11)
and normalizing f as in Equation 2 in main paper:
s =
{(f ymax)
−1 max(0, f y) max [68](f ymax − f ymin)
−1(f y − f ymin) min-max [53](12)
Hence, for both training and interpretation, the family ofarchitectures described by Equation 1 subsumes the familyoriginally considered in CAM [68] (Equation 9).
B. Derivation of CALMEM objectiveIn §4.1.2, we have introduced an expectation-
maximization (EM) learning framework for our latentvariable model. We derive the EM objective in Equation 6
here. Our aim is to minimize the negative log-likelihood− log pθ(y|x). We upper bound the objective as follows.
− log pθ(y|x) = − log∑
z
pθ(y, z|x) (13)
= − log∑
z
pθ′(z|x, y)pθ(y, z|x)pθ′(z|x, y)
(14)
≤ −∑
z
pθ′(z|x, y) logpθ(y, z|x)pθ′(z|x, y)
(15)
≤ −∑
z
pθ′(z|x, y) log pθ(y, z|x) . (16)
The inequalities leading to Equation 15 and 16 follow fromthe Jensen’s inequality and the positivity of the entropy, re-spectively.
We parametrize each term with a neural network.pθ(y, z|x) is computed via gyz · hz and pθ′(z|x, y) is firstdecomposed as
pθ′(z|x, y) =pθ′(y, z|x)∑l pθ′(y, l|x)
(17)
and computed with neural networks
pθ′(z|x, y) =g′yz · h′z∑l g′yl · h′l
(18)
where g′ and h′ are neural networks parametrized with θ′.
C. Training details for CALMWe provide miscellaneous training details for CALM.
See §5.1 in the main paper for major training details.
Architecture. We use the ResNet50 as the feature extrac-tor. We enlarge the attribution map size to 28×28 by chang-ing the stride of the last two residual blocks from 2 to 1.Two CNN branches g and h are followed by the feature ex-tractor. The branch g is the one convolutional layer of kernelsize 1 and stride 1 with the number of output channel to bethe number of classes. The branch h is composed of oneconvolutional layer of kernel size 1 and stride 1 with thenumber of output channel to be 1, followed by the ReLUactivation function.
Optimization hyperparameters. We use the stochasticgradient descent with the momentum 0.9 and weight decay1× 10−4. We set the learning rate as (3× 10⁻⁵, 5× 10−5,7× 10−5) for (CUB, OpenImages, ImageNet).
D. More qualitative resultsSee qualitative results in Figure 7 for the comparison of
attributions against the ground-truth attributions using the

counterfactual maps sA−sB. As in Figure 4 of the main pa-per, we observe that CALM attains the best similarity withthe ground-truth masks. CALM are also the most human-understandable among the considered methods.
We add more qualitative results of the attribution mapssA for the ground-truth class for CUB (Figure 8), Open-Images (Figure 9), and ImageNet (Figure 10). For eachcase, we do not have the GT attribution maps as in Figure 7,but we show the GT foreground object bounding boxes, ormasks if available (OpenImages). Note that the attribu-tion maps (CALMEM and CALMML) are not designed tohighlight the full object extent, while the aggregated ver-sions (+Y) are designed so. We observe that in all threedatasets, CALMEM +Y and CALMML +Y tend to generatehigh-quality foreground masks for the object of interest; forOpenImages, note that “+Y” does not change CALMEM andCALMML as the supersets Y are all singletons.
E. Evaluation protocol for WSOLIn §5.4 of the main paper, we have presented exper-
imental results on WSOL benchmarks. In this section,we present metrics, datasets, and validation protocols forthe WSOL experiments. We follow the recently proposedWSOL evaluation protocol [13].Metrics. After computing the attribution s, WSOL meth-ods binarize the attribution by a threshold τ to generate aforeground mask M = 1[sij ≥ τ ]. When there are maskannotations in the dataset, we compute pixel-wise precisionand recall at the threshold τ . The PxAP is the area un-der the precision and recall curve at all possible thresholdsτ ∈ [0, 1]. On the other hand, when only the box annota-tions are available, we generate a bounding box that tightlybound each connected component on the mask M. Then,we calculate intersection over union (IoU) between all pairsof ground truth boxes and predicted boxes at all thresholdsτ ∈ [0, 1]. When there is at least one pair of (ground truth,prediction, τ ) with IoU ≥ δ, we regard the localization pre-diction of the attribution as correct. The MaxBoxAccV2 isthe average of three ratios of correct images in the datasetat three δ = 0.3, 0.5, 0.7.Evaluation protocol. Every dataset in our WSOL exper-iments consists of three disjoint splits: train, val, andtest. The val and test splits contain images with lo-calization and class labels, while the train split containsimages only with class labels. We use the train split totrain the classifier, and tune our hyperparameter by check-ing the localization performance on the val split. Specif-ically, we only tune the learning rate by randomly sam-pling 30 learning rates from the log-uniform distributionLogUniform[5−5, 5−1]. Then, based on the performance onval, we select the optimal learning rate. Finally, we mea-sure the final localization performance on test split withthe selected learning rate. Since previous WSOL methods
in [13] are also evaluated under this evaluation protocol, wecan compare fairly our method with the previous methods.
F. Superset Y for ImageNet classesIn the main paper §5.4, we have discussed the disjoint
goals pursued by two tasks, visual attribution and WSOL.The former aims to locate cues that make the class distin-guished from the others and typically locates a small part ofthe object; the latter aims to locate the foreground pixels forobjects. To bridge the two, we have considered an aggrega-tion strategy to produce a foreground mask from attributionmaps. Our assumption is that attribution maps for differ-ent classes for the same family sharing the identical objectstructure will cover various object parts in the foregroundmask. For example, 200 bird classes in CUB share thepart structure of “head-beak-breast-wing-belly-leg-tail”, buteach class will highlight different parts. Combining the at-tribution maps for the 200 classes will roughly cover all theobject parts, providing a higher-quality foreground mask.
For 1000 classes in ImageNet1K, we manually annotatethe corresponding supersets Y . We first build a tree of con-cepts over the classes using the WordNet hierarchy [38].The leaf nodes correspond to 1000 classes, while the rootnode corresponds to the concept “entity” that includes all1000 classes. For each leaf node (ImageNet class) y, wehave annotated the superset Y by choosing an appropriateparent node of y. The parent selection criteria is as follows:
• Choose the parent node PA(y) of y as close to the rootas possible;
• Such that Y , the set of all children of PA(y), consistsof classes with the same object structure as y.
Algorithm. We efficiently annotate the parent nodes bytraversing the tree in a breadth-first-search (BFS) mannerfrom the root node, “entity”. We start from the direct chil-dren (depth= 1) of the root node. For each node of depth 1,we mark if the concept contains classes of the same objectstructure (hom or het). For example, the family of classesunder the organism parent is not yet specific enough tocontain classes of homogeneous object structures, so wemark het. We continue traversing in depths 2, 3, and soon. If a node at depth d is marked hom, we treat all of itschildren to have the same superset Y and do not traverseits descendants for depth> d. For example, the caninesuperset of 116 ImageNet classes is reached by followingthe genealogy of organism → animal → chordate→ mammal→ placental→ carnivore→ canine.We note that the task is fairly well-defined for humans.
Results. We find 450 supersets in ImageNet1K. 120 ofthem are non-singleton, consisting of at least two ImageNet

classes. The rest 330 classes are singleton supersets. SeeTable 4 for the list.
G. A complete version of WSOL resultsSee Table 5 for the complete version of Table 3 of
the main paper. We show the architecture-wise perfor-mances for CALM, CAM, and six previous WSOL methods(HaS [32], ACoL [66], SPG [67], ADL [14], CutMix [64],InCA [27]).
In the ImageNet1K dataset, the proposed methodachieves competitive performance (62.8%) with CAM(62.4%) and InCA (63.1%). The supersetY aggregation im-proves the localization performances for CALMEM (62.5%→ 62.8%), but it decreases the CAM performances sig-nificantly (62.4% → 60.6%). For CUB, we observe thatCALMEM does not localize the birds effectively withoutthe superset Y (52.5%). With the superset aggregation,CALMEM attains 65.4%. This is expected behavior becauseCALMEM attributions often highlight small discriminativeobject parts (e.g. Figure 4 in the main paper). For OpenIm-ages, CALMEM achieves the state-of-the-art performanceson all three backbone architectures (61.3%, 64.4%, 62.5%).Since the modified OpenImages [13] consists of classes ofunique object structures, the supersets are all singletons.The performances are thus identical with or without the ag-gregation +Y . In summary, CALMEM on ImageNet is com-petitive, compared to the state of the art, and is the new stateof the art on CUB and OpenImages.
H. More qualitative examples for WSOLIn Figure 6 of the main paper, we have shown the aggre-
gation of attribution maps at different depths of hierarchyfor the “canine” class. We show additional qualitative ex-amples of the superset aggregation for other classes in Fig-ure 11. We note that the optimal depths that precisely coverthe object extents differ across classes.

Class name WordNet ID # Classes Class name WordNet ID # Classes Class name WordNet ID # Classes
canine n02083346 116 wheel n04574999 4 power tool n03997484 2bird n01503061 52 swine n02395003 3 farm machine n03322940 2reptile n01661091 36 lagomorph n02323449 3 slot machine n04243941 2insect n02159955 27 marsupial n01874434 3 free-reed instrument n03393324 2primate n02469914 20 coelenterate n01909422 3 piano n03928116 2ungulate n02370806 17 echinoderm n02316707 3 lock n03682487 2aquatic vertebrate n01473806 16 person n00007846 3 breathing device n02895606 2building n02913152 12 firearm n03343853 3 heater n03508101 2car n02958343 10 clock n03046257 3 locomotive n03684823 2bovid n02401031 9 portable computer n03985232 3 bicycle, n02834778 2arachnid n01769347 9 brass n02891788 3 railcar n02959942 2ball n02778669 9 cart n02970849 3 handcart n03484083 2headdress n03502509 9 sailing vessel n04128837 3 warship n04552696 2feline n02120997 8 aircraft n02686568 3 sled n04235291 2amphibian n01627424 8 bus n02924116 3 reservoir n04078574 2decapod crustacean n01976146 8 pot n03990474 3 jar n03593526 2place of business n03953020 8 dish n03206908 3 basket n02801938 2musteline mammal n02441326 7 pot n03990474 3 glass n03438257 2fungus n12992868 7 pen n03906997 3 shaker n04183329 2truck n04490091 7 telephone, phone n04401088 3 opener n03848348 2bottle n02876657 7 gymnastic apparatus n03472232 3 power tool n03997484 2seat n04161981 7 neckwear n03816005 3 pan, cooking pan n03880531 2rodent n02329401 6 swimsuit n04371563 3 cleaning implement n03039947 2mollusk n01940736 6 body armor n02862048 3 puzzle n04028315 2stringed instrument n04338517 6 footwear n03381126 3 camera n02942699 2boat n02858304 6 bridge n02898711 3 weight n04571292 2box n02883344 6 memorial n03743902 3 cabinet n02933112 2toiletry n04447443 6 alcohol n07884567 3 curtain n03151077 2bag n02773037 5 dessert n07609840 3 sweater n04370048 2stick n04317420 5 cruciferous vegetable n07713395 3 robe n04097866 2bear n02131653 4 baby bed n02766320 3 scarf n04143897 2woodwind n04598582 4 procyonid n02507649 2 gown n03450516 2source of illumination n04263760 4 viverrine n02134971 2 protective garment n04015204 2ship n04194289 4 cetacean n02062430 2 oven n03862676 2edge tool n03265032 4 edentate n02453611 2 sheath n04187061 2overgarment n03863923 4 elephant n02503517 2 movable barrier n03795580 2skirt n04230808 4 prototherian n01871543 2 sheet n04188643 2roof n04105068 4 worm n01922303 2 plaything n03964744 2fence n03327234 4 flower n11669921 2 mountain n09359803 2piece of cloth n03932670 4 timer n04438304 2 shore n09433442 2
Table 4. List of supersets Yfine. We list 120 supersets for classes in ImageNet1K. We omit the rest 330 supersets from the list, as they onlyhave single elements (singletons).
ImageNet (MaxBoxAccV2) CUB (MaxBoxAccV2) OpenImages (PxAP) TotalMethods VGG Inception ResNet Mean VGG Inception ResNet Mean VGG Inception ResNet Mean Mean
HaS [32] 60.6 63.7 63.4 62.6 63.7 53.4 64.6 60.6 58.1 58.1 55.9 57.4 60.2ACoL [66] 57.4 63.7 62.3 61.1 57.4 56.2 66.4 60.0 54.3 57.2 57.3 56.3 59.1SPG [67] 59.9 63.3 63.3 62.2 56.3 55.9 60.4 57.5 58.3 62.3 56.7 59.1 59.6ADL [14] 59.9 61.4 63.7 61.6 66.3 58.8 58.3 61.1 58.7 56.9 55.2 56.9 59.9CutMix [64] 59.5 63.9 63.3 62.2 62.3 57.4 62.8 60.8 58.1 62.6 57.7 59.5 60.8InCA [27] 61.3 62.8 65.1 63.1 66.7 60.3 63.2 63.4 - - - - -CAM [68] 60.0 63.4 63.7 62.4 63.7 56.7 63.0 61.1 58.3 63.2 58.5 60.0 61.2CAM [68] + Y 59.4 62.1 60.4 60.6 63.6 59.1 67.4 63.4 58.3 63.2 58.5 60.0 60.1CALMEM 62.3 62.2 63.1 62.5 54.9 42.2 60.3 52.5 61.3 64.4 62.5 62.7 59.2CALMEM + Y 62.8 62.3 63.4 62.8 64.8 60.3 71.0 65.4 61.3 64.4 62.5 62.7 63.6
Table 5. WSOL results on CUB, OpenImages, and ImageNet. Extension of Table 2 in main paper. CALMEM and CALMEM +Y arecompared against the baseline methods. CALMEM +Y denote the aggregated attribution map for classes in Y .

Image
headwing
GT mask CALM EM(Ours)
CALM ML(Ours)
CAM VanillaGradient
SmoothGradient
VarianceGradient
headbreast
backwing
headwing
headbelly
breast
headtail
wing
wing
head
Figure 7. Counterfactual attribution maps on CUB. Extension of Figure 4 in main paper. We compare the counterfactual attributionsfrom CALM and baseline methods against the GT attribution mask. The GT mask indicates the bird parts where the attributes for the classpair (A,B) differ. The counterfactual attributions denote the difference between the maps for classes A and B: sA − sB. Red: positivevalues. Blue: negative values.

Image CALM EM(Ours)
CALM EM +(Ours)
CALM ML(Ours)
CALM ML +(Ours)
CAM VanillaGradient
VarianceGradient
Figure 8. Examples of attribution maps on CUB. We show the object bounding boxes to mark the foreground regions. +Y denotes theclass aggregation.
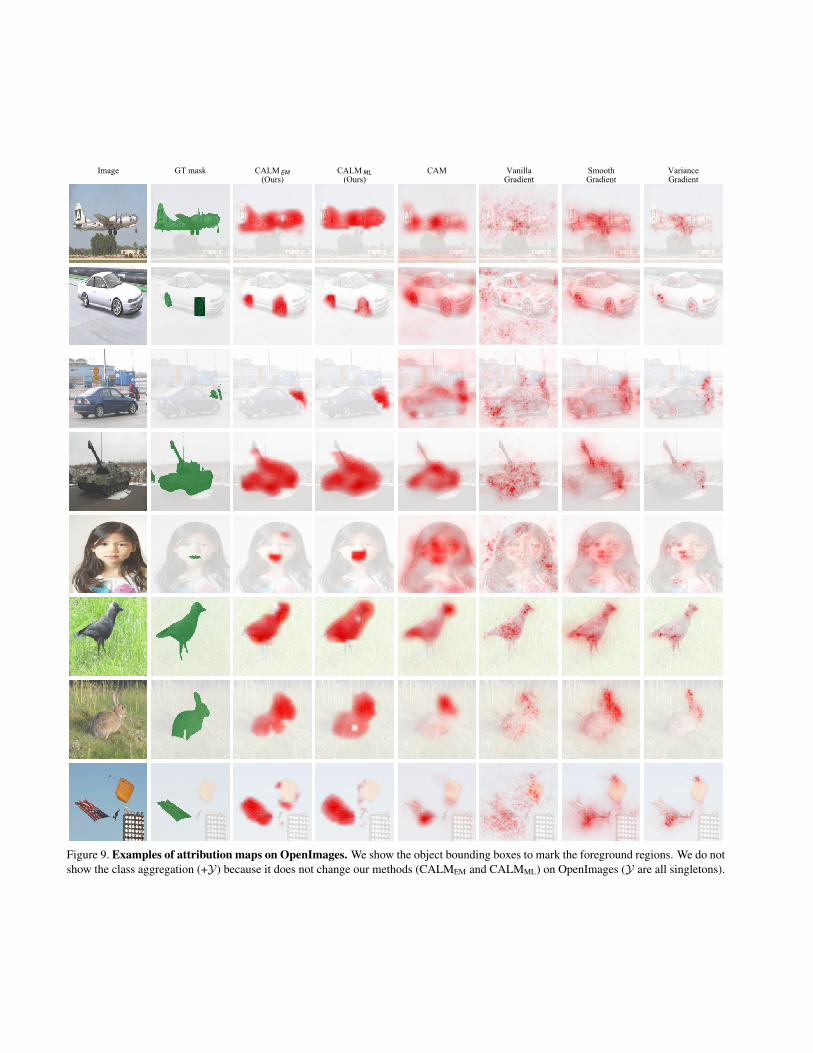
Image GT mask CALM EM(Ours)
CALM ML(Ours)
CAM VanillaGradient
SmoothGradient
VarianceGradient
Figure 9. Examples of attribution maps on OpenImages. We show the object bounding boxes to mark the foreground regions. We do notshow the class aggregation (+Y) because it does not change our methods (CALMEM and CALMML) on OpenImages (Y are all singletons).

Image CALM EM(Ours)
CALM EM +(Ours)
CALM ML(Ours)
CALM ML +(Ours)
CAM VanillaGradient
VarianceGradient
Figure 10. Examples of attribution maps on ImageNet. We show the object bounding boxes to mark the foreground regions. +Y denotesthe class aggregation.
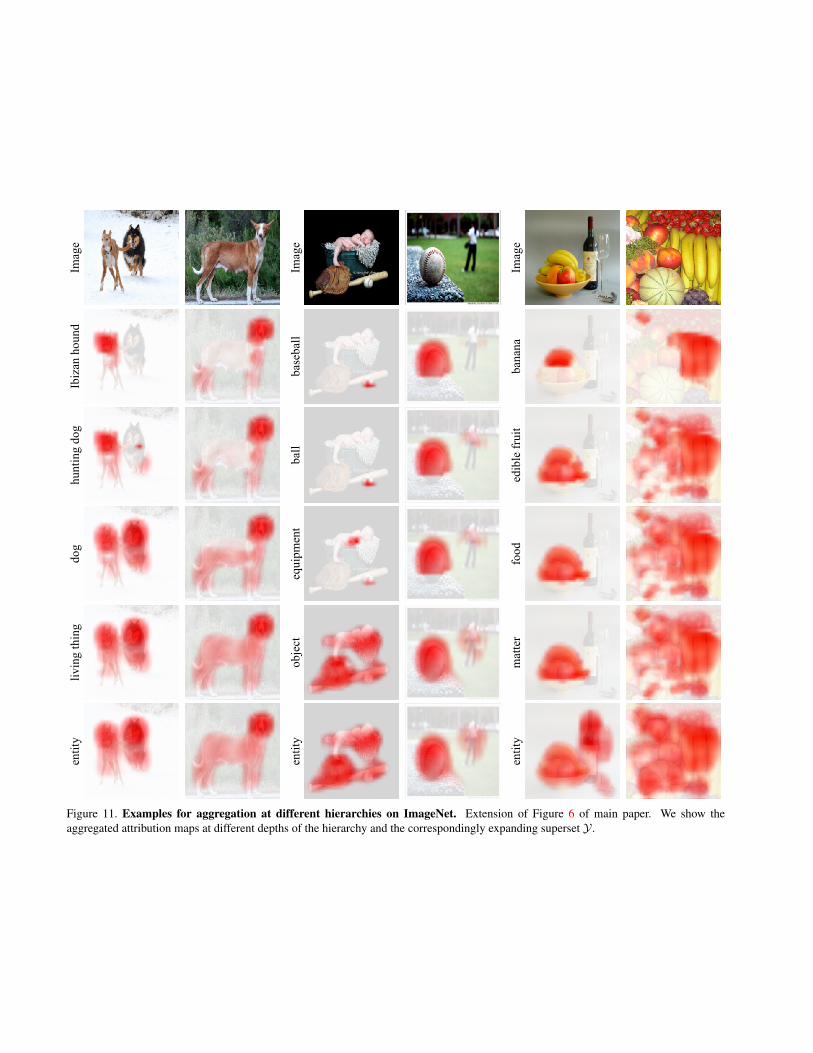
Imag
eIb
izan
hou
ndhu
ntin
g do
gdo
gli
ving
thin
gen
tity
Imag
eba
seba
llba
lleq
uipm
ent
obje
cten
tity
Imag
eba
nana
edib
le f
ruit
food
mat
ter
enti
ty
Figure 11. Examples for aggregation at different hierarchies on ImageNet. Extension of Figure 6 of main paper. We show theaggregated attribution maps at different depths of the hierarchy and the correspondingly expanding superset Y .