Keangnam towers wind tunnel testing
97
BMT Fluid Mechanics Limited COMMERCIAL - IN - CONFIDENCE Project 43858/00 Report 3 Rel.1 1 of 97 43860rep3v2.doc Project No. 43860 Keangnam Hanoi Landmark Tower Complex Wind Tunnel Testing Overall Wind Loading Studies (5 th February 2008) For Dong Yang Structural Engineers Group
-
Upload
nguyen-ton-viet -
Category
Engineering
-
view
325 -
download
17
Transcript of Keangnam towers wind tunnel testing

BMT Fluid Mechanics Limited COMMERCIAL - IN - CONFIDENCE
Project 43858/00 Report 3 Rel.1 1 of 97 43860rep3v2.doc
Project No. 43860 Keangnam Hanoi Landmark Tower Complex Wind Tunnel Testing Overall Wind Loading Studies (5th February 2008)
For Dong Yang Structural Engineers Group

BMT Fluid Mechanics Limited COMMERCIAL - IN - CONFIDENCE
43860/00 Report 3 Rel.2 2 of 97 43860rep3v2.doc
Report Title
Keangnam Hanoi Landmark Tower Complex Hanoi, Vietnam Wind Tunnel Testing Overall Wind Loading Studies
Client: Dong Yang Structural Engineers
Group Document No: 43860rep3v2 Document No: Status
Draft Report for Client Review
Report Date:
6th February 2008
Holds:
Name: Signature: Date:
Prepared by: Dr Y F Li _______________ _______________
Checked by: Mr L Aurelius _______________ _______________
Approved by: Dr V Buttgereit _______________ _______________
Distribution:
Copy no. to Client
Copy no. to BMT Records
Previous Release History:
Release No: Status: Date:
43860rep3v1 1 Draft Report for Internal Review
5th February, 2008

BMT Fluid Mechanics Limited COMMERCIAL - IN - CONFIDENCE
43860/00 Report 3 Rel.2 3 of 97 43860rep3v2.doc
Keangnam Hanoi Landmark Tower Complex Hanoi, Vietnam Wind Tunnel Testing Overall Wind Loading Studies
Contents
1. Introduction ................................................................................................9
1.1. Background.........................................................................................9
1.2. Site / Building Details...........................................................................9
1.2.1. Proposed Development / Location .................................................9
1.2.2. Surrounding Area ........................................................................9
1.3. Requirements for Wind Studies........................................................... 10
1.4. Scope of Work................................................................................... 10
1.4.1. Model ....................................................................................... 10
1.4.2. Measurements / Analysis ............................................................ 10
1.4.3. Report ...................................................................................... 11
2. Methodology.............................................................................................. 12
2.1. Technical Standards........................................................................... 12
2.2. Details of Study................................................................................. 12
2.2.1. Design Wind Speeds .................................................................. 12
2.2.2. Wind Tunnel Model .................................................................... 12
2.2.3. Measurement and Analysis ......................................................... 12
2.2.4. Building Properties..................................................................... 12
2.2.5. Force/Moment Axis System......................................................... 13
2.2.6. Definition of Wind Direction ........................................................ 13
3. Results...................................................................................................... 14
3.1. Wind Loading.................................................................................... 14

BMT Fluid Mechanics Limited COMMERCIAL - IN - CONFIDENCE
43860/00 Report 3 Rel.2 4 of 97 43860rep3v2.doc
3.1.1. Base Loads ............................................................................... 14
3.1.2. Floor-by-Floor Loads .................................................................. 14
3.2. Building Accelerations ........................................................................ 14
4. Recommendations...................................................................................... 16
4.1. Structural Design............................................................................... 16
4.1.1. Combination of Loads ................................................................ 16
4.1.2. Serviceability Design .................................................................. 16
5. Conclusion................................................................................................. 17
6. References ................................................................................................ 20
Tables.............................................................................................................. 21
Figures............................................................................................................. 32
APPENDIX A. Wind Analysis............................................................................ 51
APPENDIX B. Wind Tunnel & Model Details ...................................................... 58
APPENDIX C. Instrumentation and Experimental techniques.............................. 67
APPENDIX D. Data Analysis ............................................................................ 69
APPENDIX E. Structural and Dynamic Properties .............................................. 81
APPENDIX F. Structural Load Cases ................................................................ 91
APPENDIX G. Aerodynamic Load Coefficients ................................................... 93
APPENDIX H. Overall Load Results .................................................................. 97

BMT Fluid Mechanics Limited COMMERCIAL - IN - CONFIDENCE
43860/00 Report 3 Rel.2 5 of 97 43860rep3v2.doc
EXECUTIVE SUMMARY
Background
This report summarises the results of a programme of boundary layer wind tunnel studies conducted by BMT Fluid Mechanics Limited (BMT) to assess the wind effects relevant to the structural and serviceability design of the proposed Keangnam Hanoi Landmark tower complex, located within Hanoi, Vietnam.
A 1:400 scale model of the proposed tower was constructed for the purpose of conducting a wind tunnel study to measure and determine the overall wind loads acting on the building.
Fluctuating base wind loads and fluctuating external wind pressures were measured on the proposed Landmark and Residential Towers respectively for a full range of wind directions. Dynamic analysis, using structural and dynamic properties provided by ARUP (Hong Kong), was conducted.
Floor-by-floor peak dynamic loads for various components were estimated. In order to account for the non-simultaneous action of the individual peak floor-by-floor load components, percentages of load components for 10 load cases were calculated.
The study defines the design loads for the proposed towers based on design wind speeds derived from a purposely-commissioned typhoon simulation. The design wind speeds for the 100-years return period are based on a 100-year return period, mean hourly, 10 m height, open country basic wind speed of 27.2 m/s.
For serviceability design of the towers for lower return periods, the design wind speeds were derived from a combination of analysis of local wind climate data, the typhoon simulation, and recommendations presentment within TCVN 2737:1995, the current wind loading standard of Vietnam.
The aforementioned wind speeds incorporate direction factors derived from a combination of analysis of local wind climate data and the typhoon simulation. The derivation of the all design wind speeds used in this study was approved by ARUP (Hong Kong).

BMT Fluid Mechanics Limited COMMERCIAL - IN - CONFIDENCE
43860/00 Report 3 Rel.2 6 of 97 43860rep3v2.doc
Principal Results
Peak magnitude instantaneous dynamic base loads have been estimated, based on the 100-yr return period wind speed, as follows (for structural damping of 2.0% of critical):
Base Load at Basement Level Load
Component Landmark Tower East Residential
Tower West Residential
Tower
Fx [MN] 56.1 13.5 15.8 Fy [MN] 22.5 19.5 19.2
Mx [MNm] 4104.0 2644.2 2740.6 My [MNm] 11006.6 1806.4 2147.2 Mz [MNm] 511.9 208.1 257.2
The peak-combined accelerations, for a structural damping of 1.0% of critical at the uppermost occupied level of each of the towers has been determined to provide a thorough guide as to the occupant comfort in response to wind loading:
Landmark Tower
0
5
10
15
20
25
30
35
0.01 0.1 1 10 100
Return Period [years]
Pea
k Ac
cele
ratio
n [m
illi-g
]
Keangnam Hanoi Landmark Tower 1.00n, L69, 0.8% DampingKeangnam Hanoi Landmark Tower 1.00n, L69, 1.0% DampingKeangnam Hanoi Landmark Tower 1.00n, L69, 2.0% DampingNBCC OfficeNBCC ResidentialISO 6879Melbourne & CheungDavenport PerceptionDavenport Objection
2% Objection
10% Objection
2% Perception
10% Perception

BMT Fluid Mechanics Limited COMMERCIAL - IN - CONFIDENCE
43860/00 Report 3 Rel.2 7 of 97 43860rep3v2.doc
East Residential Tower
0
5
10
15
20
25
30
35
0.01 0.1 1 10 100
Return Period [years]
Peak
Acc
eler
atio
n [m
illi-g
]
Keangnam Hanoi East Residential Tower 1.00n, L49, 0.8% DampingKeangnam Hanoi East Residential Tower 1.00n, L49, 1.0% DampingKeangnam Hanoi East Residential Tower 1.00n, L49, 2.0% DampingNBCC OfficeNBCC ResidentialISO 6879Melbourne & CheungDavenport PerceptionDavenport Objection
2% Objection
10% Objection
2% Perception
10% Perception
West Residential Tower
0
5
10
15
20
25
30
35
0.01 0.1 1 10 100
Return Period [years]
Pea
k A
ccel
erat
ion
[mill
i-g]
Keangnam Hanoi West Residential Tower 1.00n, L49, 0.8% DampingKeangnam Hanoi West Residential Tower 1.00n, L49, 1.0% DampingKeangnam Hanoi West Residential Tower 1.00n, L49, 2.0% DampingNBCC OfficeNBCC ResidentialISO 6879Melbourne & CheungDavenport PerceptionDavenport Objection
2% Objection
10% Objection
2% Perception
10% Perception

BMT Fluid Mechanics Limited COMMERCIAL - IN - CONFIDENCE
43860/00 Report 3 Rel.2 8 of 97 43860rep3v2.doc
The wind-induced accelerations of the Landmark and the East Residential Tower do not exceed the frequency dependant criteria such as ISO 6879 and Melbourne and Cheung for occupant comfort for the 1-, 5- and 10-year return periods and for a structural damping level of 1% of critical, whilst the wind-induced accelerations for the West Residential Tower are generally equivalent with the frequency dependant Melbourne and Cheung for occupant comfort for the 10-year return period and for a structural damping of 1% of critical.

BMT Fluid Mechanics Limited COMMERCIAL - IN - CONFIDENCE
43860/00 Report 3 Rel.2 9 of 97 43860rep3v2.doc
Keangnam Hanoi Landmark Tower Complex
Hanoi, Vietnam
Wind Tunnel Testing
Overall Wind Loading Studies
1. Introduction
1.1. Background
This report summarises the results of a programme of boundary layer wind tunnel studies commissioned by ARUP Hong Kong (ARUP) on behalf of Dong Yang Structural Engineers Group and conducted by BMT Fluid Mechanics Limited (BMT) to assess the wind effects relevant to the structural and serviceability design of the proposed towers of the Keangnam Hanoi Landmark Tower complex in Hanoi, Vietnam.
1.2. Site / Building Details
1.2.1. Location / Surrounding Area
An aerial view of the proposed site is shown in Figure 1.1. The site is situated in Hanoi, Vietnam. The immediate area surrounding the site is typically an urban/suburban environment. Further from the site (approximately 30km north and 30km west) is the beginning of a build-up of mountainous terrain covering the north-western and south-western sector of the site. Approximately 105km southeast is the Gulf of Tonkin covering the eastern and south-eastern sector.

BMT Fluid Mechanics Limited COMMERCIAL - IN - CONFIDENCE
43860/00 Report 3 Rel.2 10 of 97 43860rep3v2.doc
1.2.2. Proposed Development
The proposed development consists of the Landmark tower approximately 340m in height, and two residential towers in approximately 250m in height. A podium at the lower levels connects the three towers. The structural data provided by ARUP indicates that the three towers are not rigidly connected to the podium.
1.3. Requirements for Wind Studies
The main requirements specified by ARUP for the current studies are summarised as follows:
• Provide an assessment of the wind loading relevant to the design of the super-structure / foundations of the proposed tower
• Provide an assessment of the wind-induced building motions of the proposed tower in terms of its potential to cause occupant discomfort
1.4. Scope of Work
The scope of work agreed between ARUP and BMT for the wind tunnel study is as follows:
1.4.1. Model
• Design, construct and instrument a detailed 1:400 scale model of the proposed development suitable for conducting high-frequency force balance and high-frequency pressure integration boundary layer wind tunnel tests
1.4.2. Measurements / Analysis
• Conduct a boundary layer wind tunnel study to measure the fluctuating wind base loads of the proposed Landmark Tower for a full range of wind directions in a minimum of 10° increments (36 wind directions)
• Conduct a boundary layer wind tunnel study to simultaneously measure the external fluctuating wind pressures on the facades of the proposed Residential Towers for a full range of wind directions in a minimum of 10° increments (36 wind directions)
• Analyse the measured fluctuating wind base loads acting on the Landmark Tower to determine the peak wind loads including static and dynamic effects based on the structural properties of the tower, for the

BMT Fluid Mechanics Limited COMMERCIAL - IN - CONFIDENCE
43860/00 Report 3 Rel.2 11 of 97 43860rep3v2.doc
design of the primary structure and foundations (peak base loads and corresponding floor-by-floor loads)
• Analyse the simultaneously measured wind external pressure time histories acting on the Residential Towers to determine the peak wind loads including static and dynamic effects based on the structural properties of the tower, for the design of the primary structure and foundations (peak base loads and corresponding floor-by-floor loads)
• Analyse the measured fluctuating wind base loads acting on the Lamdmark Tower to determine the wind-induced dynamic response in terms of peak accelerations for the assessment of occupant comfort at the highest occupied level
• Analyse the simultaneously measured external pressure time histories acting on the Residential Towers to determine the wind-induced dynamic response in terms of peak accelerations for the assessment of occupant comfort at the highest occupied level
1.4.3. Report
• Provide detailed technical and interpretative interim and final reports summarising the main results of the overall structural wind loads and dynamic response studies

BMT Fluid Mechanics Limited COMMERCIAL - IN - CONFIDENCE
43860/00 Report 3 Rel.2 12 of 97 43860rep3v2.doc
2. Methodology
2.1. Technical Standards
The technical standards pertaining to the execution of the relevant boundary layer wind tunnel tests are inline with the requirements of internationally recognised wind codes such as BS6399: Part 2 (1997) - Annex A, the current UK code of practice for the assessment of wind action on buildings, and the guidelines of the American Society of Civil Engineers (ASCE) Manual of Practice No.67 for Wind Tunnel Studies.
2.2. Details of Study
2.2.1. Design Wind Speeds
Details of the wind analysis conducted for the site to determine wind properties, including design wind speeds, are presented in Appendix A.
2.2.2. Wind Tunnel Model
Details of the model scale and construction, along with the wind tunnel set-up are included in Appendix B.
2.2.3. Measurement and Analysis
The technical details relating to the measurements of fluctuating pressure and base loads, on which this analysis is based, are summarised in Appendix C and D. This gives details of the instrumentation, the scaling parameters and analysis techniques that were used in the wind tunnel tests and in the analysis of overall wind loads.
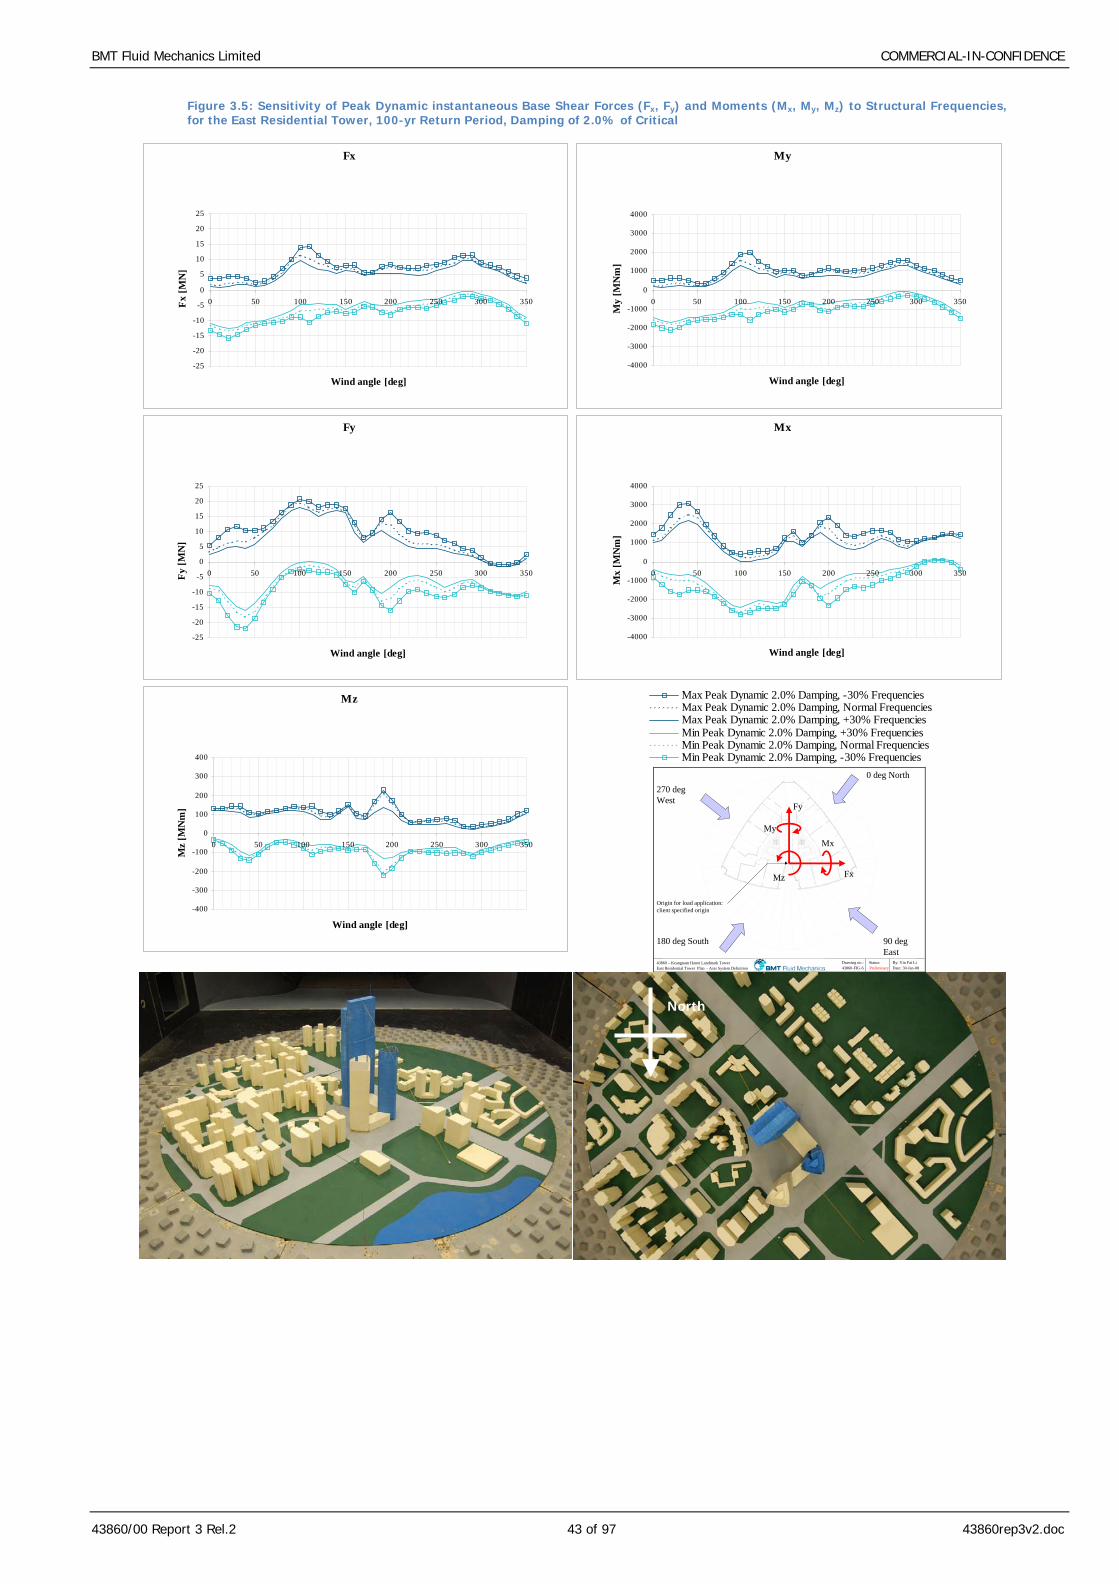
The present study investigate the effect of structural frequencies on the dynamic wind-induced loads and response of the towers by conducting a sensitivity analysis on the dynamic loads and peak accelerations of the tower to +/- 30% of the structural frequencies.
2.2.4. Building Properties
The calculations were based on structural/dynamic properties provided by ARUP, received on the 9th January 2008. The building properties relevant to the wind load analysis are summarised in Appendix E.

BMT Fluid Mechanics Limited COMMERCIAL - IN - CONFIDENCE
43860/00 Report 3 Rel.2 13 of 97 43860rep3v2.doc
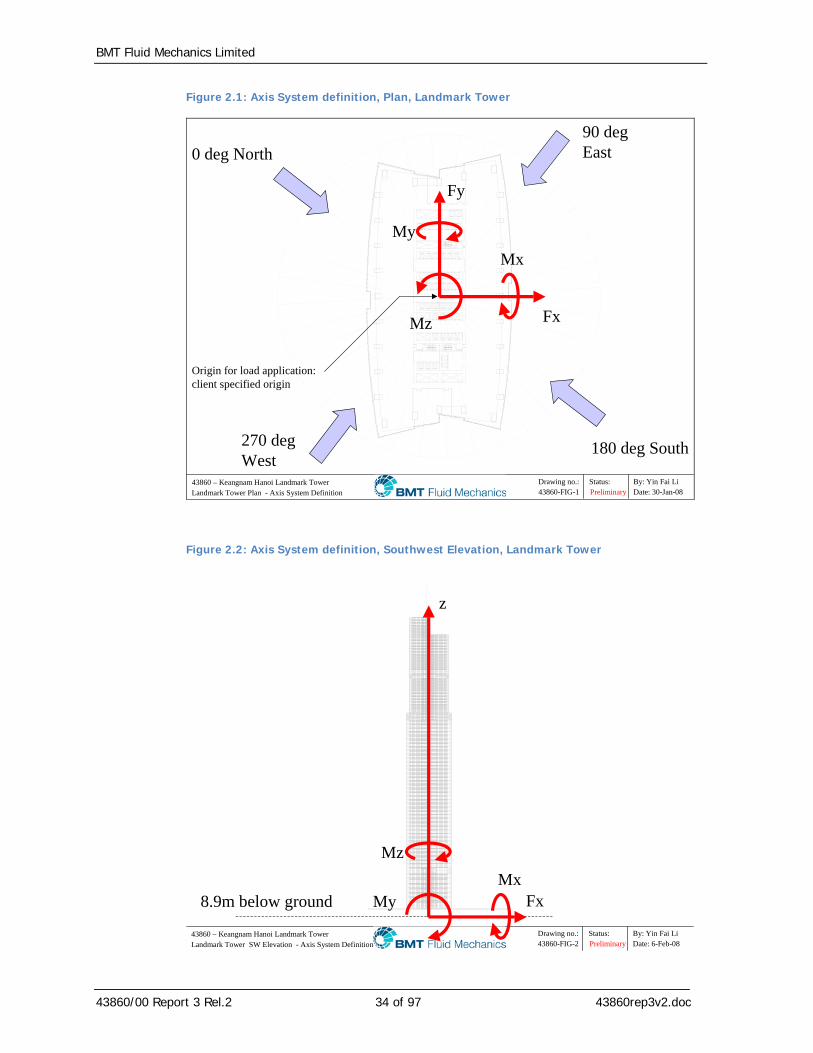
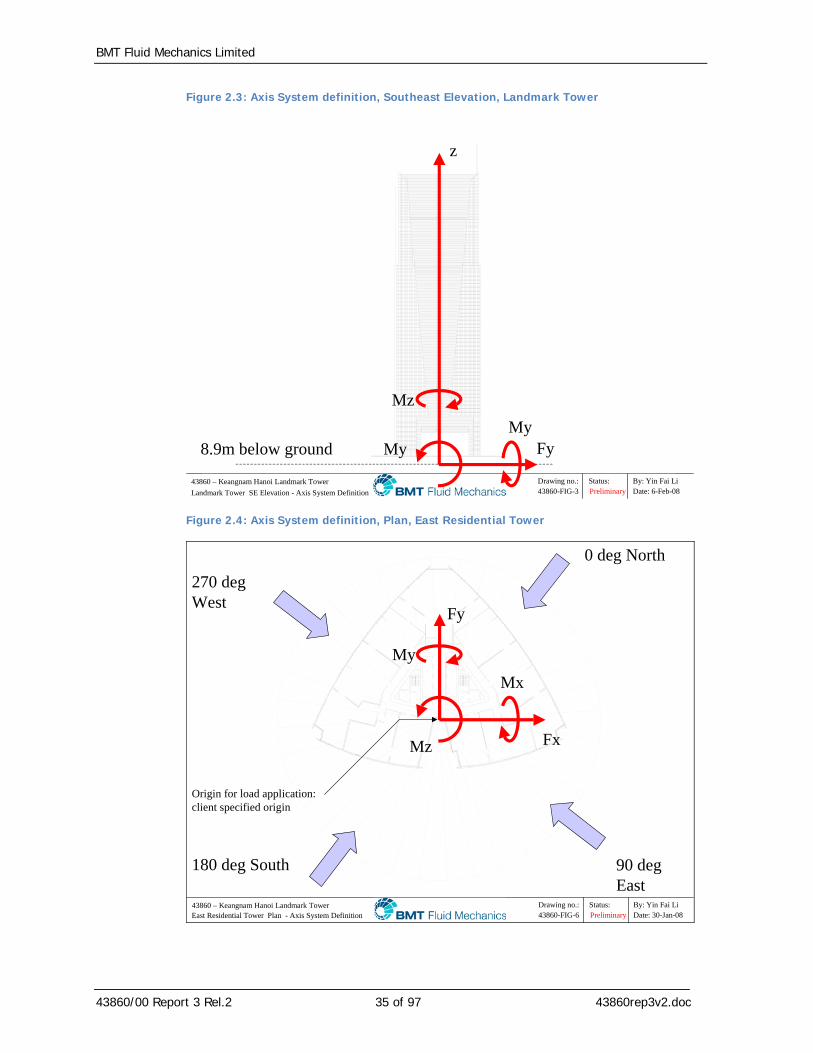
2.2.5. Force/Moment Axis System
Details of the axis systems used for the presentation of wind loading results for the proposed tower are given in Figure 2.1 to 2.9.
2.2.6. Definition of Wind Direction
The 0° wind direction has been chosen to coincide with the geographical North (90° east, 180° south, 270° west). It should be noted that the wind angle denotes the wind direction that the wind is blowing from (see Figures 2.1, 2.4 and 2.7).

BMT Fluid Mechanics Limited COMMERCIAL - IN - CONFIDENCE
43860/00 Report 3 Rel.2 14 of 97 43860rep3v2.doc
3. Results
3.1. Wind Loading
Structural wind loads have been calculated based on a 100-year return period basic wind speed of 27.2 m/s, with a structural damping of 2.0% of critical.
The base loads reported in the present study are specified at the local ground level.
3.1.1. Base Loads
Figures 3.1 to 3.3 show the variation of mean, peak static and peak dynamic instantaneous base shear forces (Fx, Fy) and moments (Mx, My, Mz) for the Landmark, East Residential, and West Residential Tower for the 100yr-return period wind speed with a structural damping of 2.0% of critical.
Figures 3.4 and 3.6 show the sensitivity peak dynamic instantaneous base shear forces (Fx, Fy) and moments (Mx, My, Mz) to +/-30% change in structural frequencies for the Landmark, East Residential, and West Residential Tower for the 100yr-return period wind speed with a structural damping of 2.0% of critical.
Table 3.1 provides the highest peak magnitudes of the dynamic base loads (Fx, Fy, Mx, My and Mz) for a structural damping of 2.0% of critical.
All loads stated are working loads and need to be applied in design in conjunction with the appropriate safety factors.
3.1.2. Floor-by-Floor Loads
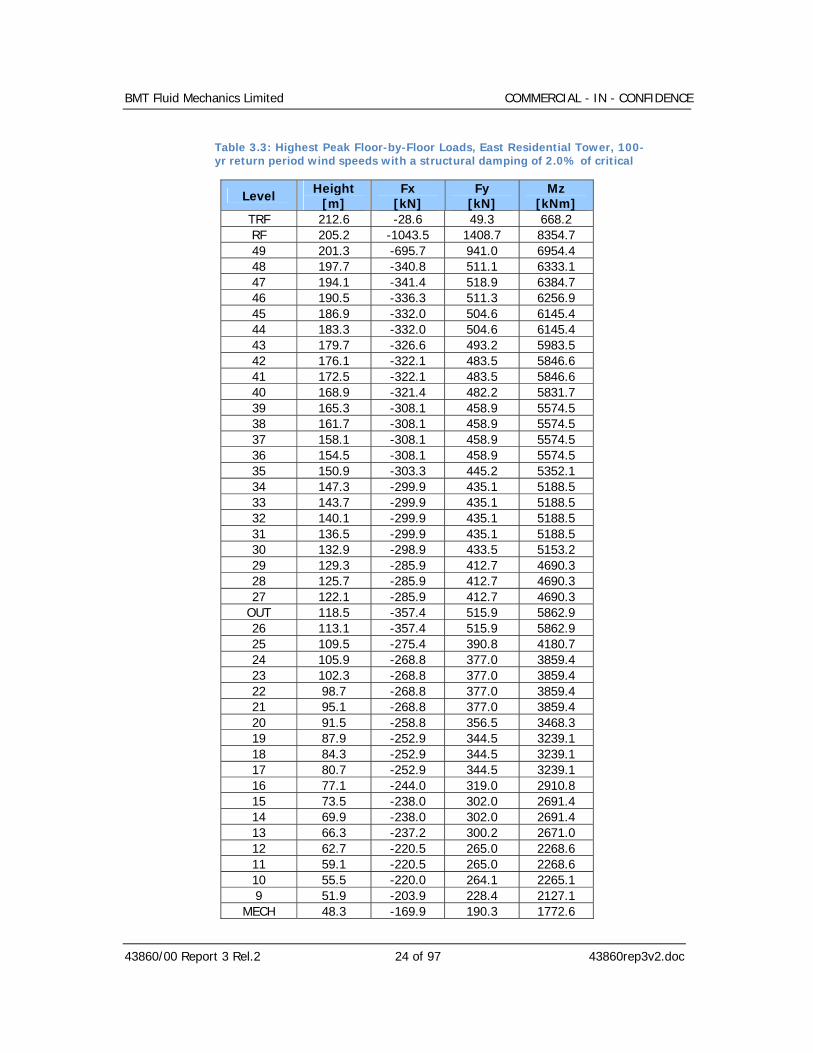
The highest peak floor-by-floor load distributions for Fx, Fy and Mz for the 100yr-return period wind speeds and a structural damping of 2.0% of critical for the Landmark, East Residential and West Residential Towers are presented in Table 3.2 to 3.4 respectively.
3.2. Building Accelerations
The methodology for deriving the buildings accelerations is provided in Appendix D.

BMT Fluid Mechanics Limited COMMERCIAL - IN - CONFIDENCE
43860/00 Report 3 Rel.2 15 of 97 43860rep3v2.doc
Structural damping levels of 0.8%, 1.0% and 2.0% of critical are used for the assessment of accelerations combined with the 1-, 5- and 10-yr return period wind speeds.
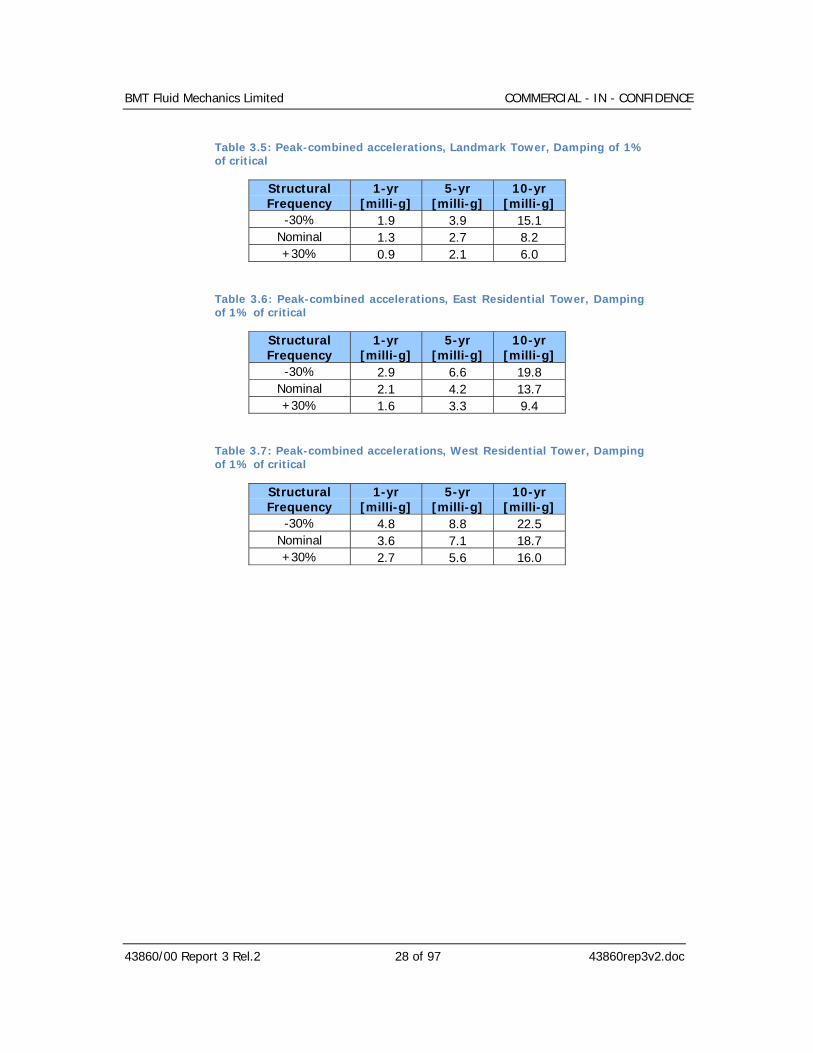
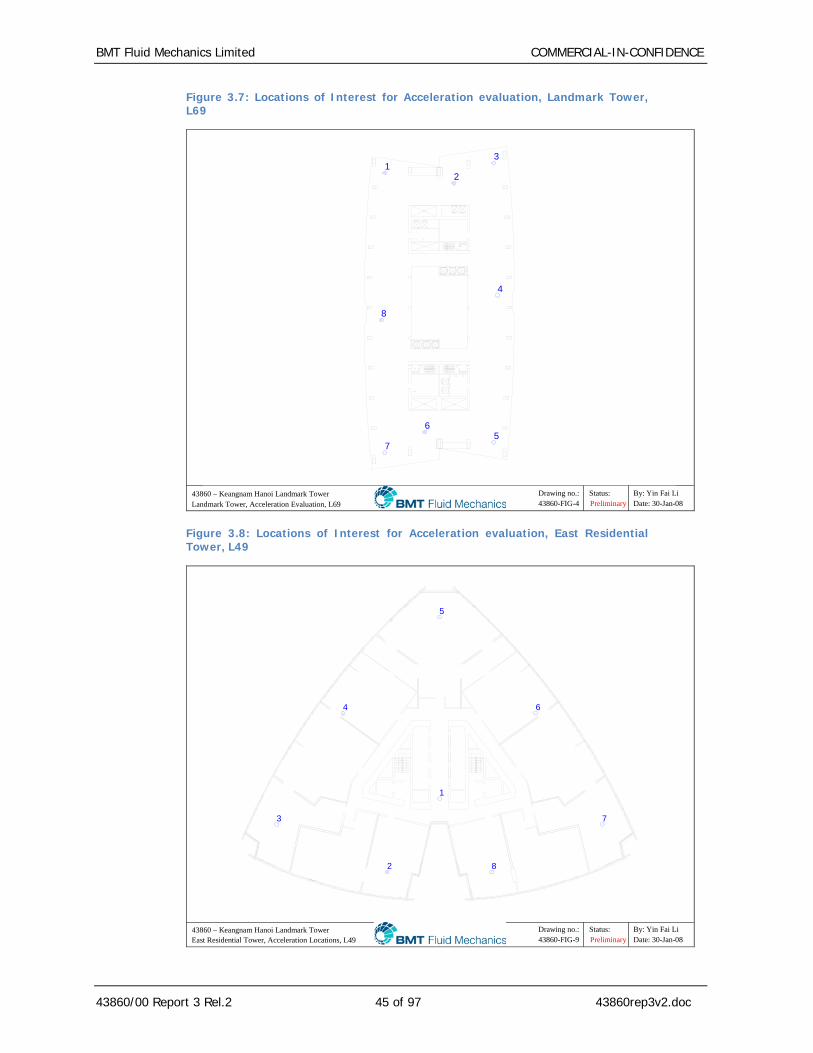
Figures 3.7 to 3.9 presents the locations of interest for all three towers for the serviceability study. Figures 3.10 to 3.12 show the variation of peak accelerations with wind direction for the 1-, 5- and 10-yr return period wind speeds for a structural damping level of 1.0% of critical for the most critical location for three towers considered. Tables 3.5 to 3.7 show the peak-combined accelerations of all three towers.

BMT Fluid Mechanics Limited COMMERCIAL - IN - CONFIDENCE
43860/00 Report 3 Rel.2 16 of 97 43860rep3v2.doc
4. Recommendations
4.1. Structural Design
4.1.1. Combination of Loads
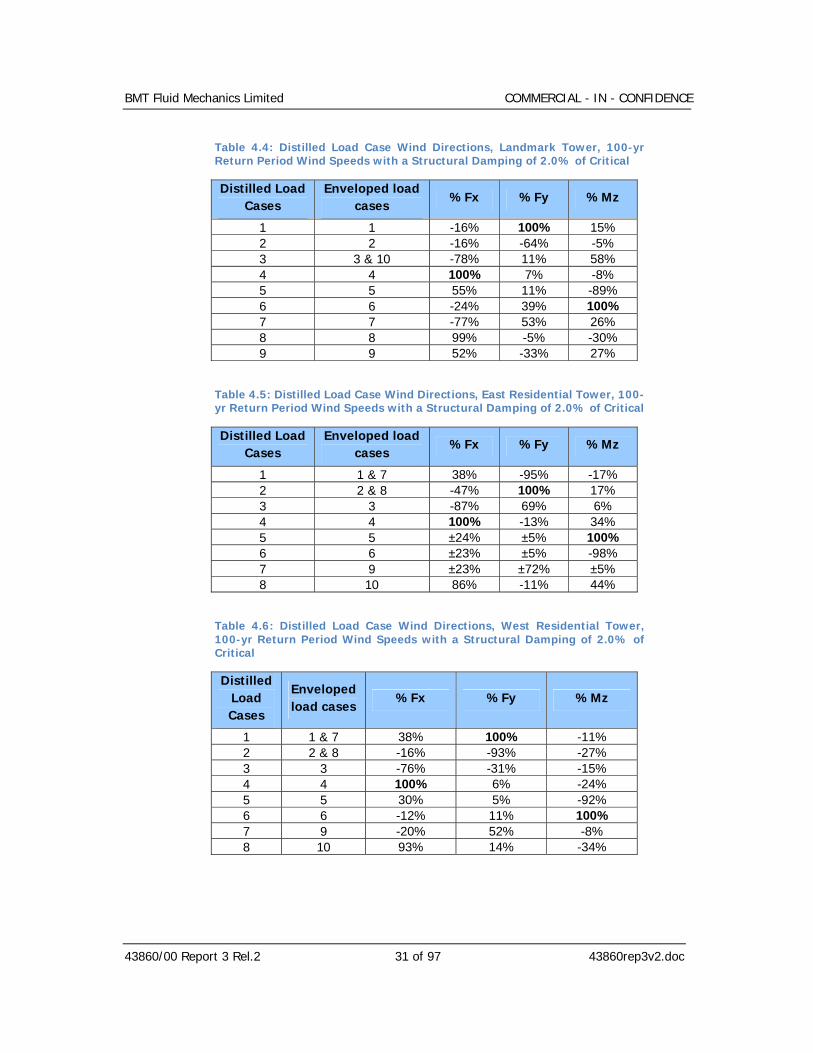
For the structural design of the proposed tower, it is recommended that the ten load cases described in Tables 4.1 to 4.3 are considered in order to account for the non-simultaneous action of the individual peak floor-by-floor load components with both time and wind direction. Tables 4.4 to 4.6 present distilled load envelope of the ten load cases and peak component proportions based on BMT inspection and calculation. Details of the methodology used to derive and apply the load cases and load envelopes are presented in Appendix E.
These load cases are consistent with contemporary sources such as the Australian Wind Code (AS1170-1989), Cenek & Wood (1990), the National Building Code of Canada (NRC-CNRC Users Guide - NBC 1995) and Xie et.al (1999). It should also be noted that the load cases are applicable to the floor-by-floor loads given in Tables 3.2 to 3.4.
4.1.2. Serviceability Design
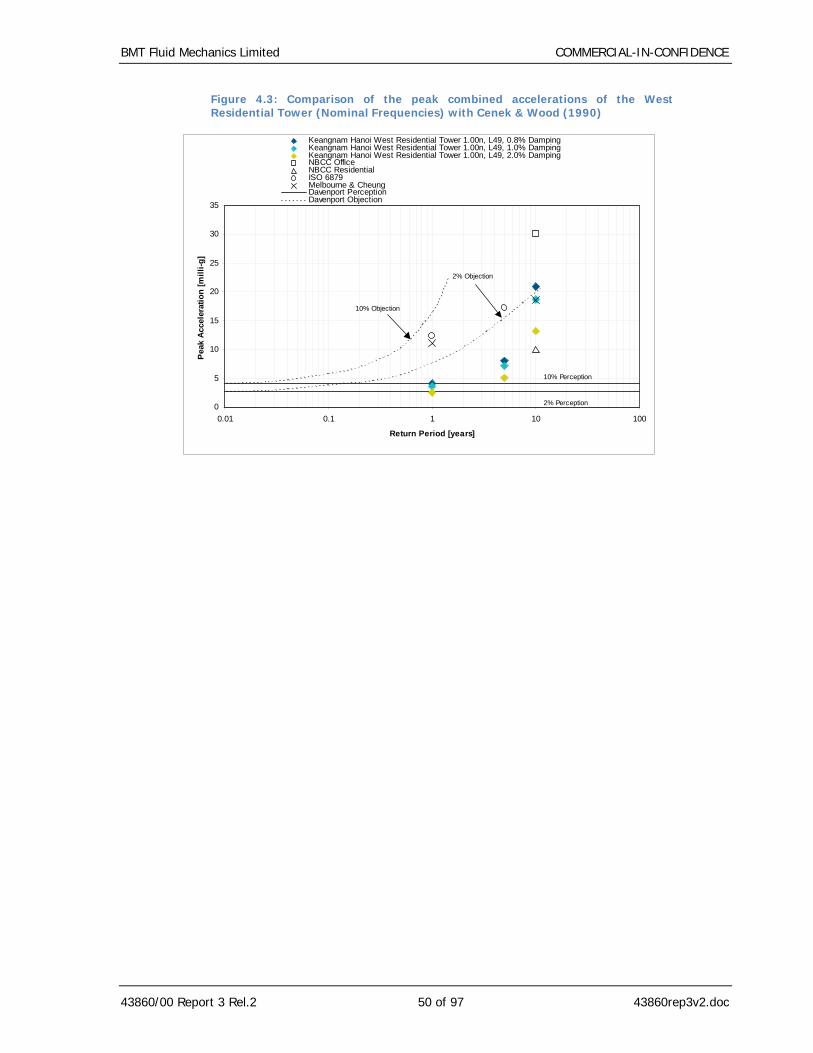
Comparison of the peak accelerations listed in Table 3.5 can be made with Figures 4.1 to 4.9, taken from Cenek & Wood (1990).
The wind-induced accelerations of the Landmark and the East Residential Tower do not exceed the frequency dependant criteria such as ISO 6879 and Melbourne and Cheung for occupant comfort for the 1-, 5- and 10-year return periods and for a structural damping level of 1% of critical, whilst the wind-induced accelerations for the West Residential Tower are generally equivalent with the frequency dependant Melbourne and Cheung for occupant comfort for the 10-year return period and for a structural damping of 1% of critical.

BMT Fluid Mechanics Limited COMMERCIAL - IN - CONFIDENCE
43860/00 Report 3 Rel.2 17 of 97 43860rep3v2.doc
5. Conclusion
The main conclusions of the study are presented below:
• Peak magnitude instantaneous dynamic base loads have been estimated, based on the 100-yr return period wind speeds, as follows (for a structural damping of 2.0% of critical):
Base Load at Basement Level Load
Component Landmark Tower East Residential
Tower West Residential
Tower
Fx [MN] 56.1 13.5 15.8 Fy [MN] 22.5 19.5 19.2
Mx [MNm] 4104.0 2644.2 2740.6 My [MNm] 11006.6 1806.4 2147.2 Mz [MNm] 511.9 208.1 257.2
• The peak-combined accelerations, for a structural damping of 1.0% of critical at the uppermost occupied floor of the three towers have been determined to provide a thorough guide as to the occupant comfort in response to wind loading:
Landmark Tower
0
5
10
15
20
25
30
35
0.01 0.1 1 10 100
Return Period [years]
Pea
k A
ccel
erat
ion
[mill
i-g]
Keangnam Hanoi Landmark Tower 1.00n, L69, 0.8% DampingKeangnam Hanoi Landmark Tower 1.00n, L69, 1.0% DampingKeangnam Hanoi Landmark Tower 1.00n, L69, 2.0% DampingNBCC OfficeNBCC ResidentialISO 6879Melbourne & CheungDavenport PerceptionDavenport Objection
2% Objection
10% Objection
2% Perception
10% Perception

BMT Fluid Mechanics Limited COMMERCIAL - IN - CONFIDENCE
43860/00 Report 3 Rel.2 18 of 97 43860rep3v2.doc
East Residential Tower
0
5
10
15
20
25
30
35
0.01 0.1 1 10 100
Return Period [years]
Pea
k A
ccel
erat
ion
[mill
i-g]
Keangnam Hanoi East Residential Tower 1.00n, L49, 0.8% DampingKeangnam Hanoi East Residential Tower 1.00n, L49, 1.0% DampingKeangnam Hanoi East Residential Tower 1.00n, L49, 2.0% DampingNBCC OfficeNBCC ResidentialISO 6879Melbourne & CheungDavenport PerceptionDavenport Objection
2% Objection
10% Objection
2% Perception
10% Perception
West Residential Tower
0
5
10
15
20
25
30
35
0.01 0.1 1 10 100
Return Period [years]
Pea
k A
ccel
erat
ion
[mill
i-g]
Keangnam Hanoi West Residential Tower 1.00n, L49, 0.8% DampingKeangnam Hanoi West Residential Tower 1.00n, L49, 1.0% DampingKeangnam Hanoi West Residential Tower 1.00n, L49, 2.0% DampingNBCC OfficeNBCC ResidentialISO 6879Melbourne & CheungDavenport PerceptionDavenport Objection
2% Objection
10% Objection
2% Perception
10% Perception
• The wind-induced accelerations of the Landmark and the East Residential Tower do not exceed the frequency dependant criteria such as ISO 6879 and Melbourne and Cheung for occupant comfort for the 1-, 5- and 10-year return periods and for a structural damping level of 1% of critical, whilst the wind-induced accelerations for the West Residential

BMT Fluid Mechanics Limited COMMERCIAL - IN - CONFIDENCE
43860/00 Report 3 Rel.2 19 of 97 43860rep3v2.doc
Tower are generally equivalent with the frequency dependant Melbourne and Cheung for occupant comfort for the 10-year return period and for a structural damping of 1% of critical.

BMT Fluid Mechanics Limited COMMERCIAL - IN - CONFIDENCE
43860/00 Report 3 Rel.2 20 of 97 43860rep3v2.doc
6. References
1. British Standard (BS6399: Part2: 1997) Loading for Buildings - Code of Practise for wind loads.
2. Cenek, P.D. & Wood, J.H., Designing Multi-Storey Buildings for Wind Effects, Building Research Association of New Zealand Report No. 25.
3. National Building Code of Canada, Users Guide NBC 1995, Part 4 Structural Commentaries, National Research Council Canada.
4. Xie, J., Irwin, P.A. and Accardo, M., (1999), “Wind load combinations for structural design of tall buildings”, 10th International Conference on Wind Engineering, Copenhagen, Denmark, 21-24 June, Tables.
5. VN Construction Standard, TCVN 2737:1995

BMT Fluid Mechanics Limited COMMERCIAL - IN - CONFIDENCE
43860/00 Report 3 Rel.2 21 of 97 43860rep3v2.doc
Tables
Table 3.1: Peak Magnitude Dynamic Base Loads at Basement level
Base Load at Basement Level Load
Component Landmark Tower East Residential
Tower West Residential
Tower
Fx [MN] 56.1 13.5 15.8 Fy [MN] 22.5 19.5 19.2
Mx [MNm] 4104.0 2644.2 2740.6 My [MNm] 11006.6 1806.4 2147.2 Mz [MNm] 511.9 208.1 257.2

BMT Fluid Mechanics Limited COMMERCIAL - IN - CONFIDENCE
43860/00 Report 3 Rel.2 22 of 97 43860rep3v2.doc
Table 3.2: Highest Peak Floor-by-Floor Loads, Landmark Tower, 100-yr return period wind speeds with a structural damping of 2.0% of critical
Level Height [m]
Fx [kN]
Fy [kN]
Mz [kNm]
L71 317 -4250.0 -1706.8 -34753.7 L70 311.6 -925.5 -320.5 -9463.6 L69 308.3 -773.4 -257.6 -8445.6 L68 305 -769.0 -256.2 -8433.7 L67 301.7 -764.7 -254.8 -8421.9 L66 298.4 -760.4 -253.4 -8410.1 L65 295.1 -756.2 -252.0 -8398.5 L64 291.8 -752.0 -250.6 -8386.9 L63 288.5 -747.9 -249.2 -8375.4 L62 285.2 -743.8 -247.9 -8364.0 L61 281.9 -885.1 -307.0 -9298.3 L60 276.5 -1092.4 -379.3 -10628.2 R2A 271.1 -990.1 -328.0 -10666.0 L59 267.8 -737.8 -245.9 -7594.8 L58 264.5 -733.8 -244.8 -7583.0 L57 261.2 -729.8 -243.6 -7571.3 L56 257.9 -726.9 -242.9 -7564.8 L55 254.6 -724.7 -242.5 -7561.7 L54 251.3 -722.6 -242.1 -7558.6 L53 248 -720.5 -241.8 -7555.6 L52 244.7 -718.5 -241.5 -7552.5 L51 241.4 -717.0 -241.5 -7550.4 L50 238.1 -715.6 -241.6 -7548.6 L49 234.8 -743.3 -247.2 -7913.5 L48 231.5 -1297.7 -472.7 -13923.1 R1A 223.5 -1402.0 -515.1 -15436.0 L47 219.2 -960.4 -357.6 -9983.0 L46 214.9 -953.9 -357.3 -9963.7 L45 210.6 -947.2 -357.0 -9944.7 L44 206.3 -937.7 -355.3 -9915.3 L43 202 -927.5 -353.4 -8664.8 L42 197.7 -917.1 -351.6 -8630.4 L41 193.4 -906.7 -349.7 -8596.5 L40 189.1 -896.1 -347.9 -8563.1 L39 184.8 -885.6 -346.1 -8530.6 L38 180.5 -879.3 -346.4 -8514.3 L37 176.2 -873.0 -346.7 -8498.2 L36 171.9 -866.8 -347.1 -8482.2 L35 167.6 -860.8 -347.6 -8466.3 L34 163.3 -855.0 -348.1 -7267.8 L33 159 -848.8 -348.4 -7247.6 L32 154.7 -840.8 -347.8 -7219.9 L31 150.4 -833.1 -347.2 -7192.5 L30 146.1 -825.5 -346.6 -7165.5 L29 141.8 -825.8 -347.3 -7350.8

BMT Fluid Mechanics Limited COMMERCIAL - IN - CONFIDENCE
43860/00 Report 3 Rel.2 23 of 97 43860rep3v2.doc
Level Height [m]
Fx [kN]
Fy [kN]
Mz [kNm]
L28 137.5 -824.9 -347.7 -7540.8 L27 133.2 -817.2 -347.2 -6269.0 L26 128.9 -810.2 -347.0 -6242.6 L25 124.6 -803.5 -346.7 -6216.6 L24 120.3 -797.2 -346.5 -6190.8 L23 116 -791.3 -346.3 -6165.3 L22 111.7 -785.8 -346.1 -6001.5 L21 107.4 -777.2 -344.3 -5964.8 L20 103.1 -766.5 -341.4 -4802.7 L19 98.8 -756.1 -338.5 -4749.3 L18 94.5 -745.9 -335.5 -4696.8 L17 90.2 -736.0 -332.5 -4645.3 L16 85.9 -726.4 -329.4 -4594.8 L15 81.6 -710.5 -323.4 -4522.6 L14 77.3 -692.9 -316.4 -4445.8 L13 73 -675.5 -309.4 -3464.2 L12 68.7 -658.4 -302.3 -3371.4 L11 64.4 -641.4 -295.2 -3280.9 L10 60.1 -624.6 -288.2 -3192.7 L9 55.8 -797.0 -368.6 -3964.9 L8 48.6 -785.9 -364.4 -3916.1 L7 43.5 -668.1 -310.3 -3505.8 L6 37.5 -214.5 -288.5 -2192.4 L5 32.4 -176.8 -239.3 -751.2 L4 27.3 -151.0 -205.5 -637.3 L3 22.2 -127.1 -173.9 -532.7 L2 17.1 -73.9 -101.1 -305.4
G/L1 9.9 -3.4 -2.1 -0.6
BMT Fluid Mechanics Limited COMMERCIAL - IN - CONFIDENCE
43860/00 Report 3 Rel.2 24 of 97 43860rep3v2.doc
Table 3.3: Highest Peak Floor-by-Floor Loads, East Residential Tower, 100-yr return period wind speeds with a structural damping of 2.0% of critical
Level Height [m]
Fx [kN]
Fy [kN]
Mz [kNm]
TRF 212.6 -28.6 49.3 668.2 RF 205.2 -1043.5 1408.7 8354.7 49 201.3 -695.7 941.0 6954.4 48 197.7 -340.8 511.1 6333.1 47 194.1 -341.4 518.9 6384.7 46 190.5 -336.3 511.3 6256.9 45 186.9 -332.0 504.6 6145.4 44 183.3 -332.0 504.6 6145.4 43 179.7 -326.6 493.2 5983.5 42 176.1 -322.1 483.5 5846.6 41 172.5 -322.1 483.5 5846.6 40 168.9 -321.4 482.2 5831.7 39 165.3 -308.1 458.9 5574.5 38 161.7 -308.1 458.9 5574.5 37 158.1 -308.1 458.9 5574.5 36 154.5 -308.1 458.9 5574.5 35 150.9 -303.3 445.2 5352.1 34 147.3 -299.9 435.1 5188.5 33 143.7 -299.9 435.1 5188.5 32 140.1 -299.9 435.1 5188.5 31 136.5 -299.9 435.1 5188.5 30 132.9 -298.9 433.5 5153.2 29 129.3 -285.9 412.7 4690.3 28 125.7 -285.9 412.7 4690.3 27 122.1 -285.9 412.7 4690.3
OUT 118.5 -357.4 515.9 5862.9 26 113.1 -357.4 515.9 5862.9 25 109.5 -275.4 390.8 4180.7 24 105.9 -268.8 377.0 3859.4 23 102.3 -268.8 377.0 3859.4 22 98.7 -268.8 377.0 3859.4 21 95.1 -268.8 377.0 3859.4 20 91.5 -258.8 356.5 3468.3 19 87.9 -252.9 344.5 3239.1 18 84.3 -252.9 344.5 3239.1 17 80.7 -252.9 344.5 3239.1 16 77.1 -244.0 319.0 2910.8 15 73.5 -238.0 302.0 2691.4 14 69.9 -238.0 302.0 2691.4 13 66.3 -237.2 300.2 2671.0 12 62.7 -220.5 265.0 2268.6 11 59.1 -220.5 265.0 2268.6 10 55.5 -220.0 264.1 2265.1 9 51.9 -203.9 228.4 2127.1
MECH 48.3 -169.9 190.3 1772.6

BMT Fluid Mechanics Limited COMMERCIAL - IN - CONFIDENCE
43860/00 Report 3 Rel.2 25 of 97 43860rep3v2.doc
Level Height [m]
Fx [kN]
Fy [kN]
Mz [kNm]
8 45.9 -195.0 218.5 2031.8 7 41.4 -211.8 239.2 1898.8 6 36.9 -211.8 239.2 1898.8 5 32.4 -108.7 175.2 1521.5 4 27.9 -95.0 166.4 1416.0 3 23.4 -91.8 161.8 972.5 2 18.9 -93.3 161.4 958.6
1M 14.4 -106.9 157.8 833.6 1 9.9 -53.4 78.9 416.8

BMT Fluid Mechanics Limited COMMERCIAL - IN - CONFIDENCE
43860/00 Report 3 Rel.2 26 of 97 43860rep3v2.doc
Table 3.4: Highest Peak Floor-by-Floor Loads, West Residential Tower, 100-yr return period wind speeds with a structural damping of 2.0% of critical
Level Height [m]
Fx [kN]
Fy [kN]
Mz [kNm]
TRF 212.6 -58.9 -81.8 -776.1 RF 205.2 -1231.1 -1417.5 -11746.8 49 201.3 -791.8 -955.5 -9359.4 48 197.7 -444.5 -606.3 -7527.8 47 194.1 -446.9 -600.2 -7487.0 46 190.5 -435.7 -589.0 -7559.0 45 186.9 -425.9 -579.2 -7621.8 44 183.3 -425.9 -579.2 -7621.8 43 179.7 -408.2 -549.3 -7558.6 42 176.1 -393.2 -523.9 -7505.1 41 172.5 -393.2 -523.9 -7505.1 40 168.9 -392.3 -522.6 -7483.2 39 165.3 -376.4 -500.3 -7103.3 38 161.7 -376.4 -500.3 -7103.3 37 158.1 -376.4 -500.3 -7103.3 36 154.5 -376.4 -500.3 -7103.3 35 150.9 -360.1 -477.4 -6837.5 34 147.3 -348.1 -460.6 -6642.1 33 143.7 -348.1 -460.6 -6642.1 32 140.1 -348.1 -460.6 -6642.1 31 136.5 -348.1 -460.6 -6642.1 30 132.9 -346.5 -458.3 -6587.9 29 129.3 -326.6 -428.2 -5879.2 28 125.7 -326.6 -428.2 -5879.2 27 122.1 -326.6 -428.2 -5879.2
OUT 118.5 -408.2 -535.2 -7349.0 26 113.1 -408.2 -535.2 -7349.0 25 109.5 -305.7 -402.6 -5263.0 24 105.9 -292.6 -386.4 -4874.3 23 102.3 -292.6 -386.4 -4874.3 22 98.7 -292.6 -386.4 -4874.3 21 95.1 -292.6 -386.4 -4874.3 20 91.5 -273.2 -361.5 -4375.8 19 87.9 -261.8 -346.9 -4083.6 18 84.3 -261.8 -346.9 -4083.6 17 80.7 -261.8 -346.9 -4083.6 16 77.1 -242.8 -323.5 -3703.8 15 73.5 -230.1 -307.8 -3450.1 14 69.9 -230.1 -307.8 -3450.1 13 66.3 -228.7 -306.1 -3425.7 12 62.7 -201.1 -272.1 -2944.6 11 59.1 -201.1 -272.1 -2944.6 10 55.5 -200.8 -271.2 -2939.6 9 51.9 -189.1 -236.0 -2741.2
MECH 48.3 -157.6 -196.6 -2284.3

BMT Fluid Mechanics Limited COMMERCIAL - IN - CONFIDENCE
43860/00 Report 3 Rel.2 27 of 97 43860rep3v2.doc
Level Height [m]
Fx [kN]
Fy [kN]
Mz [kNm]
8 45.9 -180.7 -224.2 -2616.6 7 41.4 -181.2 -76.0 -2257.3 6 36.9 -181.2 -76.0 -2257.3 5 32.4 -148.1 -19.5 -1906.3 4 27.9 -142.2 -10.9 -1771.5 3 23.4 -128.7 -0.8 -1073.1 2 18.9 -126.6 -0.3 -1019.8
1M 14.4 -107.4 3.9 -540.6 1 9.9 -53.7 2.0 -270.3
BMT Fluid Mechanics Limited COMMERCIAL - IN - CONFIDENCE
43860/00 Report 3 Rel.2 28 of 97 43860rep3v2.doc
Table 3.5: Peak-combined accelerations, Landmark Tower, Damping of 1% of critical
Structural Frequency
1-yr [milli-g]
5-yr [milli-g]
10-yr [milli-g]
-30% 1.9 3.9 15.1 Nominal 1.3 2.7 8.2 +30% 0.9 2.1 6.0
Table 3.6: Peak-combined accelerations, East Residential Tower, Damping of 1% of critical
Structural Frequency
1-yr [milli-g]
5-yr [milli-g]
10-yr [milli-g]
-30% 2.9 6.6 19.8 Nominal 2.1 4.2 13.7 +30% 1.6 3.3 9.4
Table 3.7: Peak-combined accelerations, West Residential Tower, Damping of 1% of critical
Structural Frequency
1-yr [milli-g]
5-yr [milli-g]
10-yr [milli-g]
-30% 4.8 8.8 22.5 Nominal 3.6 7.1 18.7 +30% 2.7 5.6 16.0

BMT Fluid Mechanics Limited COMMERCIAL - IN - CONFIDENCE
43860/00 Report 3 Rel.2 29 of 97 43860rep3v2.doc
Table 4.1: Load Case Wind Directions, Landmark Tower, 100-yr Return Period Wind Speeds with a Structural Damping of 2.0% of Critical
Enveloped Load Cases
Description Wind
Direction [deg]
1 Peak positive Mx 30 2 Peak negative Mx 250 3 Peak positive My 350 4 Peak negative My 150 5 Peak positive Mz 110 6 Peak negative Mz 40 7 Peak Shear (first quadrant- 0-90deg) 30 8 Peak Shear (second quadrant- 90-180deg) 140 9 Peak Shear (third quadrant- 180-270deg) 180 10 Peak Shear (fourth quadrant- 270-360deg) 350
Table 4.2: Load Case Wind Directions, East Residential Tower, 100-yr Return Period Wind Speeds with a Structural Damping of 2.0% of Critical
Enveloped Load Cases
Description Wind
Direction [deg]
1 Peak positive Mx 40 2 Peak negative Mx 100 3 Peak positive My 100 4 Peak negative My 20 5 Peak positive Mz 190 6 Peak negative Mz 190 7 Peak Shear (first quadrant- 0-90deg) 40 8 Peak Shear (second quadrant- 90-180deg) 100 9 Peak Shear (third quadrant- 180-270deg) 190 10 Peak Shear (fourth quadrant- 270-360deg) 0

BMT Fluid Mechanics Limited COMMERCIAL - IN - CONFIDENCE
43860/00 Report 3 Rel.2 30 of 97 43860rep3v2.doc
Table 4.3: Load Case Wind Directions, West Residential Tower, 100-yr Return Period Wind Speeds with a Structural Damping of 2.0% of Critical
Enveloped Load Cases
Description Wind
Direction [deg]
1 Peak positive Mx 30 2 Peak negative Mx 90 3 Peak positive My 90 4 Peak negative My 50 5 Peak positive Mz 140 6 Peak negative Mz 140 7 Peak Shear (first quadrant- 0-90deg) 30 8 Peak Shear (second quadrant- 90-180deg) 90 9 Peak Shear (third quadrant- 180-270deg) 250 10 Peak Shear (fourth quadrant- 270-360deg) 0
BMT Fluid Mechanics Limited COMMERCIAL - IN - CONFIDENCE
43860/00 Report 3 Rel.2 31 of 97 43860rep3v2.doc
Table 4.4: Distilled Load Case Wind Directions, Landmark Tower, 100-yr Return Period Wind Speeds with a Structural Damping of 2.0% of Critical
Distilled Load Cases
Enveloped load cases
%Fx %Fy %Mz
1 1 -16% 100% 15% 2 2 -16% -64% -5% 3 3 & 10 -78% 11% 58% 4 4 100% 7% -8% 5 5 55% 11% -89% 6 6 -24% 39% 100% 7 7 -77% 53% 26% 8 8 99% -5% -30% 9 9 52% -33% 27%
Table 4.5: Distilled Load Case Wind Directions, East Residential Tower, 100-yr Return Period Wind Speeds with a Structural Damping of 2.0% of Critical
Distilled Load Cases
Enveloped load cases
%Fx %Fy %Mz
1 1 & 7 38% -95% -17% 2 2 & 8 -47% 100% 17% 3 3 -87% 69% 6% 4 4 100% -13% 34% 5 5 ±24% ±5% 100% 6 6 ±23% ±5% -98% 7 9 ±23% ±72% ±5% 8 10 86% -11% 44%
Table 4.6: Distilled Load Case Wind Directions, West Residential Tower, 100-yr Return Period Wind Speeds with a Structural Damping of 2.0% of Critical
Distilled Load Cases
Enveloped load cases
%Fx %Fy %Mz
1 1 & 7 38% 100% -11% 2 2 & 8 -16% -93% -27% 3 3 -76% -31% -15% 4 4 100% 6% -24% 5 5 30% 5% -92% 6 6 -12% 11% 100% 7 9 -20% 52% -8% 8 10 93% 14% -34%

BMT Fluid Mechanics Limited COMMERCIAL-IN-CONFIDENCE
43860/00 Report 3 Rel.2 32 of 97 43860rep3v2.doc
Figures
Figure 1.1: Aerial View of the Proposed Development Site
43860 Keangnam Hanoi Landmark TowerProposed Site
Drawing No.43860/WE/001
Status :Preliminary
Prep : S PatelDate : 01 February 2008
Proposed Development Site
NorthNorth
North
Proposed Site
North
Proposed Development

BMT Fluid Mechanics Limited COMMERCIAL-IN-CONFIDENCE
43860/00 Report 3 Rel.2 33 of 97 43860rep3v2.doc
Figure 1.2: Architect’s View of the Proposed Development
Image courtesy of Heerim Architects and Planners Co.
BMT Fluid Mechanics Limited
43860/00 Report 3 Rel.2 34 of 97 43860rep3v2.doc
Figure 2.1: Axis System definition, Plan, Landmark Tower
By: Yin Fai LiDate: 30-Jan-08
Status:Preliminary
Drawing no.:43860-FIG-1
43860 – Keangnam Hanoi Landmark Tower
0 deg North
180 deg South
90 degEast
270 degWest
Landmark Tower Plan - Axis System Definition
Fx
Fy
Mz
MyMx
Origin for load application: client specified origin
Figure 2.2: Axis System definition, Southwest Elevation, Landmark Tower
By: Yin Fai LiDate: 6-Feb-08
Status:Preliminary
Drawing no.:43860-FIG-2
43860 – Keangnam Hanoi Landmark TowerLandmark Tower SW Elevation - Axis System Definition
Fx
z
My
MzMx
8.9m below ground
BMT Fluid Mechanics Limited
43860/00 Report 3 Rel.2 35 of 97 43860rep3v2.doc
Figure 2.3: Axis System definition, Southeast Elevation, Landmark Tower
By: Yin Fai LiDate: 6-Feb-08
Status:Preliminary
Drawing no.:43860-FIG-3
43860 – Keangnam Hanoi Landmark TowerLandmark Tower SE Elevation - Axis System Definition
Fy
z
My
MzMy
8.9m below ground
Figure 2.4: Axis System definition, Plan, East Residential Tower
By: Yin Fai LiDate: 30-Jan-08
Status:Preliminary
Drawing no.:43860-FIG-6
43860 – Keangnam Hanoi Landmark Tower
0 deg North
180 deg South 90 degEast
270 degWest
Fx
Fy
Mz
My
Mx
Origin for load application: client specified origin
East Residential Tower Plan - Axis System Definition

BMT Fluid Mechanics Limited
43860/00 Report 3 Rel.2 36 of 97 43860rep3v2.doc
Figure 2.5: Axis System definition, Southeast Elevation, East Residential Tower
By: Yin Fai LiDate: 6-Feb-08
Status:Preliminary
Drawing no.:43860-FIG-7
43860 – Keangnam Hanoi Landmark Tower
Fx
z
My
MzMx
8.9m below ground
East Residential Tower SE Elevation - Axis System Definition
Figure 2.6: Axis System definition, Northeast Elevation, East Residential Tower
By: Yin Fai LiDate: 6-Feb-08
Status:Preliminary
Drawing no.:43860-FIG-8
43860 – Keangnam Hanoi Landmark Tower
Fy
z
My
MzMy
8.9m below ground
East Residential Tower NE Elevation - Axis System Definition

BMT Fluid Mechanics Limited
43860/00 Report 3 Rel.2 37 of 97 43860rep3v2.doc
Figure 2.7: Axis System definition, Plan, West Residential Tower
By: Yin Fai LiDate: 30-Jan-08
Status:Preliminary
Drawing no.:43860-FIG-11
43860 – Keangnam Hanoi Landmark Tower
0 deg North
180 deg South 90 degEast
270 degWest
Fx
Fy
Mz
MyMx
Origin for load application: client specified origin
West Residential Tower Plan - Axis System Definition
Figure 2.8: Axis System definition, Southeast Elevation, West Residential Tower
By: Yin Fai LiDate: 6-Feb-08
Status:Preliminary
Drawing no.:43860-FIG-12
43860 – Keangnam Hanoi Landmark Tower
Fx
z
My
MzMx
8.9m below ground
West Residential Tower SE Elevation - Axis System Definition

BMT Fluid Mechanics Limited
43860/00 Report 3 Rel.2 38 of 97 43860rep3v2.doc
Figure 2.9: Axis System definition, Northeast Elevation, West Residential Tower
By: Yin Fai LiDate: 6-Feb-08
Status:Preliminary
Drawing no.:43860-FIG-13
43860 – Keangnam Hanoi Landmark Tower
Fy
z
My
MzMy
8.9m below ground
West Residential Tower NE Elevation - Axis System Definition

BMT Fluid Mechanics Limited COMMERCIAL-IN-CONFIDENCE
43860/00 Report 3 Rel.2 39 of 97 43860rep3v2.doc
Figure 3.1: Variation of Mean, Peak Static and Peak Dynamic instantaneous Base Shear Forces (Fx, Fy) and Moments (Mx, My, Mz) for the Landmark Tower, 100-yr Return Period, Damping of 2.0% of Critical
Fx
-80
-60
-40
-20
0
20
40
60
80
0 50 100 150 200 250 300 350
Wind angle [deg]
Fx [M
N]
My
-15000
-10000
-5000
0
5000
10000
15000
0 50 100 150 200 250 300 350
Wind angle [deg]
My
[MN
·m]
Fy
-80
-60
-40
-20
0
20
40
60
80
0 50 100 150 200 250 300 350
Wind angle [deg]
Fy [M
N]
Mx
-15000
-10000
-5000
0
5000
10000
15000
0 50 100 150 200 250 300 350
Wind angle [deg]
Mx
[MN
·m]
Mz
-800
-600
-400
-200
0
200
400
600
800
0 50 100 150 200 250 300 350
Wind angle [deg]
Mz
[MN
·m]
-1 00000
1 0000
0 5 0 1 00 1 5 0 2 00 2 5 0 3 00 3 5 0
Win d a n g le [d e g ]
Mean Min Peak StaticMax Peak Static Min Peak Dynamic 2.0% DampingMax Peak Dynamic 2.0% Damping
By: Yin Fai LiDate: 30-Jan-08
Status:Preliminary
Drawing no.:43860-FIG-1
43860 – Keangnam Hanoi Landmark Tower
0 deg North
180 deg South
90 degEast
270 degWest
Landmark Tower Plan - Axis System Definition
Fx
Fy
Mz
My
Mx
Origin for load application: client specified origin
North

BMT Fluid Mechanics Limited COMMERCIAL-IN-CONFIDENCE
43860/00 Report 3 Rel.2 40 of 97 43860rep3v2.doc
Figure 3.2: Variation of Mean, Peak Static and Peak Dynamic instantaneous Base Shear Forces (Fx, Fy) and Moments (Mx, My, Mz) for the East Residential Tower, 100-yr Return Period, Damping of 2.0% of Critical
Fx
-25
-20
-15
-10
-5
0
5
10
15
20
25
0 50 100 150 200 250 300 350
Wind angle [deg]
Fx [M
N]
My
-3000
-2000
-1000
0
1000
2000
3000
0 50 100 150 200 250 300 350
Wind angle [deg]
My
[MN
·m]
Fy
-25
-20
-15
-10
-5
0
5
10
15
20
25
0 50 100 150 200 250 300 350
Wind angle [deg]
Fy [M
N]
Mx
-3000
-2000
-1000
0
1000
2000
3000
0 50 100 150 200 250 300 350
Wind angle [deg]
Mx
[MN
·m]
Mz
-400
-300
-200
-100
0
100
200
300
400
0 50 100 150 200 250 300 350
Wind angle [deg]
Mz
[MN
·m]
-1 00000
1 0000
0 5 0 1 00 1 5 0 2 00 2 5 0 3 00 3 5 0
Win d a n g le [d e g ]
Mean Min Peak StaticMax Peak Static Min Peak Dynamic 2.0% DampingMax Peak Dynamic 2.0% Damping
By: Yin Fai LiDate: 30-Jan-08
Status:Preliminary
Drawing no.:43860-FIG-6
43860 – Keangnam Hanoi Landmark Tower
0 deg North
180 deg South 90 degEast
270 degWest
Fx
Fy
Mz
My
Mx
Origin for load application: client specified origin
East Residential Tower Plan - Axis System Definition
North

BMT Fluid Mechanics Limited COMMERCIAL-IN-CONFIDENCE
43860/00 Report 3 Rel.2 41 of 97 43860rep3v2.doc
Figure 3.3: Variation of Mean, Peak Static and Peak Dynamic instantaneous Base Shear Forces (Fx, Fy) and Moments (Mx, My, Mz) for the West Residential Tower, 100-yr Return Period, Damping of 2.0% of Critical
Fx
-25
-20
-15
-10
-5
0
5
10
15
20
25
0 50 100 150 200 250 300 350
Wind angle [deg]
Fx [M
N]
My
-3000
-2000
-1000
0
1000
2000
3000
0 50 100 150 200 250 300 350
Wind angle [deg]
My
[MN
·m]
Fy
-25
-20
-15
-10
-5
0
5
10
15
20
25
0 50 100 150 200 250 300 350
Wind angle [deg]
Fy [M
N]
Mx
-3000
-2000
-1000
0
1000
2000
3000
0 50 100 150 200 250 300 350
Wind angle [deg]
Mx
[MN
·m]
Mz
-400
-300
-200
-100
0
100
200
300
400
0 50 100 150 200 250 300 350
Wind angle [deg]
Mz
[MN
·m]
-1 00000
1 0000
0 5 0 1 00 1 5 0 2 00 2 5 0 3 00 3 5 0
Win d a n g le [d e g ]
Mean Min Peak StaticMax Peak Static Min Peak Dynamic 2.0% DampingMax Peak Dynamic 2.0% Damping
By: Yin Fai LiDate: 30-Jan-08
Status:Preliminary
Drawing no.:43860-FIG-11
43860 – Keangnam Hanoi Landmark Tower
0 deg North
180 deg South 90 degEast
270 degWest
Fx
Fy
Mz
My
Mx
Origin for load application: client specified origin
West Residential Tower Plan - Axis System Definition
North

BMT Fluid Mechanics Limited COMMERCIAL-IN-CONFIDENCE
43860/00 Report 3 Rel.2 42 of 97 43860rep3v2.doc
Figure 3.4: Sensitivity of Peak Dynamic instantaneous Base Shear Forces (Fx, Fy) and Moments (Mx, My, Mz) to Structural Frequencies, for the Landmark Tower, 100-yr Return Period, Damping of 2.0% of Critical
Fx
-80
-60
-40
-20
0
20
40
60
80
0 50 100 150 200 250 300 350
Wind angle [deg]
Fx [M
N]
My
-15000
-10000
-5000
0
5000
10000
15000
0 50 100 150 200 250 300 350
Wind angle [deg]
My
[MN
m]
Fy
-80
-60
-40
-20
0
20
40
60
80
0 50 100 150 200 250 300 350
Wind angle [deg]
Fy [M
N]
Mx
-15000
-10000
-5000
0
5000
10000
15000
0 50 100 150 200 250 300 350
Wind angle [deg]
Mx
[MN
m]
Mz
-800
-600
-400
-200
0
200
400
600
800
0 50 100 150 200 250 300 350
Wind angle [deg]
Mz
[MN
m]
0
2
0 5 0 1 00 1 5 0 2 00 2 5 0 3 00 3 5 0
W in d a n g le [ d e g ]
Max Peak Dynamic 2.0% Damping, -30% FrequenciesMax Peak Dynamic 2.0% Damping, Normal FrequenciesMax Peak Dynamic 2.0% Damping, +30% FrequenciesMin Peak Dynamic 2.0% Damping, +30% FrequenciesMin Peak Dynamic 2.0% Damping, Normal FrequenciesMin Peak Dynamic 2.0% Damping, -30% Frequencies
By: Yin Fai LiDate: 30-Jan-08
Status:Preliminary
Drawing no.:43860-FIG-1
43860 – Keangnam Hanoi Landmark Tower
0 deg North
180 deg South
90 degEast
270 degWest
Landmark Tower Plan - Axis System Definition
Fx
Fy
Mz
MyMx
Origin for load application: client specified origin
North
BMT Fluid Mechanics Limited COMMERCIAL-IN-CONFIDENCE
43860/00 Report 3 Rel.2 43 of 97 43860rep3v2.doc
Figure 3.5: Sensitivity of Peak Dynamic instantaneous Base Shear Forces (Fx, Fy) and Moments (Mx, My, Mz) to Structural Frequencies, for the East Residential Tower, 100-yr Return Period, Damping of 2.0% of Critical
Fx
-25
-20
-15
-10
-5
0
5
10
15
20
25
0 50 100 150 200 250 300 350
Wind angle [deg]
Fx [M
N]
My
-4000
-3000
-2000
-1000
0
1000
2000
3000
4000
0 50 100 150 200 250 300 350
Wind angle [deg]
My
[MN
m]
Fy
-25
-20
-15
-10
-5
0
5
10
15
20
25
0 50 100 150 200 250 300 350
Wind angle [deg]
Fy [M
N]
Mx
-4000
-3000
-2000
-1000
0
1000
2000
3000
4000
0 50 100 150 200 250 300 350
Wind angle [deg]
Mx
[MN
m]
Mz
-400
-300
-200
-100
0
100
200
300
400
0 50 100 150 200 250 300 350
Wind angle [deg]
Mz
[MN
m]
0
2
0 5 0 1 00 1 5 0 2 00 2 5 0 3 00 3 5 0
W in d a n g le [ d e g ]
Max Peak Dynamic 2.0% Damping, -30% FrequenciesMax Peak Dynamic 2.0% Damping, Normal FrequenciesMax Peak Dynamic 2.0% Damping, +30% FrequenciesMin Peak Dynamic 2.0% Damping, +30% FrequenciesMin Peak Dynamic 2.0% Damping, Normal FrequenciesMin Peak Dynamic 2.0% Damping, -30% Frequencies
By: Yin Fai LiDate: 30-Jan-08
Status:Preliminary
Drawing no.:43860-FIG-6
43860 – Keangnam Hanoi Landmark Tower
0 deg North
180 deg South 90 degEast
270 degWest
Fx
Fy
Mz
MyMx
Origin for load application: client specified origin
East Residential Tower Plan - Axis System Definition
North

BMT Fluid Mechanics Limited COMMERCIAL-IN-CONFIDENCE
43860/00 Report 3 Rel.2 44 of 97 43860rep3v2.doc
Figure 3.6: Sensitivity of Peak Dynamic instantaneous Base Shear Forces (Fx, Fy) and Moments (Mx, My, Mz) to Structural Frequencies, for the West Residential Tower, 100-yr Return Period, Damping of 2.0% of Critical
Fx
-25
-20
-15
-10
-5
0
5
10
15
20
25
0 50 100 150 200 250 300 350
Wind angle [deg]
Fx [M
N]
My
-4000
-3000
-2000
-1000
0
1000
2000
3000
4000
0 50 100 150 200 250 300 350
Wind angle [deg]
My
[MN
m]
Fy
-25
-20
-15
-10
-5
0
5
10
15
20
25
0 50 100 150 200 250 300 350
Wind angle [deg]
Fy [M
N]
Mx
-4000
-3000
-2000
-1000
0
1000
2000
3000
4000
0 50 100 150 200 250 300 350
Wind angle [deg]
Mx
[MN
m]
Mz
-400
-300
-200
-100
0
100
200
300
400
0 50 100 150 200 250 300 350
Wind angle [deg]
Mz
[MN
m]
0
2
0 5 0 1 00 1 5 0 2 00 2 5 0 3 00 3 5 0
W in d a n g le [ d e g ]
Max Peak Dynamic 2.0% Damping, -30% FrequenciesMax Peak Dynamic 2.0% Damping, Normal FrequenciesMax Peak Dynamic 2.0% Damping, +30% FrequenciesMin Peak Dynamic 2.0% Damping, +30% FrequenciesMin Peak Dynamic 2.0% Damping, Normal FrequenciesMin Peak Dynamic 2.0% Damping, -30% Frequencies
By: Yin Fai LiDate: 30-Jan-08
Status:Preliminary
Drawing no.:43860-FIG-11
43860 – Keangnam Hanoi Landmark Tower
0 deg North
180 deg South 90 degEast
270 degWest
Fx
Fy
Mz
MyMx
Origin for load application: client specified origin
West Residential Tower Plan - Axis System Definition
North
BMT Fluid Mechanics Limited COMMERCIAL-IN-CONFIDENCE
43860/00 Report 3 Rel.2 45 of 97 43860rep3v2.doc
Figure 3.7: Locations of Interest for Acceleration evaluation, Landmark Tower, L69
By: Yin Fai LiDate: 30-Jan-08
Status:Preliminary
Drawing no.:43860-FIG-4
43860 – Keangnam Hanoi Landmark Tower
TP S
ST
STST
P SPS
EP S
TPS
PSPS
ST
EPS
7
65
4
3
21
8
Landmark Tower, Acceleration Evaluation, L69
Figure 3.8: Locations of Interest for Acceleration evaluation, East Residential Tower, L49
By: Yin Fai LiDate: 30-Jan-08
Status:Preliminary
Drawing no.:43860-FIG-9
43860 – Keangnam Hanoi Landmark Tower
7
6
5
4
3
2
1
8
East Residential Tower, Acceleration Locations, L49

BMT Fluid Mechanics Limited COMMERCIAL-IN-CONFIDENCE
43860/00 Report 3 Rel.2 46 of 97 43860rep3v2.doc
Figure 3.9: Locations of Interest for Acceleration evaluation, West Residential Tower, L49
By: Yin Fai LiDate: 30-Jan-08
Status:Preliminary
Drawing no.:43860-FIG-14
43860 – Keangnam Hanoi Landmark Tower
7
6
5
4
3
2
1
8
West Residential Tower, Acceleration Locations, L49

BMT Fluid Mechanics Limited COMMERCIAL-IN-CONFIDENCE
43860/00 Report 3 Rel.2 47 of 97 43860rep3v2.doc
Figure 3.10: Peak-combined accelerations, Landmark Tower, Structural Damping of 1.0% of Critical
Figure 3.11: Peak-combined accelerations, East Residential Tower, Structural Damping of 2.0% of Critical
0
5
10
15
20
25
30
0 50 100 150 200 250 300 350
Wind Direction (deg)
Peak
Acc
eler
atio
n (m
g)
Average 10-yr return period wind speeds, 1.0% Damping - Location 5Typhoon 5-yr return period wind speeds, 1.0% Damping - Location 7Synoptic 1-yr return period wind speeds, 1.0% Damping - Location 7
0
5
10
15
20
0 50 100 150 200 250 300 350
Wind Direction (deg)
Peak
Acc
eler
atio
n (m
g
Average 10-yr return period wind speeds, 1.0% Damping - Location 3Typhoon 5-yr return period wind speeds, 1.0% Damping - Location 3Synoptic 1-yr return period wind speeds, 1.0% Damping - Location 7

BMT Fluid Mechanics Limited COMMERCIAL-IN-CONFIDENCE
43860/00 Report 3 Rel.2 48 of 97 43860rep3v2.doc
Figure 3.12: Peak-combined accelerations, West Residential Tower, Structural Damping of 2.0% of Critical
0
5
10
15
20
25
30
0 50 100 150 200 250 300 350
Wind Direction (deg)
Peak
Acc
eler
atio
n (m
g)
Average 10-yr return period wind speeds, 1.0% Damping - Location 5Typhoon 5-yr return period wind speeds, 1.0% Damping - Location 3Synoptic 1-yr return period wind speeds, 1.0% Damping - Location 7

BMT Fluid Mechanics Limited COMMERCIAL-IN-CONFIDENCE
43860/00 Report 3 Rel.2 49 of 97 43860rep3v2.doc
Figure 4.1: Comparison of the peak combined accelerations of the Landmark Tower (Nominal Frequencies) with Cenek & Wood (1990)
0
5
10
15
20
25
30
35
0.01 0.1 1 10 100
Return Period [years]
Peak
Acc
eler
atio
n [m
illi-g
]
Keangnam Hanoi Landmark Tower 1.00n, L69, 0.8% DampingKeangnam Hanoi Landmark Tower 1.00n, L69, 1.0% DampingKeangnam Hanoi Landmark Tower 1.00n, L69, 2.0% DampingNBCC OfficeNBCC ResidentialISO 6879Melbourne & CheungDavenport PerceptionDavenport Objection
2% Objection
10% Objection
2% Perception
10% Perception
Figure 4.2: Comparison of the peak combined accelerations of the East Residential Tower (Nominal Frequencies) with Cenek & Wood (1990)
0
5
10
15
20
25
30
35
0.01 0.1 1 10 100
Return Period [years]
Pea
k A
ccel
erat
ion
[mill
i-g]
Keangnam Hanoi East Residential Tower 1.00n, L49, 0.8% DampingKeangnam Hanoi East Residential Tower 1.00n, L49, 1.0% DampingKeangnam Hanoi East Residential Tower 1.00n, L49, 2.0% DampingNBCC OfficeNBCC ResidentialISO 6879Melbourne & CheungDavenport PerceptionDavenport Objection
2% Objection
10% Objection
2% Perception
10% Perception
BMT Fluid Mechanics Limited COMMERCIAL-IN-CONFIDENCE
43860/00 Report 3 Rel.2 50 of 97 43860rep3v2.doc
Figure 4.3: Comparison of the peak combined accelerations of the West Residential Tower (Nominal Frequencies) with Cenek & Wood (1990)
0
5
10
15
20
25
30
35
0.01 0.1 1 10 100
Return Period [years]
Peak
Acc
eler
atio
n [m
illi-g
]
Keangnam Hanoi West Residential Tower 1.00n, L49, 0.8% DampingKeangnam Hanoi West Residential Tower 1.00n, L49, 1.0% DampingKeangnam Hanoi West Residential Tower 1.00n, L49, 2.0% DampingNBCC OfficeNBCC ResidentialISO 6879Melbourne & CheungDavenport PerceptionDavenport Objection
2% Objection
10% Objection
2% Perception
10% Perception

BMT Fluid Mechanics Limited COMMERCIAL-IN-CONFIDENCE
43860/00 Report 3 Rel.2 51 of 97 43860rep3v2.doc
APPENDIX A. WIND ANALYSIS
A.1. Wind Analysis
A detailed wind analysis was carried out to determine the wind properties at the site. The wind analysis is based on the widely accepted Deaves and Harris log-law wind model of the atmospheric boundary layer, as defined in ESDU (Engineering Sciences Data Unit) Item 01008, and has provided wind profiles describing the variation of wind speed and turbulence intensity with height for a full range of wind directions. From this analysis representative profiles were defined as targets for the atmospheric boundary layer simulation in the wind tunnel.
A.1.1. Roughness Changes for ESDU Wind Analysis
The wind analysis takes detailed account of the variation of the upwind terrain on each wind sector. The roughness changes used in the analysis for the current study are given in Table A.1 below.
Table A.1: Terrain Roughness Changes from the Site
Wind Dir [deg]
z0
[m]x0
[m]z01
[m]x01
[m]z02
[m]x02
[m]z03
[m]x03
[m]z04
[m]x04
[m]z05
[m]0.0 0.1 1420 0.5 3300 0.2 4300 0.1 14700 0.5
22.5 0.1 1660 0.5 3500 0.01 4500 0.1 48400 0.545.0 0.1 760 0.5 3900 0.02 4900 0.1 58800 0.567.5 0.1 600 0.5 7100 0.06 3200 0.1 56600 0.590.0 0.1 540 0.41 8500 0.1112.5 0.1 840 0.3 13100 0.1135.0 0.1 240 0.5 500 0.11 1500 0.15 11300 0.1157.5 0.1 1900 0.3 2800 0.1180.0 0.3 270 0.1 3400 0.3 2900 0.1 41800 0.5202.5 0.3 1260 0.1 27700 0.5225.0 0.3 640 0.1 29700 0.5247.5 0.1 1350 0.1 21400 0.5270.0 0.1 24180 0.5292.5 0.1 280 0.3 800 0.1315.0 0.1 350 0.3 1100 0.1337.5 0.1 1420 0.3 2100 0.05 8800 0.1 23100 0.5
Where x0: upwind fetch
• z0: roughness length
• N.B: z0 = water (sea)
• 0.03 (open country)
• 0.10 (sparsely built up suburban / country with trees)
• 0.30 (suburban)
0.50 - 0.70 (urban)

BMT Fluid Mechanics Limited COMMERCIAL-IN-CONFIDENCE
43860/00 Report 3 Rel.2 52 of 97 43860rep3v2.doc
A.1.2. Wind Profiles
Figure A.1 shows the variation of turbulence intensity with wind direction at a height of 340 m.
Figures A.2 to A.5 show the variation of mean wind-speed (normalised by the mean wind speed at the reference height of 340 m) with height for winds approaching the site from the four primary quarters. Also shown are the target wind profiles, for the boundary layer simulations, which are representative of conditions expected at the site.
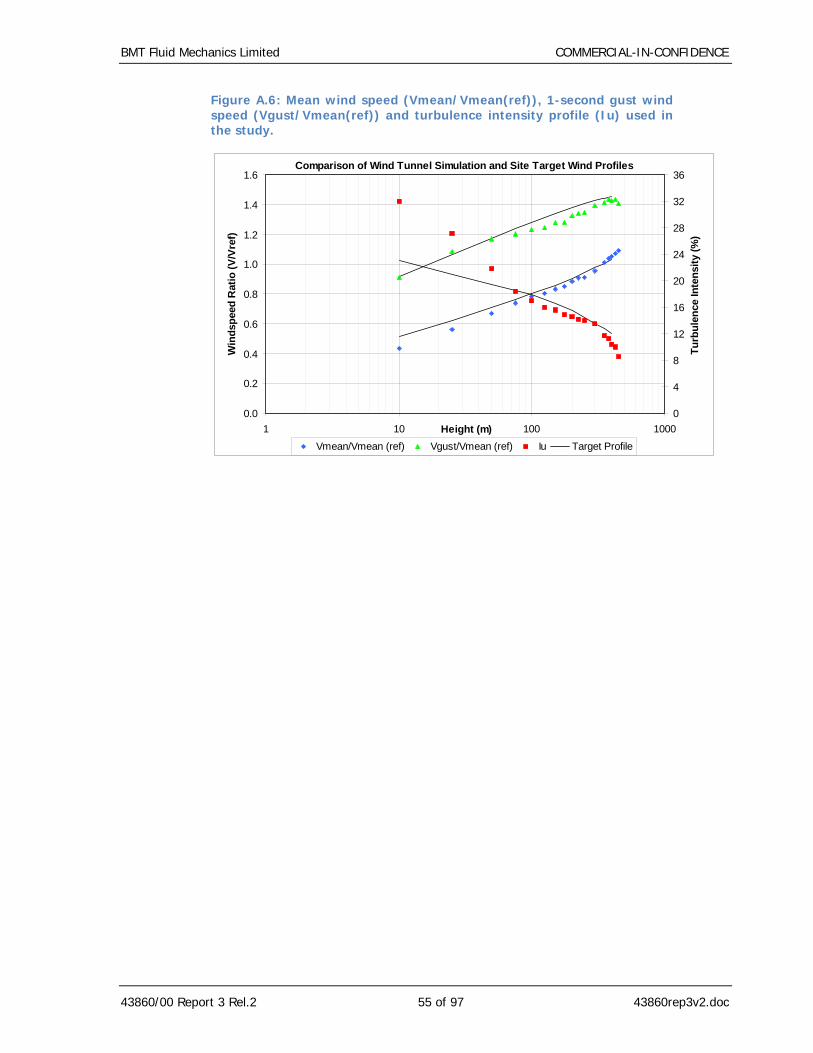
Figure A.6 presents the profiles of mean wind speed and turbulence intensity used in the tests. The mean wind speed profile is normalised by the wind speed at a height of 340 m. It can be seen that, over the range of heights of interest, the boundary layer simulations used in the tests were a good representation of that expected for the site at full scale.
Figure A.1: Variation of Turbulence Intensity with Wind Direction at 340 m Height, Including Reference Turbulence Levels
0
2
4
6
8
10
12
14
16
0 30 60 90 120 150 180 210 240 270 300 330 360Wind Direction (deg)
Turb
ulen
ce In
tens
ity (%
)
Site z0 = 0.1 z0 = 0.2 z0 = 0.3

BMT Fluid Mechanics Limited COMMERCIAL-IN-CONFIDENCE
43860/00 Report 3 Rel.2 53 of 97 43860rep3v2.doc
Figure A.2: Mean Windspeed Profiles (normalised to reference height of 340 m for the northern quarter (315° to 45°)
0
0.2
0.4
0.6
0.8
1
1.2
1 10 100 1000
Height [m]
V / V
ref
315337.5022.545Target Profilez0 = 0.2
Figure A.3: Mean Windspeed Profiles (normalised to reference height of 340 m for the eastern quarter (45° to 135°)
0
0.2
0.4
0.6
0.8
1
1.2
1 10 100 1000
Height [m]
V / V
ref
4567.590112.5135Target Profilez0 = 0.2

BMT Fluid Mechanics Limited COMMERCIAL-IN-CONFIDENCE
43860/00 Report 3 Rel.2 54 of 97 43860rep3v2.doc
Figure A.4: Mean Windspeed Profiles (normalised to reference height of 340 m for the southern quarter (135° to 225°)
0
0.2
0.4
0.6
0.8
1
1.2
1 10 100 1000
Height [m]
V / V
ref
135157.5180202.5225Target Profilez0 = 0.2
Figure A.5: Mean Windspeed Profiles (normalised to reference height of 340 m for the western quarter (225° to 315°)
0
0.2
0.4
0.6
0.8
1
1.2
1 10 100 1000
Height [m]
V / V
ref
225247.5270292.5315Target Profilez0 = 0.2
BMT Fluid Mechanics Limited COMMERCIAL-IN-CONFIDENCE
43860/00 Report 3 Rel.2 55 of 97 43860rep3v2.doc
Figure A.6: Mean wind speed (Vmean/Vmean(ref)), 1-second gust wind speed (Vgust/Vmean(ref)) and turbulence intensity profile (Iu) used in the study.
Comparison of Wind Tunnel Simulation and Site Target Wind Profiles
0.0
0.2
0.4
0.6
0.8
1.0
1.2
1.4
1.6
1 10 100 1000Height (m)
Win
dspe
ed R
atio
(V/V
ref)
0
4
8
12
16
20
24
28
32
36
Turb
ulen
ce In
tens
ity (%
)
Vmean/Vmean (ref) Vgust/Vmean (ref) Iu Target Profile

BMT Fluid Mechanics Limited COMMERCIAL-IN-CONFIDENCE
43860/00 Report 3 Rel.2 56 of 97 43860rep3v2.doc
A.2. Design Wind Speed
The site-specific design wind speeds (1-, 5-, 10- and 100-year return periods), which the present study is based on, are stated in Table A.2 in terms of mean hourly wind speeds at the reference height of 340 m.
The study defines design loads based on design wind speeds derived from the 100-year return period mean hourly wind speed (Vb) of 27.2 m/s at 10m height in open country terrain. The 100-year design loads for the proposed tower were derived from a purposely-commissioned typhoon simulation.
The serviceability design wind speeds are based on 1-, 5- and 10-year return period mean hourly wind speeds of 11.1 m/s, 14.2 m/s and 20.8 m/s respectively at 10 m height in open country terrain. These wind speeds were derived from a combination of analysis of local wind climate data, the typhoon simulation, and recommendations presented within TCVN 2737:1995, the current wind-loading standard of Vietnam.
The aforementioned wind speeds incorporate direction factors derived from a combination of analysis of local wind climate data and the typhoon simulation. The derivation of the all design wind speeds and direction factors used in this study was approved by ARUP (Hong Kong).

BMT Fluid Mechanics Limited COMMERCIAL-IN-CONFIDENCE
43860/00 Report 3 Rel.2 57 of 97 43860rep3v2.doc
Table A.2: Design Wind Speeds at reference height (340m), with return periods of 1-, 5-, 10-, 50 yr and 100yr (accounted for upstream terrain effect and directional factor)
Design Wind Speeds Wind Direction
[deg] 1-yr
[m/s] 5-yr
[m/s] 10-yr [m/s]
100-yr [m/s]
0 16.9 21.3 30.3 38.9 10 17.5 21.9 31.3 40.2 20 18.0 22.6 32.2 41.4 30 18.3 22.9 32.7 42.0 40 18.3 22.9 32.7 42.1 50 18.1 22.8 32.6 41.9 60 17.9 22.5 32.2 41.6 70 17.5 22.0 31.6 40.9 80 17.2 21.7 31.2 40.3 90 17.0 21.4 30.8 39.8
100 16.7 21.0 30.1 39.0 110 16.3 20.5 29.5 38.2 120 16.0 20.1 28.9 37.4 130 16.6 20.9 30.0 38.9 140 17.3 21.7 31.2 40.3 150 17.9 22.5 32.3 41.7 160 16.7 21.0 30.1 39.0 170 15.5 19.5 28.0 36.1 180 14.3 18.0 25.8 33.2 190 14.4 18.0 25.7 33.1 200 14.4 18.0 25.7 33.0 210 14.4 18.1 25.7 33.1 220 14.4 18.1 25.8 33.2 230 14.5 18.1 25.8 33.2 240 14.5 18.2 25.8 33.2 250 14.5 18.2 25.9 33.2 260 14.5 18.2 25.9 33.2 270 14.5 18.2 25.9 33.3 280 14.5 18.2 26.0 33.5 290 14.5 18.2 26.1 33.7 300 14.5 18.2 26.1 33.7 310 14.8 18.6 26.7 34.5 320 15.2 19.1 27.3 35.3 330 15.7 19.7 28.2 36.3 340 16.4 20.6 29.4 37.8 350 16.7 20.9 29.9 38.4

BMT Fluid Mechanics Limited COMMERCIAL-IN-CONFIDENCE
43860/00 Report 3 Rel.2 58 of 97 43860rep3v2.doc
APPENDIX B. WIND TUNNEL & MODEL DETAILS
B.1. Wind Tunnel Specifications
All the tests were conducted in BMT's Boundary Layer Wind Tunnel which has a test section 4.8 m wide, 2.4 m high and 15 m long with a 4.4 m diameter multiple plate turntable. The operating wind speed range is 0.2 - 45 m/s.
The turbulent boundary layer is set up using an arrangement of roughness elements distributed over the floor of the wind tunnel, vertical posts, spires, and a two-dimensional barrier placed at the entrance to the test section.
B.2. Model
B.2.1. Information
The model of the proposed Tower was constructed based on drawing information supplied by Heerim Architects & Planners Co. to BMT on the 27th November and 3rd and 4th December 2007.
The existing site and surrounds were constructed based on information supplied by Heerim Architects & Planners Co. and ARUP Hong Kong.
Photographs of the model have been sent to the design team during the construction stage.
B.2.2. Scale
A model scale of 1:400 has been adopted. At this scale the model is large enough to allow a good representation of the details that are likely to affect the local and overall wind flows at full scale. In addition, this scale enables a good simulation of the turbulence properties of the wind to be achieved.
B.2.3. Construction
The cladding pressure model was constructed using rapid-prototyping techniques such that a high degree of accuracy could be achieved (to a model scale tolerance of 0.1mm).
The model has been instrumented with a total number of 809 pressure taps.
The force balance model was designed for stiffness and lightness. The model was rigidly fixed to an aluminum base plate through a spine (made of high grade carbon fiber) to enable connection to the high frequency response force balance. The model incorporates all of the features that are likely to affect the local wind flow around the development at full scale. The bulk volume is made of high-density foam.
The surrounding area was modelled to a radius of 600m from the centre of the site. The surrounding buildings were represented to a sufficient level of detail to reproduce the wind flows at the location of the proposed buildings. The model was

BMT Fluid Mechanics Limited COMMERCIAL-IN-CONFIDENCE
43860/00 Report 3 Rel.2 59 of 97 43860rep3v2.doc
mounted on a 3.0m diameter baseboard and installed on the 4.4m diameter turntable of BMT’s Boundary Layer Wind Tunnel. In the region beyond the detailed surrounds model, the terrain is modelled as generalised roughness.
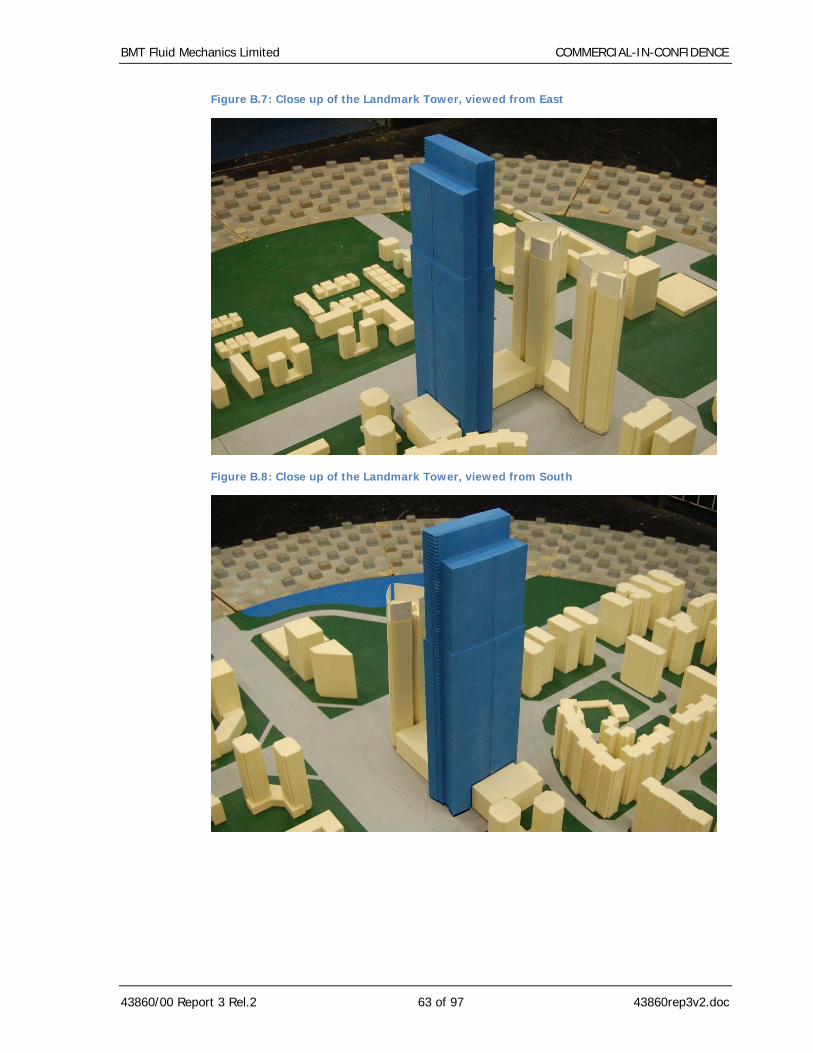
Figures B.1 and B.5 show the model of proposed development viewed from different wind directions. Figures B.6 to B.9 show close up view of the Landmark Tower. Figures B.10 to B.13 show close up view of the to Residential Towers. Figure B.14 shows the upstream fetch of the wind tunnel setup used in the study.

BMT Fluid Mechanics Limited COMMERCIAL-IN-CONFIDENCE
43860/00 Report 3 Rel.2 60 of 97 43860rep3v2.doc
Figure B.1: Proposed Development, viewed from North
Figure B.2: Proposed Development, viewed from East

BMT Fluid Mechanics Limited COMMERCIAL-IN-CONFIDENCE
43860/00 Report 3 Rel.2 61 of 97 43860rep3v2.doc
Figure B.3: Proposed Development, viewed from South
Figure B.4: Proposed Development, viewed from West

BMT Fluid Mechanics Limited COMMERCIAL-IN-CONFIDENCE
43860/00 Report 3 Rel.2 62 of 97 43860rep3v2.doc
Figure B.5: Proposed Development, viewed from Above
Figure B.6: Close up of the Landmark Tower, viewed from North
BMT Fluid Mechanics Limited COMMERCIAL-IN-CONFIDENCE
43860/00 Report 3 Rel.2 63 of 97 43860rep3v2.doc
Figure B.7: Close up of the Landmark Tower, viewed from East
Figure B.8: Close up of the Landmark Tower, viewed from South

BMT Fluid Mechanics Limited COMMERCIAL-IN-CONFIDENCE
43860/00 Report 3 Rel.2 64 of 97 43860rep3v2.doc
Figure B.9: Close up of the Landmark Tower, viewed from West
Figure B.10: Close up of the Residential Tower, viewed from North, West Tower instrumented

BMT Fluid Mechanics Limited COMMERCIAL-IN-CONFIDENCE
43860/00 Report 3 Rel.2 65 of 97 43860rep3v2.doc
Figure B.11: Close up of the Residential Tower, viewed from East, West Tower instrumented
Figure B.12: Close up of the Residential Tower, viewed from South, West Tower instrumented

BMT Fluid Mechanics Limited COMMERCIAL-IN-CONFIDENCE
43860/00 Report 3 Rel.2 66 of 97 43860rep3v2.doc
Figure B.13: Close up of the Residential Tower, viewed from West, West Tower instrumented
Figure B.14: Wind Tunnel Set-up viewed from Downwind

BMT Fluid Mechanics Limited COMMERCIAL-IN-CONFIDENCE
43860/00 Report 3 Rel.2 67 of 97 43860rep3v2.doc
APPENDIX C. INSTRUMENTATION AND EXPERIMENTAL TECHNIQUES
C.1. Instrumentation
C.1.1. Pressure Transducers
The fluctuating pressures have been measured using a simultaneous multi-channel low range pressure scanning system. The system uses Sensor Techniques low range (1000Pa) SLP004D differential transducers. The frequency response of the transducers is 2000Hz.
The transducers are grouped in blocks of eight, with a common reference pressure on each block. This provides the means for in-situ calibration and checks of the calibration throughout the tests. During the measurements the reference pressure was connected to the static pressure in the wind tunnel test section.
C.1.2. Tubing / Frequency Response
The transducers were connected to the surface pressure taps via 1.37mm internal diameter tubing. The overall length of the tubing is 1200mm and incorporates restrictors placed 950mm from the tap. To allow this length of tubing, frequency response corrections are applied using MatLab's 'yulewalk' to design the digital recursive filter with a zero phase shift filter implemented to generate the corrected time histories. This method is used to obtain an overall frequency response consistent with the requirements of model scale fluctuating pressure measurements.
C.1.3. High Frequency Force Balance
The fluctuating wind loads were measured using a six-component high frequency piezo-electric force balance in conjunction with a signal conditioning unit.
The fluctuating wind loads were measured in terms of the shear forces, bending moments and torque (5 components: Fx, Fy, Mx, My & Mz) at foundation level for 36 wind directions (10° increments). Data records were of sufficient length to enable the probability statistics and spectra to be computed in addition to the mean values.
C.2. Experimental Conditioning
The pressures were acquired for a time corresponding to a fixed period at full scale. The time scaling is given by
TT
LL
VV
m
f
m
f
f
m= .
where T is time, L is length, V is wind speed and sub-scripts m and f refer to model and full-scale quantities respectively. With Lm/Lf (the model scale) fixed at 1/400, Vf/Vm was chosen to be 1/0.30 to give a value of Tm/Tf of 1/120. The wind tunnel was therefore run to give a speed equivalent to 0.30 of the design wind speed.

BMT Fluid Mechanics Limited COMMERCIAL-IN-CONFIDENCE
43860/00 Report 3 Rel.2 68 of 97 43860rep3v2.doc
In order to define the peak 100-year return period pressures, data was acquired from each transducer for a full-scale period of 170 minutes, 85 seconds at model scale, including an allowance for acquisition overrun.
For base loads measured using high frequency force balance, considering a time scaling of 1/120, the wind-induced loads are acquired at a sampling rate of 600Hz (further low-pass filtered at 300Hz) during 119 sec of data acquisition.
BMT Fluid Mechanics Limited COMMERCIAL-IN-CONFIDENCE
43860/00 Report 3 Rel.2 69 of 97 43860rep3v2.doc
APPENDIX D. DATA ANALYSIS
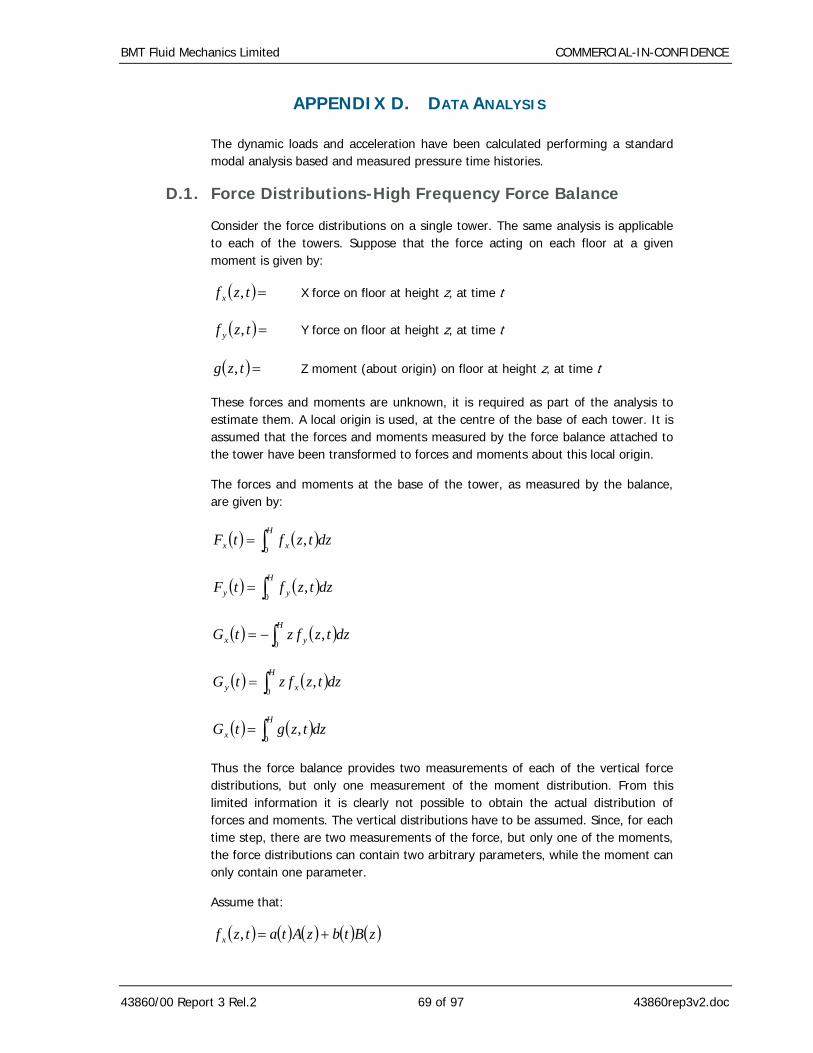
The dynamic loads and acceleration have been calculated performing a standard modal analysis based and measured pressure time histories.
D.1. Force Distributions-High Frequency Force Balance
Consider the force distributions on a single tower. The same analysis is applicable to each of the towers. Suppose that the force acting on each floor at a given moment is given by:
( ) =tzf x , X force on floor at height z, at time t
( ) =tzf y , Y force on floor at height z, at time t
( ) =tzg , Z moment (about origin) on floor at height z, at time t
These forces and moments are unknown, it is required as part of the analysis to estimate them. A local origin is used, at the centre of the base of each tower. It is assumed that the forces and moments measured by the force balance attached to the tower have been transformed to forces and moments about this local origin.
The forces and moments at the base of the tower, as measured by the balance, are given by:
( ) ( )∫=H
xx dztzftF0
,
( ) ( )∫=H
yy dztzftF0
,
( ) ( )∫−=H
yx dztzfztG0
,
( ) ( )∫=H
xy dztzfztG0
,
( ) ( )∫=H
x dztzgtG0
,
Thus the force balance provides two measurements of each of the vertical force distributions, but only one measurement of the moment distribution. From this limited information it is clearly not possible to obtain the actual distribution of forces and moments. The vertical distributions have to be assumed. Since, for each time step, there are two measurements of the force, but only one of the moments, the force distributions can contain two arbitrary parameters, while the moment can only contain one parameter.
Assume that:
( ) ( ) ( ) ( ) ( )zBtbzAtatzf x +=,

BMT Fluid Mechanics Limited COMMERCIAL-IN-CONFIDENCE
43860/00 Report 3 Rel.2 70 of 97 43860rep3v2.doc
( ) ( ) ( ) ( ) ( )zDtdzCtctzf y +=,
( ) ( ) ( )zEtetzg =,
where the vertical distribution functions A() … E() have to be chosen on the basis of other data.
In this case, the force balance measurements are given by:
( ) ( ) ( ) ( ) ( )∫∫ +=HH
x dzzBtbdzzAtatF00
( ) ( ) ( ) ( ) ( )∫∫ +=HH
y dzzDtddzzCtctF00
( ) ( ) ( ) ( ) ( )∫∫ −−=HH
x dzzDztddzzCztctG00
( ) ( ) ( ) ( ) ( )∫∫ +=HH
y dzzBztbdzzAztatG00
( ) ( ) ( )∫=H
z dzzEtetG0
Thus (as intended), the time variation parameters can be derived from the force balance measurements:
( ) ( ) ( )[ ]tGtFta yx 011
1 ββ −Δ
=
( ) ( ) ( )[ ]tGtFtb yox αα +−Δ
= 11
1
( ) ( ) ( )[ ]tGtFtc xy 012
1 δδ +Δ
=
( ) ( ) ( )[ ]tGtFtd xoy γγ −−Δ
= 12
1
( ) ( )0εtG
te z=
where:
( )∫=H
dzzA00α
( )∫=H
dzzAz01α

BMT Fluid Mechanics Limited COMMERCIAL-IN-CONFIDENCE
43860/00 Report 3 Rel.2 71 of 97 43860rep3v2.doc
( )∫=H
dzzB00β
( )∫=H
dzzBz01β
( )∫=H
dzzC00γ
( )∫=H
dzzCz01γ
( )∫=H
dzzD00δ
( )∫=H
dzzDz01δ
( )∫=H
dzzE00ε
01101 βαβα −=Δ
01102 δγδγ −=Δ
D.2. Modal Forces – High-Frequency Force Balance
In the model tests, each tower of the building is physically isolated from the other, so that the loads applied to that tower alone can be measured. However, in the prototype building, the towers are coupled and the modal oscillations generally result in motions of more than one of the towers. Since it is desired to calculate the loads and motions of the prototype building, it is necessary to take account of the motions of the coupled towers.
The k-th mode of building oscillation is given by:
( ) =znξ X displacement of the point above the local origin in the n-th
tower, at height z, due to motion in mode k
( ) =znη Y displacement of point above the local origin in the n-th tower, at
height z, due to motion in mode k
( ) =znψ Z rotation of point above the local origin in the n-th tower, at
height z, due to motion in mode k
Note that for compactness of notation, the identifier of the specific mode (k) has been omitted from most of the expressions.
The modal force driving this mode is given by:
( ) ( ) ( ) ( ) ( ) ( ) ( )[ ]∑∫ ++=n
H
nnnynnxnh dzztzgztzfztzfth0
,,, ψηξ

BMT Fluid Mechanics Limited COMMERCIAL-IN-CONFIDENCE
43860/00 Report 3 Rel.2 72 of 97 43860rep3v2.doc
Substituting the assumed form of the force distributions into this expression gives:
( ) ( ) ( ) ( ) ( ) ( )∑ ++++=n
nenndnncnnbnnan teHtdHtcHtbHtaHth
where:
( ) ( )∫=H
nnan dzzzAH0
ξ
( ) ( )∫=H
nnbn dzzzBH0
ξ
( ) ( )∫=H
nncn dzzzCH0
η
( ) ( )∫=H
nndn dzzzDH0
η
( ) ( )∫=H
nnen dzzzEH0
ψ
The modal force can be expressed directly in terms of the measured base forces and moments as:
( )
( ) ( )
( ) ( )
( )
∑
⎥⎥⎥⎥⎥⎥⎥⎥
⎦
⎤
⎢⎢⎢⎢⎢⎢⎢⎢
⎣
⎡
+
Δ+−
+Δ
+−−
Δ−
+Δ−
=n
znn
en
ynn
bnnannxn
n
dnncnn
ynn
dnncnnxn
n
bnnann
tGH
tGHH
tGHH
tFHH
tFHH
th
0
1
00
2
00
2
11
1
11
ε
γβγδ
γδαβ
D.3. Force Distributions – High Frequency Pressure Integration
When using pressure measurements over the surface of the building, the loads on the building are calculated by integrating the pressures over the surface of the building. The force and moment on a level, a tower, or the whole building are calculated from:
( ) ( )∑=i
iii atpt nF )
( ) ( ) ( )∑ ∧=i
iiii atpt nrG )
where:
( ) =tF Force on building, section or level, at time t.
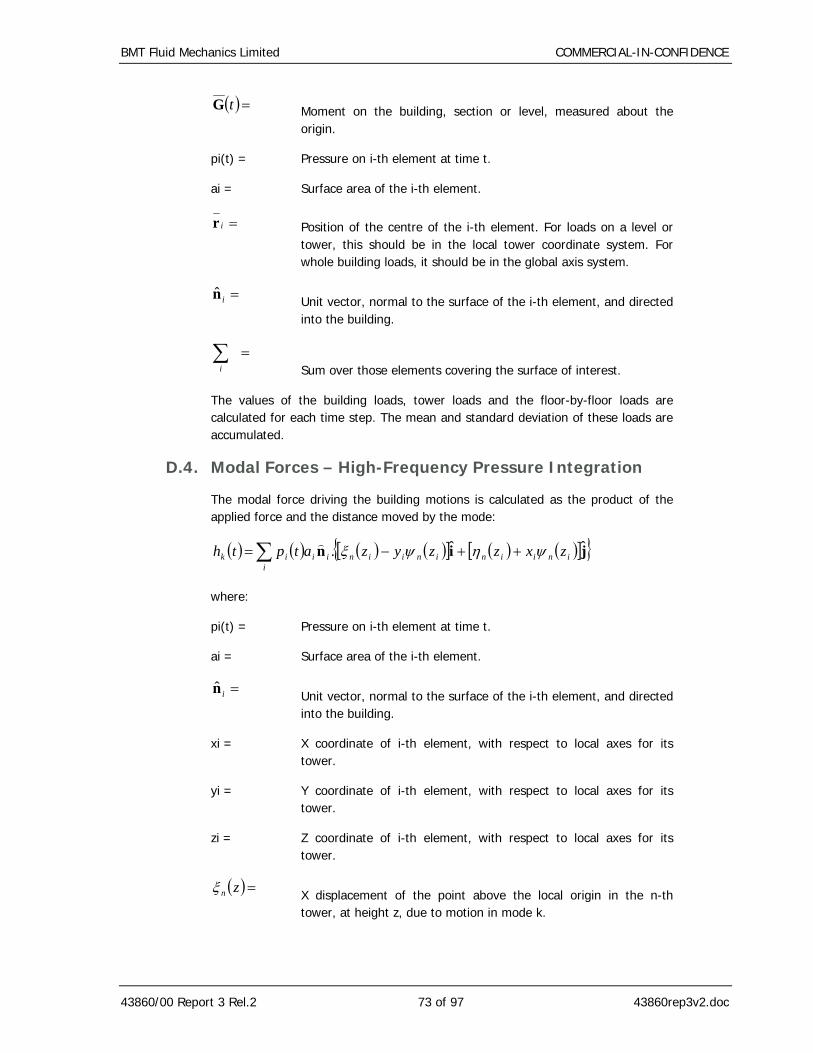
BMT Fluid Mechanics Limited COMMERCIAL-IN-CONFIDENCE
43860/00 Report 3 Rel.2 73 of 97 43860rep3v2.doc
( ) =tG Moment on the building, section or level, measured about the origin.
pi(t) = Pressure on i-th element at time t.
ai = Surface area of the i-th element.
=ir Position of the centre of the i-th element. For loads on a level or tower, this should be in the local tower coordinate system. For whole building loads, it should be in the global axis system.
=in Unit vector, normal to the surface of the i-th element, and directed into the building.
=∑i Sum over those elements covering the surface of interest.
The values of the building loads, tower loads and the floor-by-floor loads are calculated for each time step. The mean and standard deviation of these loads are accumulated.
D.4. Modal Forces – High-Frequency Pressure Integration
The modal force driving the building motions is calculated as the product of the applied force and the distance moved by the mode:
( ) ( ) ( ) ( )[ ] ( ) ( )[ ]{ }∑ ++−=i
iniininiiniiik zxzzyzatpth jin ˆˆ. ψηψξ)
where:
pi(t) = Pressure on i-th element at time t.
ai = Surface area of the i-th element.
=in Unit vector, normal to the surface of the i-th element, and directed into the building.
xi = X coordinate of i-th element, with respect to local axes for its tower.
yi = Y coordinate of i-th element, with respect to local axes for its tower.
zi = Z coordinate of i-th element, with respect to local axes for its tower.
( ) =znξ X displacement of the point above the local origin in the n-th tower, at height z, due to motion in mode k.

BMT Fluid Mechanics Limited COMMERCIAL-IN-CONFIDENCE
43860/00 Report 3 Rel.2 74 of 97 43860rep3v2.doc
( ) =znη Y displacement of point above the local origin in the n-th tower, at height z, due to motion in mode k.
( ) =znψ Z rotation of point above the local origin in the n-th tower, at height z, due to motion in mode k.
=i Unit vector in direction of X axis.
=j Unit vector in direction of Y axis.
D.5. Modal Responses
The response of the building in the k-th mode is given by:
[ ] ( )thqqqM kkkk =++ 22 ωωλ &&&
where:
q = Mode amplitude
ωk = Natural frequency of mode (angular frequency)
λk = Fraction of critical damping for mode
Mk = Mode inertia
The mode inertia is given by:
( ) ( ) ( ) ( )[ ] ( )( ) ( ) ( ) ( )[ ] ( )( ) ( ) ( ) ( ) ( ) ( ) ( ) ( )[ ] ( )
( ) ( ) ( ) ( ) ( ) ( ) ( ) ( ) ( )[ ]( ) ( )∑ ∫
∑∫
⎪⎭
⎪⎬⎫
⎪⎩
⎪⎨⎧
+
+−+=
⎥⎥⎥
⎦
⎤
⎢⎢⎢
⎣
⎡
+−+
++
−
=
n
H
nn
nngnnngnnnn
n
H
nnnngnnngnn
nngnnn
nngnnn
k
dzzzI
zzzxzzzyzzzm
dz
zzzIzzyzmzzxzm
zzzxzzm
zzzyzzm
M
0 2
22
0
22
ψ
ψηψξηξ
ψψξη
ηψη
ξψξ
where:
mn(z) = Mass of floor at height z of the n-th tower
In(z) = Moment of inertia (about local origin) of floor at height z, of the n-th tower
xgn(z) = X coordinate of centre of gravity of floor of n-th tower at height z
ygn(z) = Y coordinate of centre of gravity of floor of n-th tower at height z
The mean response can be obtained by taking the time average of this equation, to give:

BMT Fluid Mechanics Limited COMMERCIAL-IN-CONFIDENCE
43860/00 Report 3 Rel.2 75 of 97 43860rep3v2.doc
2kkM
hqω
=
The dynamic component of the response is calculated in the frequency domain, using the spectrum of the modal force:
( ) ( ) ( ) ( ) ( )222
222
21 ⎟⎟⎠
⎞⎜⎜⎝
⎛+
⎥⎥⎦
⎤
⎢⎢⎣
⎡⎟⎟⎠
⎞⎜⎜⎝
⎛−
==
kk
kkhhkq
MSSRS
ωλω
ωω
ωωωωω
( ) ( ) ( )
( )
222
2
4
2
21 ⎟⎟⎠
⎞⎜⎜⎝
⎛+
⎥⎥⎦
⎤
⎢⎢⎣
⎡⎟⎟⎠
⎞⎜⎜⎝
⎛−
⎟⎟⎠
⎞⎜⎜⎝
⎛
==
kk
k
h
khkq
MS
STS
ωλω
ωω
ωωω
ωωω&&
where:
( ) =ωhS Spectrum of modal force
( ) =ωqS Spectrum of modal displacement
( ) =ωqS && Spectrum of modal acceleration
and the admittance functions for displacement (Sk) and acceleration (Tk) are given by:
( ) ( )
⎟⎟⎠
⎞⎜⎜⎝
⎛−
⎥⎥⎦
⎤
⎢⎢⎣
⎡⎟⎟⎠
⎞⎜⎜⎝
⎛−
=
kk
kkk
i
MR
ωλω
ωω
ωω
21
12
2
( ) ( )
⎟⎟⎠
⎞⎜⎜⎝
⎛−
⎥⎥⎦
⎤
⎢⎢⎣
⎡⎟⎟⎠
⎞⎜⎜⎝
⎛−
−=
kk
kkk
i
MT
ωλω
ωω
ωωω
212
22
From the spectra, the rms response or rms acceleration can be calculated:
( )∫∞
=0
ωωσ dSqq
( )∫∞
=0
ωωσ dSqq &&&&

BMT Fluid Mechanics Limited COMMERCIAL-IN-CONFIDENCE
43860/00 Report 3 Rel.2 76 of 97 43860rep3v2.doc
The covariance (Cjk) and the correlation (ρjk) between the accelerations in two modes (j and k) can be calculated from the cross spectrum (Sjk) between the spectral modes:
( ) ( ) ( ){ }∫∞
ℜ=0
ωω dSwTwTC jkkjjk
kkjj
jkjk CC
C=ρ
The correlation between a modal acceleration and a background load can be calculated similarly using an appropriate cross spectrum, and an admittance function of unity for the background load. In force balance mode, it is only necessary to calculate the correlations between the modal accelerations and the base loads. The correlations of any other background load can then be derived from these.
D.6. Inertial Loads
The inertial loads on a floor, due to the motion in mode k, with amplitude q are given by:
( ) ( ) ( ) ( ) ( )[ ]qzzyzzmzfi ngnnnxn &&ψξ −=
( ) ( ) ( ) ( ) ( )[ ]qzzxzzmzfi ngnnnyn &&ψη +=
( ) ( ) ( ) ( ) ( ) ( )[ ] ( ) ( ){ }qzzIzzyzzxzmzgi nnngnngnnzn &&ψξη +−=
where:
fixn(z) = X component of inertial force on the floor at height z, for n-th tower
fiyn(z) = Y component of inertial force on the floor at height z, for n-th tower
gizn(z) =Z component of inertial moment on the floor at height z, for n-th tower
Rms forces are obtained by using the rms modal acceleration.
The inertial forces and moments at the base of the building are obtained by integrating the above floor-by-floor inertial forces, and then summing for all of the towers:
( )∑ ∫=n
H
xnx dzzfiFi0
( )∑ ∫=n
H
yny dzzfiFi0
( )∑ ∫−=n
H
ynx dzzfizGi0

BMT Fluid Mechanics Limited COMMERCIAL-IN-CONFIDENCE
43860/00 Report 3 Rel.2 77 of 97 43860rep3v2.doc
( )∑ ∫=n
H
xny dzzfizGi0
( )∑ ∫=n
H
znz dzzgiGi0
D.7. Dynamic Load Correlations
Any of the loads on the building can be expressed as a sum of background and inertial terms. Under the assumptions made for force balance analysis, any background loads can be derived from the background base loads. The inertial terms come from the modal responses of the building. Therefore any load (S) in the building can be expressed as:
∑∑ +=k
kki
ii qsbsS &&
where:
bi = Base load (force or moment)
=kq&& Modal acceleration
si = Base load transfer coefficient
sk = Mode inertial load transfer coefficient
Similarly for any other load T:
∑∑ +=l
llj
jj qtbtT &&
The covariance between S and V is therefore given by:
[ ] ( )( )[ ]TTSSETSCov −−=,
( ) ( )⎥⎥⎦
⎤
⎢⎢⎣
⎡
⎭⎬⎫
⎩⎨⎧
+−⎭⎬⎫
⎩⎨⎧
+−= ∑∑∑∑l
llj
jjjk
kki
iii qtbbtqsbbsE &&&&
[ ] ( ) [ ] [ ]∑∑∑∑∑∑ +++=k l
lklki k
kiikkii j
jiji qqCovtsqbCovtstsbbCovts &&&&&& ,,,
Therefore the covariance (and hence correlation) between any two dynamic loads (including the dynamic base loads) can be derived from the correlations of the background base loads and the modal accelerations. These in turn are obtained from the cospectra.
D.8. Peak Loads
Peak loads are calculated as a combination of the background and inertial loads, including correlations, using the CQC rule, as follows:

BMT Fluid Mechanics Limited COMMERCIAL-IN-CONFIDENCE
43860/00 Report 3 Rel.2 78 of 97 43860rep3v2.doc
( ) ( )( ) ( )( )∑∑∑ ++±=j k
modekkmodejjjkk
modekksdevksdevmeanpeak FgFgFgFgFgFF ρρ 002
0 2
where:
Fpeak = Peak load
Fmean = Mean background load
Fsdev = Standard deviation of background load
Fmodek = Rms inertial load due to response in mode k
g0 = Peak factor to apply to background standard deviation
gk = Peak factor to apply to inertial load due to motion in mode k
ρ0k = Correlation between background load and k-th modal acceleration
ρjk = Correlation between j-th and k-th modal accelerations
In the above expression, the loads may be either forces or moments, on either a single floor, or on the base of the entire building.
When calculating peak values for a modal response, the following expression is used:
sdevkmeanpeak qgqq +=
where:
qpeak = Peak modal response
qmean = Mean modal response
qsdev = Standard deviation of response
gk = Peak factor for k-th mode
This expression can be used for modal loads, responses, or accelerations. Note that the peak factor appropriate to the specific mode is applied. The background peak factor is not used.
D.9. X and Y, and Z Rotation Accelerations
The rms acceleration of the centre of a floor, due to the motion in a single mode is given by:
( )za kqx ξσ &&=
( )za kqy ησ &&=
( )za kqz ψσ &&=

BMT Fluid Mechanics Limited COMMERCIAL-IN-CONFIDENCE
43860/00 Report 3 Rel.2 79 of 97 43860rep3v2.doc
The peak accelerations for that mode are obtained by multiplying the above expressions by the peak factors for that mode. The acceleration in each direction due to the combined effect of all the modes is calculated by applying the methods in the previous section, giving:
( ) ( )∑∑=j k
kjkjkjjkx zzgga ξξσσρ
( ) ( )∑∑=j k
kkkjkjjky zzgga ηησσρ
( ) ( )∑∑=j k
kjkjkjjkz zzgga ψψσσρ
D.10. Total and Composite Accelerations
In a coupled mode (which has motions in both X and Y, or displacement and rotation), the motions in each direction are synchronised, with the peak displacement or acceleration occurring at the same motion in all directions.
The magnitude of the rms acceleration at the centre of the tower is given by:
( )[ ] ( )[ ]22 zza kkqO ηξσ += &&
The acceleration in a corner of the floor may be even higher:
( ) ( )[ ] ( ) ( )[ ]22 zxzzyza knkknkqO ψηψξσ ++−= &&
where (xn, yn) is the coordinates of the n-th corner.
The corner used it that which gives the highest acceleration. It can be seen that this only depends upon the mode shape. The peak magnitude of the total acceleration is obtained by multiplying this expression by the relevant peak factor.
This gives the peak magnitude of the acceleration that will be experienced anywhere on this floor (within the polygon bounded by the specified corners) due to the motion in this mode. The direction of this peak acceleration, and even the corner it occurs in may vary from floor to floor for a given mode. It will certainly be different for the different modes.
An assessment of the combined acceleration can be obtained by looking at the motions of specific locations on each floor of the building. The corners of the building will typically have the worst acceleration. The instantaneous total acceleration at a point is given by:
( ) ( )[ ]∑ −=k
kknkx qzyza &&ψξ
( ) ( )[ ]∑ +=k
kknky qzxza &&ψη

BMT Fluid Mechanics Limited COMMERCIAL-IN-CONFIDENCE
43860/00 Report 3 Rel.2 80 of 97 43860rep3v2.doc
The RMS of this total acceleration is therefore given by:
[ ] [ ]2222yxa aaEaE +==σ
( ) ( )[ ] ( ) ( )[ ]
( ) ( )[ ] ( ) ( )[ ]⎥⎥⎥⎥⎥
⎦
⎤
⎢⎢⎢⎢⎢
⎣
⎡
⎟⎠
⎞⎜⎝
⎛+⎟
⎠
⎞⎜⎝
⎛++
⎟⎠
⎞⎜⎝
⎛−⎟
⎠
⎞⎜⎝
⎛−
=
∑∑
∑∑
lllll
kkknk
lllll
kkknk
qzxzqzxz
qzyzqzyzE
&&&&
&&&&
ψηψη
ψξψξ
( ) ( )( ) ( ) ( )( )( ) ( )( ) ( ) ( )( ) [ ]∑∑
⎭⎬⎫
⎩⎨⎧
+++−−
=k l
lklllknk
lllknk qqEzxzzxz
zyzzyz&&&&
ψηψηψξψξ
( ) ( )( ) ( ) ( )( )( ) ( )( ) ( ) ( )( )∑∑
⎭⎬⎫
⎩⎨⎧
+++−−
=k l
kjjklllknk
lllknk
zxzzxzzyzzyz
σσρψηψη
ψξψξ
Similarly, the peak total acceleration at a corner is given by:
( ) ( )( ) ( ) ( )( )( ) ( )( ) ( ) ( )( )∑∑
⎭⎬⎫
⎩⎨⎧
+++−−
=k l
kjlkjklllknk
lllknkp gg
zxzzxzzyzzyz
a σσρψηψη
ψξψξ2

BMT Fluid Mechanics Limited COMMERCIAL-IN-CONFIDENCE
43860/00 Report 3 Rel.2 81 of 97 43860rep3v2.doc
APPENDIX E. STRUCTURAL AND DYNAMIC PROPERTIES
The structural properties information are referred to the axis system presented in Figures 2.1.
Table E.1: Mass and Mass Moment of Inertia Distribution, Landmark Tower
Story Height [m]
Xcg [m]
Ycg [m]
Mass [kg]
MMI [kg m²]
L71 317 -0.003 0.003 5224.88 4914848 L70 311.6 0.001 -0.137 5156.23 5085192 L69 308.3 0.001 -0.155 4911.334 4851849 L68 305 0.001 -0.155 4911.334 4851849 L67 301.7 0.001 -0.155 4911.334 4851849 L66 298.4 0.001 -0.155 4911.334 4851849 L65 295.1 0.001 -0.155 4911.334 4851849 L64 291.8 0.001 -0.155 4911.334 4851849 L63 288.5 0.001 -0.155 4911.334 4851849 L62 285.2 0.001 -0.155 4911.334 4851849 L61 281.9 0.001 -0.137 5156.23 5085192 L60 276.5 0.001 -0.072 6426.736 6525288 R2A 271.1 0.001 -0.068 6917.728 7185871 L59 267.8 0.001 -0.109 5110.19 5024816 L58 264.5 0.001 -0.109 5110.19 5024816 L57 261.2 0.001 -0.109 5110.19 5024816 L56 257.9 0.001 -0.109 5110.19 5024816 L55 254.6 0.001 -0.109 5110.19 5024816 L54 251.3 0.001 -0.109 5110.19 5024816 L53 248 0.001 -0.109 5110.19 5024816 L52 244.7 0.001 -0.109 5110.19 5024816 L51 241.4 0.001 -0.109 5116.938 5025628 L50 238.1 0.001 -0.109 5125.479 5026736 L49 234.8 0.002 -0.085 5640.504 5348687 L48 231.5 0 -0.081 9623.216 9377308 R1A 223.5 -0.009 -0.09 10534.02 10493442 L47 219.2 -0.004 -0.125 7111.677 6646756 L46 214.9 -0.004 -0.125 7111.677 6646756 L45 210.6 -0.004 -0.125 7111.677 6646756 L44 206.3 -0.004 -0.125 7111.677 6646756 L43 202 -0.004 -0.125 7111.677 6646756 L42 197.7 -0.004 -0.125 7111.677 6646756 L41 193.4 -0.004 -0.125 7111.677 6646756 L40 189.1 -0.004 -0.125 7111.677 6646756 L39 184.8 -0.004 -0.125 7111.677 6646756 L38 180.5 -0.004 -0.125 7111.677 6646756 L37 176.2 -0.004 -0.125 7111.677 6646756 L36 171.9 -0.004 -0.125 7111.677 6646756 L35 167.6 -0.004 -0.125 7111.677 6646756 L34 163.3 -0.004 -0.125 7111.677 6646756 L33 159 -0.004 -0.125 7111.677 6646756 L32 154.7 -0.004 -0.125 7111.677 6646756 L31 150.4 -0.004 -0.125 7111.677 6646756 L30 146.1 -0.004 -0.125 7111.677 6646756 L29 141.8 -0.005 -0.117 7488.745 6938624

BMT Fluid Mechanics Limited COMMERCIAL-IN-CONFIDENCE
43860/00 Report 3 Rel.2 82 of 97 43860rep3v2.doc
Story Height [m]
Xcg [m]
Ycg [m]
Mass [kg]
MMI [kg m²]
L28 137.5 -0.007 -0.114 7840.944 7230539 L27 133.2 -0.007 -0.114 7840.944 7230539 L26 128.9 -0.007 -0.114 7840.944 7230539 L25 124.6 -0.007 -0.114 7840.944 7230539 L24 120.3 -0.007 -0.114 7840.944 7230539 L23 116 -0.007 -0.114 7840.944 7230539 L22 111.7 -0.007 -0.114 7840.944 7230539 L21 107.4 -0.007 -0.114 7840.944 7230539 L20 103.1 -0.007 -0.114 7840.944 7230539 L19 98.8 -0.007 -0.114 7840.944 7230539 L18 94.5 -0.007 -0.114 7840.944 7230539 L17 90.2 -0.007 -0.114 7840.944 7230539 L16 85.9 -0.007 -0.114 7840.944 7230539 L15 81.6 -0.007 -0.114 7840.944 7230539 L14 77.3 -0.007 -0.114 7840.944 7230539 L13 73 -0.007 -0.114 7840.944 7230539 L12 68.7 -0.007 -0.114 7840.944 7230539 L11 64.4 -0.007 -0.114 7840.944 7230539 L10 60.1 -0.007 -0.114 7840.944 7230539 L9 55.8 -0.017 -0.107 9623.047 8357418 L8 48.6 -0.022 -0.104 10398.4 8808767 L7 43.5 -0.015 -0.119 10754.02 9352167 L6 37.5 -0.015 -0.119 10754.02 9352167 L5 32.4 -0.013 -0.122 10315.62 9017334 L4 27.3 -0.013 -0.122 10315.62 9017334 L3 22.2 -0.013 -0.122 10315.62 9017334 L2 17.1 -0.018 -0.117 11297.1 9729287
G/L1 9.9 -0.02 -0.115 11628.94 9885858 B1 3.9 -0.013 -0.122 9836.096 8477509

BMT Fluid Mechanics Limited COMMERCIAL-IN-CONFIDENCE
43860/00 Report 3 Rel.2 83 of 97 43860rep3v2.doc
Table E.2: Mass and Mass Moment of Inertia Distribution, Residential Towers
Story Height [m]
Xcg [m]
Ycg [m]
Mass [kg]
MMI [kg m²]
TRF 212.6 0 5.826 678.4052 40138.59 RF 205.2 0 5.997 3497.75 1172618 49 201.3 0 6.08 3353.604 1209910 48 197.7 0 6.08 3324.881 1203945 47 194.1 0 6.02 3336.074 1207869 46 190.5 0 6.08 3324.881 1203945 45 186.9 0 6.08 3324.881 1203945 44 183.3 0 6.02 3336.074 1207869 43 179.7 0 6.08 3324.881 1203945 42 176.1 0 6.08 3324.881 1203945 41 172.5 0 6.02 3336.074 1207869 40 168.9 0 6.08 3324.881 1203945 39 165.3 0 6.08 3324.881 1203945 38 161.7 0 6.02 3336.074 1207869 37 158.1 0 6.087 3437.399 1250351 36 154.5 0 6.093 3567.396 1306815 35 150.9 0 6.039 3578.085 1310569 34 147.3 0 6.093 3567.396 1306815 33 143.7 0 6.093 3567.396 1306815 32 140.1 0 6.039 3578.085 1310569 31 136.5 0 6.093 3567.396 1306815 30 132.9 0 6.093 3567.396 1306815 29 129.3 0 6.039 3578.085 1310569 28 125.7 0 6.093 3567.396 1306815 27 122.1 0 6.093 3567.396 1306815
OUT 118.5 0 6.106 4660.218 1634256 26 113.1 0.01 6.155 5684.401 2048835 25 109.5 0 6.093 3567.396 1306815 24 105.9 0 6.039 3578.085 1310569 23 102.3 0 6.095 3683.738 1340256 22 98.7 0 6.096 3806.523 1378608 21 95.1 0 6.046 3816.96 1382276 20 91.5 0 6.096 3806.523 1378608 19 87.9 0 6.096 3806.523 1378608 18 84.3 0 6.046 3816.96 1382276 17 80.7 0 6.096 3806.523 1378608 16 77.1 0 6.096 3806.523 1378608 15 73.5 0 6.046 3816.96 1382276 14 69.9 0 6.096 3806.523 1378608 13 66.3 0 6.096 3806.523 1378608 12 62.7 0 6.046 3816.96 1382276 11 59.1 0 6.096 3806.523 1378608 10 55.5 0 6.096 3806.523 1378608 9 51.9 0 6.046 3816.96 1382276
MECH 48.3 0.001 6.122 4192.105 1541112 8 45.9 0.015 5.917 4641.862 1674989 7 41.4 0.014 5.932 5073.733 1797878 6 36.9 0.014 5.932 5073.733 1797878 5 32.4 0.014 5.932 5073.733 1797878 4 27.9 0.014 5.932 5073.733 1797878 3 23.4 0.014 5.932 5073.733 1797878
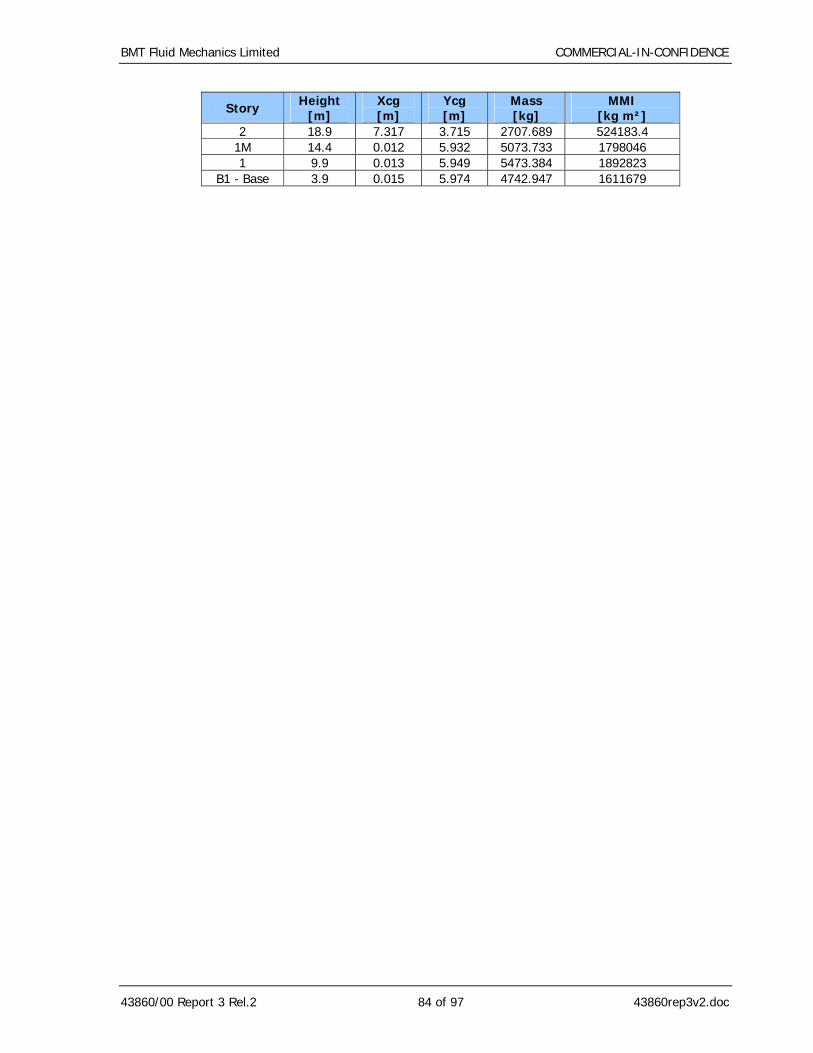
BMT Fluid Mechanics Limited COMMERCIAL-IN-CONFIDENCE
43860/00 Report 3 Rel.2 84 of 97 43860rep3v2.doc
Story Height [m]
Xcg [m]
Ycg [m]
Mass [kg]
MMI [kg m²]
2 18.9 7.317 3.715 2707.689 524183.4 1M 14.4 0.012 5.932 5073.733 1798046 1 9.9 0.013 5.949 5473.384 1892823
B1 - Base 3.9 0.015 5.974 4742.947 1611679

BMT Fluid Mechanics Limited COMMERCIAL-IN-CONFIDENCE
43860/00 Report 3 Rel.2 85 of 97 43860rep3v2.doc
Table E.3: Natural Frequencies
Mode Landmark Tower Frequency [Hz]
Residential Towers Frequency [Hz]
1 0.124 0.182 2 0.214 0.187 3 0.221 0.242
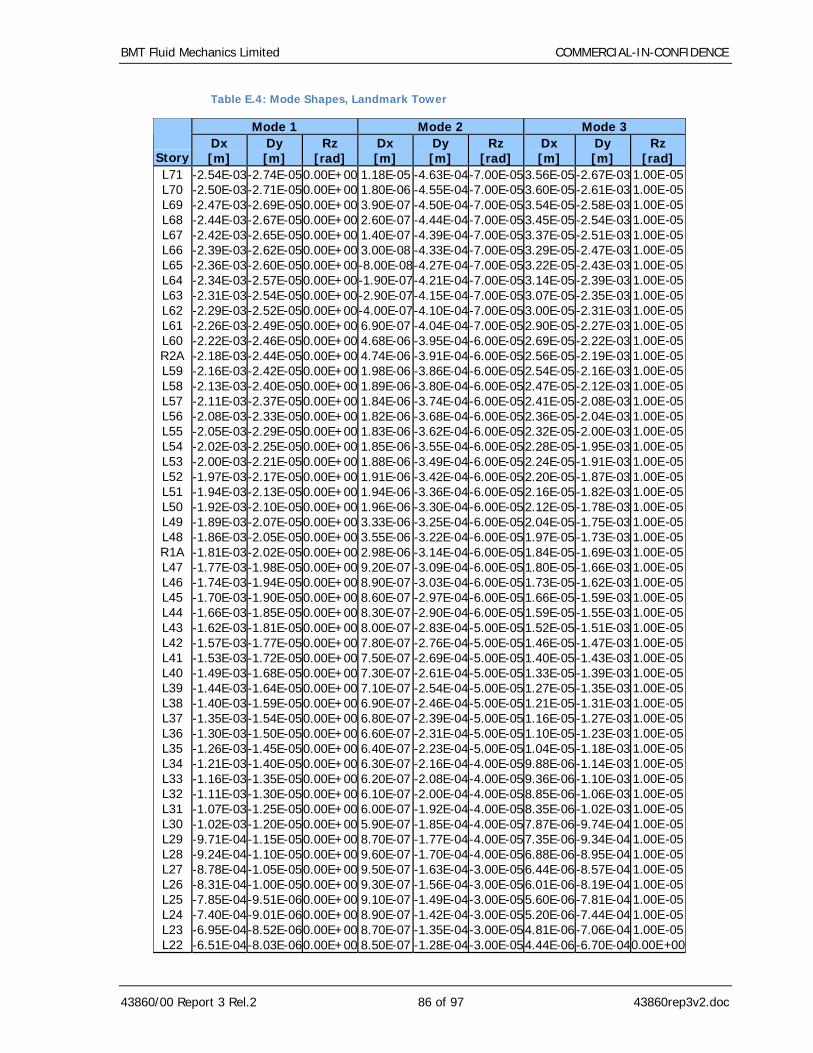
BMT Fluid Mechanics Limited COMMERCIAL-IN-CONFIDENCE
43860/00 Report 3 Rel.2 86 of 97 43860rep3v2.doc
Table E.4: Mode Shapes, Landmark Tower
Mode 1 Mode 2 Mode 3
Story Dx [m]
Dy [m]
Rz [rad]
Dx [m]
Dy [m]
Rz [rad]
Dx [m]
Dy [m]
Rz [rad]
L71 -2.54E-03-2.74E-05 0.00E+00 1.18E-05 -4.63E-04-7.00E-053.56E-05 -2.67E-03 1.00E-05L70 -2.50E-03-2.71E-05 0.00E+00 1.80E-06 -4.55E-04-7.00E-053.60E-05 -2.61E-03 1.00E-05L69 -2.47E-03-2.69E-05 0.00E+00 3.90E-07 -4.50E-04-7.00E-053.54E-05 -2.58E-03 1.00E-05L68 -2.44E-03-2.67E-05 0.00E+00 2.60E-07 -4.44E-04-7.00E-053.45E-05 -2.54E-03 1.00E-05L67 -2.42E-03-2.65E-05 0.00E+00 1.40E-07 -4.39E-04-7.00E-053.37E-05 -2.51E-03 1.00E-05L66 -2.39E-03-2.62E-05 0.00E+00 3.00E-08 -4.33E-04-7.00E-053.29E-05 -2.47E-03 1.00E-05L65 -2.36E-03-2.60E-05 0.00E+00-8.00E-08-4.27E-04-7.00E-053.22E-05 -2.43E-03 1.00E-05L64 -2.34E-03-2.57E-05 0.00E+00-1.90E-07-4.21E-04-7.00E-053.14E-05 -2.39E-03 1.00E-05L63 -2.31E-03-2.54E-05 0.00E+00-2.90E-07-4.15E-04-7.00E-053.07E-05 -2.35E-03 1.00E-05L62 -2.29E-03-2.52E-05 0.00E+00-4.00E-07-4.10E-04-7.00E-053.00E-05 -2.31E-03 1.00E-05L61 -2.26E-03-2.49E-05 0.00E+00 6.90E-07 -4.04E-04-7.00E-052.90E-05 -2.27E-03 1.00E-05L60 -2.22E-03-2.46E-05 0.00E+00 4.68E-06 -3.95E-04-6.00E-052.69E-05 -2.22E-03 1.00E-05R2A -2.18E-03-2.44E-05 0.00E+00 4.74E-06 -3.91E-04-6.00E-052.56E-05 -2.19E-03 1.00E-05L59 -2.16E-03-2.42E-05 0.00E+00 1.98E-06 -3.86E-04-6.00E-052.54E-05 -2.16E-03 1.00E-05L58 -2.13E-03-2.40E-05 0.00E+00 1.89E-06 -3.80E-04-6.00E-052.47E-05 -2.12E-03 1.00E-05L57 -2.11E-03-2.37E-05 0.00E+00 1.84E-06 -3.74E-04-6.00E-052.41E-05 -2.08E-03 1.00E-05L56 -2.08E-03-2.33E-05 0.00E+00 1.82E-06 -3.68E-04-6.00E-052.36E-05 -2.04E-03 1.00E-05L55 -2.05E-03-2.29E-05 0.00E+00 1.83E-06 -3.62E-04-6.00E-052.32E-05 -2.00E-03 1.00E-05L54 -2.02E-03-2.25E-05 0.00E+00 1.85E-06 -3.55E-04-6.00E-052.28E-05 -1.95E-03 1.00E-05L53 -2.00E-03-2.21E-05 0.00E+00 1.88E-06 -3.49E-04-6.00E-052.24E-05 -1.91E-03 1.00E-05L52 -1.97E-03-2.17E-05 0.00E+00 1.91E-06 -3.42E-04-6.00E-052.20E-05 -1.87E-03 1.00E-05L51 -1.94E-03-2.13E-05 0.00E+00 1.94E-06 -3.36E-04-6.00E-052.16E-05 -1.82E-03 1.00E-05L50 -1.92E-03-2.10E-05 0.00E+00 1.96E-06 -3.30E-04-6.00E-052.12E-05 -1.78E-03 1.00E-05L49 -1.89E-03-2.07E-05 0.00E+00 3.33E-06 -3.25E-04-6.00E-052.04E-05 -1.75E-03 1.00E-05L48 -1.86E-03-2.05E-05 0.00E+00 3.55E-06 -3.22E-04-6.00E-051.97E-05 -1.73E-03 1.00E-05R1A -1.81E-03-2.02E-05 0.00E+00 2.98E-06 -3.14E-04-6.00E-051.84E-05 -1.69E-03 1.00E-05L47 -1.77E-03-1.98E-05 0.00E+00 9.20E-07 -3.09E-04-6.00E-051.80E-05 -1.66E-03 1.00E-05L46 -1.74E-03-1.94E-05 0.00E+00 8.90E-07 -3.03E-04-6.00E-051.73E-05 -1.62E-03 1.00E-05L45 -1.70E-03-1.90E-05 0.00E+00 8.60E-07 -2.97E-04-6.00E-051.66E-05 -1.59E-03 1.00E-05L44 -1.66E-03-1.85E-05 0.00E+00 8.30E-07 -2.90E-04-6.00E-051.59E-05 -1.55E-03 1.00E-05L43 -1.62E-03-1.81E-05 0.00E+00 8.00E-07 -2.83E-04-5.00E-051.52E-05 -1.51E-03 1.00E-05L42 -1.57E-03-1.77E-05 0.00E+00 7.80E-07 -2.76E-04-5.00E-051.46E-05 -1.47E-03 1.00E-05L41 -1.53E-03-1.72E-05 0.00E+00 7.50E-07 -2.69E-04-5.00E-051.40E-05 -1.43E-03 1.00E-05L40 -1.49E-03-1.68E-05 0.00E+00 7.30E-07 -2.61E-04-5.00E-051.33E-05 -1.39E-03 1.00E-05L39 -1.44E-03-1.64E-05 0.00E+00 7.10E-07 -2.54E-04-5.00E-051.27E-05 -1.35E-03 1.00E-05L38 -1.40E-03-1.59E-05 0.00E+00 6.90E-07 -2.46E-04-5.00E-051.21E-05 -1.31E-03 1.00E-05L37 -1.35E-03-1.54E-05 0.00E+00 6.80E-07 -2.39E-04-5.00E-051.16E-05 -1.27E-03 1.00E-05L36 -1.30E-03-1.50E-05 0.00E+00 6.60E-07 -2.31E-04-5.00E-051.10E-05 -1.23E-03 1.00E-05L35 -1.26E-03-1.45E-05 0.00E+00 6.40E-07 -2.23E-04-5.00E-051.04E-05 -1.18E-03 1.00E-05L34 -1.21E-03-1.40E-05 0.00E+00 6.30E-07 -2.16E-04-4.00E-059.88E-06 -1.14E-03 1.00E-05L33 -1.16E-03-1.35E-05 0.00E+00 6.20E-07 -2.08E-04-4.00E-059.36E-06 -1.10E-03 1.00E-05L32 -1.11E-03-1.30E-05 0.00E+00 6.10E-07 -2.00E-04-4.00E-058.85E-06 -1.06E-03 1.00E-05L31 -1.07E-03-1.25E-05 0.00E+00 6.00E-07 -1.92E-04-4.00E-058.35E-06 -1.02E-03 1.00E-05L30 -1.02E-03-1.20E-05 0.00E+00 5.90E-07 -1.85E-04-4.00E-057.87E-06 -9.74E-04 1.00E-05L29 -9.71E-04-1.15E-05 0.00E+00 8.70E-07 -1.77E-04-4.00E-057.35E-06 -9.34E-04 1.00E-05L28 -9.24E-04-1.10E-05 0.00E+00 9.60E-07 -1.70E-04-4.00E-056.88E-06 -8.95E-04 1.00E-05L27 -8.78E-04-1.05E-05 0.00E+00 9.50E-07 -1.63E-04-3.00E-056.44E-06 -8.57E-04 1.00E-05L26 -8.31E-04-1.00E-05 0.00E+00 9.30E-07 -1.56E-04-3.00E-056.01E-06 -8.19E-04 1.00E-05L25 -7.85E-04-9.51E-06 0.00E+00 9.10E-07 -1.49E-04-3.00E-055.60E-06 -7.81E-04 1.00E-05L24 -7.40E-04-9.01E-06 0.00E+00 8.90E-07 -1.42E-04-3.00E-055.20E-06 -7.44E-04 1.00E-05L23 -6.95E-04-8.52E-06 0.00E+00 8.70E-07 -1.35E-04-3.00E-054.81E-06 -7.06E-04 1.00E-05L22 -6.51E-04-8.03E-06 0.00E+00 8.50E-07 -1.28E-04-3.00E-054.44E-06 -6.70E-04 0.00E+00

BMT Fluid Mechanics Limited COMMERCIAL-IN-CONFIDENCE
43860/00 Report 3 Rel.2 87 of 97 43860rep3v2.doc
Mode 1 Mode 2 Mode 3
Story Dx [m]
Dy [m]
Rz [rad]
Dx [m]
Dy [m]
Rz [rad]
Dx [m]
Dy [m]
Rz [rad]
L21 -6.08E-04-7.54E-06 0.00E+00 8.30E-07 -1.21E-04-3.00E-054.08E-06 -6.33E-04 0.00E+00L20 -5.65E-04-7.07E-06 0.00E+00 8.10E-07 -1.14E-04-2.00E-053.74E-06 -5.97E-04 0.00E+00L19 -5.24E-04-6.60E-06 0.00E+00 7.80E-07 -1.08E-04-2.00E-053.41E-06 -5.62E-04 0.00E+00L18 -4.83E-04-6.14E-06 0.00E+00 7.60E-07 -1.01E-04-2.00E-053.09E-06 -5.27E-04 0.00E+00L17 -4.44E-04-5.68E-06 0.00E+00 7.30E-07 -9.47E-05-2.00E-052.79E-06 -4.92E-04 0.00E+00L16 -4.06E-04-5.24E-06 0.00E+00 7.00E-07 -8.83E-05-2.00E-052.51E-06 -4.58E-04 0.00E+00L15 -3.70E-04-4.82E-06 0.00E+00 6.70E-07 -8.20E-05-2.00E-052.24E-06 -4.25E-04 0.00E+00L14 -3.34E-04-4.40E-06 0.00E+00 6.30E-07 -7.58E-05-2.00E-051.99E-06 -3.93E-04 0.00E+00L13 -3.01E-04-4.00E-06 0.00E+00 5.90E-07 -6.97E-05-1.00E-051.75E-06 -3.61E-04 0.00E+00L12 -2.68E-04-3.61E-06 0.00E+00 5.50E-07 -6.38E-05-1.00E-051.52E-06 -3.30E-04 0.00E+00L11 -2.38E-04-3.24E-06 0.00E+00 5.10E-07 -5.81E-05-1.00E-051.32E-06 -3.00E-04 0.00E+00L10 -2.10E-04-2.89E-06 0.00E+00 4.70E-07 -5.25E-05-1.00E-051.13E-06 -2.71E-04 0.00E+00L9 -1.83E-04-2.56E-06 0.00E+00 5.00E-07 -4.70E-05-1.00E-059.30E-07 -2.43E-04 0.00E+00L8 -1.43E-04-2.05E-06 0.00E+00 4.40E-07 -3.86E-05-1.00E-056.80E-07 -1.99E-04 0.00E+00L7 -1.17E-04-1.71E-06 0.00E+00 2.80E-07 -3.30E-05-1.00E-055.30E-07 -1.70E-04 0.00E+00L6 -8.89E-05-1.35E-06 0.00E+00 2.30E-07 -2.67E-05-1.00E-053.60E-07 -1.38E-04 0.00E+00L5 -6.80E-05-1.07E-06 0.00E+00 1.80E-07 -2.18E-050.00E+002.40E-07 -1.13E-04 0.00E+00L4 -4.97E-05-8.20E-07 0.00E+00 1.40E-07 -1.72E-050.00E+001.40E-07 -8.89E-05 0.00E+00L3 -3.41E-05-5.90E-07 0.00E+00 1.00E-07 -1.28E-050.00E+007.00E-08 -6.66E-05 0.00E+00L2 -2.13E-05-3.90E-07 0.00E+00 8.00E-08 -8.82E-060.00E+002.00E-08 -4.59E-05 0.00E+00
G/L1 -8.13E-06-1.60E-07 0.00E+00 4.00E-08 -3.86E-060.00E+001.00E-08 -2.01E-05 0.00E+00B1 -1.85E-06-3.00E-08 0.00E+00 1.00E-08 -9.30E-070.00E+001.00E-08 -4.82E-06 0.00E+00

BMT Fluid Mechanics Limited COMMERCIAL-IN-CONFIDENCE
43860/00 Report 3 Rel.2 88 of 97 43860rep3v2.doc
Table E.5: Mode Shapes, Residential Towers
Mode 1 Mode 2 Mode 3
Story Dx [m]
Dy [m]
Rz [rad]
Dx [m]
Dy [m]
Rz [rad]
Dx [m]
Dy [m]
Rz [rad]
TRF 8.37E-06 -4.40E-03 2.71E-07 -3.90E-03 -1.10E-05 -5.16E-05 1.25E-03 -5.35E-06 -1.74E-04RF 8.07E-06 -4.21E-03 2.70E-07 -3.77E-03 -1.05E-05 -5.12E-05 1.22E-03 -5.04E-06 -1.73E-0449 7.91E-06 -4.11E-03 2.69E-07 -3.70E-03 -1.02E-05 -5.09E-05 1.20E-03 -4.87E-06 -1.72E-0448 7.78E-06 -4.02E-03 2.67E-07 -3.64E-03 -1.00E-05 -5.06E-05 1.17E-03 -4.70E-06 -1.71E-0447 7.67E-06 -3.92E-03 2.66E-07 -3.58E-03 -9.76E-06 -5.03E-05 1.13E-03 -4.54E-06 -1.70E-0446 7.52E-06 -3.83E-03 2.65E-07 -3.51E-03 -9.51E-06 -4.99E-05 1.11E-03 -4.38E-06 -1.69E-0445 7.38E-06 -3.74E-03 2.63E-07 -3.44E-03 -9.27E-06 -4.95E-05 1.09E-03 -4.21E-06 -1.67E-0444 7.26E-06 -3.65E-03 2.61E-07 -3.38E-03 -9.03E-06 -4.90E-05 1.05E-03 -4.05E-06 -1.66E-0443 7.10E-06 -3.55E-03 2.59E-07 -3.30E-03 -8.78E-06 -4.85E-05 1.03E-03 -3.88E-06 -1.64E-0442 6.95E-06 -3.46E-03 2.57E-07 -3.23E-03 -8.54E-06 -4.79E-05 9.97E-04 -3.72E-06 -1.62E-0441 6.82E-06 -3.36E-03 2.55E-07 -3.16E-03 -8.29E-06 -4.73E-05 9.58E-04 -3.55E-06 -1.60E-0440 6.65E-06 -3.27E-03 2.52E-07 -3.09E-03 -8.04E-06 -4.66E-05 9.38E-04 -3.38E-06 -1.58E-0439 6.49E-06 -3.17E-03 2.49E-07 -3.01E-03 -7.80E-06 -4.58E-05 9.08E-04 -3.22E-06 -1.56E-0438 6.35E-06 -3.08E-03 2.46E-07 -2.94E-03 -7.55E-06 -4.51E-05 8.69E-04 -3.05E-06 -1.53E-0437 6.17E-06 -2.98E-03 2.43E-07 -2.86E-03 -7.31E-06 -4.43E-05 8.50E-04 -2.89E-06 -1.51E-0436 6.01E-06 -2.89E-03 2.40E-07 -2.78E-03 -7.06E-06 -4.34E-05 8.22E-04 -2.73E-06 -1.48E-0435 5.86E-06 -2.80E-03 2.37E-07 -2.71E-03 -6.82E-06 -4.26E-05 7.85E-04 -2.57E-06 -1.45E-0434 5.69E-06 -2.71E-03 2.33E-07 -2.63E-03 -6.58E-06 -4.17E-05 7.64E-04 -2.41E-06 -1.43E-0433 5.52E-06 -2.61E-03 2.30E-07 -2.55E-03 -6.34E-06 -4.08E-05 7.36E-04 -2.25E-06 -1.40E-0432 5.38E-06 -2.52E-03 2.26E-07 -2.47E-03 -6.11E-06 -3.98E-05 7.00E-04 -2.10E-06 -1.37E-0431 5.20E-06 -2.44E-03 2.22E-07 -2.40E-03 -5.88E-06 -3.89E-05 6.81E-04 -1.95E-06 -1.33E-0430 5.05E-06 -2.35E-03 2.18E-07 -2.32E-03 -5.66E-06 -3.79E-05 6.54E-04 -1.81E-06 -1.30E-0429 4.90E-06 -2.27E-03 2.15E-07 -2.25E-03 -5.44E-06 -3.70E-05 6.22E-04 -1.67E-06 -1.27E-0428 4.75E-06 -2.18E-03 2.11E-07 -2.18E-03 -5.23E-06 -3.61E-05 6.04E-04 -1.54E-06 -1.24E-0427 4.61E-06 -2.11E-03 2.08E-07 -2.11E-03 -5.03E-06 -3.53E-05 5.81E-04 -1.41E-06 -1.21E-04
OUT 4.49E-06 -2.03E-03 2.05E-07 -2.06E-03 -4.84E-06 -3.47E-05 5.62E-04 -1.29E-06 -1.18E-0426 4.36E-06 -1.95E-03 2.03E-07 -2.00E-03 -4.96E-06 -3.43E-05 5.47E-04 -2.32E-06 -1.16E-0425 4.25E-06 -1.88E-03 1.99E-07 -1.95E-03 -4.44E-06 -3.36E-05 5.20E-04 -1.06E-06 -1.13E-0424 4.12E-06 -1.80E-03 1.95E-07 -1.88E-03 -4.24E-06 -3.27E-05 4.92E-04 -9.47E-07 -1.10E-0423 3.96E-06 -1.72E-03 1.91E-07 -1.81E-03 -4.04E-06 -3.17E-05 4.74E-04 -8.34E-07 -1.06E-0422 3.80E-06 -1.64E-03 1.86E-07 -1.73E-03 -3.83E-06 -3.06E-05 4.50E-04 -7.24E-07 -1.02E-0421 3.64E-06 -1.56E-03 1.82E-07 -1.66E-03 -3.62E-06 -2.95E-05 4.21E-04 -6.15E-07 -9.84E-0520 3.47E-06 -1.47E-03 1.77E-07 -1.58E-03 -3.41E-06 -2.83E-05 4.01E-04 -5.07E-07 -9.45E-0519 3.30E-06 -1.39E-03 1.72E-07 -1.50E-03 -3.19E-06 -2.71E-05 3.77E-04 -4.03E-07 -9.05E-0518 3.14E-06 -1.30E-03 1.67E-07 -1.42E-03 -2.98E-06 -2.59E-05 3.47E-04 -3.01E-07 -8.64E-0517 2.96E-06 -1.22E-03 1.62E-07 -1.33E-03 -2.77E-06 -2.47E-05 3.27E-04 -2.02E-07 -8.23E-0516 2.78E-06 -1.13E-03 1.56E-07 -1.25E-03 -2.56E-06 -2.34E-05 3.02E-04 -1.08E-07 -7.80E-0515 2.62E-06 -1.05E-03 1.51E-07 -1.17E-03 -2.35E-06 -2.21E-05 2.75E-04 -1.92E-08 -7.37E-0514 2.44E-06 -9.64E-04 1.45E-07 -1.09E-03 -2.14E-06 -2.08E-05 2.55E-04 6.43E-08 -6.93E-0513 2.26E-06 -8.83E-04 1.40E-07 -1.01E-03 -1.94E-06 -1.95E-05 2.31E-04 1.42E-07 -6.49E-0512 2.10E-06 -8.03E-04 1.34E-07 -9.30E-04 -1.75E-06 -1.82E-05 2.06E-04 2.12E-07 -6.05E-0511 1.93E-06 -7.25E-04 1.28E-07 -8.51E-04 -1.56E-06 -1.69E-05 1.87E-04 2.75E-07 -5.61E-0510 1.77E-06 -6.50E-04 1.21E-07 -7.75E-04 -1.38E-06 -1.56E-05 1.66E-04 3.29E-07 -5.16E-059 1.61E-06 -5.77E-04 1.15E-07 -7.01E-04 -1.21E-06 -1.43E-05 1.43E-04 3.74E-07 -4.73E-05
MECH 1.45E-06 -5.08E-04 1.09E-07 -6.29E-04 -1.05E-06 -1.31E-05 1.27E-04 3.87E-07 -4.30E-058 1.38E-06 -4.64E-04 1.05E-07 -5.86E-04 -1.12E-06 -1.23E-05 1.07E-04 -1.80E-07 -4.03E-057 1.20E-06 -3.85E-04 9.65E-08 -5.02E-04 -9.04E-07 -1.08E-05 8.64E-05 -3.28E-08 -3.53E-056 1.02E-06 -3.12E-04 8.78E-08 -4.21E-04 -7.17E-07 -9.31E-06 6.77E-05 4.15E-08 -3.04E-055 8.52E-07 -2.44E-04 7.85E-08 -3.44E-04 -5.47E-07 -7.85E-06 5.09E-05 9.79E-08 -2.55E-054 6.88E-07 -1.84E-04 6.83E-08 -2.72E-04 -3.97E-07 -6.42E-06 3.64E-05 1.34E-07 -2.08E-053 5.30E-07 -1.30E-04 5.63E-08 -2.06E-04 -2.69E-07 -5.05E-06 2.41E-05 1.54E-07 -1.63E-052 4.58E-07 -8.49E-05 3.72E-08 -1.54E-04 -2.76E-05 -3.75E-06 -1.25E-05 -8.83E-05 -1.21E-05

BMT Fluid Mechanics Limited COMMERCIAL-IN-CONFIDENCE
43860/00 Report 3 Rel.2 89 of 97 43860rep3v2.doc
Mode 1 Mode 2 Mode 3
Story Dx [m]
Dy [m]
Rz [rad]
Dx [m]
Dy [m]
Rz [rad]
Dx [m]
Dy [m]
Rz [rad]
1M 2.34E-07 -4.90E-05 1.98E-08 -9.35E-05 -1.30E-07 -2.55E-06 7.06E-06 -4.62E-08 -8.27E-061 1.26E-07 -2.30E-05 1.02E-08 -5.08E-05 -6.83E-08 -1.52E-06 2.72E-06 -5.09E-08 -4.98E-06B1 2.93E-08 -5.30E-06 2.79E-09 -1.19E-05 -1.88E-08 -4.69E-07 3.72E-07 -2.37E-08 -1.61E-06

BMT Fluid Mechanics Limited COMMERCIAL-IN-CONFIDENCE
43860/00 Report 3 Rel.2 90 of 97 43860rep3v2.doc
Figure E.1: Contribution to modal masses by different components, Landmark Tower
Contribution to modal mass by components
0%
10%
20%
30%
40%
50%
60%
70%
80%
90%
100%
Mode 1 Mode 2 Mode 3
DxDyRz
Figure E.2: Contribution to modal masses by different components, Residential Tower
Contribution to modal mass by components
0%
10%
20%
30%
40%
50%
60%
70%
80%
90%
100%
Mode 1 Mode 2 Mode 3
DxDyRz
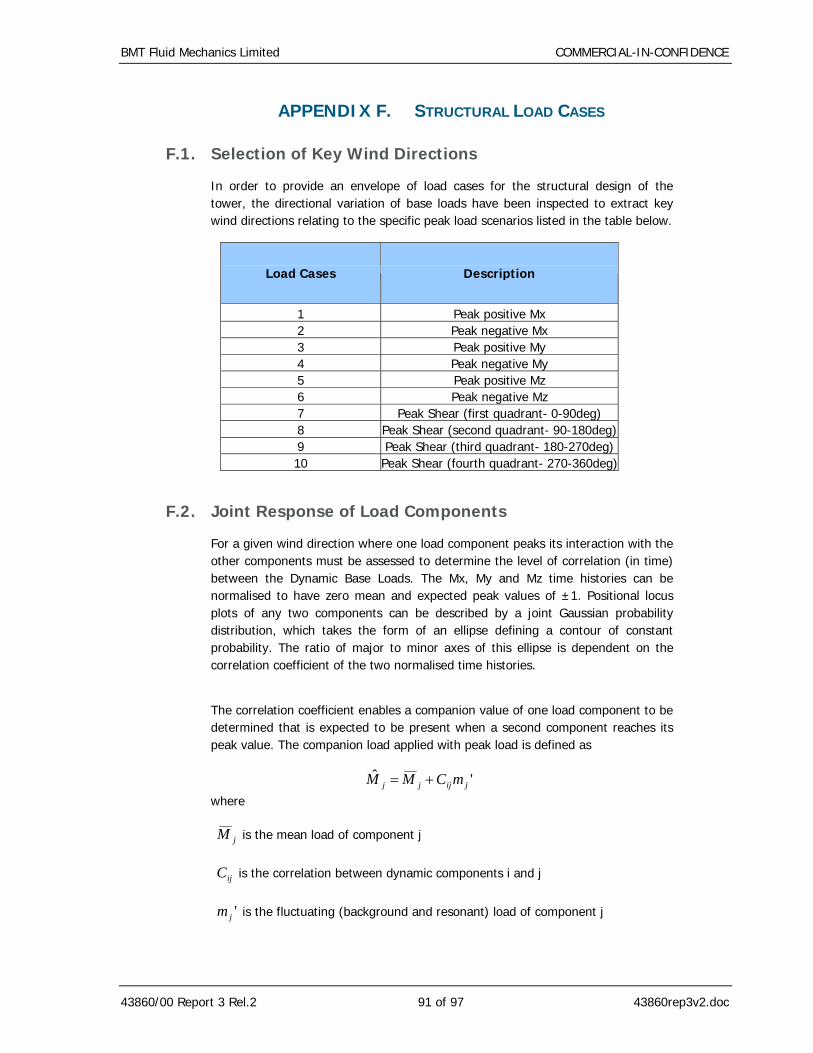
BMT Fluid Mechanics Limited COMMERCIAL-IN-CONFIDENCE
43860/00 Report 3 Rel.2 91 of 97 43860rep3v2.doc
APPENDIX F. STRUCTURAL LOAD CASES
F.1. Selection of Key Wind Directions
In order to provide an envelope of load cases for the structural design of the tower, the directional variation of base loads have been inspected to extract key wind directions relating to the specific peak load scenarios listed in the table below.
Load Cases Description
1 Peak positive Mx 2 Peak negative Mx 3 Peak positive My 4 Peak negative My 5 Peak positive Mz 6 Peak negative Mz 7 Peak Shear (first quadrant- 0-90deg) 8 Peak Shear (second quadrant- 90-180deg) 9 Peak Shear (third quadrant- 180-270deg) 10 Peak Shear (fourth quadrant- 270-360deg)
F.2. Joint Response of Load Components
For a given wind direction where one load component peaks its interaction with the other components must be assessed to determine the level of correlation (in time) between the Dynamic Base Loads. The Mx, My and Mz time histories can be normalised to have zero mean and expected peak values of ±1. Positional locus plots of any two components can be described by a joint Gaussian probability distribution, which takes the form of an ellipse defining a contour of constant probability. The ratio of major to minor axes of this ellipse is dependent on the correlation coefficient of the two normalised time histories.
The correlation coefficient enables a companion value of one load component to be determined that is expected to be present when a second component reaches its peak value. The companion load applied with peak load is defined as
'ˆjijjj mCMM +=
where
jM is the mean load of component j
ijC is the correlation between dynamic components i and j
'jm is the fluctuating (background and resonant) load of component j

BMT Fluid Mechanics Limited COMMERCIAL-IN-CONFIDENCE
43860/00 Report 3 Rel.2 92 of 97 43860rep3v2.doc
This approach enables the peak and companion floor-by-floor load distributions to be defined accounting for the non-simultaneous action of peak loading in time for the ten critical wind directions. These distributions are then presented as a proportion of their (all-directional) peak floor-by-floor distributions respectively.

BMT Fluid Mechanics Limited COMMERCIAL-IN-CONFIDENCE COMMERCIAL-IN-CONFIDENCE
43860/00 Report 3 Rel.2 93 of 97 43860rep3v2.doc
APPENDIX G. AERODYNAMIC LOAD COEFFICIENTS
Figure G.1: Mean Load Coefficient, Landmark Tower
CFx
-1.2
-0.8
-0.4
0.0
0.4
0.8
1.2
0 50 100 150 200 250 300 350
Wind angle [deg]
CFx
[-]
CMx
-1.2
-0.8
-0.4
0.0
0.4
0.8
1.2
0 50 100 150 200 250 300 350
Wind angle [deg]
CM
x [-
]
CFy
-1.2
-0.8
-0.4
0.0
0.4
0.8
1.2
0 50 100 150 200 250 300 350
Wind angle [deg]
CFy
[-]
CMy
-1.2
-0.8
-0.4
0.0
0.4
0.8
1.2
0 50 100 150 200 250 300 350
Wind angle [deg]
CM
y [-
]
CMz
-1.2
-0.8
-0.4
0.0
0.4
0.8
1.2
0 50 100 150 200 250 300 350
Wind angle [deg]
CM
z [-
]
Mean Drag and Lift
-1.2
-0.8
-0.4
0.0
0.4
0.8
1.2
0 50 100 150 200 250 300 350
Wind angle [deg]
Coe
ffici
ents
[-]
-0.5
0.0
0.5
1.0
1.5
2.0
Den
Har
tog
[-]
CD CL CD + CL'
Site-specific Design Wind Speed and Turbulence Intensity
0
5
10
15
20
25
30
35
40
45
0 50 100 150 200 250 300 350
Wind angle [deg]
Des
ign
Win
d Sp
eed
[m/s]
0
2
4
6
8
10
12
14
16
Turb
ulen
ce In
tens
ity [%
]
Design Wind Speed Iuu
By: Yin Fai LiDate: 30-Jan-08
Status:Preliminary
Drawing no.:43860-FIG-5
43860 – Keangnam Hanoi Landmark Tower
Drag
Lift
Landmark Tower, Sign Convention of Lift and Drag

BMT Fluid Mechanics Limited COMMERCIAL-IN-CONFIDENCE COMMERCIAL-IN-CONFIDENCE
43860/00 Report 3 Rel.2 94 of 97 43860rep3v2.doc
Figure G.2: Mean Load Coefficient, East Residential Tower
CFx
-1.2
-0.8
-0.4
0.0
0.4
0.8
1.2
0 50 100 150 200 250 300 350
Wind angle [deg]
CFx
[-]
CMy
-1.2
-0.8
-0.4
0.0
0.4
0.8
1.2
0 50 100 150 200 250 300 350
Wind angle [deg]
CM
y [-
]
CFy
-1.2
-0.8
-0.4
0.0
0.4
0.8
1.2
0 50 100 150 200 250 300 350
Wind angle [deg]
CFy
[-]
CMx
-1.2
-0.8
-0.4
0.0
0.4
0.8
1.2
0 50 100 150 200 250 300 350
Wind angle [deg]
CM
x [-
]
CMz
-1.2
-0.8
-0.4
0.0
0.4
0.8
1.2
0 50 100 150 200 250 300 350
Wind angle [deg]
CM
z [-
]
Mean Drag and Lift
-1.2
-0.8
-0.4
0.0
0.4
0.8
1.2
0 50 100 150 200 250 300 350
Wind angle [deg]
Coe
ffici
ents
[-]
-1.0
-0.5
0.0
0.5
1.0
1.5
2.0
Den
Har
tog
[-]
CD CL CD + CL'
Site-specific Design Wind Speed and Turbulence Intensity
0
5
10
15
20
25
30
35
40
45
0 50 100 150 200 250 300 350
Wind angle [deg]
Des
ign
Win
d Sp
eed
[m/s]
0
2
4
6
8
10
12
14
16
Turb
ulen
ce In
tens
ity [%
]
Design Wind Speed Iuu
By: Yin Fai LiDate: 30-Jan-08
Status:Preliminary
Drawing no.:43860-FIG-10
43860 – Keangnam Hanoi Landmark Tower
Drag
Lift
East Residential Tower, Sign Convention of Lift and Drag

BMT Fluid Mechanics Limited COMMERCIAL-IN-CONFIDENCE COMMERCIAL-IN-CONFIDENCE
43860/00 Report 3 Rel.2 95 of 97 43860rep3v2.doc
Figure G.3: Mean Load Coefficient, West Residential Tower
CFx
-1.2
-0.8
-0.4
0.0
0.4
0.8
1.2
0 50 100 150 200 250 300 350
Wind angle [deg]
CFx
[-]
CMy
-1.2
-0.8
-0.4
0.0
0.4
0.8
1.2
0 50 100 150 200 250 300 350
Wind angle [deg]
CM
y [-
]
CFy
-1.2
-0.8
-0.4
0.0
0.4
0.8
1.2
0 50 100 150 200 250 300 350
Wind angle [deg]
CFy
[-]
CMx
-1.2
-0.8
-0.4
0.0
0.4
0.8
1.2
0 50 100 150 200 250 300 350
Wind angle [deg]
CM
x [-
]
CMz
-1.2
-0.8
-0.4
0.0
0.4
0.8
1.2
0 50 100 150 200 250 300 350
Wind angle [deg]
CM
z [-
]
Mean Drag and Lift
-1.2
-0.8
-0.4
0.0
0.4
0.8
1.2
0 50 100 150 200 250 300 350
Wind angle [deg]
Coe
ffici
ents
[-]
-1.0
-0.5
0.0
0.5
1.0
1.5
Den
Har
tog
[-]
CD CL CD + CL'
Site-specific Design Wind Speed and Turbulence Intensity
0
5
10
15
20
25
30
35
40
45
0 50 100 150 200 250 300 350
Wind angle [deg]
Des
ign
Win
d Sp
eed
[m/s]
0
2
4
6
8
10
12
14
16
Turb
ulen
ce In
tens
ity [%
]
Design Wind Speed Iuu
By: Yin Fai LiDate: 30-Jan-08
Status:Preliminary
Drawing no.:43860-FIG-15
43860 – Keangnam Hanoi Landmark Tower
Drag
Lift
West Residential Tower, Sign Convention of Lift and Drag
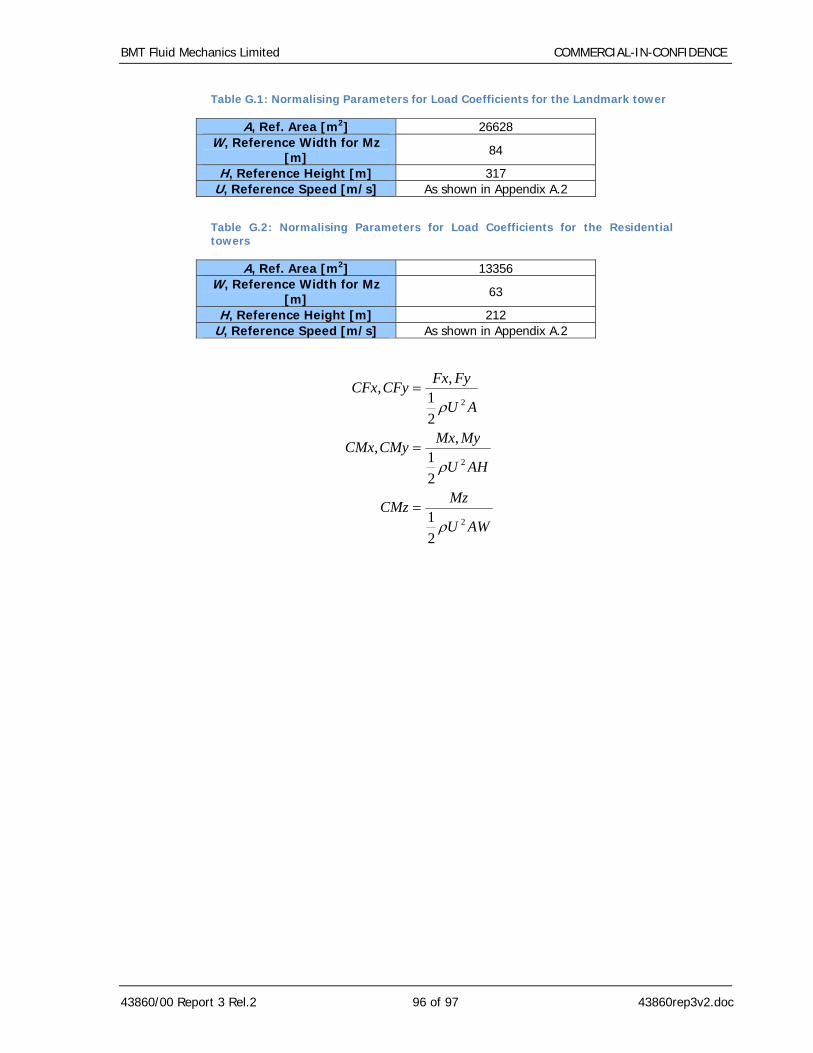
BMT Fluid Mechanics Limited COMMERCIAL-IN-CONFIDENCE
43860/00 Report 3 Rel.2 96 of 97 43860rep3v2.doc
Table G.1: Normalising Parameters for Load Coefficients for the Landmark tower
A, Ref. Area [m2] 26628 W, Reference Width for Mz
[m] 84
H, Reference Height [m] 317 U, Reference Speed [m/s] As shown in Appendix A.2
Table G.2: Normalising Parameters for Load Coefficients for the Residential towers
A, Ref. Area [m2] 13356 W, Reference Width for Mz
[m] 63
H, Reference Height [m] 212 U, Reference Speed [m/s] As shown in Appendix A.2
AWU
MzCMz
AHU
MyMxCMyCMx
AU
FyFxCFyCFx
2
2
2
21
21
,,
21
,,
ρ
ρ
ρ
=
=
=

BMT Fluid Mechanics Limited COMMERCIAL-IN-CONFIDENCE
43860/00 Report 3 Rel.2 97 of 97 43860rep3v2.doc
APPENDIX H. OVERALL LOAD RESULTS
The main results of the overall wind loads study are provided in a series of Excel Spread Sheet tables and plots enclosed on CD ROM (to be provided with final report):
H.1. Floor by Floor Loads and Base Loads:
See Files:
43860FBF001v2.xls
43860FBF002v2.xls
43860FBF003v2.xls
H.2. Base Loads Sensitivity
See Files:
43860BWL001v2.xls
43860BWL002v2.xls
43860BWL003v2.xls
H.3. Accelerations:
See Files:
43860ACC001v1.xls
43860ACC002v2.xls
43860ACC003v1.xls
43860ACC004v1.xls
43860ACC005v1.xls
43860ACC006v1.xls
43860ACC007v1.xls
43860ACC008v1.xls
43860ACC009v1.xls