KDD-Cup 2004 Chairs: Rich Caruana & Thorsten Joachims Web Master++: Lars Backstrom Cornell...
22
KDD-Cup 2004 Chairs: Rich Caruana & Thorsten Joachims Web Master++: Lars Backstrom Cornell University
-
date post
20-Dec-2015 -
Category
Documents
-
view
215 -
download
0
Transcript of KDD-Cup 2004 Chairs: Rich Caruana & Thorsten Joachims Web Master++: Lars Backstrom Cornell...

KDD-Cup 2004KDD-Cup 2004
Chairs: Rich Caruana & Thorsten JoachimsWeb Master++: Lars Backstrom
Cornell University

KDD-Cup TasksKDD-Cup Tasks
Goal: Optimize learning for different performance metrics
Task1: Particle Physics– Accuracy– Cross-Entropy– ROC Area– SLAC Q-Score
Task2: Protein Matching– Squared Error– Average Precision– Top 1– Rank of Last

Competition ParticipationCompetition Participation
Timeline– April 28: tasks and datasets available– July 14: submission of predictions
Participation– 500+ registrants/downloads– 102 teams submitted predictions– Physics: 65 submissions– Protein: 59 submissions– Both: 22 groups
Demographics– Registrations from 49 Countries (including .com)– Winners from China, Germany, India, New Zealand, USA– Winners half from companies, half from universities

Task 1: Particle PhysicsTask 1: Particle Physics
Data contributed by Charles Young et al, SLAC (Stanford Linear Accelerator)
Binary classification: distinguishing B from B-Bar particles
Balanced: 50-50 B/B-Bar 78 features (most real-valued) describing track Some missing values Train: 50,000 cases Test: 100,000 cases
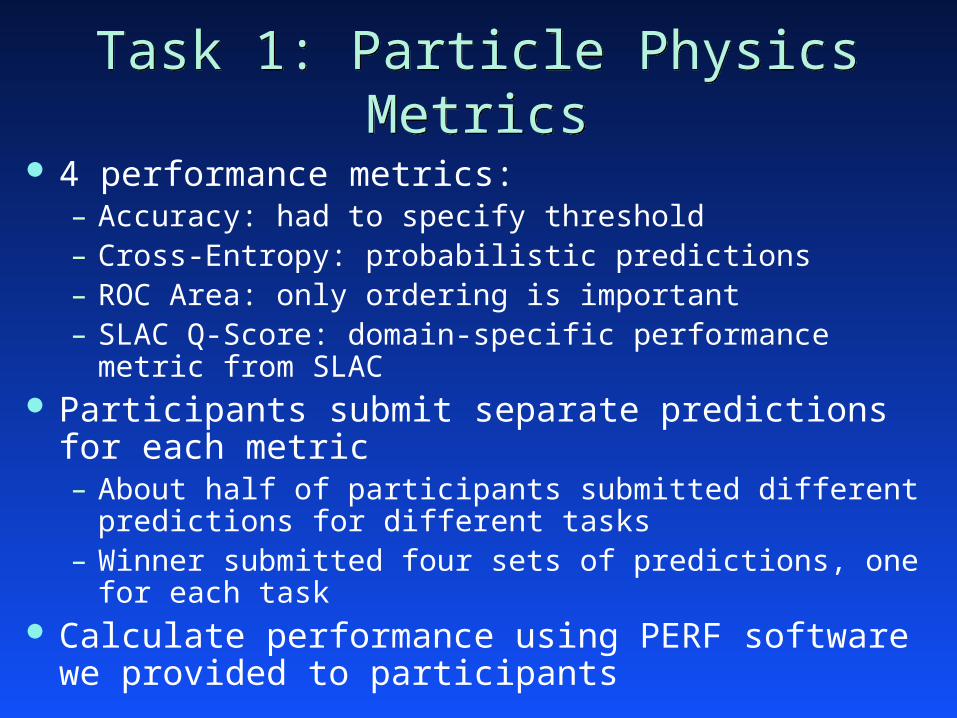
Task 1: Particle Physics MetricsTask 1: Particle Physics Metrics
4 performance metrics:– Accuracy: had to specify threshold– Cross-Entropy: probabilistic predictions– ROC Area: only ordering is important– SLAC Q-Score: domain-specific performance metric from
SLAC Participants submit separate predictions for each metric
– About half of participants submitted different predictions for different tasks
– Winner submitted four sets of predictions, one for each task Calculate performance using PERF software we provided
to participants


Determining the WinnersDetermining the Winners
For each performance metric– Calculate performance using same PERF software available to
participants– Rank participants by performance– Honorable mention for participant ranked first
Overall winner is participant with best average rank across all metrics

and the winners are…

Task 1: Physics WinnersTask 1: Physics Winners
Christophe Lambert (Golden Helix Inc.): 3rd place overall (out of 65)
Lalit Wangikar et al. (Inductis Inc.): 2nd place overall, HM Acc
David Vogels et al. (MEDai Inc./University of Central Florida): 1st place overall, HM ROC, HM Cross-Entropy, HM SLQ
Rank Accuracy Cross Entropy
ROC Area
SLQ Score
Average Rank
1st 0.7326 0.7095 0.8305 0.3328 1.25
2nd 0.7319 0.7246 0.8275 0.3265 1.75
3rd 0.7278 0.7280 0.8225 0.3175 3.25

Bootstrap Analysis of ResultsBootstrap Analysis of Results
How much does selection of winner depend on specific test set (100k)?
Algorithm:– Repeat many times:
Take 100k bootstrap sample (with replacement) from test set Evaluate performance on bootstrap sample and re-rank participants
– What is probability of winning/placing?

Overall rank on bootstrap sample
1st 2nd 3rd 4th 5th
Overall Rank
on official test set
1st 100% 0 0 0 0
2nd 0 100% 0 0 0
3rd 0 0 94% 6% 0
4th 0 0 6% 93% 1%
5th 0 0 0 1% 76%
Physics Winners: Bootstrap AnalysisPhysics Winners: Bootstrap Analysis
• 1000 bootstrap samples

MEDai TalkMEDai Talk
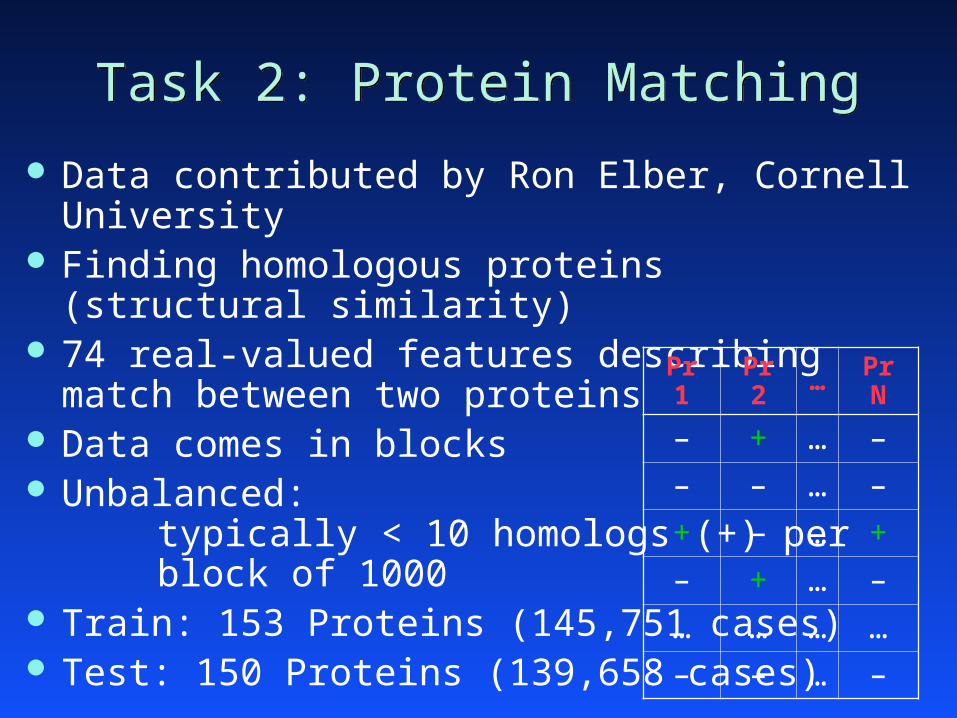
Task 2: Protein MatchingTask 2: Protein Matching
Data contributed by Ron Elber, Cornell University Finding homologous proteins (structural similarity) 74 real-valued features describing match between two
proteins Data comes in blocks Unbalanced:
typically < 10 homologs (+) per block of 1000
Train: 153 Proteins (145,751 cases) Test: 150 Proteins (139,658 cases)
Pr 1 Pr 2 … Pr N
– + … –
– – … –
+ – … +
– + … –
… … … …
– – … –

Task 2: Protein Matching MetricsTask 2: Protein Matching Metrics
Four performance metrics:– Mean Squared Error: probabilistic predictions– Mean Average Precision: only ordering within each block is
important– Mean Top 1: best predicted match is true homolog in each block– Mean Rank of Last: finding all homologs
Again participants submitted separate predictions for each metric– Again, about half of participants submitted multiple sets of
predictions– 19/20 top participants submitted multiple sets of predictions– Optimizing to each metric separately helped more on Protein than
on Physics


Task 2: Protein WinnersTask 2: Protein Winners
David Vogel et al. (Aimed / University of Central Florida): 3rd place overall, HM Top1
Yan Fu et al. (Inst. of Comp. Tech., Chinese Academy of Sci.): 2nd place overall, HM Squared Error, HM Average Precision
Bernhard Pfahringer (University of Waikato): 1st place overall
Katharina Morik et al. (University of Dortmund): HM Rank Last
Rank Top 1 Rank Last
Squared Error
Average Precision
Average Rank
1st 0.9200 45.62 0.0350 0.8412 4.125
2nd 0.9133 52.42 0.0354 0.8409 4.500
3rd 0.9067 52.45 0.0369 0.8380 5.500

Overall rank on bootstrap sample
1st 2nd 3rd 4th 5th
Overall Rank
on official test set
1st 14% 29% 26% 16% 8%
2nd 59% 24% 10% 5% 2%
3rd 22% 28% 23% 14% 7%
4th 4% 12% 22% 26% 17%
5th 0% 2% 6% 12% 20%
Protein Winners: Bootstrap AnalysisProtein Winners: Bootstrap Analysis
• 10,000 bootstrap samples

Talk by Bernhard PfahringerTalk by Bernhard Pfahringer

About half of participants submitted different predictions for each metric
Among winners:
Some evidence that top performers benefit from optimizing to each metric
Some metrics incompatible: e.g., optimizing to RMS hurts APR
Does Optimizing to Each Metric Help?Does Optimizing to Each Metric Help?
PhysicsTask
1st 4 sets
2nd 1 set
3rd 1 set
ProteinTask
1st 1 set
1st 2 sets
1st 4 sets
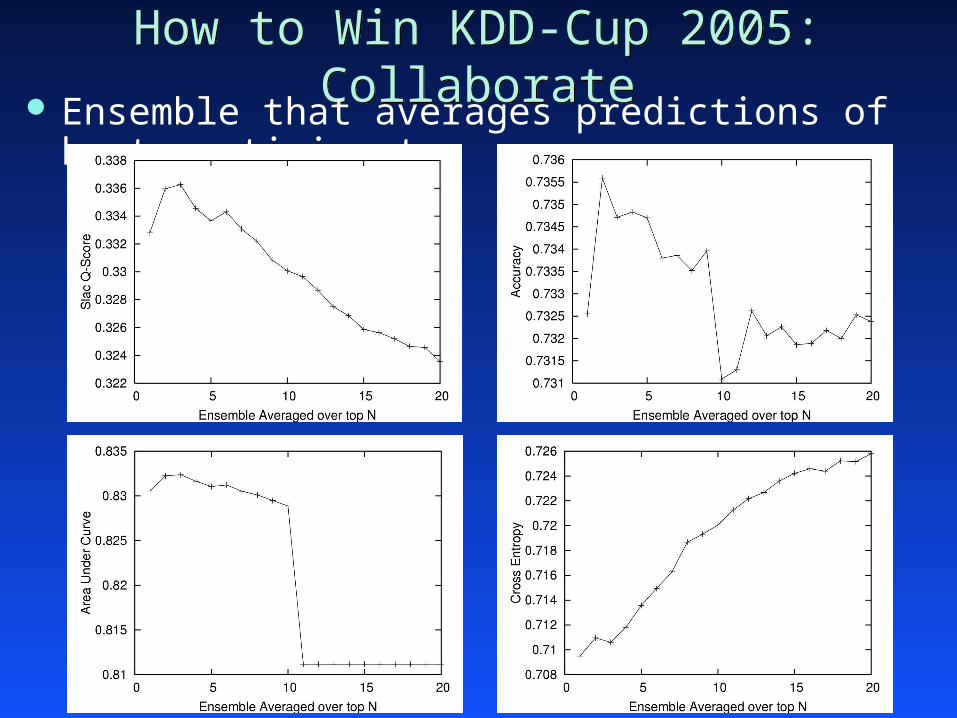
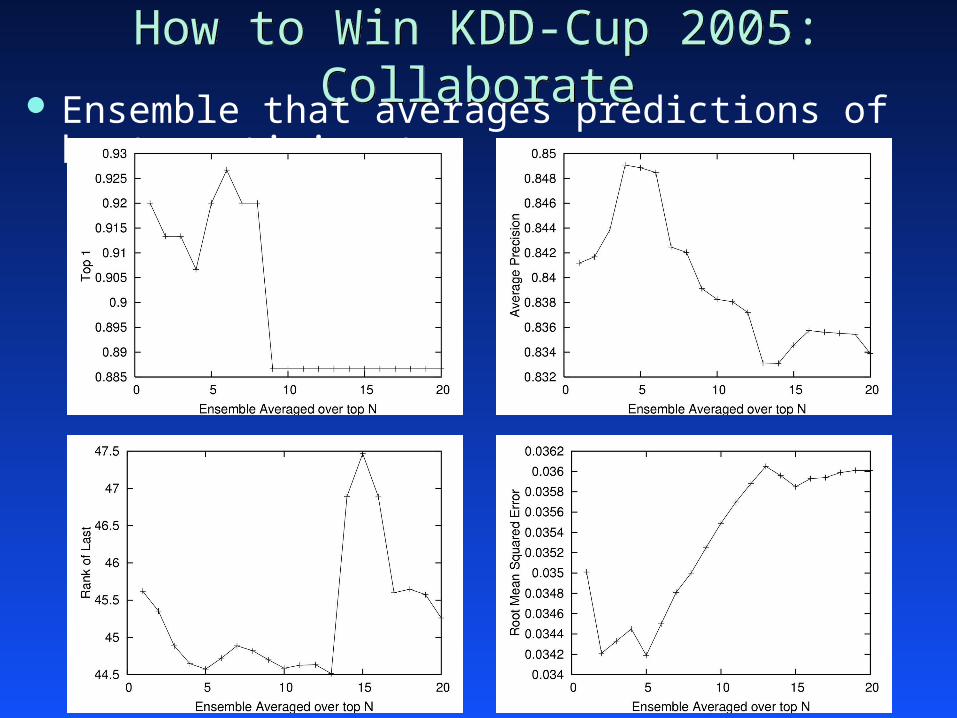
How to Win KDD-Cup 2005: CollaborateHow to Win KDD-Cup 2005: Collaborate Ensemble that averages predictions of best participants
How to Win KDD-Cup 2005: CollaborateHow to Win KDD-Cup 2005: Collaborate Ensemble that averages predictions of best participants

ClosingClosing
Data and all results available online:http://kodiak.cs.cornell.edu/kddcup
PERF software download: http://www.cs.cornell.edu/~caruana
Thanks to:– Web Master++: Lars Backstrom (Cornell)– Physics Data: Charles Young (SLAC)– Protein Data: Ron Elber (Cornell)– PERF: Alex Niculescu (Cornell), Filip Radlinski (Cornell),
Claire Cardie (Cornell), … Thanks to participants who found bugs in the PERF software:
– Chinese Academy of Sciences– University of Dortmund
And of course, thanks to everyone who participated!