KDC Energy Conservation AMRE-SACEA JOINT MEETING - 16 August 2011 KDC ENERGY.pdf · KDC Energy...
28
16 Aug 2011 Wynand Oosthuysen KDC Energy Conservation AMRE-SACEA JOINT MEETING
Transcript of KDC Energy Conservation AMRE-SACEA JOINT MEETING - 16 August 2011 KDC ENERGY.pdf · KDC Energy...

16 Aug 2011
Wynand Oosthuysen
KDC Energy Conservation
AMRE-SACEA JOINT MEETING

• Impact of Electricity on KDC
•Escalation on Electricity Cost
•Make-up of the Bill
•Counter measures taken
Content
2

Impact of Electricity on KDC
3
240
250
260
270
280
290
300
310
320
330
340Ju
n-0
6
Au
g-0
6
Oc
t-06
De
c-0
6
Fe
b-0
7
Ap
r-0
7
Ju
n-0
7
Au
g-0
7
Oc
t-07
De
c-0
7
Fe
b-0
8
Ap
r-0
8
Ju
n-0
8
Au
g-0
8
Oc
t-08
De
c-0
8
Fe
b-0
9
Ap
r-0
9
Ju
n-0
9
Au
g-0
9
Oc
t-09
De
c-0
9
Fe
b-1
0
Ap
r-1
0
Ju
n-1
0
Au
g-1
0
Oc
t-10
De
c-1
0
Fe
b-1
1
Ap
r-1
1
Ju
n-1
1
kW
h
Millio
ns
KDC Energy Consumption
Reduction of and
average of 44 MW

Impact of Electricity on KDC
4
Electricity cost increase year on year even though the
energy consumption is decreasing.
R 0
R 20
R 40
R 60
R 80
R 100
R 120
R 140
R 160
R 180
R 200
Ju
l-0
6
Se
p-0
6
No
v-0
6
Ja
n-0
7
Ma
r-0
7
Ma
y-0
7
Ju
l-0
7
Se
p-0
7
No
v-0
7
Ja
n-0
8
Ma
r-0
8
Ma
y-0
8
Ju
l-0
8
Se
p-0
8
No
v-0
8
Ja
n-0
9
Ma
r-0
9
Ma
y-0
9
Ju
l-0
9
Se
p-0
9
No
v-0
9
Ja
n-1
0
Ma
r-1
0
Ma
y-1
0
Ju
l-1
0
Se
p-1
0
No
v-1
0
Ja
n-1
1
Ma
r-1
1
Ma
y-1
1
Ju
l-1
1
kW
h
Millio
ns
KDC Energy Cost
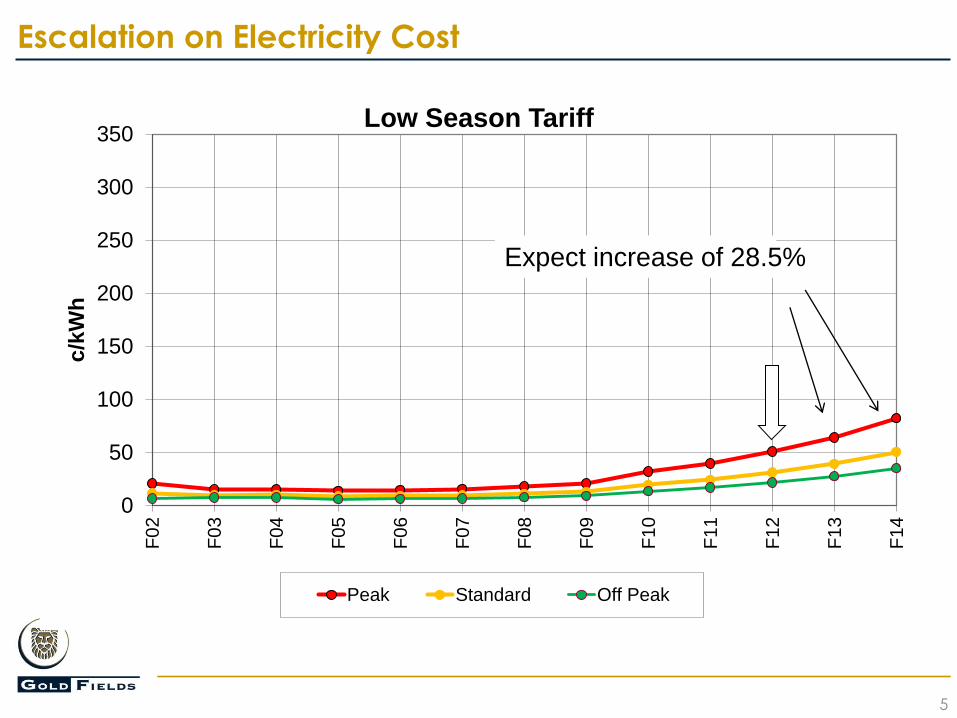
Escalation on Electricity Cost
5
0
50
100
150
200
250
300
350F
02
F0
3
F0
4
F0
5
F0
6
F0
7
F0
8
F0
9
F10
F1
1
F1
2
F1
3
F1
4
c/k
Wh
Low Season Tariff
Peak Standard Off Peak
Expect increase of 28.5%

Escalation on Electricity Cost
6
0
50
100
150
200
250
300
350F
02
F0
3
F0
4
F0
5
F06
F0
7
F0
8
F0
9
F1
0
F1
1
F1
2
F1
3
F1
4
c/k
Wh
High Season Tariff
Peak Standard Off Peak
Expect increase of 28.5%
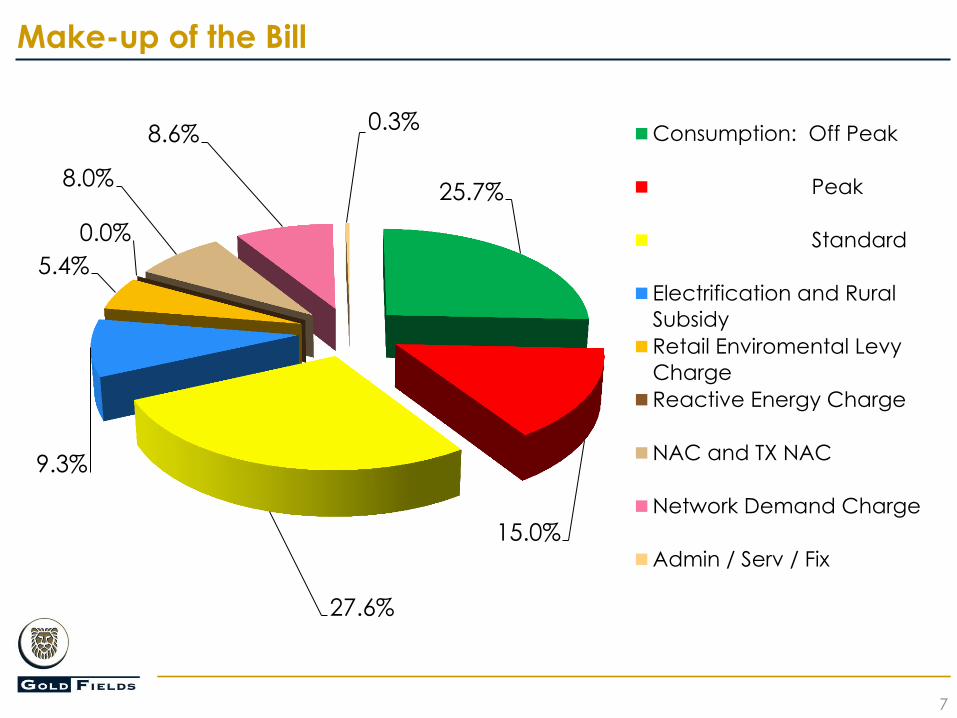
Make-up of the Bill
7
25.7%
15.0%
27.6%
9.3%
5.4%
0.0%
8.0%
8.6% 0.3%
Consumption: Off Peak
Peak
Standard
Electrification and Rural
Subsidy
Retail Enviromental Levy
Charge
Reactive Energy Charge
NAC and TX NAC
Network Demand Charge
Admin / Serv / Fix

Make-up of the Bill
8
83.0%
8.0% 8.6%
0.3%
Total Energy
Dependant
Charges
NAC and TX NAC

Completed Initiatives:
• Pump scheduling.
• Geyser Load switches in low density residential
areas.
• In line heater at high density residential areas.
• Energy efficient lighting.
• Guide vane control on main ventilation fans.
• Re-evaluate power factor correction installations.
• Compressed air load control.
• KDC East 1# Water System Optimization
• Energy recovery turbines K3 & D5 - ±6.5 MW
• Introduction / extension on closed loop cooling.
• Extensive installation of ventilation seals.
Counter measures taken
9

Pump Scheduling at 5 Shaft KDC West
Completed Initiatives
10
Intelligent Pump Scheduling and Control
Opportunities • East 5#
Scheduling out of Eskom evening peak
time i.e. 6pm to 8pm
4 Stages to surface with 6 pumps
per stage/level into dams on 52L,
42L, 23L and IPC with current dam
capacity
Max Demand Load Shift 8.22 MW

Pump Scheduling at 5 Shaft KDC West
Completed Initiatives
11
12.547 MW Shifted
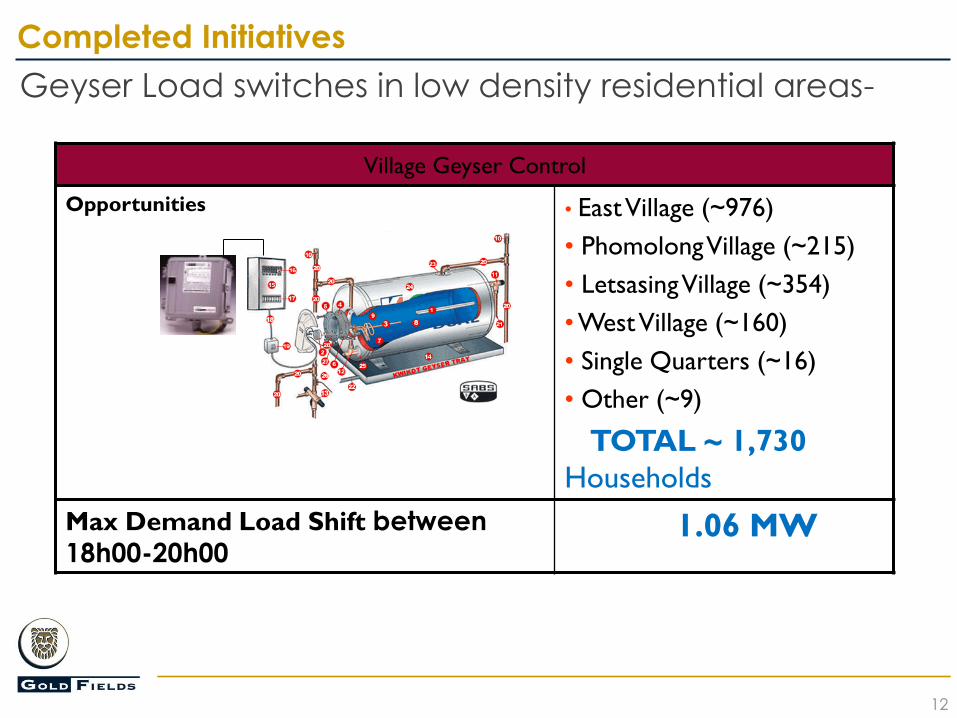
Geyser Load switches in low density residential areas-
Completed Initiatives
12
Village Geyser Control
Opportunities
• East Village (~976)
• Phomolong Village (~215)
• Letsasing Village (~354)
• West Village (~160)
• Single Quarters (~16)
• Other (~9)
TOTAL ~ 1,730
Households
Max Demand Load Shift between 18h00-20h00
1.06 MW

Geyser Load switches in low density residential areas-
Completed Initiatives
13
1.095 MW Shifted

In line heater at high density residential areas.
Completed Initiatives
14

In line heater at high density residential areas.
Completed Initiatives
15
0.943 MW Shifted
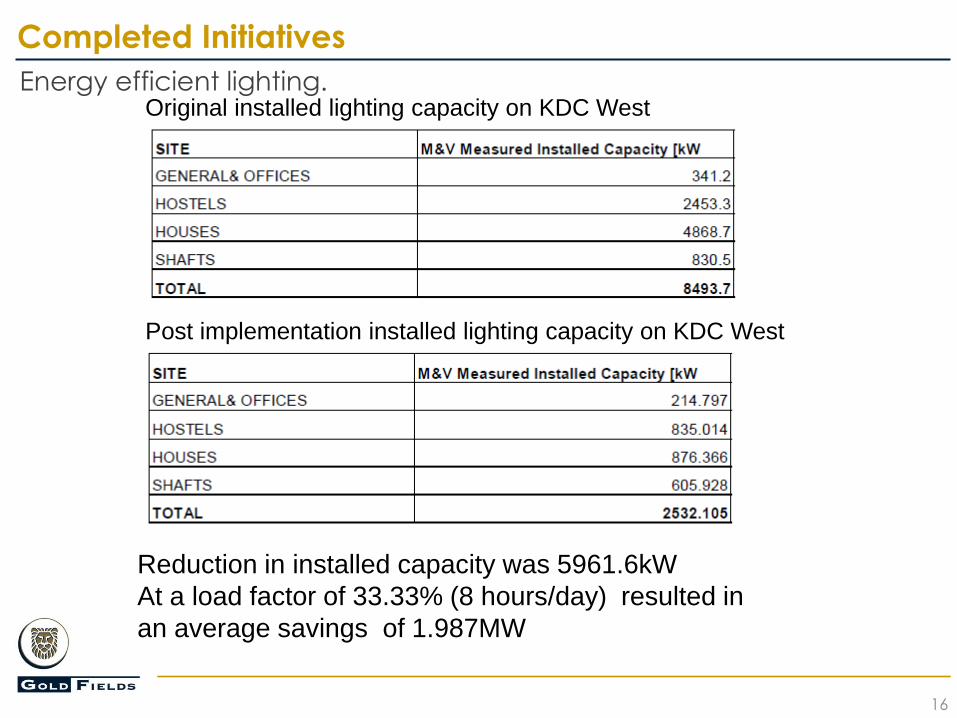
Energy efficient lighting.
Completed Initiatives
16
Original installed lighting capacity on KDC West
Post implementation installed lighting capacity on KDC West
Reduction in installed capacity was 5961.6kW
At a load factor of 33.33% (8 hours/day) resulted in
an average savings of 1.987MW

Guide vane control on main ventilation fans
Completed Initiatives
17

Guide vane control on main ventilation fans
Completed Initiatives
18
9.0
11.0
13.0
15.0
17.0
19.0
21.0
23.0
01/07/2009…
02/07/2009…
03/07/2009…
04/07/2009…
05/07/2009…
06/07/2009…
07/07/2009…
08/07/2009…
09/07/2009…
10/07/2009…
11/07/2009…
12/07/2009…
13/07/2009…
14/07/2009…
15/07/2009…
16/07/2009…
17/07/2009…
18/07/2009…
19/07/2009…
20/07/2009…
21/07/2009…
22/07/2009…
23/07/2009…
24/07/2009…
26/07/2009…
27/07/2009…
28/07/2009…
29/07/2009…
30/07/2009…
MW
KDC West Main Ventilation Fan Demand
Demand clipping during evening peak of ± 5MW
Average demand saving of 1.88 MW per month

Completed Initiatives
19
0
5
10
15
20
25
30
35
40
45
No
v-0
2Jan-0
3M
ar-
03
Ma
y-0
3Jul-0
3S
ep-0
3N
ov-0
3Jan-0
4M
ar-
04
Ma
y-0
4Jul-0
4S
ep-0
4N
ov-0
4Jan-0
5M
ar-
05
Ma
y-0
5Jul-0
5S
ep-0
5N
ov-0
5Jan-0
6M
ar-
06
Ma
y-0
6Jul-0
6S
ep-0
6N
ov-0
6Jan-0
7M
ar-
07
Ma
y-0
7Jul-0
7S
ep-0
7N
ov-0
7Jan-0
8M
ar-
08
Ma
y-0
8Jul-0
8S
ep-0
8N
ov-0
8Jan-0
9M
ar-
09
Ma
y-0
9Jul-0
9S
ep-0
9N
ov-0
9Jan-1
0M
ar-
10
Ma
y-1
0Jul-1
0S
ep-1
0N
ov-1
0Jan-1
1M
ar-
11
Ma
y-1
1Jul-1
1
kV
arh
M
illio
ns
KDC West - Reactive Energy - Total Mine
Excess Reactive Energy (kVARh) Off Peak Standard Peak
Re-evaluate power factor correction installations
16.6 Mvarh to 12.9 MVarh to 7.7 MVarh

Compressed air load control.
• 50 Valve installation done on various shafts.
• Compressor guide vane control upgraded.
• Individual compressor load sharing and between compressor houses
Completed Initiatives
20

Compressed air load control.
Completed Initiatives
21

KDC East 1# Water System Optimization
Completed Initiatives
22
3.219 MW Average Weekday saving

New Initiatives:.
• More Energy recovery turbines at K4 21 lev. – 0.5 MW.
• Reverse flow pumps at KDC West 4 shaft 2 MW
• Refrigeration plant load shifting K4 & D5 – 9 MW.
• Introduction of an Ice Plant at K3 - 7.65 MW
• DSM Air project at K7 - 1.5 MW
• Heat pumps at industrial change houses – 1.5 MW
• Additional Geyser Load switches in low density residential
areas – 1.26 MW
• Compressor intake filter refurbishment – 2.2 MW.
• Concentrated Solar Power (CSP) for Gold Plant
• Compressed air leak detection and fixing at KDC West.
• KDC fans Impeller efficiency – axial flow fans.
• Heat recovery from compressors.
• 3CPS.
Counter measures taken
23

New Initiatives
Heat recovery from Compressors
24
Pump 1
Existing Cooling Tower
Existing Aftercooler
Existing Aftercooler
Existing Aftercooler
Compressed Air To
Underground Users
New Heat Exchanger
New Heat Exchanger
New Heat Exchanger
Compressor with Intercoolers
Compressor with Intercoolers
Compressor with Intercoolers
Pump 2
Pump 3
Hot Water (60 C) to Storage Tank
Cold Water Return
Thermal Storage Tank (typically >400m3)
(to absorb variations in
supply and demand of hot water)
Pump 4
Cold Water from RWB
ILH ILH
Showers Showers
Change House
Calorifier
Hot Water Return
Hot Water Supply A B A B
Valve opens when flow to
showers is zero, and vice
versa
Valve A normally open and Valve B closed.
When no hot water in Storage tank or when no discharge pressure on Pump 4, then Valve A closed and Valve B open.
HOSTEL AREA
COMPRESSOR HOUSEExisting In-Line Heaters (ILH) are only on standby. Their electrical energy consumption are replaced by the thermal energy from the compressor heat recovery system.

•KDC West 5 Shaft - 4.337 MW
•KDC West 1 Shaft – 5.843 MW
•KDC East 4 Shaft – 3 MW
3CPS
New Initiatives
25

New Initiatives
26

New Initiatives
3CPS.
27
FRIDGE SURFACE
PRV PRV PRV PRV PRV
50,5L
42L 44L 46L 48L 50L
23L
21L
IPC 3.8 MW Turbine
3CPS
|c
c
42 L
23L
42L
LP filling pump
1.0Ml
Balance
dam
FRIDGE SURFACE
PRV PRV PRV PRV PRV
50,5L
42L 44L 46L 48L 50L
23L
21L
IPC
3CPS
|c
c
|c
c
42 L
23L
42L
LP filling pump
21L Booster pump
Bypass dissipator
KDC West 5# 42L--De-watering reticulation after 3CPS

Questions ?
28