KC Push Reports
16
PUSH REPORTING CONSUMER DIRECT 2013 NEXT GEN™ This presentation is part NEXT-GEN, an initiative focused on improving the existing operational processes at Kenneth Cole Productions, Inc. & Ted Givan - Great Chicago District Manager Produced by: Jason Telmos STORE MANAGER - HILTON HEAD #163
description
Â
Transcript of KC Push Reports
PUSH REPORTING CONSUMER DIRECT 2013
NEXT GEN™This presentation is part NEXT-GEN, an initiative focused on improving the existing operational processes at Kenneth Cole Productions, Inc.
&Ted Givan - Great Chicago District Manager
Produced by: Jason TelmosSTORE MANAGER - HILTON HEAD #163

REPORTINGAs we continue to grow our business, the need to deliver useful data and information to our Store Managers becomes increasingly more necessary. To deliver effective information, we will catego-rize reports into one of four categories.
REPORT FREQUENCYIn order to get the correct information to our managers at the right time, we will categorize re-ports into one of four frequency categories.
MID-DAY MONTHLYWEEKLYDAILY
HUMAN RESOURCES
INVENTORY MANAGEMENT
PAYROLL REPORTS
SALES REPORTS
-Head Count -Non Active Report
-Training Completion -PTO Used/Remaining
-Current Inventory -Units In Transit
-Sell Through (By SKU) -Fashion Sell Through
-Sales to Plan/LY -Traffic & KPI’s -Payroll Results -PT Over 25hrs,
-Individual SPH -Individual CSM Shifts
-Sales to Plan/LY -Traffic & KPI’s -Large Sales
2 Kenneth Cole Inc.
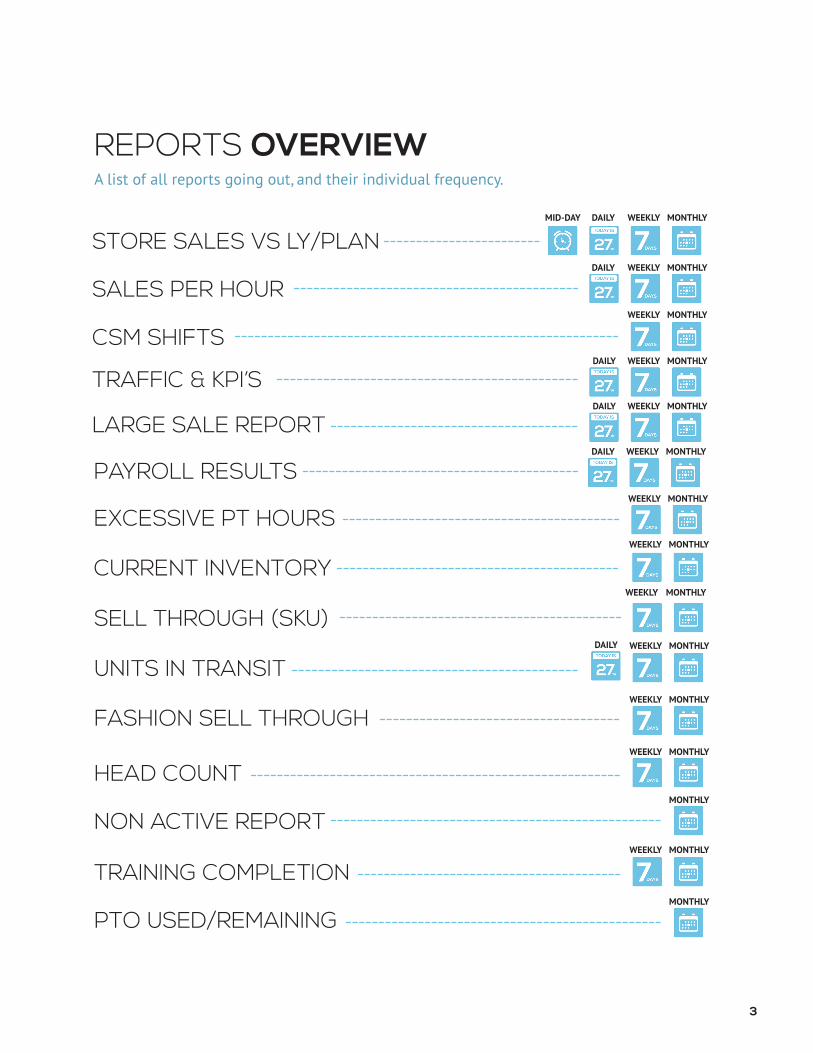
REPORTS OVERVIEWA list of all reports going out, and their individual frequency.
CURRENT INVENTORY
DAILY
WEEKLY
WEEKLY
WEEKLY
WEEKLY
WEEKLY
WEEKLY
MONTHLY
MONTHLY
MONTHLY
MONTHLY
MONTHLY
MONTHLY
MONTHLY
MONTHLY
SELL THROUGH (SKU)
NON ACTIVE REPORT
HEAD COUNT
UNITS IN TRANSIT
TRAINING COMPLETION
FASHION SELL THROUGH
PTO USED/REMAINING
DAILY WEEKLY
WEEKLY
MONTHLY
MONTHLY
PAYROLL RESULTS
EXCESSIVE PT HOURS
STORE SALES VS LY/PLANMID-DAY DAILY
DAILY
DAILY
DAILY
WEEKLY
WEEKLY
WEEKLY
WEEKLY
WEEKLY
MONTHLY
MONTHLY
MONTHLY
MONTHLY
MONTHLY
SALES PER HOUR
CSM SHIFTS
TRAFFIC & KPI’S
LARGE SALE REPORT
3

SALES REPORTS
SALES PER HOUR ACTUAL SALES PLAN SALES HOURS WORKED PLAN SPH ACTUAL SPH (+/-)
Jason Telmos 7,895 5,514 40 137.87 190.87 +38%
Ginger Glover 7,134 5,514 40 137.87 178.35 +29%
Hilton Head 25,678 24,816 180 137.87 142.65 +21%
STORE SALES ACTUAL SALES LY SALES % LY SALES PLAN SALES % PLAN SALES STORE RANK
Hilton Head 14,678 11,367 +29% 13,456 +9% 7
Myrtle Beach II 18,768 14,623 +27% 16,768 +12% 8
Greater Chicago 1,879,234 1,456,298 +12% 1,678,123 +4% n/a
CSM SHIFTS CSM HOURS CSM SALES CSM GOAL CSM UPT CSM ADT CSM CONV
Jason Telmos 27 14,789 12,567 2.09 64.11 24%
Ginger Glover 19 11,789 9,876 2.02 66.11 23%
Hilton Head Mgrs 46 26,578 22,443 2.01 65.43 24%
TRAFFIC/KPI’S TRAFFIC % LY TRAFFIC % LY SALES UPT ADT CONVERSION
Hilton Head 27 14,789 12,567 2.09 64.11 24%
Myrtle Beach II 19 11,789 9,876 2.02 66.11 23%
Greater Chicago 46 26,578 22,443 2.01 65.43 24%
STORE EMPLOYEE SALE UNITS AUR
Hilton Head Jason Telmos 847 12 70.55
Myrtle Beach II Heather Florez 901 11 81.09
Managers currently receive a number of sales related reports, all of which are useful and need to continue. The ad-dition of a CSM report, SPH report, and Large Sale report would allow managers to better track their teams perfor-mance, as well as their own.
STORE SALES VS LY/PLANMID-DAY DAILY
DAILY
DAILY
DAILY
WEEKLY
WEEKLY
WEEKLY
WEEKLY
WEEKLY
MONTHLY
MONTHLY
MONTHLY
MONTHLY
MONTHLY
SALES PER HOUR
CSM SHIFTS
TRAFFIC & KPI’S
LARGE SALESRecognizing sales over $250/$500
4 Kenneth Cole Inc.

STORE SALES ALLOTTED HOURS
10,000 180
13,000 180
16,000 185
19,000 190
22,000 193
25,000 195
28,000 200
31,000 205
33,000 210
36,000 213
39,000 220
DAILY WTD MTD
LY TRAFFIC 123 1,238 3,923
TRAFFIC TREND -8% -8% -8%
CONV TREND 24% 24% 24%
ADT TREND 64.99 64.99 64.99
FORECASTED SALES 1,746 17,768 56,301
PLAN SALES 1,654 16,345 54,123
LY SALES 1,421 15,457 53,892
HOURS ALLOTTED 27 185 740
HOURS SCHEDULED 27 190 747
HOURS TO ADD/CUT 0 -5 -7
PAYROLL REPORT PLAN SALES ACTUAL SALES PLAN HOURS ACTUAL HOURS VARIANCE SPH
Hilton Head 10,145 12,456 185 180 (5) 70.01
Myrtle Beach II 16,361 16,004 188 186 (2) 85.58
Greater Chicago 293,263 238,478 2540 2506 (34) 115.52
Hilton Head HOURS WORKED
John Smith 27
Sally Johnson 28
Greater Chicago
Myrtle Beach II HOURS WORKED
Tyler Rodgers 27
Ashley Smith 28
Greater Chicago
Gurnee Mills HOURS WORKED
John Smith 27
Sally Johnson 28
Greater Chicago
PAYROLL REPORTSIn an effort to better control payroll, several payroll reports can be utilized to provide the correct information so managers are always knowledgeable about their daily, weekly, and monthly payroll expectations. To make this easier, and in turn improve our payroll performance, the introduction of a standardized payroll ladder could introduced. This ladder would base weekly hours solely on the volume of sales made, and coupled with a new Payroll Forecaster™ will give managers a clear picture of their payroll performance, and what needs to be done to ensure they meet their goals.
DAILY WEEKLY
WEEKLY
MONTHLY
MONTHLY
PAYROLL MATRIX PAYROLL FORECASTER™NEW! NEW!
PAYROLL RESULTS
EXCESSIVE PT HOURS
5

INVENTORY REPORTS
STORE SALES INV UNITS LY INV UNITS % LY UNITS INV $ LY INV$ % LY INV$
Hilton Head 9,729 8,559 +13.7% 592,106 491,286 +20%
Myrtle Beach II 8,047 8,515 -5.5% 513,389 501,959 +3%
Greater Chicago 1,879,234 1,456,298 +12% 1,678,123 +4% n/a
A list of Inventory Management Reports.
CURRENT INVENTORY
DAILY
WEEKLY
WEEKLY
WEEKLY
WEEKLY
MONTHLY
MONTHLY
MONTHLY
MONTHLY
SELL THROUGH (SKU)
UNITS IN TRANSIT
FASHION SELL THROUGH
6 Kenneth Cole Inc.

HUMAN RESOURCES REPORTSA list of Human Resource Department Reports.
WEEKLY
WEEKLY
WEEKLY
WEEKLY
MONTHLY
MONTHLY
MONTHLY
MONTHLY
NON ACTIVE REPORT
HEAD COUNT
TRAINING COMPLETION
PTO USED/REMAINING
7

Developing A Better Way
Collating all of these reports into one central location, and displaying them in
meaning full, understandable ways, will give our managers a look at their business
they’ve never seen before.
Increasing the number of reports
that go out to our managers will al-
low them to stay more informed, and
give them access to data in a way they
haven’t had. But an increase in reports
means an increase in complexity, time,
spent, and analysis. Ideally, our manag-
ers need a way to review all of their
data simply, easily, and clearly.
Much of the data our managers will
use comes in the form of lengthy Excel
spreadsheets. While the data they con-
tain is very useful, when displayed inef-
ficiently, this data can become difficult
to comprehend, and can lose its utility.
LOOKING FORWARD
I
8 Kenneth Cole Inc.

9

INTRODUCING DASHBOARD™
A NE W PER SPEC TIVE ON REPOR TING
10 Kenneth Cole Inc.
11

MESSAGES
KNOW YOUR GOALS
WHAT’S NEXT?
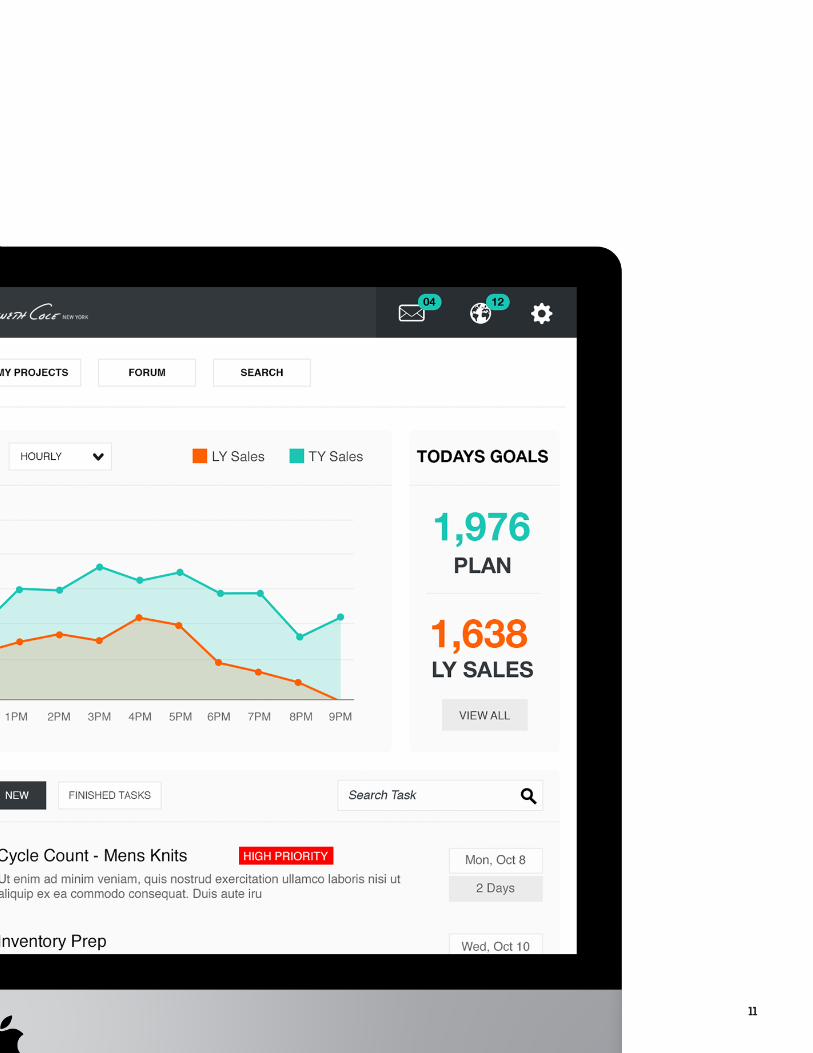
The main screen of the Kenneth Cole Dashboard shows you all com-munication coming from corporate, your DM, or other stores. It’s easily accessible from any screen in the Dashboard™ App.
On the right hand side is a quick overview of your daily goals such as Plan Sales and Last Year Sales. It even shows a graph plotting last years hourly performance to this years, so you always know how you’re trending
At any given time, there are hun-dreds of things that Store Man-agers need to worry about. With Dashboard™, all of your To-Do’s are kept straight for you on the overview page. They let you know what’s
12 Kenneth Cole Inc.

EASY TO NAVIGATE
TOTAL ACCESS
MANAGING PEOPLE
The left hand side of your Dashboard™ gives you access to
everything you need. You can edit your profile, view sales reports, or even complete Cycle Counts on In
The Black.
With access to Sales Reports and Payroll Reports, you’ll never have
to go searching for an Excel Sheet again. All your stores information is
stored on the Dashboard™ and is presented to you in easy to under-
stand graphs and tables.
The Human Resources tab of the Dashboard™ will allow you to re-
view your head count, add new employees, terminate old ones, and complete training guides like Code
of Conduct and KCREHAB.

14 Kenneth Cole Inc.


![[ILLEGAL PUSH-BACKS AND BORDER VIOLENCE REPORTS] April, … · 2019-05-13 · [ILLEGAL PUSH-BACKS AND BORDER VIOLENCE REPORTS] April, 2019 Bihać and Velika Kladuša residents are](https://static.fdocuments.us/doc/165x107/5e92f3b4e4d92b3428639aa6/illegal-push-backs-and-border-violence-reports-april-2019-05-13-illegal-push-backs.jpg)


![Le Châtelier’s principle. The significance of Kc values Kc = Products Reactants Kc = Products Reactants If Kc is small (0.001 or lower), [products] must.](https://static.fdocuments.us/doc/165x107/56649cff5503460f949cff35/le-chateliers-principle-the-significance-of-kc-values-kc-products-reactants.jpg)