
Brief description of two-phase systems Case study BioFerm ...

K&C Phase 3 – Brief project essentials
Climate-Relevant Modernization of the National Forest Policy and Piloting of REDD+ Measures in the Philippines
Mari Trix L. Estomata 1, Jose Don T. De Alban 2,Angelica Kristina V. Monzon 2, Enrico C. Paringit 3
and Francisco B. Tavora, Jr. 1
1 Deutsche Gesellschaft für Internationale Zusammenarbeit (GIZ PH)2 Fauna & Flora International (FFI)
3 Department of Geodetic Engineering, University of the Philippines (UP-DGE)
Science Team meeting #20 – Phase 3RESTEC HQ, Roppongi, Tokyo, Dec2-6, 2013
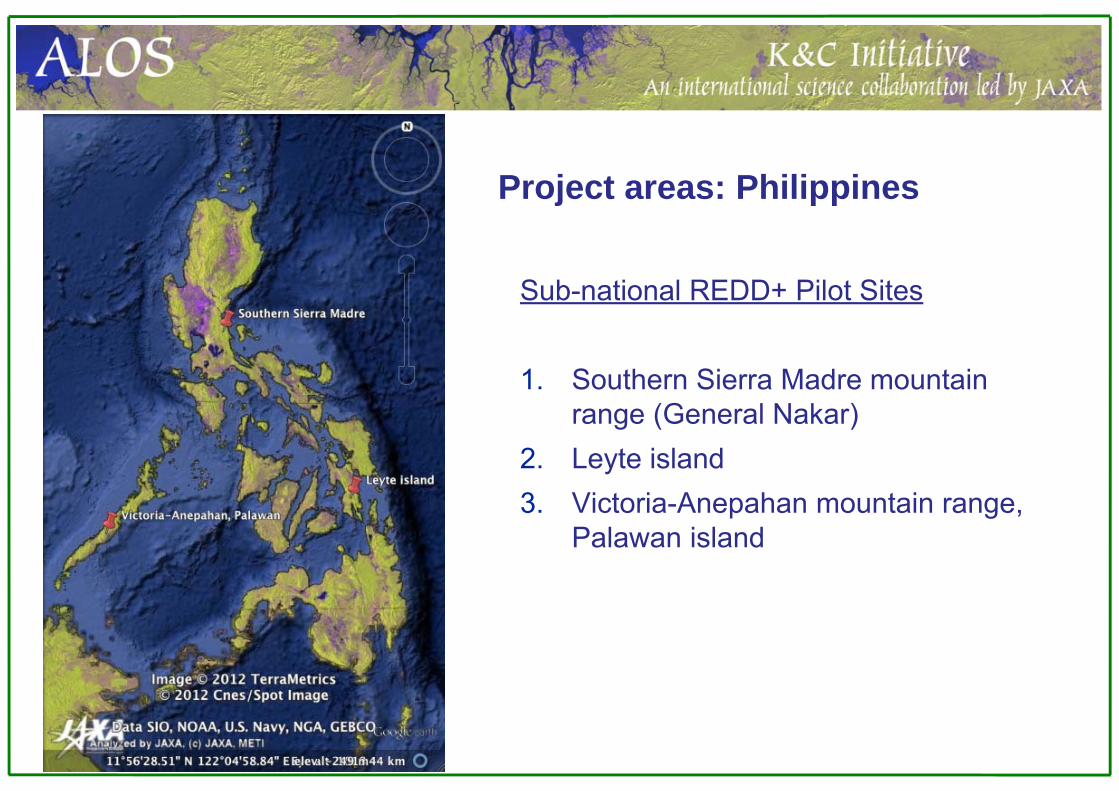
Sub-national REDD+ Pilot Sites
1. Southern Sierra Madre mountain range (General Nakar)
2. Leyte island3. Victoria-Anepahan mountain range,
Palawan island
Project areas: Philippines
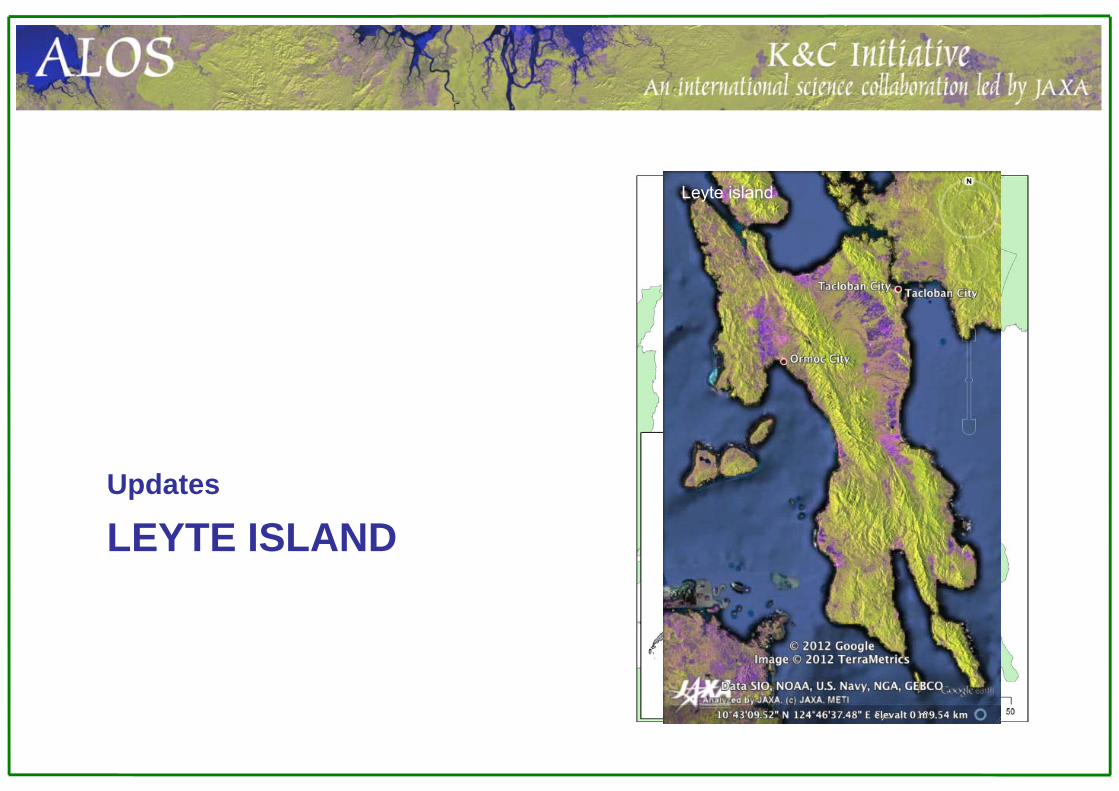
LEYTE ISLANDUpdates
Leyte island

RS Workflow of Methodology:

7-Layer Stack: Radar Cross-section Values of:
HH Band HH_dB HV Band HV_dB
Indices:
∙
∗
, Normalized Difference Index
Methodology: Bands & ROIs
40 samples/polygons per ROI
At least 4 hectares for each polygon
20 polygons used to train the classifiers; 20 polygons used for accuracy assessment – selected using Random Generator Code (Excel)
No sampling scheme was undertaken because the high-resolution images taken on year 2010 were available only on selected portions of Leyte Island.
Still, the ROIs selected were evenly spread throughout the Island, as much as the available high-resolution data could possibly allow.

ROI Separability
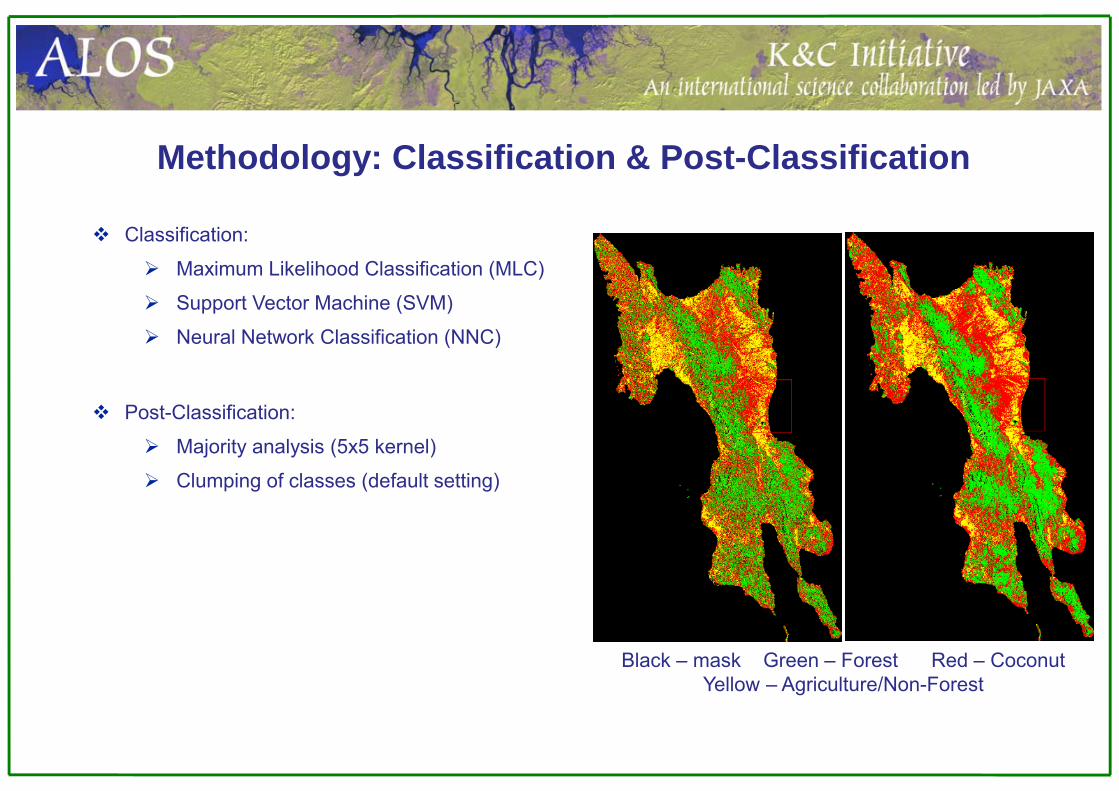
Methodology: Classification & Post-Classification
Classification:
Maximum Likelihood Classification (MLC)
Support Vector Machine (SVM)
Neural Network Classification (NNC)
Post-Classification:
Majority analysis (5x5 kernel)
Clumping of classes (default setting)
Black – mask Green – Forest Red – CoconutYellow – Agriculture/Non-Forest

Results & Discussions: AccuracyComplete error matrix for the post-classified neural network classification results for the 2010 radar image
Class Forest [%] Non-Forest [%] Palm [%] Total [%] User’s Accuracy [%]Unclassified 0.69 0.84 0.31 0.62Forest 90.98 0.00 10.71 33.96 89.60Non-Forest 3.62 89.32 0.94 31.51 95.17Palm 4.70 9.83 88.04 33.91 85.63Error of Omission 9.02 10.68 11.96 Overall Accuracy 89.4533Error of Commission 10.40 4.83 14.37 Kappa Coefficient 0.8423
Complete error matrix for the post-classified neural network classification results for the 2007 radar imageClass Forest [%] Non-Forest [%] Palm [%] Total [%] User’s Accuracy [%]Unclassified 0.69 1.15 10.16 3.97Forest 91.83 0.54 9.23 33.94 90.50NF 4.01 87.17 7.90 33.21 88.12Palm 3.47 11.14 72.71 28.88 83.04Error of Omission 8.17 12.83 27.29 Overall Accuracy 83.9608Error of Commission 9.50 11.88 16.96 Kappa Coefficient 0.7640
All Producer’s Accuracies and User’s Accuracies reach at least 85% and the errors of commission and omission are at a maximum of 15%. This is the reason why the NNC was the chosen classifier for the 2007 radar image.
Lowered accuracies could be due to the fact that the ROIs used to classify the 2007 radar image and ROIs used to check its results were selected during the year 2010 because high resolution images for year 2007 were very limited in Google Earth.

Results & Discussions: Accuracy
Thematic Change Detection StatisticsChange Area (ha) Percentage
Non-Forest to Forest 2,678.19 0.38Non-Forest to Palm 41,656.50 5.88
Forest to Non-Forest 3,251.25 0.46Forest to Palm 59,091.38 8.34
Palm to Non-Forest 16,272.56 2.30Palm to Forest 33,094.88 4.67
Doubtful change: 33,000 ha of palm areas changed back to forest in 3 years’ time:
might be due to the misclassification of palm areas in the 2007 forest cover map, as indicated by the low PA (72.71%) and high errors of commission (16.96%) and omission (27.29%).
Misclassifications could be due to the fact that the ROIs used to generate the said map were of year 2010.
Thus, in order to get a better change detection analysis/result, better classification would be required for year 2007.
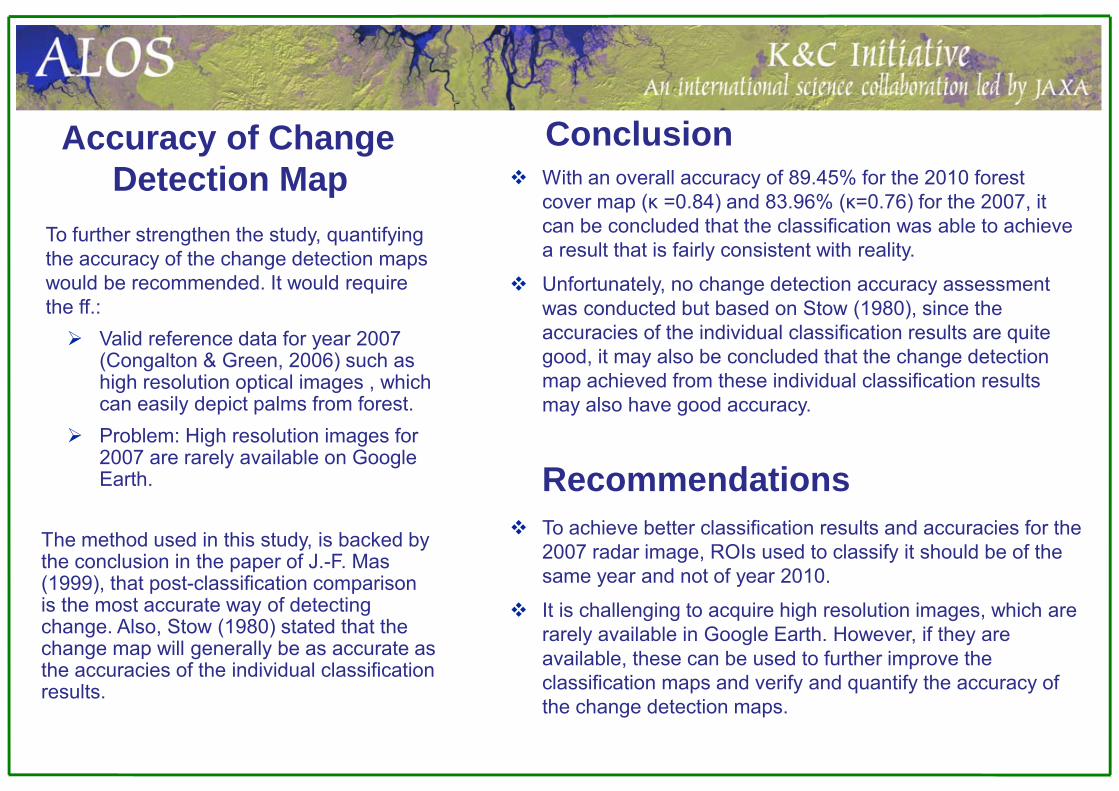
Accuracy of Change Detection Map
To further strengthen the study, quantifying the accuracy of the change detection maps would be recommended. It would require the ff.: Valid reference data for year 2007
(Congalton & Green, 2006) such as high resolution optical images , which can easily depict palms from forest.
Problem: High resolution images for 2007 are rarely available on Google Earth.
The method used in this study, is backed by the conclusion in the paper of J.-F. Mas (1999), that post-classification comparison is the most accurate way of detecting change. Also, Stow (1980) stated that the change map will generally be as accurate as the accuracies of the individual classification results.
Conclusion With an overall accuracy of 89.45% for the 2010 forest
cover map (κ =0.84) and 83.96% (κ=0.76) for the 2007, it can be concluded that the classification was able to achieve a result that is fairly consistent with reality.
Unfortunately, no change detection accuracy assessment was conducted but based on Stow (1980), since the accuracies of the individual classification results are quite good, it may also be concluded that the change detection map achieved from these individual classification results may also have good accuracy.
Recommendations To achieve better classification results and accuracies for the
2007 radar image, ROIs used to classify it should be of the same year and not of year 2010.
It is challenging to acquire high resolution images, which are rarely available in Google Earth. However, if they are available, these can be used to further improve the classification maps and verify and quantify the accuracy of the change detection maps.

UPDATES
Palawan Victoria Anepahan Mountain Range
Victoria-Anepahanmountains, Palawan

LocationREDD+ Demo Area:Reference area: Mt. Mantalingahan (as prescribed under requirements of chosen VCS methodology of the projectREDD+ project area in Victoria-Anepahan Mt. Range: Selected barangays (total of 10) in the municipalities of Narra & Quezon, Palawan
- extent of N9-10 & E117-118E
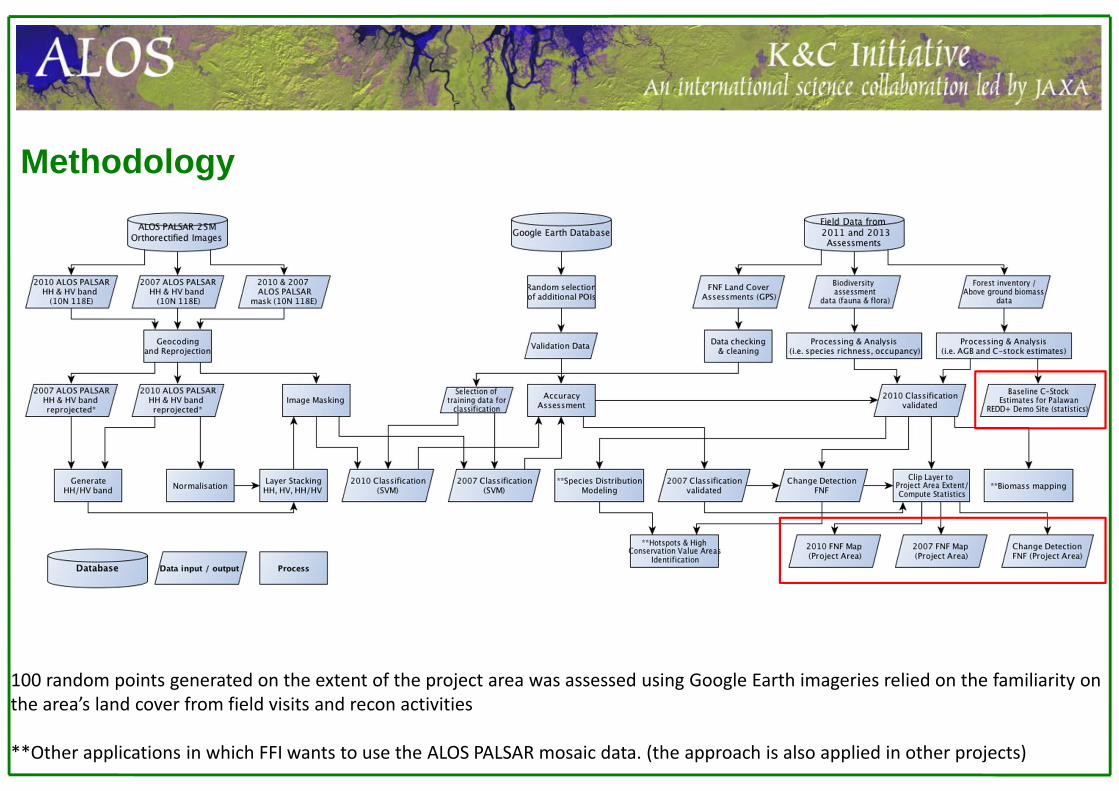
Methodology
100 random points generated on the extent of the project area was assessed using Google Earth imageries relied on the familiarity on the area’s land cover from field visits and recon activities
**Other applications in which FFI wants to use the ALOS PALSAR mosaic data. (the approach is also applied in other projects)

250 M
250 M x 8 segments = 2KM Transect 9 Forest Inventory Plots
Transect/Plot Design
Figure 2. Biodiversity transect line (same with Figure 1) and point sampling plot.
Stations = every 250M distanceSub‐stations= every 50M distance
Figure 1. 2KM long transect line and forest inventory sampling plots placed at 250M intervals.
• Time to survey ‐ average of 1 day/plot with at least 7 team members• Half day to establish the plot, 1 day to complete the inventory

250 M
250 M x 8 segments = 2KM Transect 9 Forest Inventory Plots
Transect/Plot Design
Figure 1. 2KM long transect line and forest inventory sampling plots placed at 250M intervals.
250 M
250 M x 8 segments = 2KM Transect 9 Forest Inventory Plots
Figure 3. Every station/plot #5 in each transect also has forest inventory data with a 100x100m (1Ha) plot size. Comprised of four 50x50m plot, as illustrated.
We did this because literature suggests that to compute/model biomass maps, we need to have at least 1Ha‐4Ha plot sizes. We will use this to explore this.
Time to survey this is average of 2‐2.5 days per 1‐hectare plot with at least 7 team members.

250 M
250 M x 8 segments = 2KM Transect 9 Forest Inventory Plots
Transect/Plot Design
Figure 1. 2KM long transect line and forest inventory sampling plots placed at 250M intervals.
Figure 4. Forest inventory plot sampling configuration

Transect/Plot Design
Figure 5. Canopy Cover Assessment using densitometer
• A densitometer has a scope, with a cross hair in the middle. Presence/absence is noted. i.e. if there is canopy upon looking into the scope, it is noted as 1, zero if no canopy or if sky is seen.
• Measured along the diamond transect established inside the plot at 1 meter interval.

Field Data (Transects/Plots)5 transects established for forest inventory & biodiversity assessments in our project accounting areas (PAA)Covered Municipalities (PAA):
Narra & Quezon, Barangays:
Estrella, Narra (1 transect)Malinao, Narra (2 transects)Aramaywan, Quezon (2 transects)
Forest Inventory Plots 9 (50mX50m) forest inventory plots for
each transect. Total of 45 plots for the 5 transects.
1 (100mX100m) forest inventory plot per transect. Total of 5 one-hectare plots for the 5 transects.
• Transects are located within the project accounting areas. (in the mentioned barangays)• Due to limitations of permits for the area, we cannot collect data from other barangays.

ROI Separability
Computed ROI separability between forest and non-forest = 1.928

Forest Cover Maps
Classes 2007 2010 Net ChangeForest cover 218,026.31 215,216.69 (2,809.63)Non‐forest cover 122,697.75 125,507.38 2,809.63
Classes 2007 2010 Net ChangeForest cover 37,140.55 35,994.98 (1,145.57)Non‐forest cover 17,804.80 18,950.37 1,145.57
Project Area
Area covered by image tile 10N 118E
*remaining percent cover is attributed to masked pixels of 2007 & 2010
Palawan REDD+ Demo Site 2010 FNF Map

Accuracy Assessments
Confusion Matrix for Forest Cover 2007Ground Truth (%)
ClassNon –Forest Forest Total
Non – Forest 76.79 3.23 38.14Forest 23.21 96.77 61.86Total 100 100 100
2007 Accuracy (%)Class NForest ForestProducer's 76.79% 96.77%User's 96.77% 82.19%Overall 87.28%Kappa 0.74
2010 Accuracy (%)Class NForest ForestProducer's 85.71% 96.83%User's 96% 88.41%Overall 91.60%Kappa 0.83
Confusion Matrix for Forest Cover 2010Ground Truth (%)
ClassNon –Forest Forest Total
Non – Forest 85.71 3.17 42.02Forest 14.29 96.83 57.98Total 100 100 100
• We do not have 2007 data, but the forest locations used in training data – we were sure that they have been forest for the past 10 years We had to check this as requirement of the VCS method
• Also non‐forest because they were mostly agriculture and built‐up were used for training data.• Validation data should be checked again for 2007 to improve accuracy.

Change Detection Results
STATE Hectares PercentageForest remaing as forest 198,868.31 92.13Non‐forest remaining asnon‐forest 106,349.38 84.24Forest converted to non‐forest 19,158.00 15.18Non‐forest converted to forest 16,348.38 7.57
STATE Hectares PercentageForest remaing as forest 33,594.37 90.22Non‐forest remaining asnon‐forest 15,404.19 81.06Forest converted to non‐forest 3546.18 18.66Non‐forest converted to forest 2400.61 9.52
Project Area
Area covered by image tile 10N 118E
*remaining percent cover is attributed to masked pixels of 2007 & 2010

Deliverables
Deliverables required LEYTE *PALAWAN GENERAL NAKAR
1. Forest cover and change maps produced Complete Complete
Field assessmentsscheduled on January-
February 2014
2. Deforestation rates determined Complete Complete TBD
3. Baseline forest carbon stocks established Complete Complete
Field methods/approaches are recalibrated (based from
experiences in PLW)
4. Image processing methodologies and accuracy assessments documented
CompleteWriting of
Manuals/Documentations are on-going
Acquired 2012 RapidEyeimages for southern part of
General Nakar (can be used for validation/accuracy
assessments)
*More of the results will be presented in the next Science Meeting


![PSC Post-Trial Brief (Phase One) [Doc 10458] 6-21-2013](https://static.fdocuments.us/doc/165x107/577cdbc21a28ab9e78a8ff73/psc-post-trial-brief-phase-one-doc-10458-6-21-2013.jpg)


![State of LAs Post Trial Brief Phase I [Doc. 10462 - 6.21.2013]](https://static.fdocuments.us/doc/165x107/577cdbc21a28ab9e78a8ff75/state-of-las-post-trial-brief-phase-i-doc-10462-6212013.jpg)


