KBC Group - cibank.bg presentation_1Q17...security issued by the KBC Group. KBC believes that this...
24
KBC Group 1Q2017 results Press presentation Johan Thijs, CEO KBC Group Rik Scheerlinck, CFO KBC Group More detailed analyst presentation available at www.kbc.com
Transcript of KBC Group - cibank.bg presentation_1Q17...security issued by the KBC Group. KBC believes that this...

1
KBC Group 1Q2017 results Press presentation
Johan Thijs, CEO KBC GroupRik Scheerlinck, CFO KBC Group
More detailed analyst presentation available at www.kbc.com

2
This presentation is provided for information purposes only. It does not constitute an offer to sell or the solicitation to buy anysecurity issued by the KBC Group.
KBC believes that this presentation is reliable, although some information is condensed and therefore incomplete. KBC cannot beheld liable for any loss or damage resulting from the use of the information.
This presentation contains non-IFRS information and forward-looking statements with respect to the strategy, earnings and capitaltrends of KBC, involving numerous assumptions and uncertainties. There is a risk that these statements may not be fulfilled andthat future developments differ materially. Moreover, KBC does not undertake any obligation to update the presentation in linewith new developments.
By reading this presentation, each investor is deemed to represent that it possesses sufficient expertise to understand the risksinvolved.
Important information for investors

3
1Q 2017 key takeaways for KBC Group
STRONG BUSINESS PERFORMANCE IN 1Q17Excellent net result of 630m EUR in 1Q17, despite the large upfront bank taxes. ROE of 17% in 1Q17o Strong performance of the commercial bank-insurance franchises in our core markets and core activitieso Q-o-q increase in customer loan volumes and customer deposits in most of our core countrieso Lower net interest income and net interest margin q-o-q o Sharply higher net fee and commission income q-o-qo Slightly lower net gains from financial instruments at fair value and lower net other income, higher realised AFS gainso Exceptional combined ratio of 79% in 1Q17. Excellent sales of non-life products, while sales of life insurance products were
lowero Strict cost management resulted in a cost/income ratio of 52% in 1Q17 adjusted for specific items o Very low impairment charges due mainly to Ireland (net release of 50m EUR in 1Q17) and seasonal effects. The impairment
guidance for Ireland is updated towards a net release of a range of 120m-160m EUR for FY17
SOLID CAPITAL AND ROBUST LIQUIDITY POSITIONSo The B3 common equity ratio based on the Danish Compromise at end 1Q17 amounted to 15.9% phased-in and 15.7% fully
loaded, which clearly exceeds the minimum capital requirements set by the ECB / NBB of respectively 8.65% and 10.40% for2017
o On top of the above-mentioned capital requirements, the ECB expects KBC to hold a pillar 2 guidance (P2G) of 1.0% CET1o Fully loaded B3 leverage ratio, based on current CRR legislation, amounted to 5.7% at KBC Groupo Continued strong liquidity position (NSFR at 130% and LCR at 145%) at end 1Q17
We will organise a KBC Group investor visit in Dublin on Wednesday 21 June 2017

4
KBC GroupConsolidated results1Q 2017 performance

5
KBC Group: Strong business performance in 1Q 2017
Net result
630685
392
-8%
+61%
1Q 20171Q 2016 4Q 2016
Amounts in millions of EUR
6
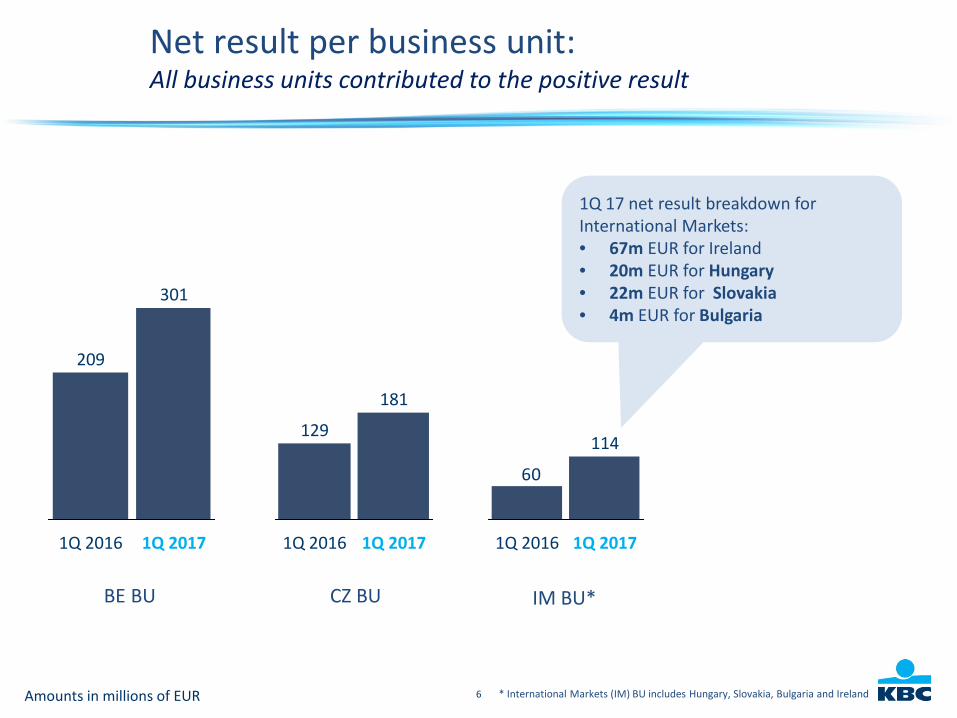
209
1Q 2016 1Q 2017
301
1Q 2016
129
1Q 2017
181
60
1Q 2016 1Q 2017
114
Amounts in millions of EUR
BE BU CZ BU IM BU*
Net result per business unit:All business units contributed to the positive result
* International Markets (IM) BU includes Hungary, Slovakia, Bulgaria and Ireland
1Q 17 net result breakdown forInternational Markets: • 67m EUR for Ireland• 20m EUR for Hungary • 22m EUR for Slovakia• 4m EUR for Bulgaria

7
Q-o-q decrease in NIM dueto lower reinvestment yields,decline in net interest incomefrom the dealing room andpressure on commercial loanmargins in most corecountries. Only partly offsetby lower funding costs andthe further positive effect ofenhanced ALM management.
Net interest income: Lower Net Interest Income (NII) and Net Interest Margin (NIM)
NII down 3% q-o-q (and 4% y-o-y):(+) lower funding costs, continued volume growth incurrent accounts and loans and further positive effect ofenhanced ALM management.(-) lower reinvestment yields, more negative NII fromdealing room activities, pressure on commercial loanmargins in most core countries, lower number of days andslightly lower upfront prepayment fees.
Amounts in millions of EUR
1 025 -4%
-3%
1Q 20174Q 2016
1 057
1Q 2016
1 067
1Q16 4Q16 1Q171.96% 1.90% 1.88%
Net Interest Margin

8
Up y-o-y thanks to a goodcommercial performance in allmajor product lines in our coremarkets and tariff increases
Non-life insurance:Strong performance for non-life sales, excellent combined ratio
Amounts in millions of EUR
FY
93%
9M
94%
1H
95%
1Q
79%91%
20172016
360341
1Q 2016
+6%
1Q 2017
Gross earned premiumsnon-life insurance
An excellent 79%, an improvement comparedwith 93% in FY16 due to extremely lowtechnical charges (in all countries, except for theCzech Republic) resulting from mild winterconditions. 1Q16 was negatively impacted byone-off charges due to terrorist attacks inBelgium.
Combined ratio non-life

9
Decreased by 9% q-o-q driven mainly by lower sales of guaranteed interest rateproducts in Belgium (attributable chiefly to traditionally higher volumes in tax-incentivised pension saving products in 4Q16) and lower sales of unit-linked products inthe Czech RepublicDecreased by 19% y-o-y mainly by lower sales of guaranteed interest products inBelgium (driven by reduced guaranteed interest offered) and lower sales of unit-linkedproducts in the Czech Republic
Life insurance: Premium income down q-o-q
Gross earned premiums Life insurance
312
413426-27%
-24%
1Q 20174Q 20161Q 2016
Amounts in millions of EUR
235 204 207
353318 267
474 -19%
-9%
1Q 20174Q 2016
522
1Q 2016
587
Unit-linked productsGuaranteed interest rate products
Life sales

10
Net fee and commission income:Higher fee and commission income
Net fee and commission income Assets under management (AUM)
Q-o-q increase was the result chiefly of:- higher management fees from mutual funds & unit-linked life insurance products
(thanks mainly to a good equity market performance)- higher entry fees from mutual funds and unit-linked life insurance products due to the
successful shift to the new discretionary based service proposition in Belgiumpartly offset by:- lower fees from credit files and bank guarantees (due mainly to less mortgage
refinancing's in Belgium & Slovakia and specific event fees in 4Q16)- slightly lower fees from payment services (seasonal effect)
Up q-o-q owing entirely to a positiveprice effect.Increased y-o-y owing to net outflows(-2%) and a positive price effect (+6%)
Amounts in millions of EUR (left chart) Amounts in billions of EUR (right chart)
439376346 +27%
+17%
1Q 20174Q 20161Q 2016
216213207+4%
+1%
1Q 20174Q 20161Q 2016

11
Net gains on financial instruments at fair value:Lower fair value gains q-o-q
Q-o-q decrease attributable to:- a negative change in ALM derivatives (1m EUR in 1Q17 compared with 59m EUR in 4Q16) due
to a negative mark-to-market value of EUR/CZK FX swaps in 1Q17 and higher increase of IRSrates in 4Q16.
partly offset by:- a positive change in market, credit and funding value adjustments (mainly as a result of changes
in the underlying market value of the derivatives portfolio)- better dealing room income
191
224
93
1Q 20174Q 2016
-15%
+105%
1Q 2016
Amounts in millions of EUR

12
Q-o-q, increase in gains on both on bonds and shares
The other net income drivers:Higher gains realised on AFS assets and lower other net income
Gains realised on AFS assets
458
27
1Q 20174Q 20161Q 2016
Amounts in millions of EUR
77101
51
1Q 20174Q 20161Q 2016
Other net income
Other net income higher than the normal run rate ofaround 50m EUR thanks to the settlement of an oldlegal file
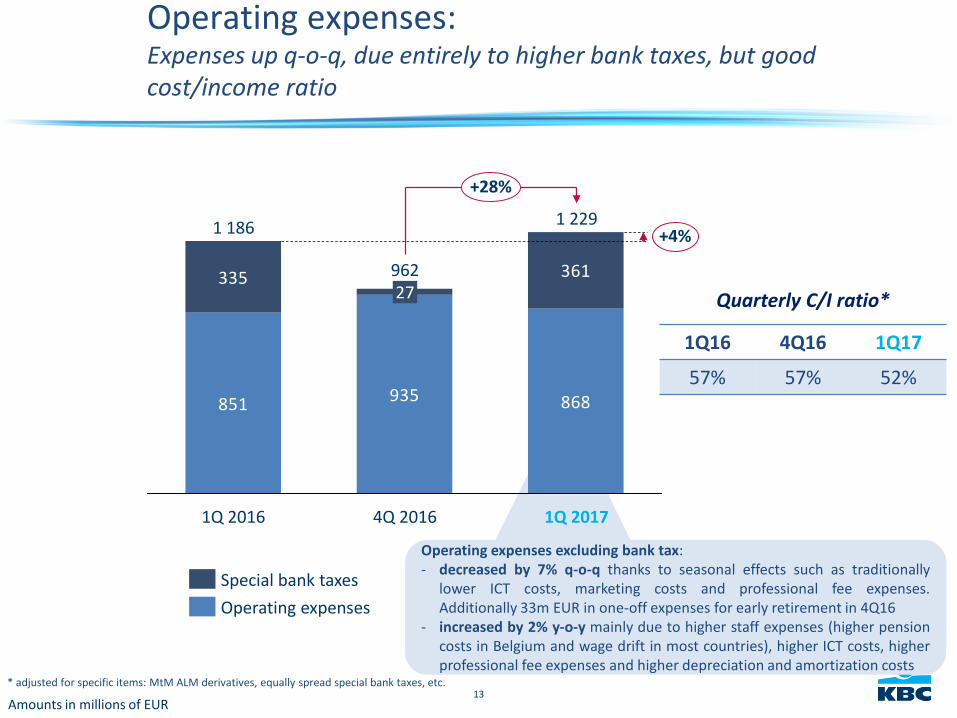
13
Operating expenses excluding bank tax:- decreased by 7% q-o-q thanks to seasonal effects such as traditionally
lower ICT costs, marketing costs and professional fee expenses.Additionally 33m EUR in one-off expenses for early retirement in 4Q16
- increased by 2% y-o-y mainly due to higher staff expenses (higher pensioncosts in Belgium and wage drift in most countries), higher ICT costs, higherprofessional fee expenses and higher depreciation and amortization costs
Operating expenses:Expenses up q-o-q, due entirely to higher bank taxes, but goodcost/income ratio
851 935 868
335 361
1Q 20174Q 2016
96227
1Q 2016
1 186
+28%
+4%1 229
Operating expensesSpecial bank taxes
* adjusted for specific items: MtM ALM derivatives, equally spread special bank taxes, etc.
Amounts in millions of EUR
1Q16 4Q16 1Q17
57% 57% 52%
Quarterly C/I ratio*

14
2017
278
2016
273
241
32
2017
26
2016
27
28-1
2017
57
2016
135
61
74
437
102
20172016
361335
Amounts in millions of EUR
Special bank taxes1:Represent 11.6% of operational expenses in 1Q17 (pro rata)
1 This refers solely to the bank taxes recognised in OPEX, and as such it does not take account of income tax expenses, non-recoverable VAT, etc.
2 International Markets (IM) BU includes Hungary, Slovakia, Bulgaria and Ireland3 KBC Group also includes the Group Centre
BE BU CZ BU IM2 BUKBC Group3
11.3% of OPEX 1Q17 (pro rata)
4.5% of OPEX 1Q17 (pro rata)
19.5% of OPEX 1Q17 (pro rata)
In 2Q16, the Belgian government replaced the four existingtaxes by one, which led to 38m EUR in additional bank taxes inBelgium, partly offset by the ability to book 6m EUR of the ESRFcontribution being booked as a non-P&L item
1Q 2Q16 till 4Q16
11.6% of OPEX 1Q17 (pro rata)

15
The q-o-q decrease in loan loss provisions was attributable mainly to:- net loan loss provision releases of 50m EUR in Ireland (compared
with 12m EUR in 4Q16)- despite relatively high gross impairments charges in Belgium due to
two large corporate loans.
Asset impairments:Very low asset impairment and excellent credit cost ratio (historic average ’99-’15 of 0.52%)
Impairments on loans and receivables
Amounts in millions of EUR
6
54
4 +78%
1Q 20174Q 20161Q 2016
-88%
1Q16 4Q16 1Q17
0.01% 0.09% 0.02%
Credit cost ratio (YTD)
16
KBC GroupBalance sheet, capital and liquidity

17
Balance sheet (1/2):Loans and deposits continue to grow in most core countries
Deposits***
10%
4% 4%
MortgagesLoans**
* Volume growth making abstraction of Fx effects and divestments/acquisitions** Loans to customers, excluding reverse repos (and bonds)*** Customer deposits, including debt certificates but excluding repos.
Y-O-Y ORGANIC* VOLUME GROWTH FOR KBC GROUP

18
Balance sheet (2/2):Loans and deposits continue to grow in most core countries
Deposits***
11%
Mortgages
2%
Loans**
3%
12%
Loans**
9%
Deposits***
14%
Mortgages
Deposits***
-5%Mortgages
-2%
Loans**
-4%
Deposits***
3%
Mortgages
26%
Loans**
11%
Deposits***
13%
Mortgages
5%
Loans**
4%
-3%Loans**
12%
Mortgages
18%
Deposits**** Volume growth disregarding FX effects and divestments/acquisitions** Loans to customers including reverse repos (and bonds)*** Customer deposits, including debt certificates and including repos****Mortgages in Bulgaria: new business +2% q-o-q and +20% y-o-y, while legacy -8% q-o-q and -39% y-o-y
BECZ
Y-O-Y ORGANIC* VOLUME GROWTH FOR MAIN ENTITIES
****

19
Capital and liquidity ratios (1/2):Capital ratio resides comfortably above regulatory minimum
KBC Group Basel 3 CET1 ratio (Danish Compromise)
8.65% (*) regulatoryminimum for 2017
1Q17
15.9%
FY16
16.2%
9M16
15.1%
1H16
14.9%
1Q16
14.6%
10.40% (**) pro forma regulatory minimum
1Q17
15.7%
FY16
15.8%
9M16
15.3%
1H16
14.9%
1Q16
14.6%
Phased-in
Fully loaded
* Systematic buffer announced by the ECB: phased-in CET of 1.0% in 2017 under the Danish Compromise** Excludes a pillar 2 guidance (P2G) of 1.0% CET1

20
Capital and liquidity ratios (2/2):Liquidity continues to be strong
KBC Group’s liquidity ratios*
* Liquidity coverage ratio (LCR) and net stable funding ratio (NSFR) are calculated based on KBC’s interpretation of the current Basel Committee guidance, which may change inthe future. The LCR could be relatively volatile in future due to the way it is calculated, as month-to-month changes in the difference between inflows and outflows can causesignificant fluctuations in the ratio even if liquid assets remain stable
1Q 2017
130%
FY 2016
125%
NSFR
FY 2016
139% 145%
1Q 2017
LCR
Target ≥ 105%

21
KBC Group 1Q 2017wrap up

22
Wrap up
More detailed analyst presentation available at www.kbc.com.
Strong commercial bank-insurance results in our core countries
Successful underlying earnings track record
Solid capital and robust liquidity position

23
Looking forward
We expect 2017 to be a year of sustained economic growth in both the euro area andthe US
Management guides for: solid returns for all Business Units loan impairments for Ireland towards a release of 120m-160m EUR range for FY17
Besides the Belgium and the Czech Republic Business Units, the International MarketsBusiness Unit to become a strong contributor to the net result of KBC Group thanks to: Ireland: re-positioning as a core country with a sustainable profit contribution Bulgaria: after the acquisition of UBB and Interlease, UBB-CIBank and DZI will become the
largest bank-insurance group in Bulgaria with a substantial increase in profit contribution.The deal is expected to be closed in 2Q17

24
We put our clients centre stage and they keep counting on us to help them realise and protect their dreams. We do this proactively and work together
to help build society and create sustainable growth. We are genuinely grateful for the confidence they put in us.
Johan Thijs, CEO KBC Group