
Kashagan and Tengiz — Castor and · PDF fileKashagan and Tengiz – Castor and...
24
Kashagan and Tengiz – Castor and Pollux Daniel Johnston & Co., Inc. 1 Kashagan and Tengiz — Castor and Pollux Daniel Johnston and David Johnston Adapted from PetroMin Magazine – 15 December, 2001. The recently announced super giant Kashagan discovery in the Kazakhstan sector of the North Caspian Sea is the world’s largest discovery in three decades. Kashagan, located in shallow water, is an analog to the onshore Tengiz field located approximately 130 to 150 km (85 miles) to the southeast. Kashagan and Tengiz are the two largest fields in Kazakhstan—their oil reserves alone rival the United States 22 Billion barrels of oil, yet they have hardly begun to produce. Tengiz in 10 years of production has produced less than 10% of it’s recoverable reserves. And while Kashagan was only just discovered, there are other similar structures in the Kashagan license area that are yet undrilled. Overall, the development costs will likely cost tens of billions of dollars but revenues to the Contractor group (the oil companies) and the Kazakhstan Government could exceed one trillion dollars. The Kashagan prospect, (Figure 1) named after the great Kazakh poet, was identified by the Soviets in the early 1970s. However, the extremely promising prospect, located in an environmentally sensitive and high cost environment, was not drilled at that time. Three wells have been drilled on the structure since late 2000 and the prospect has lived up to it’s promise. Appropriately, the Kashagan production sharing agreement (PSA) is about as famous as the discovery. 1 Every single percentage point (1%) take (either Government or Contractor take) could represent from $1.5 to $2 billion in profits for the first 10 billion barrels alone. This is a big one. The discovery is rated at 6.4 to 100 billion barrels. 2 However, it is likely that a good working range might be somewhere on the order of 6.4 to 20 billion barrels of recoverable oil reserves—only three wells have been drilled. At 20 Billion barrels (if that is ultimately the figure) Kashagan would be the 5 th largest oil field in the world and the only one of the five outside the Arabian/Persian Gulf region. The discovery well Kashagan East-1 (KE-1), 47 miles southeast of Atyrau in 10 feet of water, encountered Paleozoic carbonates below 13,000 feet (3,960 m) and tested 3,700 BOPD and 7 MMCFD on a half-inch choke 3 . In May, 2001 ExxonMobil announced test rates on the Kashagan West-1 (KW-1) well located 40-48 km away (depending on the source) from the Kashagan East discovery well. The KW-1 test was also from Paleozoic Carbonates (limestone) below 13,800 ft (4,250 m) described as a Carboniferous-Devonian coral atoll.
Transcript of Kashagan and Tengiz — Castor and · PDF fileKashagan and Tengiz – Castor and...

Kashagan and Tengiz – Castor and Pollux Daniel Johnston & Co., Inc. 1
Kashagan and Tengiz — Castor and Pollux
Daniel Johnston and David Johnston
Adapted from PetroMin Magazine – 15 December, 2001.
The recently announced super giant Kashagan discovery in the Kazakhstan sector of the North Caspian Sea is the world’s largest discovery in three decades. Kashagan, located in shallow water, is an analog to the onshore Tengiz field located approximately 130 to 150 km (85 miles) to the southeast. Kashagan and Tengiz are the two largest fields in Kazakhstan—their oil reserves alone rival the United States 22 Billion barrels of oil, yet they have hardly begun to produce. Tengiz in 10 years of production has produced less than 10% of it’s recoverable reserves. And while Kashagan was only just discovered, there are other similar structures in the Kashagan license area that are yet undrilled. Overall, the development costs will likely cost tens of billions of dollars but revenues to the Contractor group (the oil companies) and the Kazakhstan Government could exceed one trillion dollars. The Kashagan prospect, (Figure 1) named after the great Kazakh poet, was identified by the Soviets in the early 1970s. However, the extremely promising prospect, located in an environmentally sensitive and high cost environment, was not drilled at that time. Three wells have been drilled on the structure since late 2000 and the prospect has lived up to it’s promise. Appropriately, the Kashagan production sharing agreement (PSA) is about as famous as the discovery.1 Every single percentage point (1%) take (either Government or Contractor take) could represent from $1.5 to $2 billion in profits for the first 10 billion barrels alone. This is a big one. The discovery is rated at 6.4 to 100 billion barrels.2 However, it is likely that a good working range might be somewhere on the order of 6.4 to 20 billion barrels of recoverable oil reserves—only three wells have been drilled. At 20 Billion barrels (if that is ultimately the figure) Kashagan would be the 5th largest oil field in the world and the only one of the five outside the Arabian/Persian Gulf region. The discovery well Kashagan East-1 (KE-1), 47 miles southeast of Atyrau in 10 feet of water, encountered Paleozoic carbonates below 13,000 feet (3,960 m) and tested 3,700 BOPD and 7 MMCFD on a half-inch choke3. In May, 2001 ExxonMobil announced test rates on the Kashagan West-1 (KW-1) well located 40-48 km away (depending on the source) from the Kashagan East discovery well. The KW-1 test was also from Paleozoic Carbonates (limestone) below 13,800 ft (4,250 m) described as a Carboniferous-Devonian coral atoll.

Kashagan and Tengiz – Castor and Pollux Daniel Johnston & Co., Inc. 2
The well flowed 3,300 BOPD of light 42-45º API gravity crude and 7.5 MMCFD on a half-inch choke.4 October, 2001 AGIP announced a test rate of 7,400 BOPD from the Kashagan East-2 well drilled 8 km away from the discovery well.5 The results of the 3 wells are summarized in Table 1.
These are not bad test rates but they are not spectacular by world standards. Of the nearly 100 odd discoveries reported worldwide each year the average test rate is around 5,000 BOPD. The average rate for the upper 25th percentile is 10,000 BOPD which is the kind of rate that might be expected for a giant discovery like Kashagan. However, indications are that testing has been limited by technical and environmental conditions and regulations. According to Agip-ENI (the operator) the second well encountered the same reservoir rocks as the Kashagan East-1 discovery well. They estimate deliverability for the well at 5,000-20,000 BOPD.6 This sounds reasonable if the field is as big as expected. This part of the world is famous for “hype” but all indications are this is a substantial discovery.
Table 1
Kashagan Drilling Summary
Well Test Rates
Well
Operator BOPD MMCFD
Water Depth (feet)
Drilling Depth (feet)
Comments
KE-1
OKIOC 3,700 7 10 13,000 +
Completed August, 2000
42-44º API
1,900 cubic feet per barrel
KW-1
OKIOC 3,400 7.6 22 13,800 +
Completed early 2001
25 miles West of KE-1
42-45º API
2,200 cubic feet per barrel
KE-2
Agip KCO 7,400 - - -
Spudded April, 2001
5 miles North of KE-1
Results announced Oct., 2001
From: Phillips Petroleum Company 2001 Fact Book, page 27;OKIOC website Oct. 23, 2001; Agip-ENI announcement 22 October, 2001 San Donato Milanese

Kashagan and Tengiz – Castor and Pollux Daniel Johnston & Co., Inc. 3
Atyrau
Tengiz
Kairan
Kalamkas A
Kashagan West
Kashagan S. West
Aktote
Kashagan East
North Caspian
Kazakhstan
Kashagan Area Map
From: Kashagan PSA [pg 167]
50°°°° 00' E 51°°°° 00' E
52°°°° 00' E 53°°°° 00' E
45°°°° 00' N
47°°°° 00' N
46°°°° 00' N
Prospect
License Area
Well locations (approximate)
Caspian Pipeline Consortium (CPC)
Baku-Tbilisi-Ceyhan (BTC) (Proposed)
Figure 1
BTC
CPC

Kashagan and Tengiz – Castor and Pollux Daniel Johnston & Co., Inc. 4
Tengiz Tengiz is the Kashagan twin. They have the same reservoir rocks with similar fluid properties, pressure gradients, reservoir depths and sulfur content (See Table 2). Recoverable reserves are rated at 6 to 9 Billion barrels of light oil (out of 24 Billion barrels in-place) with associated gas reserves of 64 TCF 7. Tengiz means “sea” in the Kazakh language which carries with it a bit of irony because the field is both an onshore field and for all practical (marketing) purposes it is landlocked. It was discovered in 1979 and began producing in 1991. In April, 1993 shortly after the Tengiz contract was signed, the field was producing 24,000 BOPD from 27 soviet-era wells.
The Tengiz crude has a specific gravity of 0.787 grams per cubic centimeter– 48.2° API with 0.49% by weight (wt %) sulfur and also has abundant solid bitumen. The associated gas has 12.5 mol % hydrogen sulfide (H2S).7 Production costs for Tengiz are reported at around $3/BBL. This is not cheap, especially for a giant oil field. World average production costs for smaller fields are $3.50 to $4.50/BBL. There is economy-of-scale with the giant Tengiz field, but the harsh technical difficulties neutralize some of that. As recently as 1999, 2/3rds of the Tengiz production went out by rail— around 160,000 out of 250,000 BOPD. The Caspian Pipeline Consortium (CPC) leased 10,000 tank cars sending up to 6 trains per day to Russian ports on the Black Sea. This is one of the most expensive means of transportation. Transporting oil to the Black sea costs around $6/BBL with so much of the production going by rail. Transportation cost on the CPC pipeline from Tengiz to the Russian Black Sea port of Novorossisk which started up in August, 2001 is estimated at $3/BBL. The $2.6 Billion, 950 mile CPC line has an initial capacity of 560,000 BOPD. Ultimate capacity for this line is 1.5 MMBOPD. Kashagan crude will have to find its own way out. But there is movement on that front. While ChevronTexaco is negotiating with SOCAR the Azerbaijan national oil company to purchase a share in the $2.4 billion Baku-Tbilishi-Ceyhan (BTC) pipeline project, Agip-ENI has already purchased a 5% share.8 This project now seems to be a certainty with strong pressure from the U.S. Government and the kind of deliverability expected from Kashagan. It is a question of time but the pressure is intense now with the Kashagan discovery.
Climate and Infrastructure This landlocked region is characterized by extreme weather with summer high temperatures on the order of 44º C (110º F) and winter lows of -40º C (-40º F). It is the same latitude as Billings, Montana but 100 feet below sea level. Ice problems are expected in winter but year-round-drilling is planned. Infrastructure in this remote part of the world is weak for the world-class development contemplated for Kashagan even with Tengiz nearby. However, with reserves like these, even a large world-class pipeline like the BTC project at $2.4 Billion (capital costs) becomes feasible. With 10 billion barrels of oil this amounts to only around 24¢/BBL.

Kashagan and Tengiz – Castor and Pollux Daniel Johnston & Co., Inc. 5
Reservoir Depths and Pressures The depth of the reservoir rocks ranges from 13,000 feet to over 15,000 feet. This is not terribly deep by world standards but the cost of a 15,000 foot well can easily be double that of a 10,000 foot well. That extra mile makes a big difference. But what makes an even greater difference is the reservoir pressure. Pressures throughout the Caspian region are nearly twice that of normal hydrostatic pressure and sometimes more. Tengiz is famous for it’s high
temperature and pressure. Temperatures are nearly 200° F and pressures are among the highest in the world at 0.82 pounds per square inch per foot (PSI/ft) or more—almost twice normal hydrostatic pressure of 0.433 to 0.465 PSI/ft. A pressure gradient like this can easily add over $10 MM per well for drilling fluids (mud) alone. And with the kind of mud weights required (over 16 pounds per gallon) drilling can go slow. The reported cost for the first two Kashagan wells is US$ 100 MM not including the cost of the initial 110,000 square kilometer 3-D seismic data acquisition program that preceded drilling. This does not sound unreasonable. High temperatures and pressures, sour (hydrogen sulfide bearing) gas, high gas oil ratios (GOR), and poor infrastructure in a hostile—environmentally sensitive region all add up. But it will take hundreds of wells to develop Kashagan and these development wells will not cost that much.
Productive Area While there are numerous reported sizes for the two fields, a good working number for the Kashagan field is probably 320,000 acres (based on numerous reported figures). There are many exploration blocks/licenses in this world that are smaller. Tengiz is about a third as large. Alaska’s Prudhoe Bay field productive area is roughly 150,000 acres. In the environmentally sensitive Caspian, dealing with such a large structure is expected to be a bit of a problem—it takes a lot of wells to cover that kind of area.

Kashagan and Tengiz – Castor and Pollux Daniel Johnston & Co., Inc. 6
Table 2
Kashagan – Tengiz Vital Statistics
Kashagan Tengiz
Discovered July, 2000 1979
Start-up N/A 1991
Recoverable Reserves (Billions of Barrels) 6.4 – 20 (or more?) 6 – 9
Location Offshore
10-22 feet of water Onshore
Size (acres) (Potential productive area)
320,000 100,000
Reservoir Depth (feet) 13-14,000 Roughly 14,000 or so Exact figure not available
Crude Characteristics 42-45° API Gravity 18-20 mol % H2S
48.2° API Gravity 12.5 mol % H2S
Pressure Gradient
Assumed to be roughly the same as Tengiz – very high
Very high, approximately
0.82 psi/ft +
Gas Oil Ratio (cubic feet per barrel)
1,900 - 2,200 from KE-1 & KW-1 tests
High Exact figure not available
Current (Pre-BP/Statoil sale) Working Interest
Ownership (%) (Percentages are rounded) (1) Operator (2) Pre-sale (BP/Statoil) % (3) Joined later
Agip-ENI (1) 14.28% TotalFinaElf 14.28 Exxon/Mobil 14.28 British Gas 14.28 Shell 14.28 BP 9.52 (2) Statoil 4.76 (2) Phillips 7.14 (3) Inpex 7.14 (3)
Chevron (1) 45% Exxon/Mobil 25 Kazakhoil 25 Lukoil 5
Current Pipeline Ownership (%)
Baku-Tbilisi-Ceyhan (BTC)
Caspian Pipeline Consortium (CPC)
SOCAR 45% BP (Operator) 25.7-Agip-ENI 5 Other ?
Russian Federation 24% Chevron 15 Kazakhstan Republic 19 LukArco 12.5 Shell/Rosneft 7.5 Exxon/Mobil 7.5 Sultanate of Oman 7 British Gas 2 Agip-ENI 2 ORYX 1.75 Kazakh Pipeline Vent. 1.75

Kashagan and Tengiz – Castor and Pollux Daniel Johnston & Co., Inc. 7
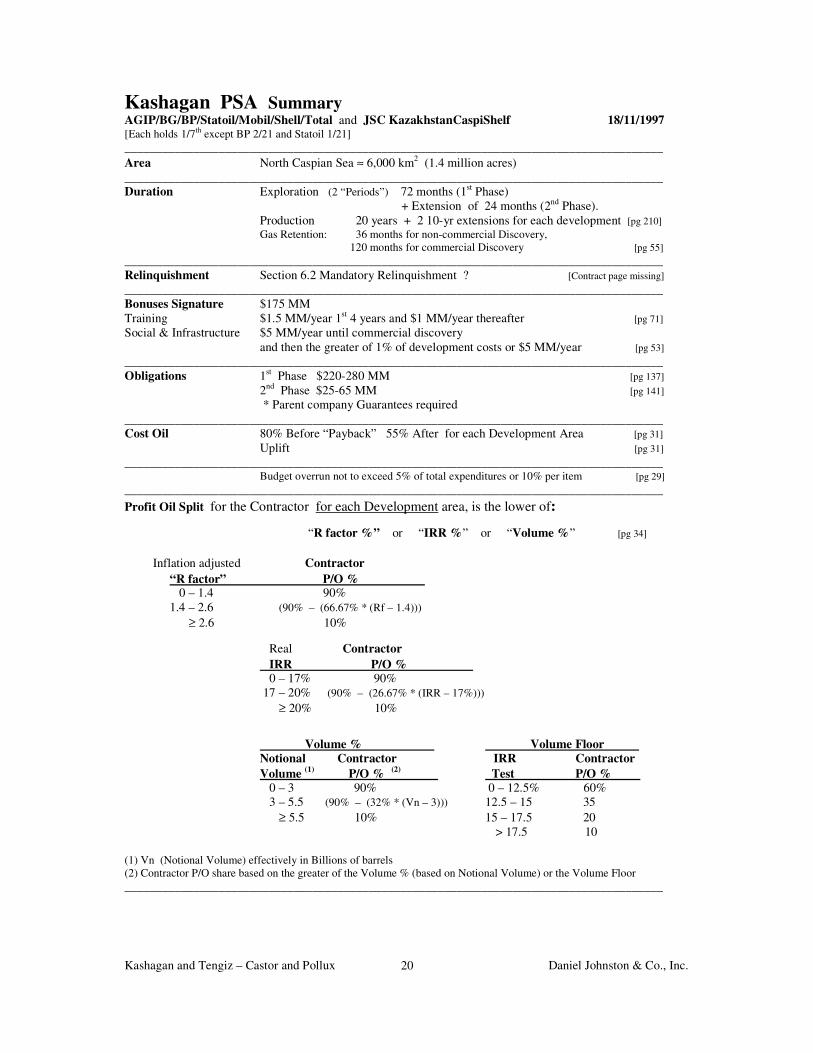
Commercial Terms It is likely the Kashagan agreement would have been famous if only for the complexity of the terms. Prior to drilling, the prospects were known to have substantial potential and it appears that particular care was taken to craft commercial terms that might accommodate all possible outcomes. The contract is unique. It has a half dozen “sliding scales” of various types (in Kazakhstan the term “gliding scale” is sometimes used). I have seen no other contract in the world with this degree of “flexibility” or complexity. But this does not mean the terms are unfair. In fact the contract terms are extremely progressive—a “back-end-loaded” system. Government share of profits and revenues is extremely low at first. The heart of this contract is a complex formula for the division of profit oil (defined as Gross production less Cost oil—see Figures 3 and 4 for these and other terms). Contractor share of profit oil is a function of four separate sliding scales. It is defined as the lower of the Contractor profit oil share calculated by either an “R factor”, an internal rate of return (IRR) factor, or a fairly unique 2-dimensional “Volume factor”. It seems like a slightly paranoid way of trying to ensure there is no money left on-the-table. (See Kashagan PSA Summary in the Appendix).
“R factor” The “R factor” is fairly typical of other such elements around the world with one exception. The “R factor” is equal to the inflation adjusted “Deflated value” of the contractors cumulative receipts (effectively Contractor cost oil plus profit oil less taxes) divided by the cumulative “Deflated value” of Contractor expenditures. It is basically a “payout” formula that adjusts for inflation. The inflation adjustment is unusual. The contractor can receive 90% of the profit oil until the “R factor” reaches 1.4 (inflation-adjusted payout plus 40%). From that point until the contractor reaches an “R factor” of 2.6 (which is unlikely) the contractor profit oil share will slide downward to 10% (unless it has already gotten to that point because of the other sliding scales). The cost recovery limit is also a function of payout—or “payback” as it is referred to in the Agreement. It changes from 80% before payback to 55% after—effectively another sliding scale. An “R factor” of one (1.0) is the point at which payout occurs. These formulas are fairly common around the world and are becoming more common. Approximately 25% of the countries around the world have either an “R factor” or a rate-of-return (ROR) based system. They rarely have both an “R factor” and a rate-of-return formula.
Internal Rate of Return (IRR) Systems with taxes or profit oil splits based on various IRR thresholds are referred to as “rate-of-return (ROR) systems”. They are also referred to as the “World Bank model”. In these systems pre-determined IRR thresholds are established (by statute or negotiation) and when the Contractor’s IRR exceeds these thresholds Government take increases by virtue of either an increased tax rate or a change in profit oil split. There are three such sliding scales in this contract. The Profit Oil, Profits Tax and the

Kashagan and Tengiz – Castor and Pollux Daniel Johnston & Co., Inc. 8
“Volume floor” are all governed by IRR based sliding scales. The Contractor receives 90% of the profit oil until an IRR of 17% is reached on the Contractor’s “Deflated” net cash flow. The 17% IRR trigger point then represents a “real” rate of return—which is common for ROR mechanisms. From that point until the contractor reaches a real IRR of 20% the contractor profit oil share slides downward to 10% (unless it has already gotten to that point because of the “R factor” or the Volume factor).
Volume Factor The third dimension to the profit oil split calculation is a slight variation on the “cumulative production sliding scale” theme. Up to roughly 3 Billion barrels of Contractor’s cumulative share of production (or more precisely a “Notional Volume” of 3 Billion barrels) the Contractor share of profit oil is 90%. After that it slides down to 10% at around 5.5 Billion barrels. This aspect of the profit oil split calculation is further qualified by a “Volume Floor” limitation. The Volume factor profit oil split calculation will be equal to the greater of the Notional Volume calculation or the Volume Floor calculation which is also based on internal rate of return-based thresholds (See Kashagan PSA Summary). The multi-dimensional hybrid nature of the contract is extremely rare. Various simultaneous calculations each yield a profit oil share for the Contractor and one is chosen. The profit oil split calculation applies separately to each development area. The Contractor share of profit oil (P/O) at any given time is based on the results of the previous accounting period. An example is shown in Table 3.

Kashagan and Tengiz – Castor and Pollux Daniel Johnston & Co., Inc. 9
So what does it all mean? The contract terms provide an extremely liberal means by which those who put up the capital can get their money back quickly. Furthermore in the early stages the Contractor gets a healthy share of profits. Only later, after costs have been recovered and the contractor group reaps a reasonable rate of return, does the Government take kick-into high gear.
Recovering Costs One of the key aspects of this system is that those providing the capital recover costs quickly. In any given accounting period the Contractor group can receive up to 98% of the production. This is illustrated in the flow diagram in Figure 2 by following $100.00 in gross revenues through the system. It shows what can happen in the early accounting periods after production begins when cumulative costs by far out-weigh revenues (which often happens). The cost recovery limit is 80% which forces 20% of the production into the profit oil split and the companies get 90% of that. This means the share of production for the Contractor group is 98% [80% + (90% of 20%)]. There is a big difference for companies able to access 98% of production as opposed to only 80% (world average) —especially with so much capital involved.
Table 3
Example Contractor P/O Share Calculation (1) (2) (3)
Method P/O Share P/O Share P/O Share “R factor” 70% 70% IRR 58% 58% 58% Notional Volume 55%
Volume Floor 60% 60% Ultimate Contractor P/O Share 58% (1) Each of 4 calculations of Contractor share of profit oil (P/O) are made.
(2) The choice between either the Notional volume or the Volume floor calculation will be based upon whichever is “greater”.
(3) The choice of the 3 remaining percentages will be based upon whichever is “lower”. In the following accounting period the Contractor share of profit oil will be 58%.

Kashagan and Tengiz – Castor and Pollux Daniel Johnston & Co., Inc. 10
Kashagan PSA Example Calculation
“Early Years of Production - Single Accounting Period”
Gross Revenues (Net-back Sales price—Transportation Costs netted out)
$100.00
Oil Company (Contractor) Share
Government Share
Royalty 0%
$100.00
Tax Rate * 30%
Cost Recovery 80% Limit
$20.00 ($ Equivalent of Profit Oil)
$80.00 ←←←← ($ Equivalent of Cost Oil)
Profit Oil Split 90/10%
$18.00 ←←←←
→→→→ $2.00
($0.00) →→→→
→→→→ $0.00
$98.00 $2.00 Division of Gross Revenues
Effective Royalty Rate 2% $2.00/$100.00
→→→→ $0.00
Company access to Gross Revenues
* This analysis is based on the assumption that accumulated costs (deductions) exceed
revenues thus the companies are in a no-tax paying position.
Figure 2
This flow diagram shows that in the early accounting periods before payout the Contractor Group (Oil Companies) can obtain up to 98% of the revenues (or production) generated. This example assumes costs far exceed Gross Revenues (tax deductions will yield zero taxable income).
98% $98.00/$100.00

Kashagan and Tengiz – Castor and Pollux Daniel Johnston & Co., Inc. 11
Kashagan PSA Example Calculation
“Full Cycle”
Gross Revenues (Net-back Sales price—Transportation Costs netted out)
$100.00
46.8% ($30.00+16.80)/$100.00
Oil Company (Contractor) Share
Government Share
Royalty 0%
$100.00
Tax Rate 30%
Cost Recovery
($ Equivalent of Cost oil)
$70.00 ($ Equivalent of Profit Oil)
$30.00 ←←←← Assumed Costs (Capex and Opex)
Profit Oil Split (Average full-cycle )
24/76%
$16.80 ←←←←
→→→→ $53.20
($5.04) →→→→
→→→→ $5.04
$41.76 $58.24 Division of Gross Revenues
Division of Cash Flow $58.24 $11.76
Take 17% $11.76/($100.00-30.00)
83% $58.24/($100.00-30.00)
→→→→ $0.00
Entitlement 53.2% $53.20/$100.00
Figure 3
In the long run, the Government share of revenues, production, and profit oil will increase. Government Take also increases—for the first 10 Billion barrels the average will likely be around 83%.
“R factor” = 1.39 $41.76/$30.00

Kashagan and Tengiz – Castor and Pollux Daniel Johnston & Co., Inc. 12
Government Take These numerous simultaneous calculations alone make the Kashagan contract unique. And while much of the rest of the contract is based on standard formulas found in other contracts around the world it is the percentages that provide added flavor. The general mechanics of the system are shown in Figure 3 where $100.00 of gross revenues are used to show the general distribution of revenues and profits. It is assumed that capital and operating costs (full-cycle) are assumed to amount to 30% of total revenues for 10 Billion barrels of production. It is also assumed that the overall average Government share of profit oil during this time will be around 76% (Contractor share is 24%). When the tax rate is factored-in the Government take comes to around 83%. Figure 5 illustrates how Government take changes with time as measured by cumulative production for both Kashagan and Tengiz. The Crazy Horse deepwater discovery in the US Gulf of Mexico is also shown on this graph for counterpoint. Notice the Government take at Kashagan is quite low at first and climbs to around 94%. The structures of the Kashagan and Tengiz systems are dramatically different. But for the first 10 Billion barrels or so, overall Government take is about the same—around 83%. Yet Government take at Kashagan is quite low at first—around 46% and increases after the companies reach payout (See Figure 5). These may sound like tough terms, but by contrast, Government take in the famous Indonesian standard contract for oil is around 86-87%. Many companies made a lot of money under those contracts and so did the Government.
Contractor Entitlement—“Booking barrels” In the early stages of production the Contractor group will be entitled to “lift” a huge percentage of production—98%. In this type of contract the lifting entitlement will correspond to the reserves the partners will be able to “book”. Thus for the first 3 billion barrels of (proved) reserves it is likely that each company will be able to book upwards of 80 to 90% of their working interest share of proved reserves under U.S. Security and Exchange Commission guidelines. Under London Stock Exchange guidelines, British companies will be able to book the same percentage of both “proved” plus “probable” reserves (“P50 reserves”—considered to have a 50% chance of being too high and/or a 50% chance of being too low). In the example in Figure 4 the Contractor group entitlement (cost oil + profit oil) comes to 47%. As Government share of profit oil increases so does Government entitlement. The Government receives profit oil in “kind” and taxes in “cash”.

Kashagan and Tengiz – Castor and Pollux Daniel Johnston & Co., Inc. 13
So what is it worth? The petroleum industry has some of the greatest contrast between risk and reward. When discoveries are made the curiosity about “value” becomes magnified. Without detailed information the transactions are difficult to evaluate fully but it is always interesting to try. Actual market transactions, if they are arms-length and conducted in a competitive and efficient environment, can be the acid test of “value”. In 1998 Phillips and Indonesian Petroleum Company (Inpex) acquired the Kasakh Government 14.28% share (7.14% each) for $500 million cash plus other consideration including low-interest-rate loans and so forth.9 This transaction indicates a value at that time of $3.5 + Billion. But, this was before any drilling had taken place. In early 2001 BP agreed to sell it’s 9.52% interest in Kashagan to TFE for $409 MM. This agreement took place after the results of the first well (Kashagan East-1) but before the results of the second. Statoil, at about this same time, also agreed to sell their 4.76% share to TFE for $221 MM. (See Kashagan Chronology). These proposed transactions indicate a value for the discovery (and ancillary interests) of $4.4 Billion. Proposed Sale of BP/Statoil Interests: Working Sale
Interest Price Share US$MM $MM per 1%
BP 9.52% 409 43 Statoil 4.76% 221 46 . Total 14.28% $630 44 Assuming there are 10 Billion barrels of recoverable reserves the value comes to around 44¢/BBL for partially “proved” and “probable” undeveloped barrels in-the-ground. But, the proposed deal is fraught with controversy. There are many who believe this proposed transaction does not represent a valid indication of actual value. In fact shareholders have filed a class-action suit against the BP Board of Directors claiming “gross waste of assets” in the sale of BP’s 9.52% interest in Kashagan10. Furthermore, this deal was not consummated because the other partners had rights of first refusal. By August, 2001 all participants indicated their intention to pre-empt the sale and take their respective shares at this price11. None of them considered the price too high. The total consideration in this proposed transaction is similar to that of the earlier (pre-discovery) Phillips/Inpex acquisition but there are dramatic differences.
Kashagan and Tengiz – Castor and Pollux Daniel Johnston & Co., Inc. 14
Considering the change in oil prices and the fact that the Phillips/Inpex transaction occurred before much of the hydrocarbon potential of the Kashagan prospect had been confirmed the price for the proposed BP and Statoil transactions seem low. A comparison is provided in Table 4. Under a variety of scenarios, the value of the interests in the Kashagan license could be worth many times the price paid by Phillips/Inpex. This often happens when a big discovery is made. It all depends on oil prices, costs, and timing—an age-old formula.
With present value discounting, depending on the cost, price and timing assumptions, the value per barrel at this point is something on the order of $1.00/BBL or so. This would put a value on the discovery, (assuming 10 Billion barrels) of around $10 Billion. In addition to this, there are other prospects in this acreage: Kalamkas, Aktote, Kairan and Kashagan Southwest. Any one of these could be another world-class discovery (See Figure 1 from the Kashagan Agreement). It will be fascinating to see the drilling results. Furthermore, there is a substantial amount of gas. With a gas oil ratio (GOR) of around 2,000 cubic feet per barrel (based on test rates) there could be at least 20 trillion cubic feet of “associated gas” alone (based on 10 Billion barrels recoverable reserves). This would add another 3.3 Billion barrels of oil equivalent. But it is extremely likely that the gas reserves will be substantially greater than this. The area is exciting from any perspective. Kashagan will be big news for many years to come.

Kashagan and Tengiz – Castor and Pollux Daniel Johnston & Co., Inc. 15
Table 4
Comparison of Kashagan Transactions
Buyer
Phillips/Inpex
TotalFinaElf
(Originally Intended) (1)
Seller
JSC
KazakhstanCaspiShelf
BP and Statoil
(Separate “Proposed” Transactions)
Acquired Working Interest
14.28%
9.52% and 4.76%
Price Paid (or proposed)
$500 Million +
$630 Million
Imputed Value of 100% Working Interest
> $3.5 Billion
$4.4 Billion
Historical setting Transaction Date Oil Price at the time Other
1998
$11/BBL
Before the discovery was made.
2001 (2)
$20+/BBL
After the discovery was made, but before the second well was drilled.
(1) Ultimately all the other partners exercised right of first refusal 28 August, 2001. (2) Announced in February, finalized in mid June, 2001, pre-empted in August—not finalized.

Kashagan and Tengiz – Castor and Pollux Daniel Johnston & Co., Inc. 16
Kashagan Chronology 18 Nov., 1997 - Kashagan PSA signed with Offshore Kazakhstan International Operating Company consortium (OKIOC) [AGIP/BG/BP/Statoil/Mobil/Shell/Total]
1998 - Phillips/Inpex each acquire half of 14.28% JSC KazakhstanCaspiShelf (Government) interests
12 Aug., 1999 - OKIOC starts drilling first Exploration Well KE-1 in the Northeast Caspian Sea with the 6,000 ton converted drilling barge Sunkar owned by Parker Drilling. The well is located 75 km south-east of Atyrau.
10 May, 2000 - OKIOC reaches original target depth of 4,500 meters in Kashagan East well.
24 July, 2000 - OKIOC announces discovery at the KE-1 well.
7 Oct., 2000 - Second well, Kashagan West-1 spudded.
2 Feb., 2001 - BP/Amoco reported agreement to sell it’s 9.52% interest in OKIOC to TotalFinaElf (TFE) for $409 MM. (ITAR/TASS News Friday, February 2, 2001 10:57 EST).
Date unknown - Statoil agrees to sell 4.8% share to TFE (at approximately same time as BP sale).
14 Feb., 2001 - Target depth is reached at KW-1 well.
4 May, 2001 - Exxon/Mobil announces test results at KW-1 well. 3,398 BOPD and 7.56 MMCFD
Mid June, 2001 - BP/Amoco and Statoil Sales Agreements finalized
July, 2001 - BP Board of Directors sued in class-action suit claiming “gross waste of assets” in the sale of BP’s 9.52% interest in Kashagan contract/discovery to TFE for $409 MM. (Platts Oilgram News, 23 July, 2001)
August, 2001 - Partners exercise right of first refusal on proposed sale of Statoil and BP interests to TFE. (Phillips Corporation 2001 Fact Book, page 28)
22 October, 2001 - Agip-ENI announces results of Agip KCO Kashagan East-2 well test results. The well, 8 km away from Kashagan East-1, drilled to 4,142 meters tested 7,400 barrels of oil per day. (San Donato Milanese)
November, 2001 - Chevron/Texaco confirms it is negotiating with SOCAR, (Azerbaijan state oil company), to purchase a share in the $2.4 billion U.S.-backed Baku-Tbilishi-Ceyhan (BTC) pipeline project—10 days after Agip-ENI announced it had purchased a five percent (5%) stake in the project from SOCAR. (The Russia Journal, November 02-08, 2001”Oil giant holds
talks over BTC pipeline”)

Kashagan and Tengiz – Castor and Pollux Daniel Johnston & Co., Inc. 17
0%
Figure 4
0 2 4 6 8 10
Cumulative Production – Billions of Barrels
20%
80%
60%
40%
0%
100%
Company share of
Revenues
•
•
•
•
•
•
•
•
•
Kashagan Agreement
Division of Revenues vs Cumulative Production
Almost all revenues go the Contractor Group (Companies) prior to payout.
Government share of
Revenues
20%
40%
60%
100%
80%
• •
•
Assume Payout occurs here. Up to this point Company share of revenues is 98%.
Contractor Group
Overall Average Share of Revenues
± 42%
Government Overall Average Share of Revenues
± 58%

Kashagan and Tengiz – Castor and Pollux Daniel Johnston & Co., Inc. 18
Figure 5
0 2 4 6 8 10
Cumulative Production – Billions of Barrels
20%
80%
60%
40%
0%
100%
Government Take
(Gvt. share of Cash Flow)
• • •
• •
•
•
Maximum Gvt. Take 94% ±
•
•
•
•
•
•
•
•
•
•
•
• • •
•
• •
Kashagan
Tengiz Maximum Gvt.
Take 84% ±
••••
Average for both systems is around 83%.
Crazy Horse: Largest US Gulf of Mexico deepwater
discovery, 900 – 2,000 MMBBLS recoverable.
Kashagan and Tengiz Agreements
Government Take vs Cumulative Production
While the systems are structured differently, the overall Government Take (share of Cash Flow) will be about the same for Kashagan and Tengiz—around 83% for production of 7-10 Billion barrels of reserves.
• •

Kashagan and Tengiz – Castor and Pollux Daniel Johnston & Co., Inc. 19
Table 5
Basic Equations/Definitions Gross Production = Total Produced Oil = 100% Working Interest Gross Revenues = Total Receipts from sale of Gross Production “Revenues” at the wellhead = Gross Production * Net-back (Wellhead) Price
(transportation costs beyond N. Caspian netted out)
Total Cash Flow = Gross Revenues “Cash Flow” - Total Costs (Capex and Opex) Cost Recovery = Operating Costs "Cost Oil" + Depreciation [of Capital Expenditures (Capex)] + Unrecovered Costs Carried Forward Profit Oil = Gross Production - Cost Oil Government Profit Oil = Profit Oil * Government Percentage Share Contractor Profit Oil = Profit Oil * Contractor Percentage Share Taxable Income = Gross Revenues - Operating Costs
- Government Profit Oil - Depreciation Company Cash Flow = Gross Revenues “Contractor Group” - Capital Costs - Operating Costs - Bonuses - Government Profit Oil - Taxes Company Take (%) = Company Cash Flow (Same as Contractor group Cash Flow) “Contractor Group” ÷ Total Cash Flow Government Cash Flow = Government Profit Oil + Bonuses + Taxes
Government Take (%) = Government Cash Flow ÷ Total Cash Flow
Kashagan and Tengiz – Castor and Pollux Daniel Johnston & Co., Inc. 20
Kashagan PSA Summary AGIP/BG/BP/Statoil/Mobil/Shell/Total and JSC KazakhstanCaspiShelf 18/11/1997 [Each holds 1/7th except BP 2/21 and Statoil 1/21]
______________________________________________________________________________________
Area North Caspian Sea ≈ 6,000 km2 (1.4 million acres) ______________________________________________________________________________________ Duration Exploration (2 “Periods”) 72 months (1st Phase)
+ Extension of 24 months (2nd Phase). Production 20 years + 2 10-yr extensions for each development [pg 210] Gas Retention: 36 months for non-commercial Discovery,
120 months for commercial Discovery [pg 55] ______________________________________________________________________________________ Relinquishment Section 6.2 Mandatory Relinquishment ? [Contract page missing] ______________________________________________________________________________________ Bonuses Signature $175 MM Training $1.5 MM/year 1st 4 years and $1 MM/year thereafter [pg 71] Social & Infrastructure $5 MM/year until commercial discovery
and then the greater of 1% of development costs or $5 MM/year [pg 53] ______________________________________________________________________________________ Obligations 1st Phase $220-280 MM [pg 137] 2nd Phase $25-65 MM [pg 141] * Parent company Guarantees required ______________________________________________________________________________________ Cost Oil 80% Before “Payback” 55% After for each Development Area [pg 31] Uplift [pg 31]
______________________________________________________________________________________ Budget overrun not to exceed 5% of total expenditures or 10% per item [pg 29]
______________________________________________________________________________________
Profit Oil Split for the Contractor for each Development area, is the lower of:
“R factor %” or “IRR %” or “Volume %” [pg 34]
Inflation adjusted Contractor
“R factor” P/O % 0 – 1.4 90% 1.4 – 2.6 (90% – (66.67% * (Rf – 1.4)))
≥ 2.6 10%
Real Contractor
IRR P/O % 0 – 17% 90% 17 – 20% (90% – (26.67% * (IRR – 17%)))
≥ 20% 10%
Volume % Volume Floor Notional Contractor IRR Contractor
Volume (1) P/O % (2)
Test P/O % 0 – 3 90% 0 – 12.5% 60%
3 – 5.5 (90% – (32% * (Vn – 3))) 12.5 – 15 35
≥ 5.5 10% 15 – 17.5 20
> 17.5 10
(1) Vn (Notional Volume) effectively in Billions of barrels (2) Contractor P/O share based on the greater of the Volume % (based on Notional Volume) or the Volume Floor
______________________________________________________________________________________

Kashagan and Tengiz – Castor and Pollux Daniel Johnston & Co., Inc. 21
Kashagan PSA Summary - Continued ______________________________________________________________________________________ Profits Tax [pg 82]
Foreign Investors’ “Profits Tax” IRR Rate
Up to 20% 30% 20 — 22% 34% 22 — 24% 38% 24 — 26% 42% 26 — 28% 48% 28 — 30% 54% > 30% 60% ______________________________________________________________________________________ Witholding Taxes Various exemptions including Customs and Excise [pg 86] VAT Imports exempt and Cost Oil and Profit Oil “zero rated” Interest Expense Deductible up to 70/30 debt/equity [pg 77] Depreciation Various (from 10%/year to 25%/year) [pg 80] ______________________________________________________________________________________ Employment Tax 2% of Kazakh citizens payroll [pg 85]
Stabilization language (somewhat) Section 28.6 (b) [pg 86] ______________________________________________________________________________________ DMO Possible up to 15% at market price in the event of Domestic Supply Shortfall [pg 44] ______________________________________________________________________________________ G&A 3% on 1st $100 MM of recoverable costs; 2% on 2nd $100 MM;
1.25% on 3rd; and 0.75% on all costs over $300 MM [pg 157] ______________________________________________________________________________________ Decommissioning QP = ((P/RES) * (Gross CoD – Salvage Value)) - Fb [pg 49] QP = Quarterly Payment to be transferred to Decommissioning Fund P = Cumulative Production from “Depletion Percentage” point Depletion Percentage point defined in each Development Plan
RES = Remaining Reserves CoD = Estimated Cost of Decommissioning and Abandonment Fb = Fund balance ______________________________________________________________________________________ Local Hiring 4 years after Effective Date – Manning levels [pg 70]
20% Managerial, supervisory and professional 35% Skilled and technical 90% Administrative, clerical and support staff
______________________________________________________________________________________ Ringfencing Yes Expl. costs recoverable from entire area [pg 31]
Dev costs and bonuses recoverable from Dev. Area ______________________________________________________________________________________ Gvt. Participation 1/7th (14.28%) [These interests were later sold to Phillips/Inpex]

Kashagan and Tengiz – Castor and Pollux Daniel Johnston & Co., Inc. 22
Tengiz Contract (Joint Venture) Summary 50/50% JV (Joint Enterprise) Chevron/Tengizneftegaz 18 May, 1992 ______________________________________________________________________________________ Duration 10 years extended for 3 subsequent 10-year periods (40 years total) ______________________________________________________________________________________ Bonus $5 MM signature
$25 MM upon completion of Foundation Agreement $350 MM in escrow for Tengizneftegaz obligations
$210 MM + interest after 90 days continuous operation of export system
$210 MM additional payment + interest subject to various conditions
regarding export system
$10 MM/year social welfare development fund Rentals None ______________________________________________________________________________________ Royalty $20 MM in year 1 of operations
$30 MM in year 2 $40 MM in years 3 and 4 18% thereafter until project reaches 17% ROR 25% thereafter
(allowing netback of transportation costs and facilities) ______________________________________________________________________________________ Profit Share 50/50% between each Joint Enterprise partner ______________________________________________________________________________________ Taxation 30% Corporate Income Tax
15% Repatriation/Dividend Tax 20% Distributed received loan interest ______________________________________________________________________________________ Depreciation 5 year SLD ______________________________________________________________________________________ Excess Profits Tax ROR * EPT
< 20% 0% Based on net cash flow 20 - 25% 5 25 - 30% 15 > 30% 25 ______________________________________________________________________________________ Ringfencing Yes ______________________________________________________________________________________ Gvt. Participation 50% Tengizneftegaz

Kashagan and Tengiz – Castor and Pollux Daniel Johnston & Co., Inc. 23
Abbreviations
$ United States Dollar $M Thousands of Dollars $MM Millions of Dollars 2-D Two-Dimensional (as in Seismic data) 3-D Three-Dimensional (as in Seismic data) AGIP KCO AGIP Kazakhstan North Caspian Operating Company N.V. API American Petroleum Institute APO After Payout BBL Barrel BCPD Barrels Condensate Per Day BG British Gas BOPD Barrels of Oil per day BP British Petroleum (British Petroleum/Amoco) BP/Amoco British Petroleum/Amoco BPO Before Payout BTC Baku-Tbilishi-Ceyhan pipeline BTU British Thermal Unit C Centigrade Capex Capital Expenditures CPC Caspian Pipeline Consortium C/R Cost Recovery Dev. Development DMO Domestic Market Obligation ENI Italian National Oil Company (Agip-ENI) ERR Effective Royalty Rate F Fahrenheit ft Feet Gvt. Government GOR Gas Oil Ratio (as in cubic feet per barrel or cubic meters per ton) G&A General and Administrative (Costs) H2S Hydrogen Sulfide IRR Internal Rate of Return ROR Rate of Return (same as IRR) as in “Rate of Return Systems” JOA Joint Operating Agreement JSC Joint Stock Company JV Joint Venture KCS KazakhstanCaspieShelf KE-1 Kashagan East-1 well KE-2 Kashagan East-2 well KW-1 Kashagan West-1 well m meters M Thousand MB Moulavi-Bazar MCF Thousand Cubic Feet (Gas) MM Million MMBBLS Million Barrels MMBOPD Million Barrels of Oil per Day MMCFD Million Cubic Feet (of Gas) per Day MMSCF Million Standard Cubic Feet (Gas) MMSCFD Million Standard Cubic Feet (Gas) per Day mol molecular as in mol vol or mol % mol vol molecular volume mol % percent molecular volume N/A Not available or Not applicable No. Number

Kashagan and Tengiz – Castor and Pollux Daniel Johnston & Co., Inc. 24
OKIOC Offshore Kazakhstan International Operating Company Opex Operating Expenditures (Operating Costs) P&A Plugged and Abandoned P/O Profit Oil PSA Production Sharing Agreement (Same as PSC but a more politically correct term) PSC Production Sharing Contract PSI Pounds per Square Inch PSI/ft Pounds per Square Inch per foot P50 Probabilistic Reserve Figure - 50th Percentile (Proved + Probable typically) Rf “R factor” ROR Rate of Return TCF Trillion Cubic Feet (Gas) TFE TotalFinaElf Vn Notional Volume Factor (Billions of Barrels) vs versus (Latin) wt% weight percent
° degree
Footnotes 1. Gordon Barrows, Barrows Company Inc., – New York 2. 10-60 billion barrels – Reuters; October 9, 2000
50 billion barrels – International Herald Tribune, November 15, 2000 13-14 billion tonnes of oil (approximately 100 billion barrels) – ITAR/TASS News Feb. 2, 2001
6.4 – 10 billion barrels – “New world oil reserves . . . ”, IHS Energy Report, Reuters; July 12, 2001 30 billion barrels – The Guardian, February 3, 2001 3. Phillips Petroleum Company 2001 Fact Book, page 27 4. OKIOC website Oct. 23, 2001 5. Agip-ENI announcement 22 October, 2001 San Donato Milanese 6. Offshore Magazine, August 2001, v61 i8 page 136 7. Connell, D., Oil & Gas Journal, Vol 98, Issue 24, 12 June, 2000 8. The Russia Journal, November 02-08, 2001”Oil giant holds talks over BTC pipeline”
9. LeVine, S., The New York Times on the web, September 15, 1998 “Phillips Petroleum and Japanese in Big Kazakh Exploration Deal 10. Platts Oilgram News, 23 July, 2001 11. Phillips Petroleum Company 2001 Fact Book, page 28 Kashagan and Tengiz contracts from Gordon Barrows, Barrows Company Inc., – New York Kashagan and Tengiz contract summaries from: “International Petroleum Fiscal Systems Analysis” PennWell Books, 2001 by Daniel Johnston