Karoline&Faust - UGentpsbweb05.psb.ugent.be/conet/documents/CoNetDemo.pdf · 2013-12-20 ·...
20
CoNet Demo Karoline Faust
Transcript of Karoline&Faust - UGentpsbweb05.psb.ugent.be/conet/documents/CoNetDemo.pdf · 2013-12-20 ·...

CoNet Demo
Karoline Faust

About CoNet
• Cytoscape plugin and command line tool to do ensemble-‐based relevance (similarity, dissimilarity, correla=on) network inference
• web pages: hDp://systemsbiology.vub.ac.be/conet
hDp://apps.cytoscape.org/apps/conet
• well documented (help pages, manual, tutorials, FAQ) • support for row groups, presence/absence data, lagged similari=es, minet integra=on, seHngs loading/saving and more
3.X!
2.X!

Demo data
• 52 arc=c tundra soil samples collected in 2007 and 2008 by Chu and co-‐workers
• Roche FLX 454 sequencing using V1V2 region • Processed with the QIIME pipeline

Download demo data from QIIME
• convert biom file into classical OTU table using converter from hDp://biom-‐format.org/
• Command: biom convert -‐i study_104_closed_reference_otu_table.biom -‐o arc=c_soils.txt -‐b -‐-‐header-‐key taxonomy
hDp://www.microbio.me/qiime/
ID: Chu_arc=c_soils
QIIME database needs registra=on, which is for free

Extract features from mapping file
• mapping file (study_104_mapping_file.txt) contained in zip file downloaded from the QIIME database
• open mapping file in Excel
• select SampleID (remove #) and PH column
• save selec=on as tab-‐delimited file

Processed Demo Data
• Processed demo data are available from the CoNet web page, tutorial 5
• demo data contain: – OTU table (arc=c_soils.txt) – feature matrix (arc=c_soils_features.txt) – precomputed permuta=ons (arc=c_soils_permuta=ons.txt)
– precomputed bootstraps (arc=c_soils_bootstraps.txt)

Configure OTU table loading
standard QIIME OTU table (lineages, if present, are parsed directly from this table)
input file loca=on

Higher-‐level taxa assignment
enable higher-‐level taxon assignment
exclusion of parent-‐child rela=on-‐ships

Configure feature loading
transpose feature matrix
match feature samples to OTU table samples
select feature file

Configure preprocessing
filter rows with too many zeros (zeros bias correla=on measures)
divide entries by the total count of their corresponding column (takes out effects of varying sequencing depth)

Select methods
set thresholds such that the 1,000 highest and lowest scoring edges for each method are included in the ini=al network

Op=onal: Run CoNet on command line -‐ copy-‐paste first java command line call (first line star=ng with java and ending with thresholds.txt) into a text editor, add the path to the CoNet jar file via -‐cp argument, copy the extended command into a shell and enter -‐ threshold file will be created in temporary directory -‐ repeat the same steps for the second java command line call (second line star=ng with java) -‐ network file (ending in .gdl) will be generated in current directory
click here to generate command line call
Example of a (simplified) command line call with jar file included (do not copy-‐paste this example into a shell): java be.ac.vub.bsb.cooccurrence.cmd.CooccurrenceAnalyser -‐cp /Applica5ons/Cytoscape_v2.8.0/plugins/CoNet.jar -‐-‐method ensemble -‐-‐input arc=c_soils.txt -‐-‐matrixtype abundance -‐-‐thresholdguessing edgeNumber -‐-‐guessingparam 1000.0 -‐-‐ensemblemethods correl_pearson/correl_spearman/sim_mutInfo/dist_bray/dist_kullbackleibler -‐-‐stand col_norm -‐-‐minetdisc equalfreq -‐-‐inpueormat biomtable -‐-‐features arc=c_soils_features.txt -‐-‐mul=graph -‐-‐higherleveltaxa -‐-‐transposefeatures -‐-‐matchfeaturesamples -‐-‐topboDom -‐-‐filter row_minocc/noinclusivetaxalinks -‐-‐filterparameter 20.0 -‐-‐output thresholds.txt

Op=onal: Load command line result into Cytoscape
select gdl network file to load
Click

Compute permuta=ons
save permuta=on scores to a file
row-‐wise permuta=on with 100 itera=ons
enable renorma-‐liza=on
Click

Compute bootstraps
100 bootstrap itera=ons
save bootstrap scores to a file Click

Build final network
Click
mul=ple tes=ng correc=on load
random score files
merge method-‐specific p-‐values
op=onal: filter edges with scores outside the bootstrap distribu=on

Beau=fy the network
2. Color phyla with the VizMapper 1. Layout the network with yFiles
Layout
Organic
yFiles
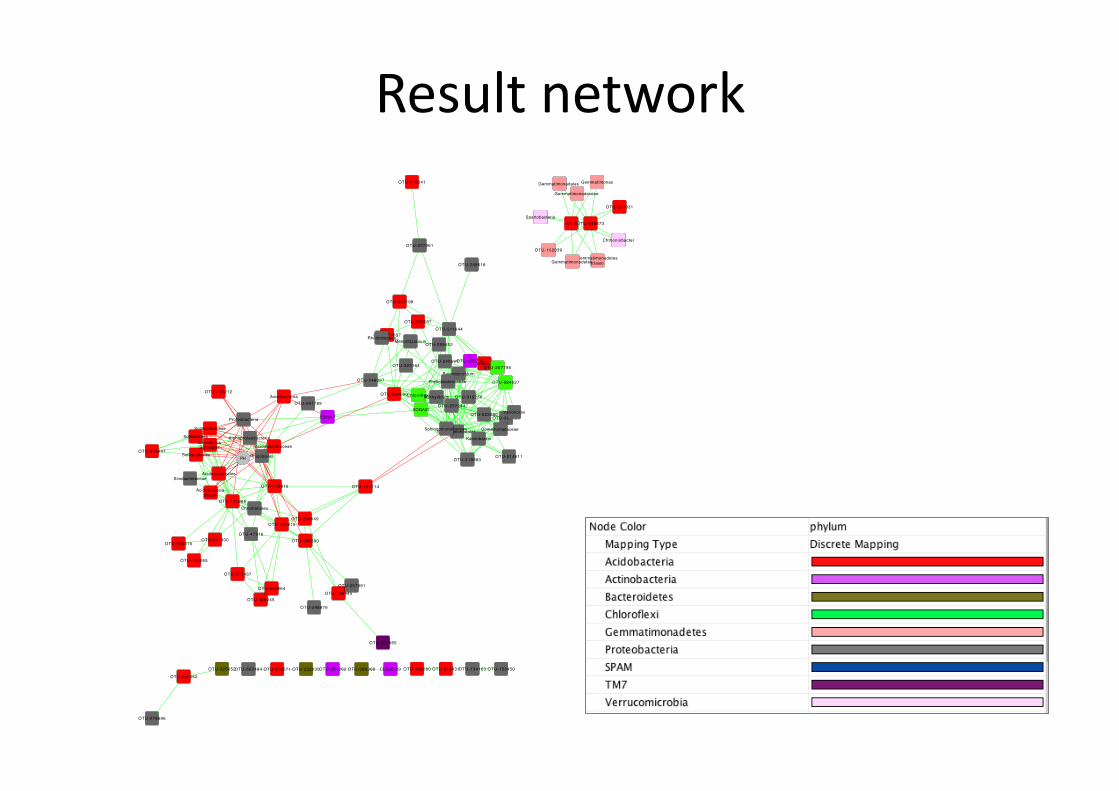
Result network
OTU-391129
OTU-214611
Sphingomonadales Kaistobacter
OTU-222080
OTU-151114
OTU-318683
Comamonadaceae Sphingomonadaceae
OTU-222635 OTU-153450OTU-513331OTU-136280CL500-29OTU-286368OTU-254262 OTU-134163
OTU-532665
OTU-548876OTU-328245
OTU-156545OTU-546864 OTU-257891
OTU-156065
OTU-560615
OTU-278437
OTU-541300OTU-47916
OTU-347619
OTU-566300
OTU-239649
OTU-111986
SolibacteralesOTU-575937
Acidobacteriales
Acidobacteria (class)
Solibacteres
Sinobacteraceae
Solibacteraceae
Candidatus Solibacter
OTU-278816
Alphaproteobacteria
Rhizobiales
Acidobacteriaceae
Chromatiales
PH
OTU-113212Acidobacteria
EB1017
OTU-561789
Proteobacteria
OTU-204462OTU-325652OTU-563484 OTU-279571
OTU-278696
Gemmatimonadetes (class) Gemmatimonadetes
Chthoniobacter
OTU-152039
OTU-546873
Gemmatimonas
OTU-277931
Gemmatimonadaceae
Gemmatimonadales
i i i 1 -8Spartobacteria
OTU-573607
OTU-533587
OTU-248618
OTU-216341
OTU-327961
OTU-340198
Rhodobiaceae
OTU-511844
OTU-364090
PedomicrobiumPhyllobacteriaceae OTU-584527OTU-146397
OTU-319256ChloroflexiMethylibium
VariovoraxOTU-257244
SOGA31
Mesorhizobium
OTU-240591 Chloracidobacteria OTU-207796
OTU-259452
OTU-323164OTU-529793

Interpreta=on of results
Betaproteobacteria) and soil pH in arctic soils (Fig. 3),while no significant correlations were observed forAlphaproteobacteria and Betaproteobacteria in soils fromlower latitude biomes (Lauber et al., 2009). Furthermore,phylotype richness and Faith’s index of phylogeneticdiversity of the bacterial communities were highest at pH~6 in arctic soils (Fig. 4) while they were highest at pH ~7in soils from those lower latitude biomes. These resultsindicate that although bacterial community composition isclearly strongly influenced by pH, the specific nature ofthe relationship may differ slightly between arctic andlower latitude soils.
Environmental heterogeneity and dispersal limitationare clearly both key determinants of the biogeographicpatterns exhibited by animals and plants (Ganderton andCoker, 2005; Lomolino and Brown, 2006). Dispersal limi-tation is often considered less important for microorgan-isms (Fenchel et al., 1997; Finlay and Clarke, 1999;
Finlay, 2002), resulting in biogeographic patterns that pri-marily reflect selection by contemporary environmentalconditions (Baas Becking, 1934; de Wit and Bouvier,2006). Martiny and colleagues (2006) have proposed thatdispersal limitation and variation in past environmentalconditions may also contribute to patterns of spatial vari-ability in microbial communities, and may only becomeapparent in studies of spatial structure at continental orglobal-scales rather than over smaller scales. OurUniFrac distance data clearly indicate that the bacterialcommunities at each sampling location were fairly distinctfrom each other since ~55% of the sequences at each sitewere unique to that site (Fig. 7). Interestingly, this propor-tion of unique sequences (ranging from 335 to 657 per1000 randomly selected sequences) in our arctic sites isvery similar to values obtained for a wide range of otherbiomes (338–725 per 1000) using the same bar-codedpyrosequencing technique (Fig. 7., note that this compari-
Soil pH
Acidobacteriar = -0.816, P < 0.001
0
10
20
30
40
50
60
4 5 6 7 8
Rel
ativ
e ab
unda
nce
(%)
Alphaproteobacteriar = 0.749, P < 0.001
0
10
20
30
40
4 5 6 7 8
Rel
ativ
e ab
unda
nce
(%)
Actinobacteriar = 0.371, P = 0.014
0
5
10
15
20
25
30
4 5 6 7 8
Rel
ativ
e ab
unda
nce
(%)
Betaproteobacteriar = 0.479, P = 0.001
0
4
8
12
16
20
4 5 6 7 8
Rel
ativ
e ab
unda
nce
(%) Soil pH
Bacteroidetesr = 0.329, P = 0.031
0
3
6
9
12
15
4 5 6 7 8
Rel
ativ
e ab
unda
nce
(%)
Fig. 3. Correlations between the relative abundances of the six dominant bacterial phyla and soil pH. Pearson correlations coefficients (r) areshown for each taxon with associated Bonferroni-corrected P-values.
Bacterial biogeography in arctic soils 3001
© 2010 Society for Applied Microbiology and Blackwell Publishing Ltd, Environmental Microbiology, 12, 2998–3006
An=-‐correla=on between Proteobacteria OTUs and Acidobacteria OTUs is pH-‐driven.

Next steps
• analyze network proper=es such as modularity, diameter, average cluster coefficient and node degree distribu=on using Cytoscape plugin “Network analysis”
• cluster network with Cytoscape plugins “CommFinder”, “clusterMaker” or “MCODE”