KARNAUGH MAPS - Faculty Server Contactfaculty.uml.edu/anh_Tran/Course_Materials/Chpt_05.pdf · 77...
26
77 CHAPTER 5 KARNAUGH MAPS Karnaugh map (K-map) is a graphical method for obtaining the simplest sum-of- products and simplest product-of-sums expressions for a Boolean function. A simplest sum-of-products expression has a minimum number of product terms and the total number of literals in all the product terms combined is also a minimum. Similarly, a simplest product-of-sums expression for a function also has a minimum number of sum terms as well as a minimum number of literals in all the sums combined. A function may have more than one simplest sum-of-products expression and/or more than one simplest product-of-sums expression. 5.1 Function Representation by Karnaugh Map A Karnaugh map for an n-variable Boolean function is partitioned into 2 n parts. Each of the 2 n parts is a box or cell designated to one of the 2 n combinations of input values or input states. Figure 5.1(a) is a 2-variable Karnaugh map with four cells. The left half of the map is assigned to A = 0 and the right half is for A = 1. The upper half is for B = 0 and the lower half for B = 1. The vertical partition for A and the horizontal partition for B create four cells for the four combinations of input values. The values of A and B are labeled respectively on the top and the left side of the map. The corresponding values of AB for each cell are also written at the lower right corner of each cell. Figure 5.1(b) shows the Karnaugh map for the function AB. AB = 1 when A = B = 1. Therefore the lower right cell is filled with a value of 1. Each of the other three cells has a value of 0 because AB = 0 for the other three combinations of input values. The value of either 0 or 1 in each cell is actually the function value. (a) (b) Figure 5.1 (a) Two-variable Karnaugh map. (b) Karnaugh map for AB. The Karnaugh map for a 3-variable function F(A,B,C) is shown in Figure 5.2(a). The map is partitioned into four columns and two rows, which consists of eight cells for 0 A 1 1 0 B 10 11 01 00 0 A 1 1 0 B 0 0 0 1
Transcript of KARNAUGH MAPS - Faculty Server Contactfaculty.uml.edu/anh_Tran/Course_Materials/Chpt_05.pdf · 77...
77
CHAPTER 5
KARNAUGH MAPS
Karnaugh map (K-map) is a graphical method for obtaining the simplest sum-of-
products and simplest product-of-sums expressions for a Boolean function. A simplest
sum-of-products expression has a minimum number of product terms and the total
number of literals in all the product terms combined is also a minimum. Similarly, a
simplest product-of-sums expression for a function also has a minimum number of sum
terms as well as a minimum number of literals in all the sums combined. A function may
have more than one simplest sum-of-products expression and/or more than one simplest
product-of-sums expression.
5.1 Function Representation by Karnaugh Map
A Karnaugh map for an n-variable Boolean function is partitioned into 2n parts.
Each of the 2n parts is a box or cell designated to one of the 2
n combinations of input
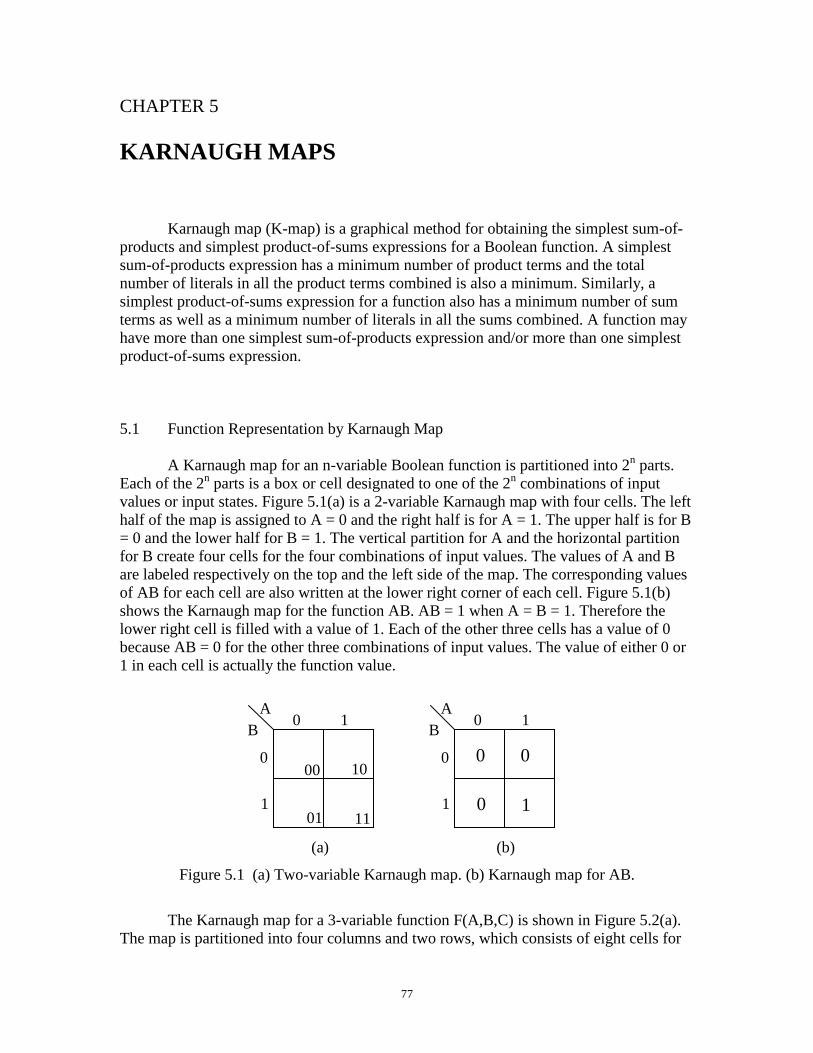
values or input states. Figure 5.1(a) is a 2-variable Karnaugh map with four cells. The left
half of the map is assigned to A = 0 and the right half is for A = 1. The upper half is for B
= 0 and the lower half for B = 1. The vertical partition for A and the horizontal partition
for B create four cells for the four combinations of input values. The values of A and B
are labeled respectively on the top and the left side of the map. The corresponding values
of AB for each cell are also written at the lower right corner of each cell. Figure 5.1(b)
shows the Karnaugh map for the function AB. AB = 1 when A = B = 1. Therefore the
lower right cell is filled with a value of 1. Each of the other three cells has a value of 0
because AB = 0 for the other three combinations of input values. The value of either 0 or
1 in each cell is actually the function value.
(a) (b)
Figure 5.1 (a) Two-variable Karnaugh map. (b) Karnaugh map for AB.
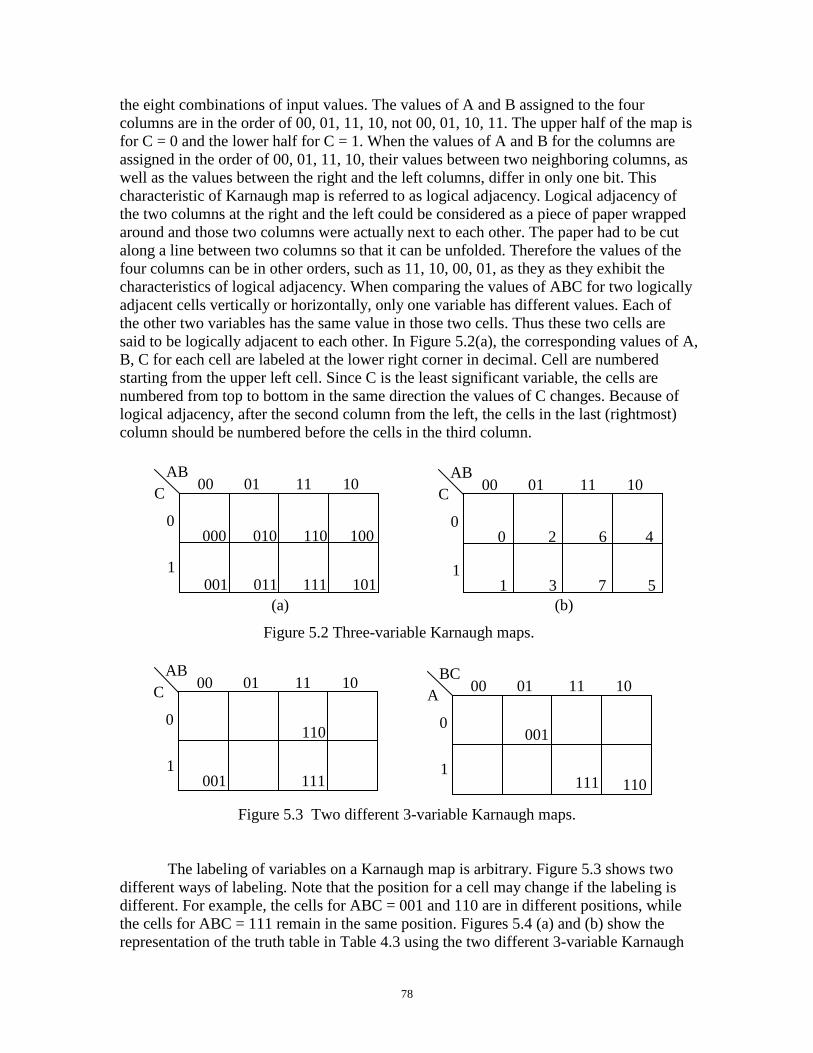
The Karnaugh map for a 3-variable function F(A,B,C) is shown in Figure 5.2(a).
The map is partitioned into four columns and two rows, which consists of eight cells for
0 A
1
1
0
B
10
11 01
00
0 A
1
1
0
B
0 0
0 1
78
the eight combinations of input values. The values of A and B assigned to the four
columns are in the order of 00, 01, 11, 10, not 00, 01, 10, 11. The upper half of the map is
for C = 0 and the lower half for C = 1. When the values of A and B for the columns are
assigned in the order of 00, 01, 11, 10, their values between two neighboring columns, as
well as the values between the right and the left columns, differ in only one bit. This
characteristic of Karnaugh map is referred to as logical adjacency. Logical adjacency of
the two columns at the right and the left could be considered as a piece of paper wrapped
around and those two columns were actually next to each other. The paper had to be cut
along a line between two columns so that it can be unfolded. Therefore the values of the
four columns can be in other orders, such as 11, 10, 00, 01, as they as they exhibit the
characteristics of logical adjacency. When comparing the values of ABC for two logically
adjacent cells vertically or horizontally, only one variable has different values. Each of
the other two variables has the same value in those two cells. Thus these two cells are
said to be logically adjacent to each other. In Figure 5.2(a), the corresponding values of A,
B, C for each cell are labeled at the lower right corner in decimal. Cell are numbered
starting from the upper left cell. Since C is the least significant variable, the cells are
numbered from top to bottom in the same direction the values of C changes. Because of
logical adjacency, after the second column from the left, the cells in the last (rightmost)
column should be numbered before the cells in the third column.
(a) (b)
Figure 5.2 Three-variable Karnaugh maps.
Figure 5.3 Two different 3-variable Karnaugh maps.
The labeling of variables on a Karnaugh map is arbitrary. Figure 5.3 shows two
different ways of labeling. Note that the position for a cell may change if the labeling is
different. For example, the cells for ABC = 001 and 110 are in different positions, while
the cells for ABC = 111 remain in the same position. Figures 5.4 (a) and (b) show the
representation of the truth table in Table 4.3 using the two different 3-variable Karnaugh
00 AB
01 11 10
1
0
C
000
001 011
010
111
110 100
101
00 AB
01 11 10
1
0
C
0
1 3
2
7
6 4
5
00 AB
01 11 10
1
0
C
001 111
110
00 BC
01 11 10
1
0
A
001
111 110
79
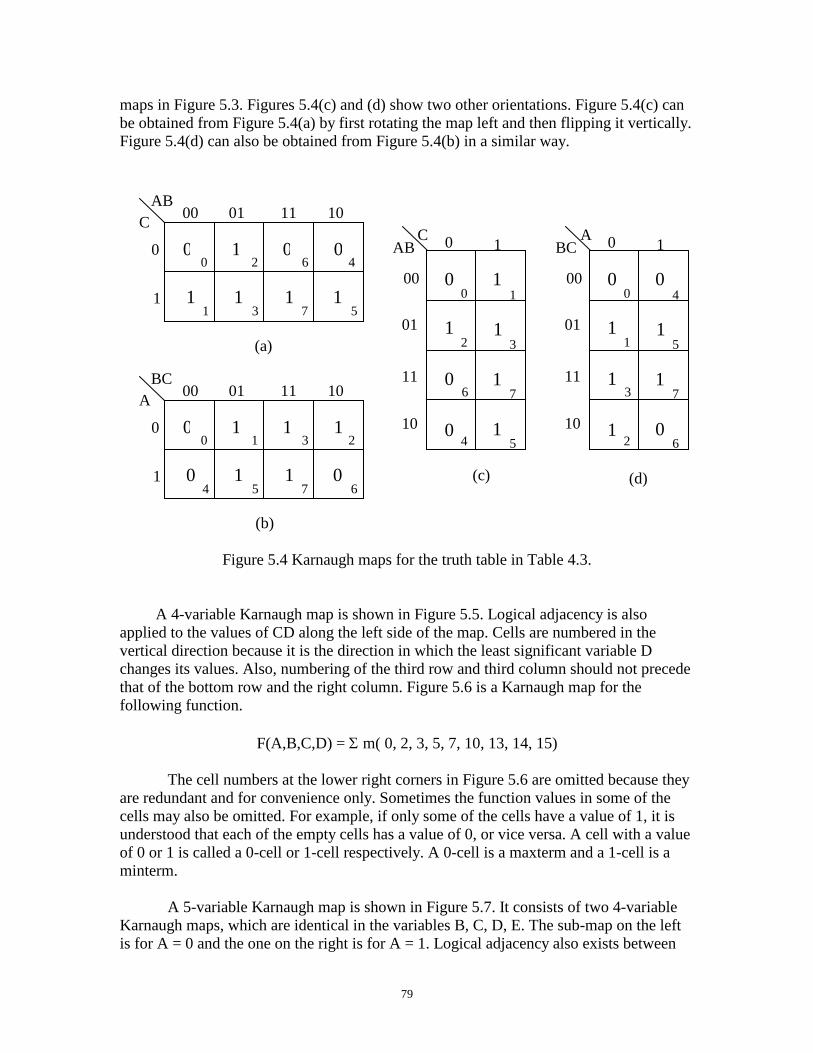
maps in Figure 5.3. Figures 5.4(c) and (d) show two other orientations. Figure 5.4(c) can
be obtained from Figure 5.4(a) by first rotating the map left and then flipping it vertically.
Figure 5.4(d) can also be obtained from Figure 5.4(b) in a similar way.
Figure 5.4 Karnaugh maps for the truth table in Table 4.3.
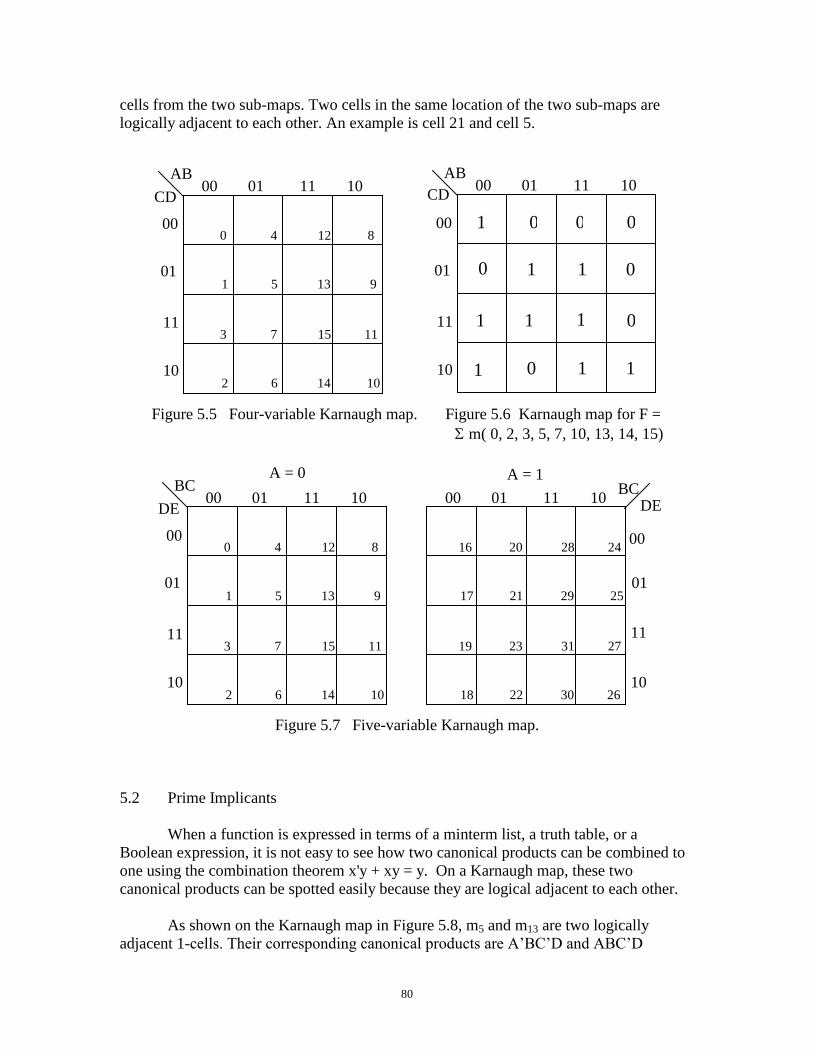
A 4-variable Karnaugh map is shown in Figure 5.5. Logical adjacency is also
applied to the values of CD along the left side of the map. Cells are numbered in the
vertical direction because it is the direction in which the least significant variable D
changes its values. Also, numbering of the third row and third column should not precede
that of the bottom row and the right column. Figure 5.6 is a Karnaugh map for the
following function.
F(A,B,C,D) = m( 0, 2, 3, 5, 7, 10, 13, 14, 15)
The cell numbers at the lower right corners in Figure 5.6 are omitted because they
are redundant and for convenience only. Sometimes the function values in some of the
cells may also be omitted. For example, if only some of the cells have a value of 1, it is
understood that each of the empty cells has a value of 0, or vice versa. A cell with a value
of 0 or 1 is called a 0-cell or 1-cell respectively. A 0-cell is a maxterm and a 1-cell is a
minterm.
A 5-variable Karnaugh map is shown in Figure 5.7. It consists of two 4-variable
Karnaugh maps, which are identical in the variables B, C, D, E. The sub-map on the left
is for A = 0 and the one on the right is for A = 1. Logical adjacency also exists between
00 AB
01 11 10
1
0
C
0
1 3
2
7
6 4
5
0 0 0 1
1 1 1 1
00 BC
01 11 10
1
0
A
0
4 5
1
7
3 2
6
0 1 1 1
0 1 1 0
00
BC
01
11
10
1 0 A
0 4
5 1
7 3
2 6
0
1
1
1
0
1
1
0
00
AB
01
11
10
1 0 C
0 1
3 2
7 6
4 5
0
0
0
1
1
1
1
1
(a)
(b)
(c) (d)
80
cells from the two sub-maps. Two cells in the same location of the two sub-maps are
logically adjacent to each other. An example is cell 21 and cell 5.
Figure 5.5 Four-variable Karnaugh map. Figure 5.6 Karnaugh map for F =
m( 0, 2, 3, 5, 7, 10, 13, 14, 15)
Figure 5.7 Five-variable Karnaugh map.
5.2 Prime Implicants
When a function is expressed in terms of a minterm list, a truth table, or a
Boolean expression, it is not easy to see how two canonical products can be combined to
one using the combination theorem x'y + xy = y. On a Karnaugh map, these two
canonical products can be spotted easily because they are logical adjacent to each other.
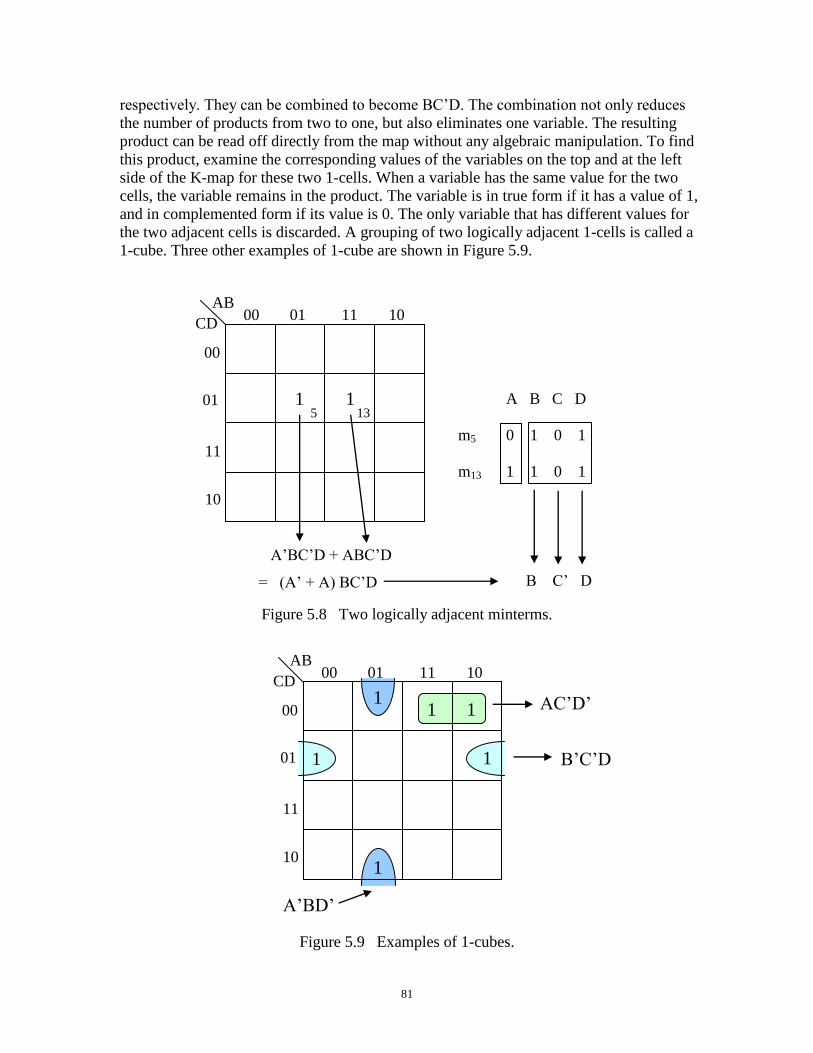
As shown on the Karnaugh map in Figure 5.8, m5 and m13 are two logically
adjacent 1-cells. Their corresponding canonical products are A’BC’D and ABC’D
CD 00
AB 01 11 10
0
1 5
4
13
12 8
9
00
01
11
10
3
2 6
7
14
15 11
10
00 AB
01 11 10
1 0 0 010 0 1 1 0
00
01
11
10
1 1 0 1
1 0 1 1
CD
DE 00
BC 01 11 10
0
1 5
4
13
12 8
9
00
01
11
10
3
2 6
7
14
15 11
10
A = 0
DE 00
BC 01 11 10
16
17 21
20
29
28 24
25
00
01
11
10
19
18 22
23
30
31 27
26
A = 1
81
respectively. They can be combined to become BC’D. The combination not only reduces
the number of products from two to one, but also eliminates one variable. The resulting
product can be read off directly from the map without any algebraic manipulation. To find
this product, examine the corresponding values of the variables on the top and at the left
side of the K-map for these two 1-cells. When a variable has the same value for the two
cells, the variable remains in the product. The variable is in true form if it has a value of 1,
and in complemented form if its value is 0. The only variable that has different values for
the two adjacent cells is discarded. A grouping of two logically adjacent 1-cells is called a
1-cube. Three other examples of 1-cube are shown in Figure 5.9.
Figure 5.8 Two logically adjacent minterms.
Figure 5.9 Examples of 1-cubes.
00 AB
01 11 10 CD
1 1
00
01
11
10
A B C D
m5 0 1 0 1
m13 1 1 0 1
B C’ D
A’BC’D + ABC’D
= (A’ + A) BC’D
5 13
00 AB
01 11 10 CD
00
01
11
10
A’BD’
1 1
1 1
1
1
AC’D’
B’C’D
B’C’
82
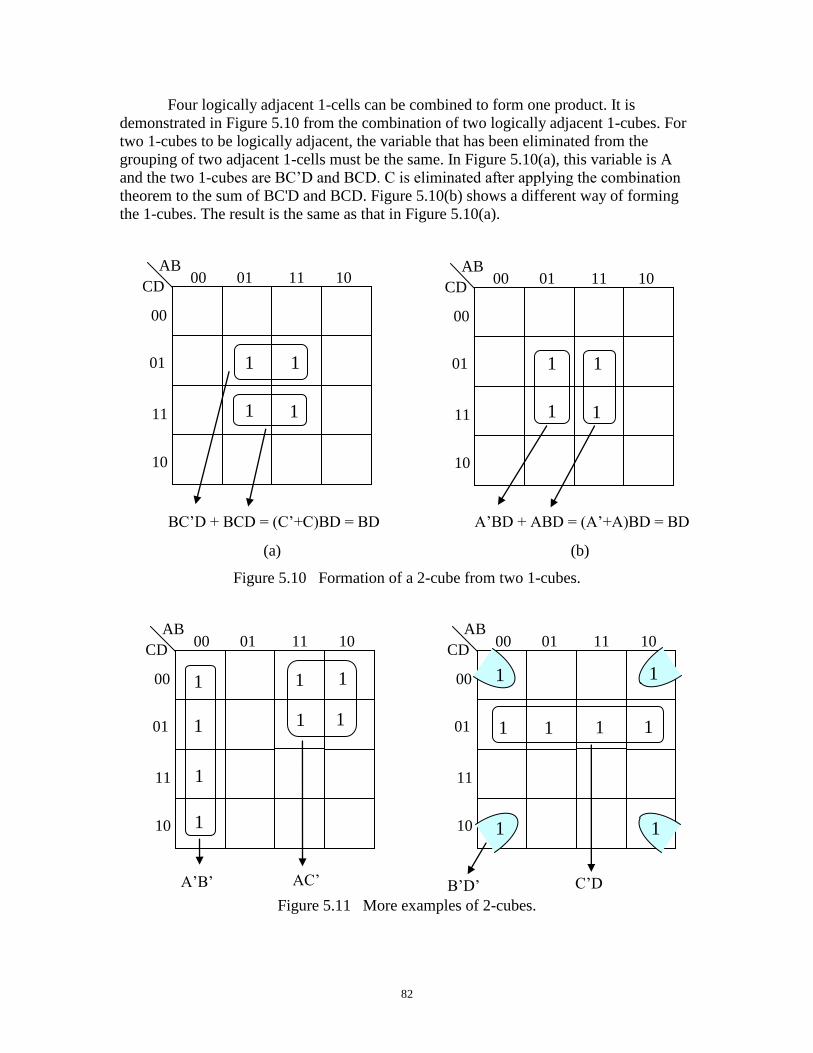
Four logically adjacent 1-cells can be combined to form one product. It is
demonstrated in Figure 5.10 from the combination of two logically adjacent 1-cubes. For
two 1-cubes to be logically adjacent, the variable that has been eliminated from the
grouping of two adjacent 1-cells must be the same. In Figure 5.10(a), this variable is A
and the two 1-cubes are BC’D and BCD. C is eliminated after applying the combination
theorem to the sum of BC'D and BCD. Figure 5.10(b) shows a different way of forming
the 1-cubes. The result is the same as that in Figure 5.10(a).
(a) (b)
Figure 5.10 Formation of a 2-cube from two 1-cubes.
Figure 5.11 More examples of 2-cubes.
00 AB
01 11 10 CD
00
01
11
10
BC’D + BCD = (C’+C)BD = BD
1
1 1
1
00 AB
01 11 10 CD
00
01
11
10
A’BD + ABD = (A’+A)BD = BD
1
1 1
1
00 AB
01 11 10 CD
00
01
11
10
A’B’
1
1
1
1
1
1
AC’
1
1
1
1
00 AB
01 11 10 CD
00
01
11
10
C’D
1 1
B’D’
1 1
1 1
1
1 1
83
When two 1-cubes are logically adjacent to each other, the four 1-cells in the two 1-
cubes should be in a square or rectangle. The latter appears to be either a column or a row.
The product resulted from the combination of four logically adjacent 1-cells can also be
read off directly from the map. A variable with different values from the four 1-cells
should be discarded. A grouping of four logically adjacent 1-cells is called a 2-cube.
Some more examples are given in Figure 5.11. When the four 1-cells are from one
column, the product can be read off just from the values on the top of this column.
Similarly, when they are from one row, the values to the left of this row provide the
values for the product.
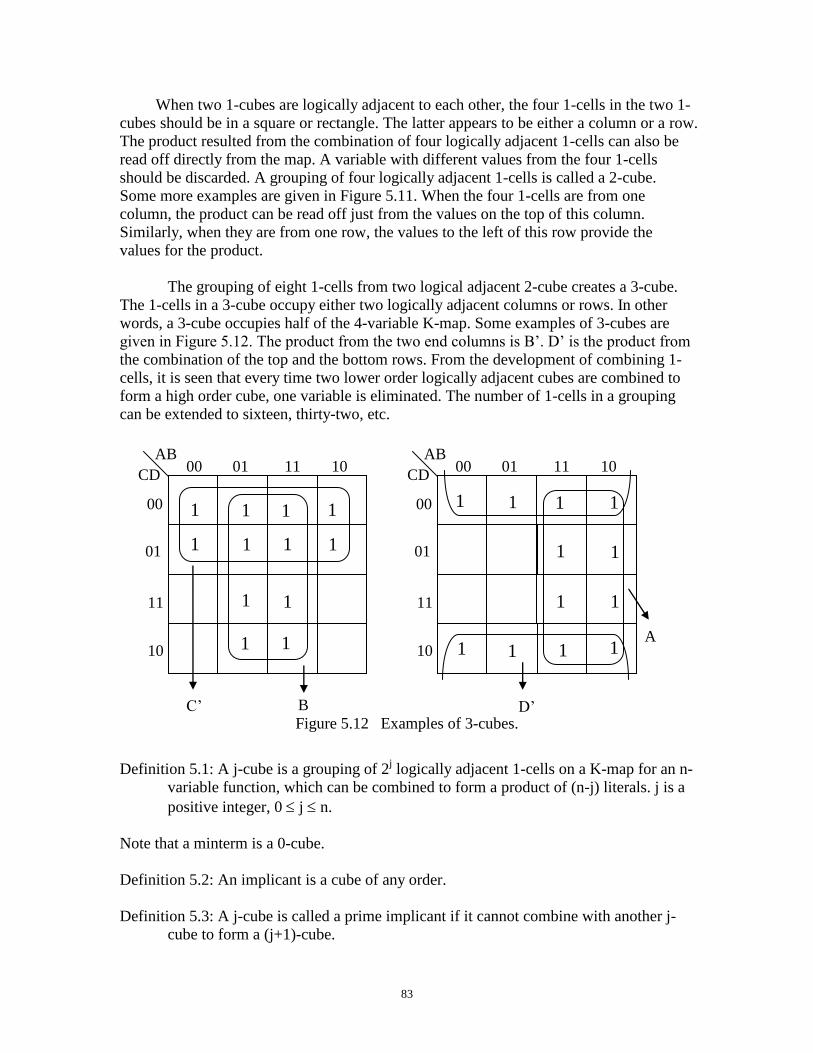
The grouping of eight 1-cells from two logical adjacent 2-cube creates a 3-cube.
The 1-cells in a 3-cube occupy either two logically adjacent columns or rows. In other
words, a 3-cube occupies half of the 4-variable K-map. Some examples of 3-cubes are
given in Figure 5.12. The product from the two end columns is B’. D’ is the product from
the combination of the top and the bottom rows. From the development of combining 1-
cells, it is seen that every time two lower order logically adjacent cubes are combined to
form a high order cube, one variable is eliminated. The number of 1-cells in a grouping
can be extended to sixteen, thirty-two, etc.
Figure 5.12 Examples of 3-cubes.
Definition 5.1: A j-cube is a grouping of 2j logically adjacent 1-cells on a K-map for an n-
variable function, which can be combined to form a product of (n-j) literals. j is a
positive integer, 0 j n.
Note that a minterm is a 0-cube.
Definition 5.2: An implicant is a cube of any order.
Definition 5.3: A j-cube is called a prime implicant if it cannot combine with another j-
cube to form a (j+1)-cube.
D’
00 AB
01 11 10 CD
00
01
11
10
C’
1
1 1
1 1
B
1
1
1
1 1
1
1
1
1
1 1
1
00 AB
01 11 10 CD
00
01
11
10
A
1
1
1
1
1
1
1 1
1
1
1
1 1
84
A prime implicant can also be defined as an implicant that cannot be included in
or be part of another implicant. In other words, it is a grouping that cannot be enlarged.
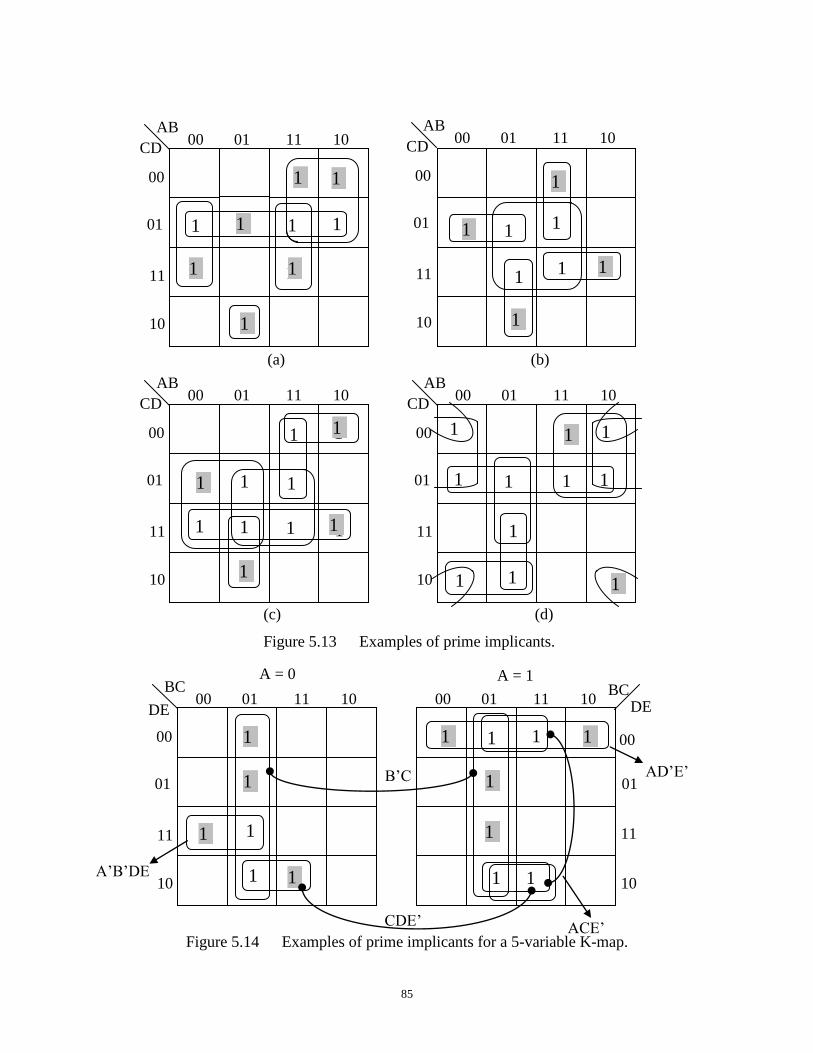
Some examples of prime implicants are shown on the four K-maps in Figure 5.13.
Some of the 1-cells are highlighted, which will be explained later. In Figure 5.13(a), there
is an isolated 1-cell not adjacent to any other 1-cells. Therefore the isolated 1-cell is a
prime implicant. The prime implicants for the four K-maps in Figure 5.13 are listed
below.
(a) A’BCD’, A’B’D, ABD, C’D, AC’
(b) A’C’D, A’BC, ACD, ABC’, BD
(c) A’BC, ABC’, AC’D’, A’D, BD, CD
(d) A’CD’, A’BC, A’BD, B’D’, B’C’, C’D, AC’
An example of prime implicants on a 5-variable Karnaugh map is shown in Figure
5.14. A prime implicant on a 5-variable K-map may occur in either one of the two 4-
variable sub-maps, such as ACD’E. The 1-cells of a prime implicant can also be from
both sub-maps, such as B’ and CDE’. When a prime implicant comprises of 1-cells from
both sub-maps, the 1-cells should fall equally on the two sub-maps and in identical
locations. The variable A is always discarded in the product for such a prime implicant.
In Figures 5.13 and 5.14, it is seen that a 1-cell may be included in one or more
than one prime implicant. For example, in Figure 5.13(c), m8 is included in the prime
implicant AC’D’ only. m12 exists in AC’D’ and ABC’. m7 occurs in A’D, BD, CD, and
A’BC.
Definition 5.4: If a 1-cell can exist in one and only one prime implicant, it is called a
distinguished 1-cell.
Definition 5.5: A prime implicant is called an essential prime implicant if it includes at
least one distinguished 1-cell.
The 1-cells that are highlighted on the K-maps in Figures 5.13 and 5.14 are
distinguished 1-cells. The essential prime implicants in Figure 5.13 are as follows:
(a) A’BCD’, A’B’D, ABD, C’D, AC’
(b) A’C’D, A’BC, ACD, ABC’
(c) A’BC, AC’D’, A’D, CD
(d) B’D’, AC’
There are five prime implicants in Figure 5.14, B’C, CDE’, AD’E’, A’B’DE, and ACE’.
All are essential except ACE’.
85
(a) (b)
(c) (d)
Figure 5.13 Examples of prime implicants.
Figure 5.14 Examples of prime implicants for a 5-variable K-map.
00 AB
01 11 10 CD
00
01
11
10
1
1 1
1 1
1
1
1
1
1
1
1
00 AB
01 11 10 CD
00
01
11
10
1
1
1
1
1
1
1
1
1
1
1
1
1 1
1
1
1
00
AB 01 11 10
CD
00
01
11
10
1
1
1
1
1
1 1
1
1
1
1
1
1
1
1
00 AB
01 11 10 CD
00
01
11
10
1
1
1
1
1
1
1
1
1
1
1
1
1
1
1
1
1
1
DE 00
BC 01 11 10
00
01
11
10
A = 0
DE 00
BC 01 11 10
00
11
10
A = 1
1
1
01
CDE’
AD’E’ B’C
1
1
1
1
1
1
1
1
1
1
11
1
1
1
1
1
1
1 1
1
A’B’DE
ACE’
86
5.3 Simplest Sum-of-Products Expression
In finding the simplest sum-of-products expression for a function from Karnaugh
map, each minterm must be covered or grouped at least once. When a minterm is a
distinguished 1-cell, there is no other option except to select the prime implicant
including this 1-cell, which is an essential prime implicant by Definition 5.5. When a
prime implicant is selected, except an isolated 1-cell, the prime implicant will also covers
some other minterms. After the selection of all the essential prime implicants, if there are
still some uncovered minterms, it is necessary to select some other prime implicants for
the coverage of these remaining minterms. To ensure that the sum-of-products expression
is minimal, they must be covered by a minimum number of prime implicants called
secondary essential prime implicants. Also the number of literals in the secondary
essential prime implicants should be a minimum. The selection of essential prime
implicants is unique for a function, whereas there may be more than one option in the
selection of secondary essential prime implicants. The procedure is summarized below in
two steps.
(i) Select all the essential prime implicants.
(ii) Select a minimum number of secondary essential prime implicants with a
minimum number of literals for all the 1-cells not covered by the essential
prime implicants.
The minimization algorithm just developed is used to find the simplest sum-of-
products expressions for the Karnaugh maps in Figures 5.13 and 5.14. Since all the five
prime implicants in Figure 5.13(a) are essential, the simplest sum-of-products expression
is
F(A,B,C,D) = A’BCD’ + A’B’D + ABD + C’D + AC’
Similarly, the simplest expression for Figure 5.14 is
F(A,B,C,D,E) = B’C + CDE’ + ACD’E +AD’E’
For the Karnaugh map in Figure 5.13(b), all minterms are covered after the selection of
the essential prime implicants.
F(A,B,C,D) = A’C’D + A’BC + ACD + ABC’
The prime implicant BD is not required for the simplest sum-of-products. This example
suggests that selection must begin with the essential prime implicants, not the largest
groupings.
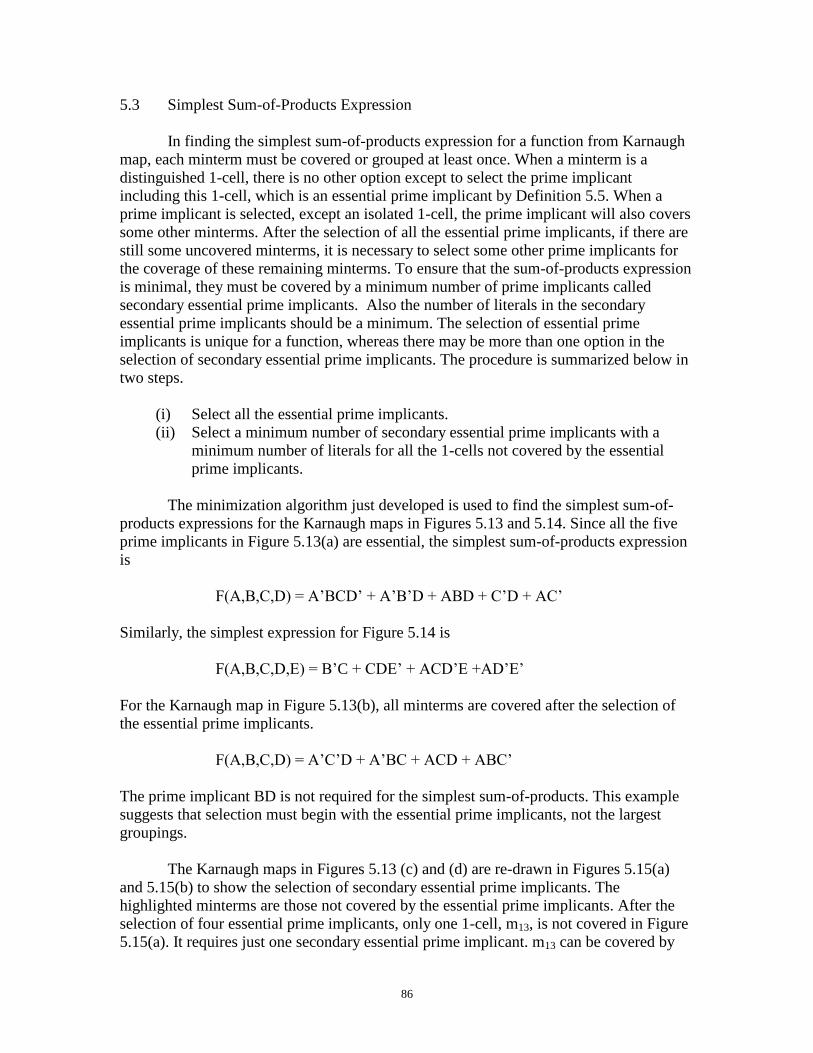
The Karnaugh maps in Figures 5.13 (c) and (d) are re-drawn in Figures 5.15(a)
and 5.15(b) to show the selection of secondary essential prime implicants. The
highlighted minterms are those not covered by the essential prime implicants. After the
selection of four essential prime implicants, only one 1-cell, m13, is not covered in Figure
5.15(a). It requires just one secondary essential prime implicant. m13 can be covered by
87
either BD or ABC’. The choice is obviously BD because it has two literals, one less than
ABC’. Thus
F(A,B,C,D) = A’BC + AC’D’ + A’D + CD + BD
For the Karnaugh map in Figure 5.15(b), there are four 1-cells not covered by the
essential prime implicants B’D’ and AC’. They can be covered by two prime implicants,
which are C’D and A’BC.
F(A,B,C,D) = B’D’ + AC’ + C’D + A’BC
(a) (b)
Figure 5.15 Minimization of the Karnaugh maps in Figures 5.13(c) and 5.13(d).
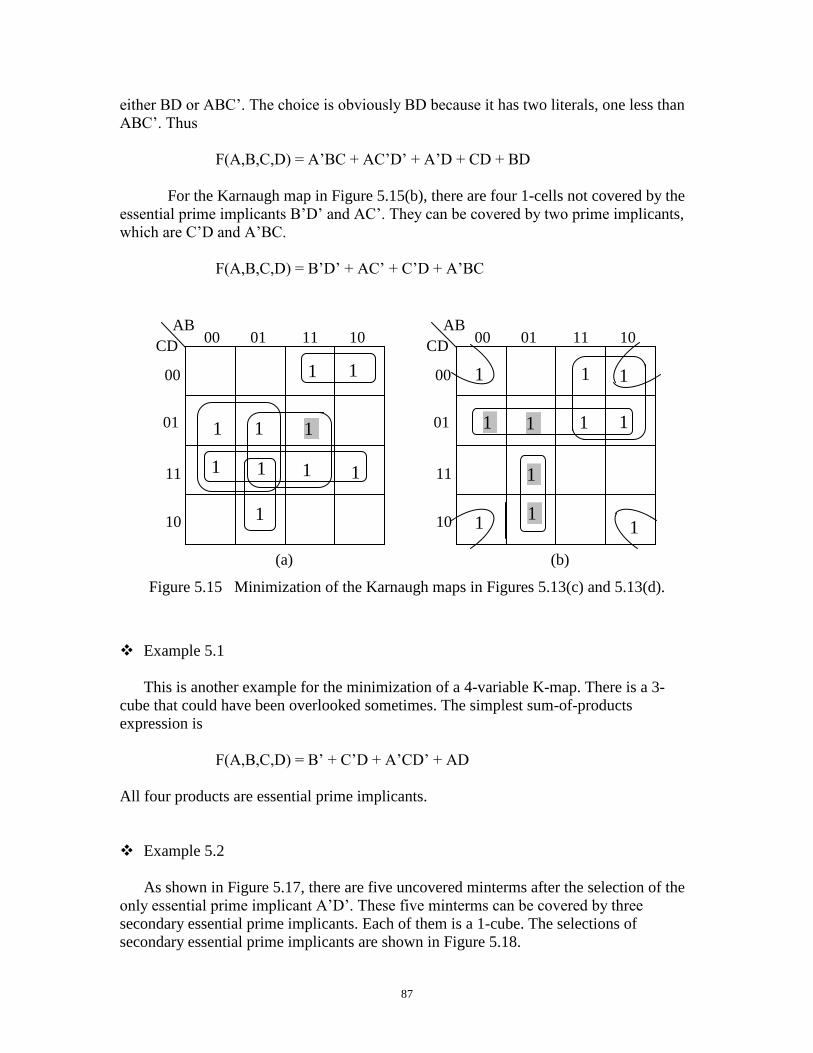
Example 5.1
This is another example for the minimization of a 4-variable K-map. There is a 3-
cube that could have been overlooked sometimes. The simplest sum-of-products
expression is
F(A,B,C,D) = B’ + C’D + A’CD’ + AD
All four products are essential prime implicants.
Example 5.2
As shown in Figure 5.17, there are five uncovered minterms after the selection of the
only essential prime implicant A’D’. These five minterms can be covered by three
secondary essential prime implicants. Each of them is a 1-cube. The selections of
secondary essential prime implicants are shown in Figure 5.18.
00 AB
01 11 10 CD
00
01
11
10
1 1
1
1
1
1
1
1
1
1
1
1
1
1
00 AB
01 11 10 CD
00
01
11
10
1
1
1
1
1 1
1
1
1
1
1
1
1
1
1
1
1
88
Figure 5.16 K-map for Example 5.1. Figure 5.17 K-map for Example 5.2.
Figure 5.18 Selections of secondary essential prime implicants for Example 5.2.
00 AB
01 11 10 CD
00
01
11
10 1
1
1
1
1
1
1
1
1
1
1 1
1 1
00 AB
01 11 10 CD
00
01
11
10 1
1
1
1
1
1
1
1
1
1
1
1 1
1
00 AB
01 11 10 CD
00
01
11
10 1
1
1
1
1
1
1
1
1
1
1
1 1
1
00 AB
01 11 10 CD
00
01
11
10 1
1
1
1
1
1
1
1
1
1
1
1 1
1
00 AB
01 11 10 CD
00
01
11
10 1
1
1
1
1
1
1
1
1
1
1
1 1
1
(a)
(c) (d)
(b)
00 AB
01 11 10 CD
00
01
11
10 1
1
1
1
1
1
1
1
1
1
1
1 1
1
89
Thus the simplest sum-of-products expressions corresponding to the four different
selections of secondary essential prime implicants are listed below. Secondary essential
prime implicants in the expressions are underlined.
(a) F(A,B,C,D) = A’D’ + BCD + AC’D + AB’C’
(b) F(A,B,C,D) = A’D’ + BCD + AC’D + B’C’D’
(c) F(A,B,C,D) = A’D’ + BCD + ABD + AB’C’
(d) F(A,B,C,D) = A’D’ + A’BC + ABD + AB’C’
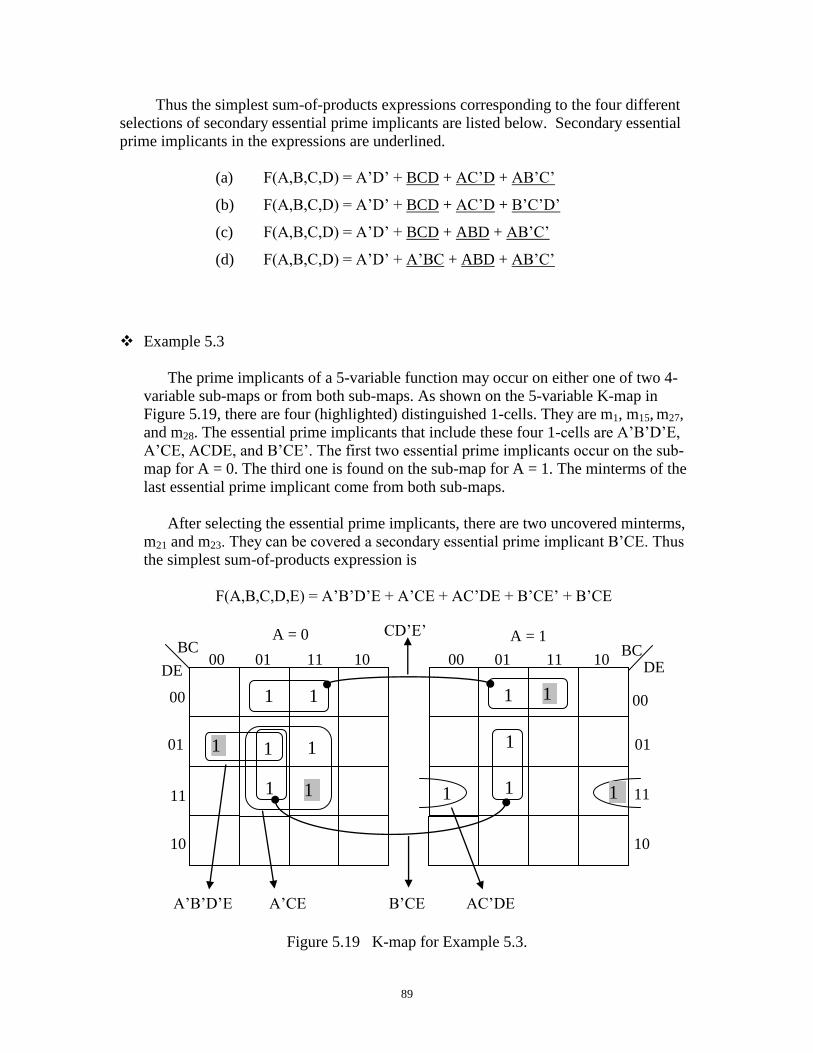
Example 5.3
The prime implicants of a 5-variable function may occur on either one of two 4-
variable sub-maps or from both sub-maps. As shown on the 5-variable K-map in
Figure 5.19, there are four (highlighted) distinguished 1-cells. They are m1, m15, m27,
and m28. The essential prime implicants that include these four 1-cells are A’B’D’E,
A’CE, ACDE, and B’CE’. The first two essential prime implicants occur on the sub-
map for A = 0. The third one is found on the sub-map for A = 1. The minterms of the
last essential prime implicant come from both sub-maps.
After selecting the essential prime implicants, there are two uncovered minterms,
m21 and m23. They can be covered a secondary essential prime implicant B’CE. Thus
the simplest sum-of-products expression is
F(A,B,C,D,E) = A’B’D’E + A’CE + AC’DE + B’CE’ + B’CE
Figure 5.19 K-map for Example 5.3.
DE 00
BC 01 11 10
00
01
11
10
A = 0
DE 00
BC 01 11 10
00
11
10
A = 1
01
AC’DE
1
1
1
1
1
1
1
1
1
1
1
11
1
1
11
A’CE
CD’E’
B’CE A’B’D’E
90
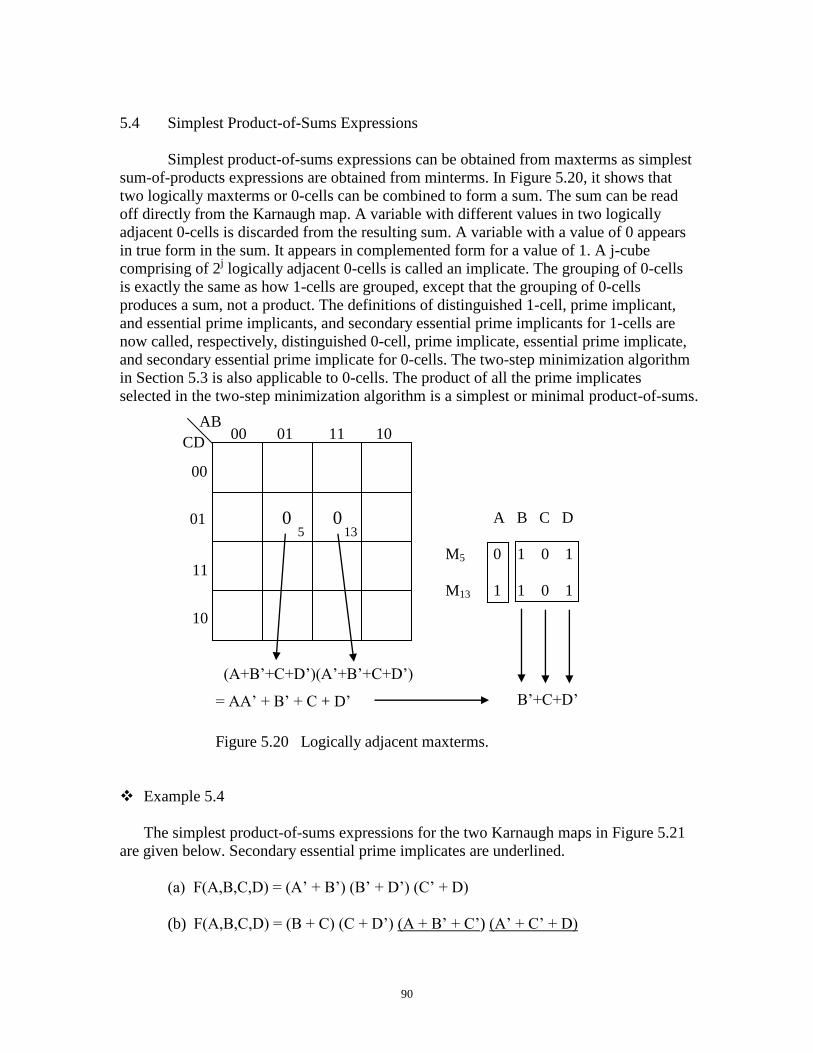
5.4 Simplest Product-of-Sums Expressions
Simplest product-of-sums expressions can be obtained from maxterms as simplest
sum-of-products expressions are obtained from minterms. In Figure 5.20, it shows that
two logically maxterms or 0-cells can be combined to form a sum. The sum can be read
off directly from the Karnaugh map. A variable with different values in two logically
adjacent 0-cells is discarded from the resulting sum. A variable with a value of 0 appears
in true form in the sum. It appears in complemented form for a value of 1. A j-cube
comprising of 2j logically adjacent 0-cells is called an implicate. The grouping of 0-cells
is exactly the same as how 1-cells are grouped, except that the grouping of 0-cells
produces a sum, not a product. The definitions of distinguished 1-cell, prime implicant,
and essential prime implicants, and secondary essential prime implicants for 1-cells are
now called, respectively, distinguished 0-cell, prime implicate, essential prime implicate,
and secondary essential prime implicate for 0-cells. The two-step minimization algorithm
in Section 5.3 is also applicable to 0-cells. The product of all the prime implicates
selected in the two-step minimization algorithm is a simplest or minimal product-of-sums.
Figure 5.20 Logically adjacent maxterms.
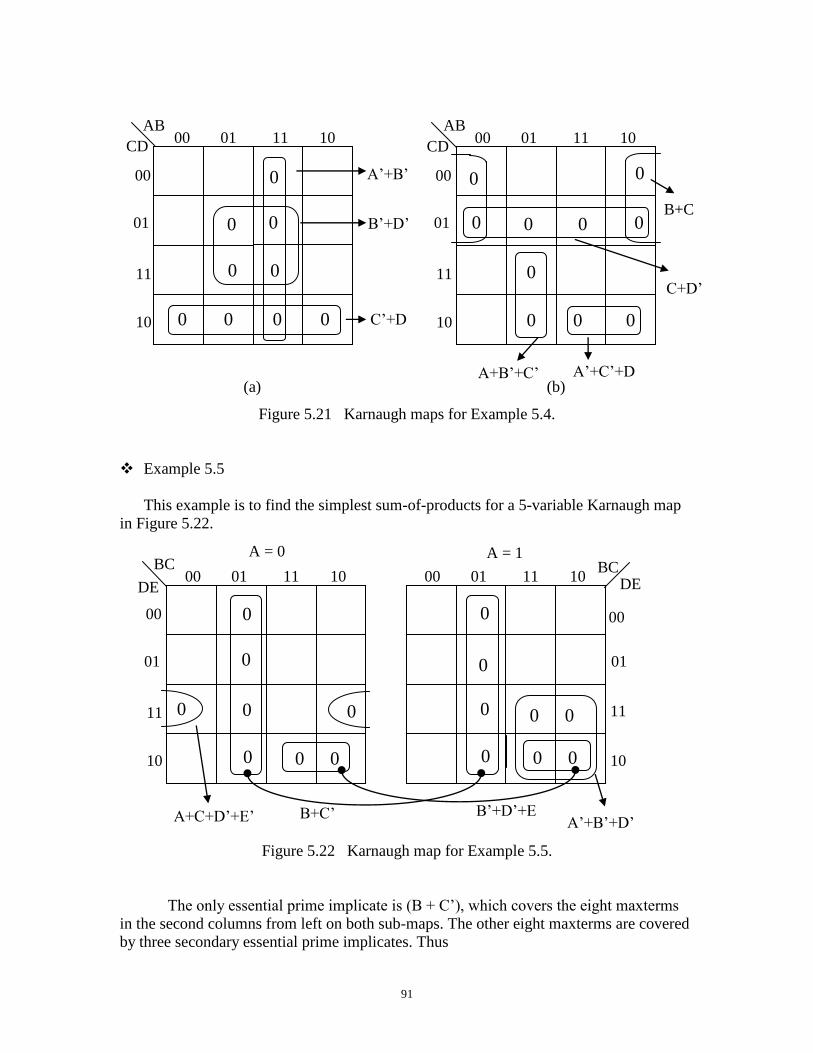
Example 5.4
The simplest product-of-sums expressions for the two Karnaugh maps in Figure 5.21
are given below. Secondary essential prime implicates are underlined.
(a) F(A,B,C,D) = (A’ + B’) (B’ + D’) (C’ + D)
(b) F(A,B,C,D) = (B + C) (C + D’) (A + B’ + C’) (A’ + C’ + D)
00 AB
01 11 10 CD
0 0
00
01
11
10
A B C D
M5 0 1 0 1
M13 1 1 0 1
B’+C+D’
(A+B’+C+D’)(A’+B’+C+D’)
= AA’ + B’ + C + D’
5 13
91
(a) (b)
Figure 5.21 Karnaugh maps for Example 5.4.
Example 5.5
This example is to find the simplest sum-of-products for a 5-variable Karnaugh map
in Figure 5.22.
Figure 5.22 Karnaugh map for Example 5.5.
The only essential prime implicate is (B + C’), which covers the eight maxterms
in the second columns from left on both sub-maps. The other eight maxterms are covered
by three secondary essential prime implicates. Thus
B+C
00 AB
01 11 10 CD
00
01
11
10 0
0
0
1
0
1
0
0
0
0
0
0
C+D’
A’+C’+D A+B’+C’
00 AB
01 11 10 CD
00
01
11
10
0
0
0 0 0
0
0
0
0 C’+D
A’+B’
B’+D’
B+C’
DE 00
BC 01 11 10
00
01
11
10
A = 0
DE 00
BC 01 11 10
00
11
10
A = 1
0
0 01
B’+D’+E A’+B’+D’ A+C+D’+E’
0
0
0
0 0 0
0
0
0 0 0
0 0 0
92
F(A,B,C,D,E) = (B + C’) (B’ + D’ + E) (A + C + D’ + E’) (A’ + B’ + D’)
5.5 Minimization of Incompletely Specified Functions
In minimizing incompletely specified functions, the minimization algorithm in
Section 5.3 is still applicable. The question is when a don’t-care term needs to be
included in a grouping. The following rules can be followed to determine when a don’t-
care term should be included in the formation of a grouping.
(1) Do not consider a don't-care term to be a distinguished cell. A don’t care
term is a distinguished cell if it can be included in only one prime implicant
(or implicate).
(2) Always include don't-care terms with 1-cells or 0-cells to form a higher
order cube or larger grouping.
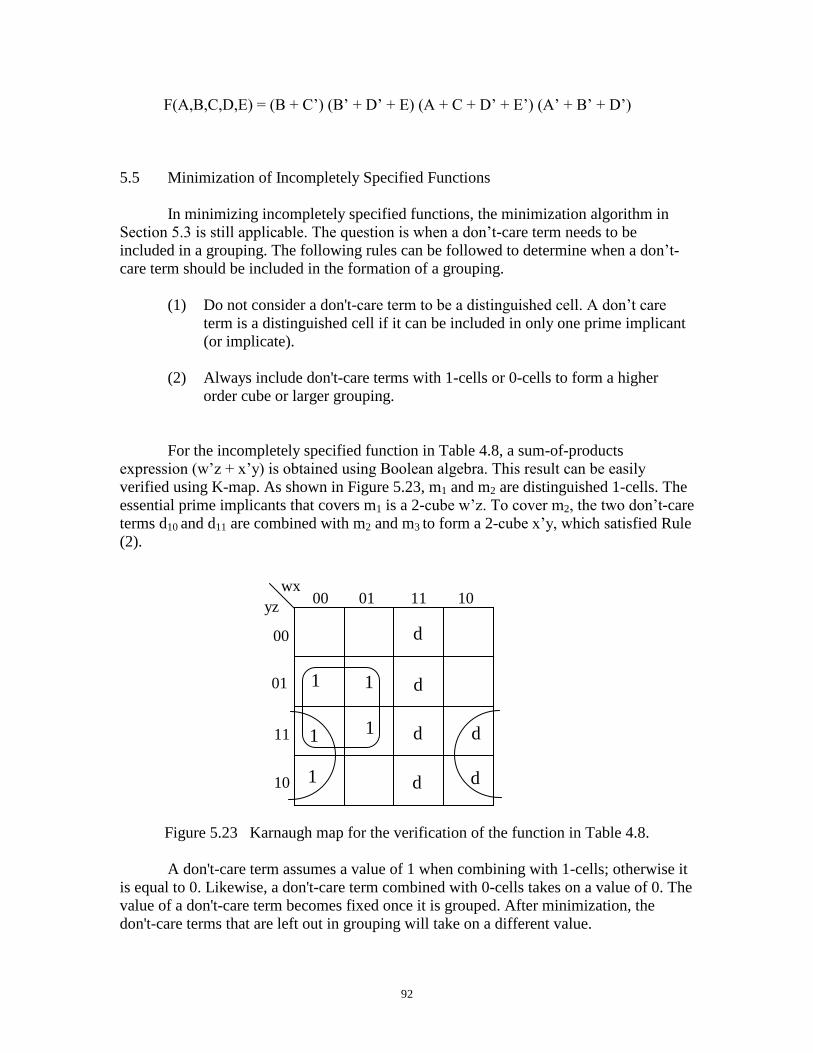
For the incompletely specified function in Table 4.8, a sum-of-products
expression (w’z + x’y) is obtained using Boolean algebra. This result can be easily
verified using K-map. As shown in Figure 5.23, m1 and m2 are distinguished 1-cells. The
essential prime implicants that covers m1 is a 2-cube w’z. To cover m2, the two don’t-care
terms d10 and d11 are combined with m2 and m3 to form a 2-cube x’y, which satisfied Rule
(2).
Figure 5.23 Karnaugh map for the verification of the function in Table 4.8.
A don't-care term assumes a value of 1 when combining with 1-cells; otherwise it
is equal to 0. Likewise, a don't-care term combined with 0-cells takes on a value of 0. The
value of a don't-care term becomes fixed once it is grouped. After minimization, the
don't-care terms that are left out in grouping will take on a different value.
00 wx
01 11 10 yz
00
01
11
10 1
d
d
d
d d
1
1
1
d
1
93
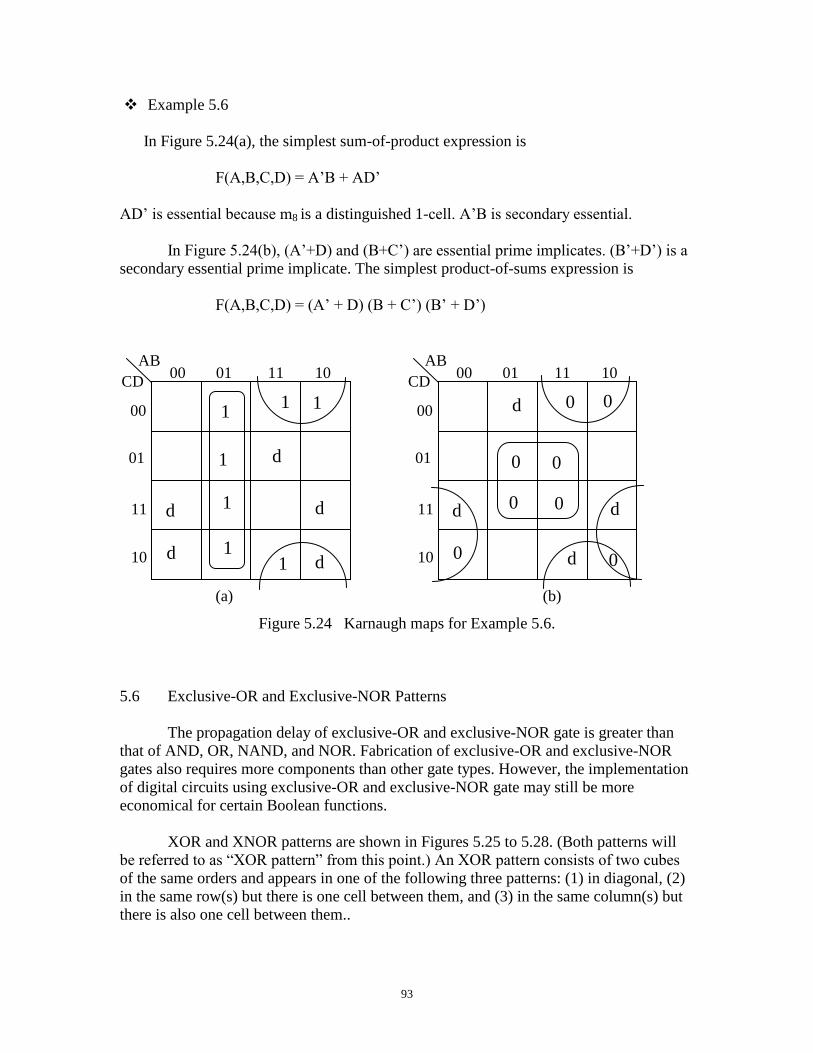
Example 5.6
In Figure 5.24(a), the simplest sum-of-product expression is
F(A,B,C,D) = A’B + AD’
AD’ is essential because m8 is a distinguished 1-cell. A’B is secondary essential.
In Figure 5.24(b), (A’+D) and (B+C’) are essential prime implicates. (B’+D’) is a
secondary essential prime implicate. The simplest product-of-sums expression is
F(A,B,C,D) = (A’ + D) (B + C’) (B’ + D’)
(a) (b)
Figure 5.24 Karnaugh maps for Example 5.6.
5.6 Exclusive-OR and Exclusive-NOR Patterns
The propagation delay of exclusive-OR and exclusive-NOR gate is greater than
that of AND, OR, NAND, and NOR. Fabrication of exclusive-OR and exclusive-NOR
gates also requires more components than other gate types. However, the implementation
of digital circuits using exclusive-OR and exclusive-NOR gate may still be more
economical for certain Boolean functions.
XOR and XNOR patterns are shown in Figures 5.25 to 5.28. (Both patterns will
be referred to as “XOR pattern” from this point.) An XOR pattern consists of two cubes
of the same orders and appears in one of the following three patterns: (1) in diagonal, (2)
in the same row(s) but there is one cell between them, and (3) in the same column(s) but
there is also one cell between them..
00 AB
01 11 10 CD
00
01
11
10 d
1
1
1
d
1
1
d
d d
1
1
1 1
00 AB
01 11 10 CD
00
01
11
10 0
0
0
d d
d
0 0
0 0
0
d
94
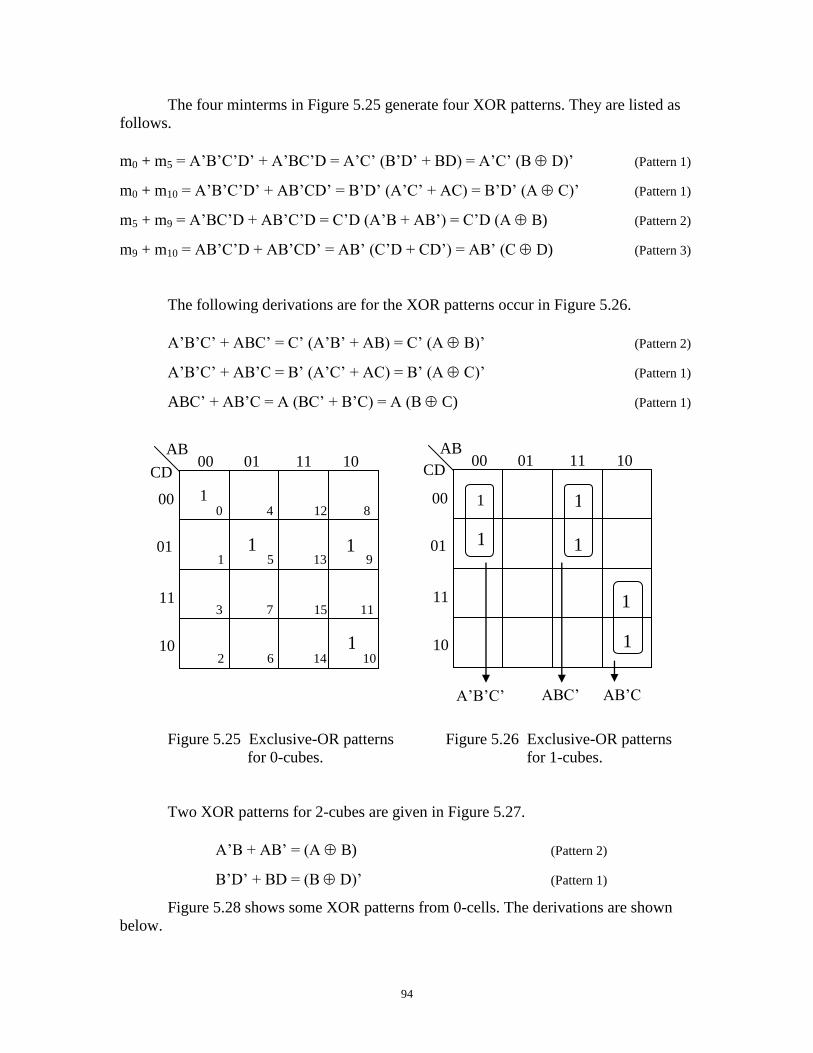
The four minterms in Figure 5.25 generate four XOR patterns. They are listed as
follows.
m0 + m5 = A’B’C’D’ + A’BC’D = A’C’ (B’D’ + BD) = A’C’ (B D)’ (Pattern 1)
m0 + m10 = A’B’C’D’ + AB’CD’ = B’D’ (A’C’ + AC) = B’D’ (A C)’ (Pattern 1)
m5 + m9 = A’BC’D + AB’C’D = C’D (A’B + AB’) = C’D (A B) (Pattern 2)
m9 + m10 = AB’C’D + AB’CD’ = AB’ (C’D + CD’) = AB’ (C D) (Pattern 3)
The following derivations are for the XOR patterns occur in Figure 5.26.
A’B’C’ + ABC’ = C’ (A’B’ + AB) = C’ (A B)’ (Pattern 2)
A’B’C’ + AB’C = B’ (A’C’ + AC) = B’ (A C)’ (Pattern 1)
ABC’ + AB’C = A (BC’ + B’C) = A (B C) (Pattern 1)
Figure 5.25 Exclusive-OR patterns Figure 5.26 Exclusive-OR patterns
for 0-cubes. for 1-cubes.
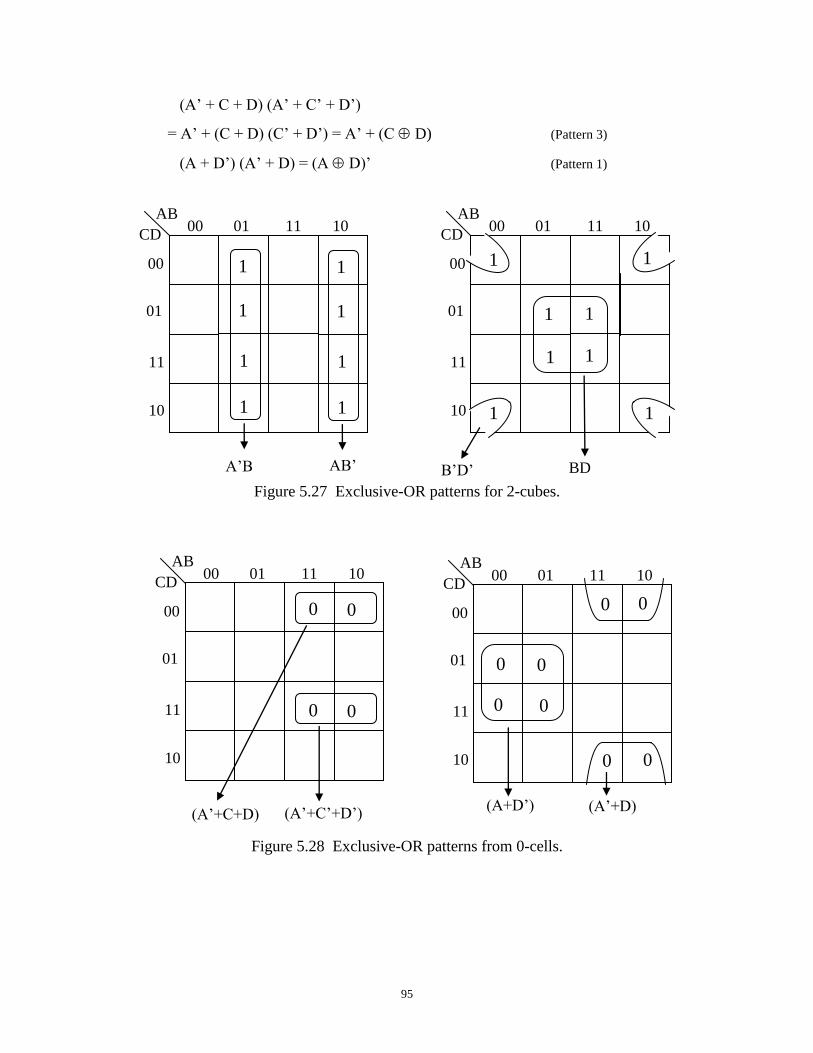
Two XOR patterns for 2-cubes are given in Figure 5.27.
A’B + AB’ = (A B) (Pattern 2)
B’D’ + BD = (B D)’ (Pattern 1)
Figure 5.28 shows some XOR patterns from 0-cells. The derivations are shown
below.
0 AB AB
CD 00
AB 01 11 10
0
1 5
4
13
12 8
9
00
01
11
10
3
2 6
7
14
15 11
10
1
1 1
1
00 AB
01 11 10
00
01
11
10 1
CD
A’B’C’
1
1
1
1
1
ABC’ AB’C
95
(A’ + C + D) (A’ + C’ + D’)
= A’ + (C + D) (C’ + D’) = A’ + (C D) (Pattern 3)
(A + D’) (A’ + D) = (A D)’ (Pattern 1)
Figure 5.27 Exclusive-OR patterns for 2-cubes.
Figure 5.28 Exclusive-OR patterns from 0-cells.
00 AB
01 11 10 CD
00
01
11
10
00 AB
01 11 10 CD
00
01
11
10
0
0
0 0
0 0
0
0
0 0
0 0
(A’+C+D) (A’+C’+D’) (A’+D) (A+D’)
00 AB
01 11 10 CD
00
01
11
10
BD
1 1
B’D’
1 1
1
1
1
1
1
00 AB
01 11 CD
00
01
11
10
A’B
1
1
1
1
1
AB’
1
1
1
1
1
10
96
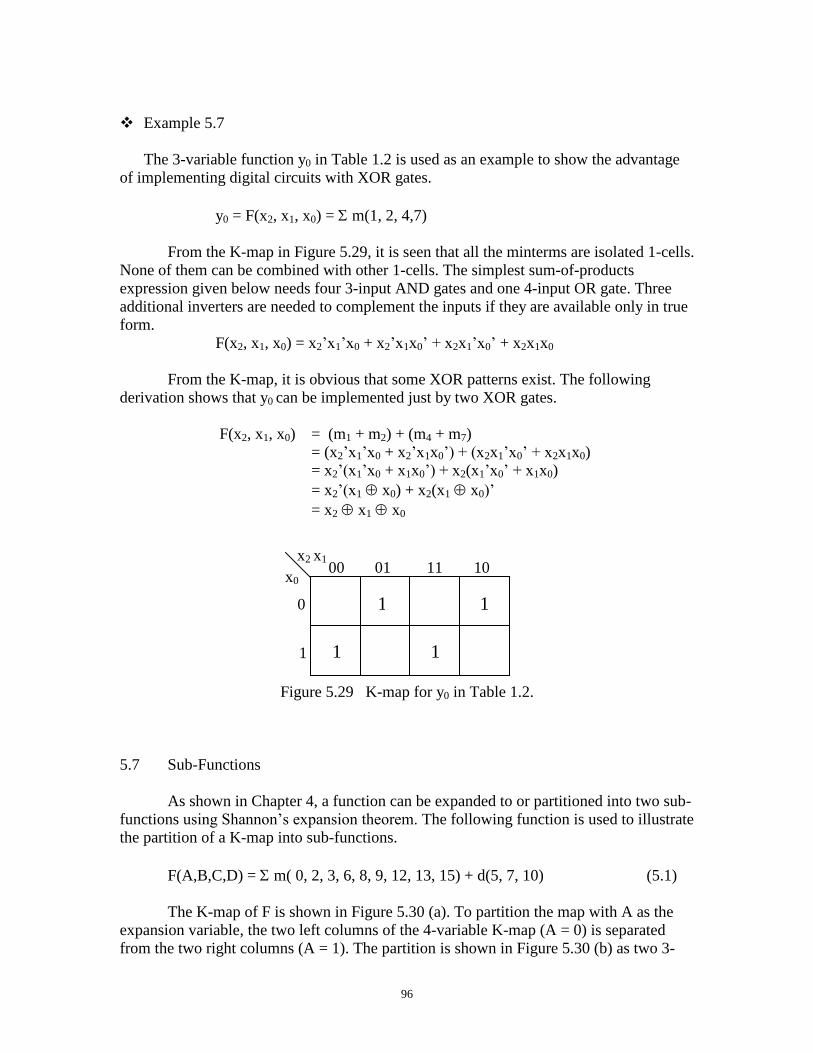
Example 5.7
The 3-variable function y0 in Table 1.2 is used as an example to show the advantage
of implementing digital circuits with XOR gates.
y0 = F(x2, x1, x0) = m(1, 2, 4,7)
From the K-map in Figure 5.29, it is seen that all the minterms are isolated 1-cells.
None of them can be combined with other 1-cells. The simplest sum-of-products
expression given below needs four 3-input AND gates and one 4-input OR gate. Three
additional inverters are needed to complement the inputs if they are available only in true
form.
F(x2, x1, x0) = x2’x1’x0 + x2’x1x0’ + x2x1’x0’ + x2x1x0
From the K-map, it is obvious that some XOR patterns exist. The following
derivation shows that y0 can be implemented just by two XOR gates.
F(x2, x1, x0) = (m1 + m2) + (m4 + m7)
= (x2’x1’x0 + x2’x1x0’) + (x2x1’x0’ + x2x1x0)
= x2’(x1’x0 + x1x0’) + x2(x1’x0’ + x1x0)
= x2’(x1 x0) + x2(x1 x0)’
= x2 x1 x0
Figure 5.29 K-map for y0 in Table 1.2.
5.7 Sub-Functions
As shown in Chapter 4, a function can be expanded to or partitioned into two sub-
functions using Shannon’s expansion theorem. The following function is used to illustrate
the partition of a K-map into sub-functions.
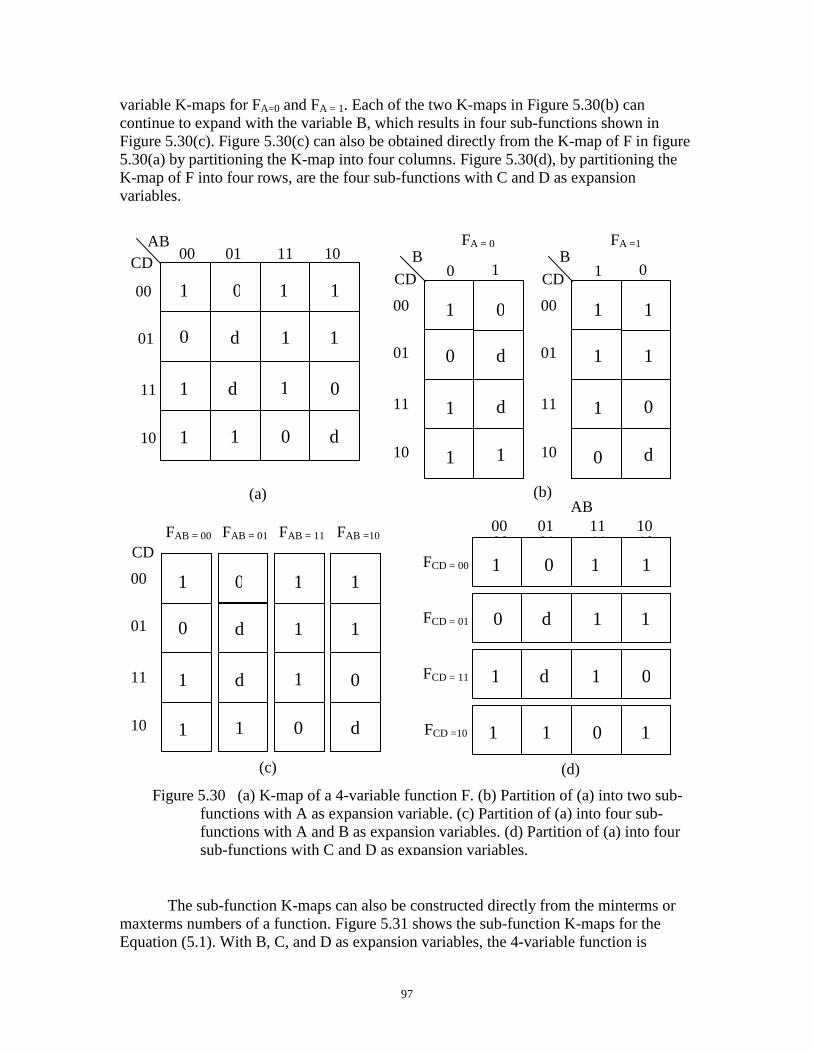
F(A,B,C,D) = m( 0, 2, 3, 6, 8, 9, 12, 13, 15) + d(5, 7, 10) (5.1)
The K-map of F is shown in Figure 5.30 (a). To partition the map with A as the
expansion variable, the two left columns of the 4-variable K-map (A = 0) is separated
from the two right columns (A = 1). The partition is shown in Figure 5.30 (b) as two 3-
00 x2 x1
01 11 10
1
0
x0
1 1
1 1
97
variable K-maps for FA=0 and FA = 1. Each of the two K-maps in Figure 5.30(b) can
continue to expand with the variable B, which results in four sub-functions shown in
Figure 5.30(c). Figure 5.30(c) can also be obtained directly from the K-map of F in figure
5.30(a) by partitioning the K-map into four columns. Figure 5.30(d), by partitioning the
K-map of F into four rows, are the four sub-functions with C and D as expansion
variables.
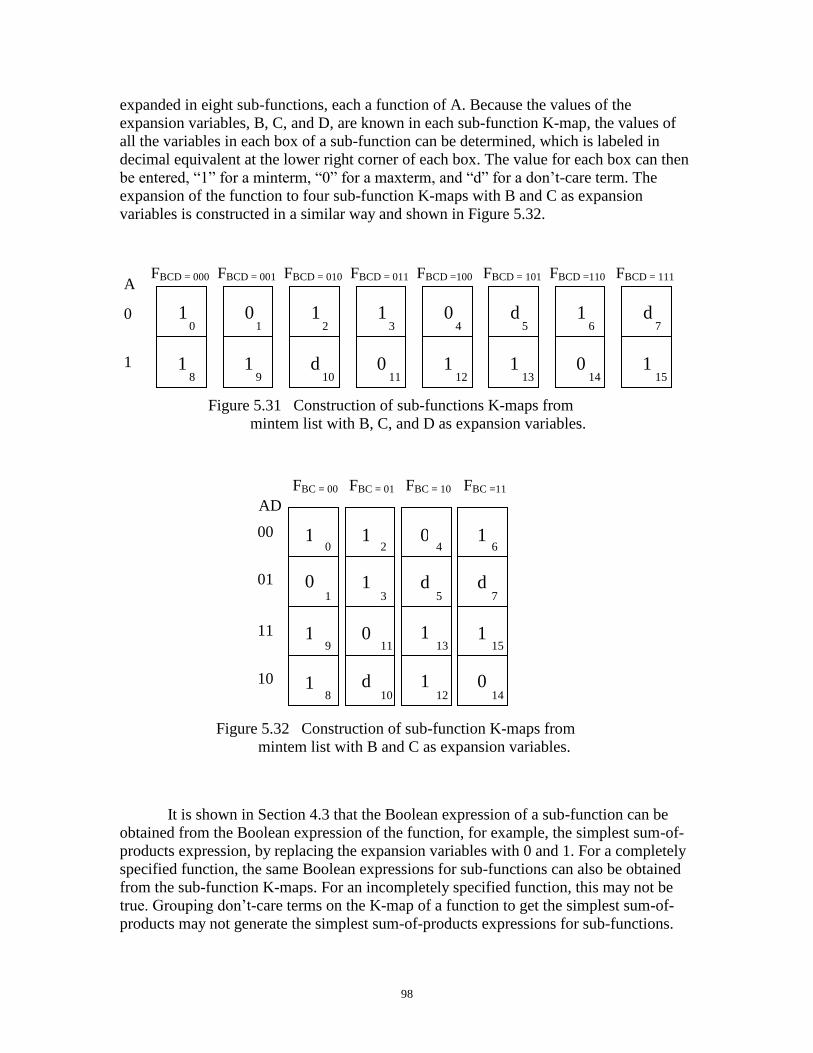
The sub-function K-maps can also be constructed directly from the minterms or
maxterms numbers of a function. Figure 5.31 shows the sub-function K-maps for the
Equation (5.1). With B, C, and D as expansion variables, the 4-variable function is
00
01
11
10
1
0
1
1
d
010
d
1
1
1
1
0
1
1
0
d
CD
FAB = 00 FAB = 01 FAB = 11 FAB =10
00 01 11 10 AB
1 1 1 010 0 d 1 1
00
01
11
10
1 1 0 d
1 1 0 d
CD
00
01
11
10
1
0
1
1
d
010
d
1
CD
FA = 0
B 0 1
00
01
11
10
1
1
1
0
1
10
0
d
CD
FA =1
B 1 0
AB
00 01 11 10
1 1 1 010
0 d 1 1
1 1 0 d
1 1 0 1
FCD = 00
FCD = 01
FCD = 11
FCD =10
00 01 11 10
Figure 5.30 (a) K-map of a 4-variable function F. (b) Partition of (a) into two sub-
functions with A as expansion variable. (c) Partition of (a) into four sub-
functions with A and B as expansion variables. (d) Partition of (a) into four
sub-functions with C and D as expansion variables.
(a) (b)
(d) (c)
98
expanded in eight sub-functions, each a function of A. Because the values of the
expansion variables, B, C, and D, are known in each sub-function K-map, the values of
all the variables in each box of a sub-function can be determined, which is labeled in
decimal equivalent at the lower right corner of each box. The value for each box can then
be entered, “1” for a minterm, “0” for a maxterm, and “d” for a don’t-care term. The
expansion of the function to four sub-function K-maps with B and C as expansion
variables is constructed in a similar way and shown in Figure 5.32.
It is shown in Section 4.3 that the Boolean expression of a sub-function can be
obtained from the Boolean expression of the function, for example, the simplest sum-of-
products expression, by replacing the expansion variables with 0 and 1. For a completely
specified function, the same Boolean expressions for sub-functions can also be obtained
from the sub-function K-maps. For an incompletely specified function, this may not be
true. Grouping don’t-care terms on the K-map of a function to get the simplest sum-of-
products may not generate the simplest sum-of-products expressions for sub-functions.
A
0
1
FBCD = 001
0
1
FBCD = 000
1
1
FBCD = 010
1
d
FBCD = 011
1
0
FBCD =100
0
1
FBCD = 101
d
1
FBCD =110
1
0
FBCD = 111
d
1
0 3 1 2 4 5 6 7
8 11 9 10 12 13 14 15
Figure 5.31 Construction of sub-functions K-maps from
mintem list with B, C, and D as expansion variables.
00
01
11
10
1
0
1
1
1
110
0
d
0
d
1
1
1
d
1
0
AD
FBC = 00 FBC = 01 FBC = 10 FBC =11
6
14
7
15
4
12
5
13
0
8
1
9
2
10
3
11
Figure 5.32 Construction of sub-function K-maps from
mintem list with B and C as expansion variables.
99
The expansion of Equation (5.1) with A and B is shown below. The simplest sum-of –
products expression obtained from the K-map in Figure 5.30(a) is
F(A,B,C,D) = A’C + BD + AC’ + B’D’ (5.2)
The sub-functions obtained from Equation (5.2) are
FAB = 00 = F(A = 0, B = 0, C, D) = C + D’ (5.3a)
FAB = 01 = F(A = 0, B = 1, C, D) = C + D (5.3b)
FAB = 10 = F(A = 1, B = 0, C, D) = C’ +D’ (5.3c)
FAB = 11 = F(A = 1, B = 1, C, D) = C’ + D (5.3d)
The simplest expressions for the sub-functions obtained from the sub-function K-
maps in Figure 5.30(c) are
FAB = 00 = C + D’ (5.4a)
FAB = 01 = C (5.4b)
FAB = 10 = C’ (5.4c)
FAB = 11 = C’ + D (5.4d)
By comparing Equations (5.3b) and (5.3c) with Equations (5.4b) and (5.4c), it is seen that
the two latter expressions are simpler than the two former ones respectively. To obtain the
simplest sum-of-products expression for F, don’t-care terms 5 and 10 are given a value of
1. These two don’t-care terms have to assume a value of 0 to get the simplest expressions
for FAB = 01 and FAB = 10.
PROBLEMS
1. Plot each of the following functions on a Karnaugh map and determine the minterm
list.
(a) f(A,B,C) = A’B’ + B’C + AC’
(b) f(A,B,C,D) = A’B + ABC’ + CD’ + A’B’CD
(c) f(A,B,C,D) = B’ + A’(C’ + BD)
(d) f(A,B,C,D,E) = AE’ + BCE’ + A’B’D + B’C’E
2. Plot each of the following functions on a Karnaugh map and determine the maxterm
list.
100
(a) f(A,B,C,D) = (A’ + B + C’)(C + D)(B’ + D’)
(b) f(A,B,C,D,E) = (A + D’)(A’ + B + E’)(B’ + C + D’ + E’)(B’ + D)
3. Find all the distinguished 1-cells and prime implicants for each of the following
functions. Underline the essential prime implicants.
(a) f(A, B, C, D) = m(3, 5, 7, 8, 12, 13, 14, 15)
(b) f(A, B, C, D) = m(1, 3, 4, 5, 6, 7, 9, 11, 13)
(c) f(A, B, C, D) = m(0, 1, 2, 5, 7, 8, 9, 10, 15)
(d) f(A, B, C, D) = m(2, 3, 5, 6, 7, 8, 9, 10, 11, 14)
4. Find all the distinguished 0-cells and prime implicates for each of the functions in
Problem 3. Underline the essential prime implicates.
5. Minimize each of the functions in Problem 3 to a sum-of-products expression by K-
map.
6. Minimize each of the functions in Problem 3 to a product-of-sums expression by K-
map.
7. Find all the distinguished 1-cells and prime implicants for each of the following
functions. Underline the essential prime implicants.
(a) f(A,B,C,D,E) = m(1, 3, 5, 6, 7, 8, 9, 14, 17, 19, 21, 23, 24, 25, 26, 27)
(b) f(A,B,C,D,E) = m(1, 2, 4, 5,7 , 9, 10, 13, 15, 17, 18, 22, 23, 25, 26, 27, 30, 31)
8. Minimize each of the functions in Problem 7 to a sum-of-products expression by K-
map.
9. Minimize each of the functions in Problem 7 to a product-of-sums expression by K-
map.
10. Find the minimal sum-of-products expression for each of the following functions.
f1(A,B,C,D) = m (3, 6, 7, 8, 9, 13, 15) + d(0, 2, 4)
f2(A,B,C,D) = m (3, 6, 7, 8, 9, 13, 15)
f3(A,B,C,D) = m (0, 2, 3, 4, 6, 7, 8, 9, 13, 15)
Note the don’t-care term list for f1 is not included in f2 but included in f3 as
minterms. Compare the results of f1, f2, and f3.
11. Minimize each of the following functions to a sum-of-products expression by
Karnaugh map.
(a) f(A,B,C,D) = m (2, 5, 7, 10, 14) + d(8, 9, 13, 15)
(b) f(A,B,C,D) = m (2, 3, 4, 5, 6, 7, 13) + d(1, 9, 12, 15)
101
(c) f(A,B,C,D,E) = m (1, 4, 5, 6, 7, 13, 20, 21, 25, 26, 29) + d(9, 22, 23, 30, 31)
12. Plot each of the following functions on a Karnaugh map and determine the minterm
list.
(a) f(A,B,C,D) = A’D(B C’) + CD’ + A’B’CD
(b) f(A,B,C,D) = D (B’ C’ ) + A’(C’ + BD)
13. Plot the Karnaugh maps for each of the following four pairs of functions, f1 and f2.
Compare the patterns of the Karnaugh maps for each pair. Note that f2 is the first
product in the expression for f1.
(a) f1(A,B,C,D) = AD BCD, f2(A,B,C,D) = AD
(b) f1(A,B,C,D) = A’C A’BD, f2(A,B,C,D) = A’C
(c) f1(A,B,C,D) = A BCD, f2(A,B,C,D) = A
(d) f1(A,B,C,D) = C’ BD, f2(A,B,C,D) = C’
14. For each of the following expressions, find the simplest sum-of-products expression
using K-map and then convert the sum-of-products expression to the exclusive-OR
of two products.
(a) f(A,B,C,D) = m (5, 6, 7, 12)
(b) f(A,B,C,D) = m (3, 4, 5, 6)
(c) f(A,B,C,D) = m (7, 8, 9, 10, 11, 12, 13, 14)
(d) f(A,B,C,D) = m (5, 7, 8, 9, 10, 11, 12, 14)
15. Find all the sub-function K-maps for each of the following functions:
(a) f(A,B,C,D) = m(1, 2, 3, 5, 6, 8, 9, 12, 14) Expansion variables: B, D
(b) f(A,B,C,D,E) = m(1, 3, 5, 6, 7, 8, 9, 14, 17, 19, 21, 23, 24, 25, 26, 27)
Expansion variables: A, C
(c) f(A,B,C,D,E) = m(1, 2, 4, 5,7 , 9, 10, 13, 15, 17, 18, 22, 23, 25, 26, 27, 30, 31)
Expansion variables: B, D, E
16. Find the simplest expression for each of the sub-functions of f with B and C as
expansion variables using two different approaches.
(a) Use the simplest sum-of-products expression for f.
(b) Use the sub-function K-maps.
f(A,B,C,D) = m(2, 3, 8, 9, 12, 13, 14) + d(0, 7, 10, 11)
17. Repeat Problem 16 for the following function with A, D, and E as expansion
variables.

102
f(A,B,C,D,E) = m (1, 3, 5, 6, 7, 12, 17, 19, 21, 22, 23, 25, 28, 29)
+ d(13, 16, 26, 27, 31)