Karnataka Geographic Information System Portal (K-GIS PORTAL)kgis.ksrsac.in/kgis/App/pdf/K-GIS...
33
Karnataka Geographic Information System Portal (K-GIS PORTAL) User Manual: Version-1.3 KARNATAKA STATE REMOTE SENSING APPLICATIONS CENTRE Dept. of Information Technology, Bio-Technology and Science & Technology “Doora Samvedi Bhavana”, Major Sandeep Unnikrishnan Road, Doddabettahalli, Bangalore- 560097. Phone No.: +91 80 29720557/58, Fax: +91 80 29720556 July, 2018
Transcript of Karnataka Geographic Information System Portal (K-GIS PORTAL)kgis.ksrsac.in/kgis/App/pdf/K-GIS...
Karnataka Geographic Information System Portal
(K-GIS PORTAL)
User Manual: Version-1.3
KARNATAKA STATE REMOTE SENSING APPLICATIONS CENTRE
Dept. of Information Technology, Bio-Technology and Science & Technology
“Doora Samvedi Bhavana”, Major Sandeep Unnikrishnan Road, Doddabettahalli,
Bangalore- 560097. Phone No.: +91 80 29720557/58, Fax: +91 80 29720556
July, 2018
USER'S MANUAL
Table of Contents
1 VIEWER EXPLORE KARNATAKA ............................................................................................... 1 Fig1. K-GIS URL .......................................................................................................................................... 1 Fig2. Viewer tab ............................................................................................................................................ 1 Fig3. Base Map page ..................................................................................................................................... 1
1.2 Specific Features in Viewer Explore Karnataka ........................................................................ 2
1.2.1 Table of content (TOC)/Side bar menu .................................................................................... 2
1.2.2 Standard Toolbox ..................................................................................................................... 2
1.3 Common Features in General User ....................................................................................... 3
2 NAVIGATION TOOLS ..................................................................................................................... 3 Fig4. Navigation Tools ................................................................................................................................. 3
2.1 Search .......................................................................................................................................... 4 Fig5.Search with Marker display on map ....................................................................................................... 4
2.2 Zoom Full Extent ......................................................................................................................... 4 Fig6.Zoom Full Extent .................................................................................................................................. 4
2.3 Identify ......................................................................................................................................... 5 Fig7.Info template ......................................................................................................................................... 5
2.4 Go to Location by Latitude/Longitude ....................................................................................... 5 Fig8.Info template ......................................................................................................................................... 5
2.5 Measurement Tool ....................................................................................................................... 6
2.5.1 Area ........................................................................................................................................... 6 Fig9.Area measure ........................................................................................................................................ 6
2.5.2 Distance ..................................................................................................................................... 6 Fig10.Distance Covered ................................................................................................................................ 7
2.5.3 Location .................................................................................................................................... 7 Fig11.Location point & its latitude & longitude ............................................................................................. 7
2.5.4 Clear Graphics .......................................................................................................................... 7 Fig12.Clear graphics on map ......................................................................................................................... 8
2.5.5 Base map Gallery ...................................................................................................................... 8 Fig13.Base Map Gallery ................................................................................................................................ 8 2.5.6 Pan ....................................................................................................................................................... 9 Fig14.Pan ...................................................................................................................................................... 9
2.5.7 Print .......................................................................................................................................... 9 Fig15.Print Button ......................................................................................................................................... 9 Fig16.Print Map .......................................................................................................................................... 10
2.5.8 Home Button ............................................................................................................................... 10 Fig17. Home Button .................................................................................................................................... 10
3 AREA OF INTREST ........................................................................................................................ 10 Fig18. AOI Tool Bar ................................................................................................................................... 10 Fig19. AOI Category Dropdowns ................................................................................................................ 11 Fig20. District Selected Dropdown .............................................................................................................. 12
4 K-GIS VISULIZATION ................................................................................................................... 12
4.1 Map Data ................................................................................................................................... 12
4.1.1 Layers...................................................................................................................................... 12 Fig21. Side Menu Bar of TOC and administrative layers .............................................................................. 12 Fig22. Plus of Map Karnataka-Layers .......................................................................................................... 13 Fig23. Different types of Education ............................................................................................................. 14 Fig24. Symbology of layers display on map ................................................................................................ 14
4.1.2 Active Layers .......................................................................................................................... 15 Fig25. Symbology of active layers display on map ...................................................................................... 15
4.2 Search Data ................................................................................................................................ 15
4.2.1 Data ......................................................................................................................................... 15 Fig26. Data tab and its dropdown ................................................................................................................ 16 Fig27. Education Query & submit button ..................................................................................................... 17 Fig28. Result of the selected Query with Markers and table.......................................................................... 18
4.2.2 Satellite Images ....................................................................................................................... 18 Fig29. Satellite information in grids ............................................................................................................ 18
4.3 Near By ...................................................................................................................................... 18 Fig30.Location tab Dropdowns .................................................................................................................... 19
4.3.1 On Click Buffer ...................................................................................................................... 19 Fig31.Onclick Buffer................................................................................................................................... 19
4.3.2 AOI Buffer .............................................................................................................................. 20 Fig32. Result of the selected layers with buffer and table ............................................................................. 20
4.3.3 User AOI Buffer ..................................................................................................................... 20 Fig33. User AOI Buffer ............................................................................................................................... 21
4.4 Nearest Facilities........................................................................................................................ 21 Fig34. Nearest Facilities Result of the selected dropdown with Markers and Table ....................................... 22
4.5 Thematic Views ......................................................................................................................... 22
4.5.1 Demography............................................................................................................................ 22 Fig35. Selected demography is displaying on map ....................................................................................... 22
4.5.2 Thematic Maps ....................................................................................................................... 22 Fig36. Themes with legends ....................................................................................................................... 23
4.5.3 Heat Map Views ...................................................................................................................... 23 Fig37. Heat map Exploration with Point Density display on map ................................................................. 24
4.5.4 Daily Rainfall from DMC ....................................................................................................... 24 Fig38. Daily Rainfall from display on map.................................................................................................. 24 Fig39. View Live Data on Map .................................................................................................................... 25
4.5.5 BDA Master Plan .................................................................................................................... 25 Fig40. BDA Master Plan on Map ................................................................................................................. 25
4.5.6 Bangalore Satellite Image ....................................................................................................... 26 Fig41. Bangalore Satellite Image on Map .................................................................................................... 26
4.6 Load Your Data ......................................................................................................................... 26 Fig42. Load Your Data ............................................................................................................................... 27
4.6.1 Rest Services ........................................................................................................................... 27 Fig43. Rest Services ................................................................................................................................... 27 Fig44. District layer on map ....................................................................................................................... 27
4.6.2 KML Services ......................................................................................................................... 28 Fig45. KML Services ................................................................................................................................. 28
4.6.3 Add Shape File ........................................................................................................................ 28 Fig42. Add Shape File Zip Format & CSV file ............................................................................................ 29 Fig46. Marker display on map .................................................................................................................... 29
5 APPLICATION ................................................................................................................................ 29 Fig47. Application Page .............................................................................................................................. 29
K-GIS User Manual Page 1
Karnataka State Remote Sensing Applications Center
1 VIEWER EXPLORE KARNATAKA
Viewer user is able to click to K-GIS portal by entering the URL
http://stg1.ksrsac.in/kgisportal address in browser. The KGIS portal application screen
will be displayed.
Fig1. K-GIS URL
Viewer Explore Karnataka is a public, common people can view the portal by clicking
on Viewer tab
Fig2. Viewer tab
Fig3. Base Map page
K-GIS User Manual Page 2
Karnataka State Remote Sensing Applications Center
1.2 Specific Features in Viewer Explore Karnataka
1.2.1 Table of content (TOC)/Side bar menu
User can switch on\off the layers. Some of the query part is also included in TOC.
User can find various available K-GIS datasets (maps) Categorized according to K-GIS
standards through Map Data.
Information regarding Satellite data availability, its resolution and timestamp
information can be queried (Selection by free hand drawing) in Search Data Section.
Ready –to –use theme based maps and Display of heat maps (Point density map) for
District Hospitals, Taluk Hospitals Primary Health Centers & Community Health Centers
Engineering Colleges is available in Heat map Exploration are available in Thematic
Views.
Load your data allows user to add the REST service and KML services URL and view
in the portal. Add Shape file will allow the user to upload shape file in zip format.
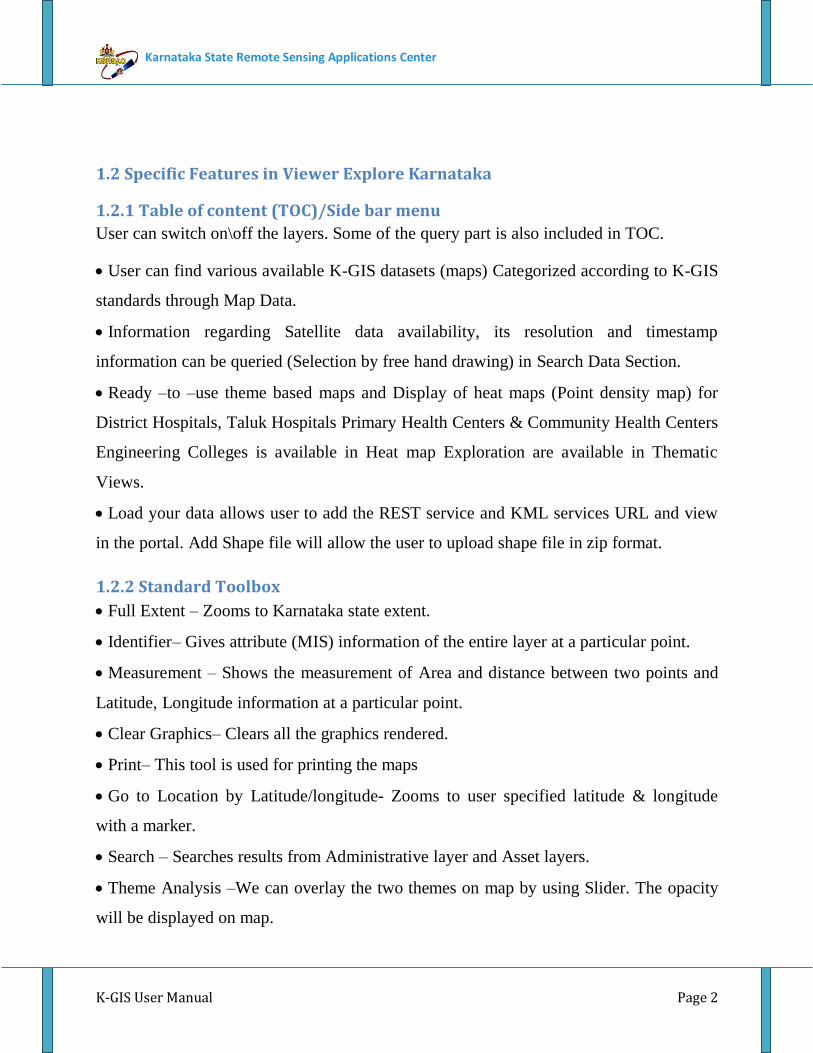
1.2.2 Standard Toolbox
Full Extent – Zooms to Karnataka state extent.
Identifier– Gives attribute (MIS) information of the entire layer at a particular point.
Measurement – Shows the measurement of Area and distance between two points and
Latitude, Longitude information at a particular point.
Clear Graphics– Clears all the graphics rendered.
Print– This tool is used for printing the maps
Go to Location by Latitude/longitude- Zooms to user specified latitude & longitude
with a marker.
Search – Searches results from Administrative layer and Asset layers.
Theme Analysis –We can overlay the two themes on map by using Slider. The opacity
will be displayed on map.

K-GIS User Manual Page 3
Karnataka State Remote Sensing Applications Center
1.3 Common Features in General User
Help - User guide to use the portal is available.
Area of Interest – This tool restricts the view to only user selected/ interested area,
Selection option happens through boundaries. All the query and other operations happen
on user preferred area.
2 NAVIGATION TOOLS
The Map Display Tools contains the control through which user can access the
information easily and productively. The portal contains the Search, Zoom to Full Extent,
Identifier, Measurement tool, Clear Graphics, Base map Gallery, and Print.
Fig4. Navigation Tools

K-GIS User Manual Page 4
Karnataka State Remote Sensing Applications Center
2.1 Search
User can Search results from Administrative layer and Asset layers on the Map.
Fig5.Search with Marker display on map
2.2 Zoom Full Extent
User can control for zooming to the entire extent of Karnataka state on the Map.
User has to Select the tool and click on the map window.
Fig6.Zoom Full Extent
K-GIS User Manual Page 5
Karnataka State Remote Sensing Applications Center
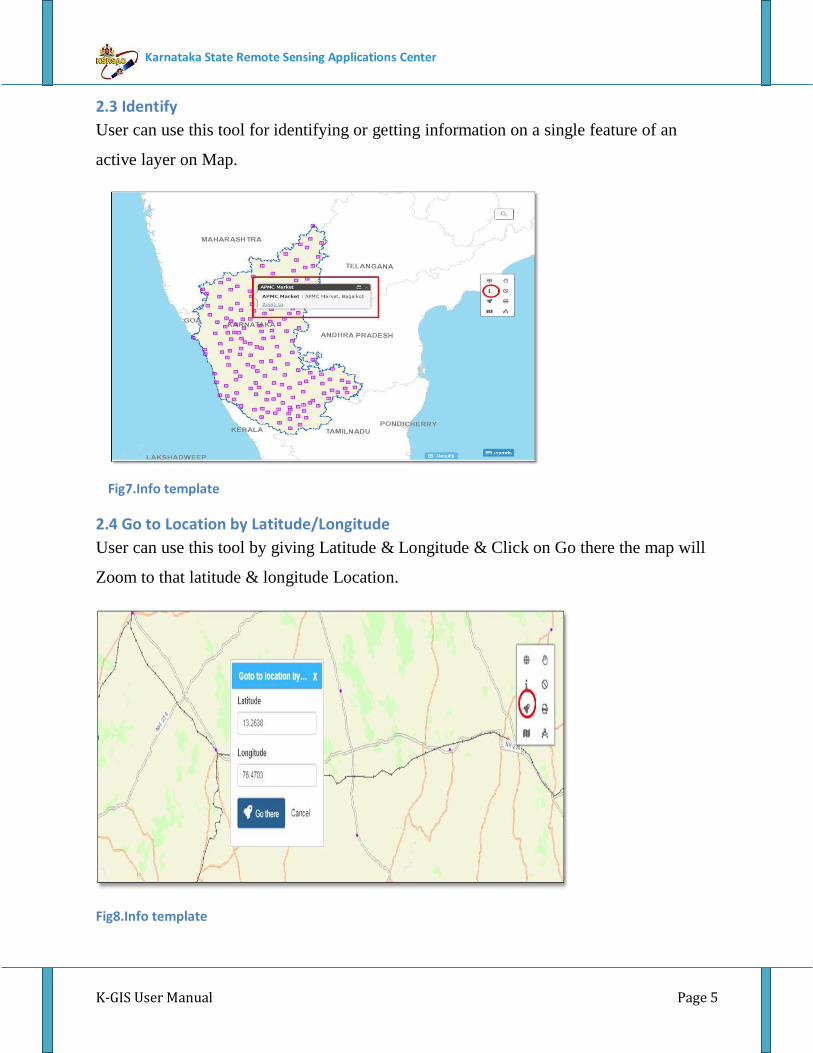
2.3 Identify
User can use this tool for identifying or getting information on a single feature of an
active layer on Map.
Fig7.Info template
2.4 Go to Location by Latitude/Longitude
User can use this tool by giving Latitude & Longitude & Click on Go there the map will
Zoom to that latitude & longitude Location.
Fig8.Info template
K-GIS User Manual Page 6
Karnataka State Remote Sensing Applications Center
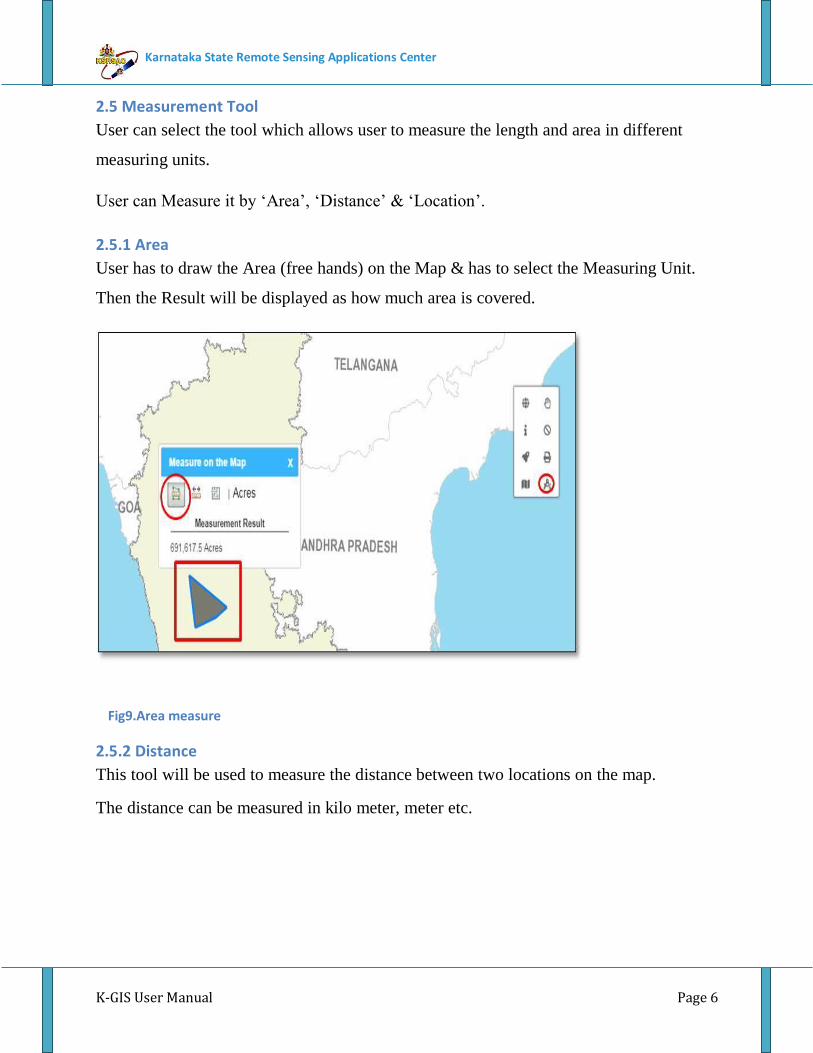
2.5 Measurement Tool
User can select the tool which allows user to measure the length and area in different
measuring units.
User can Measure it by ‘Area’, ‘Distance’ & ‘Location’.
2.5.1 Area
User has to draw the Area (free hands) on the Map & has to select the Measuring Unit.
Then the Result will be displayed as how much area is covered.
Fig9.Area measure
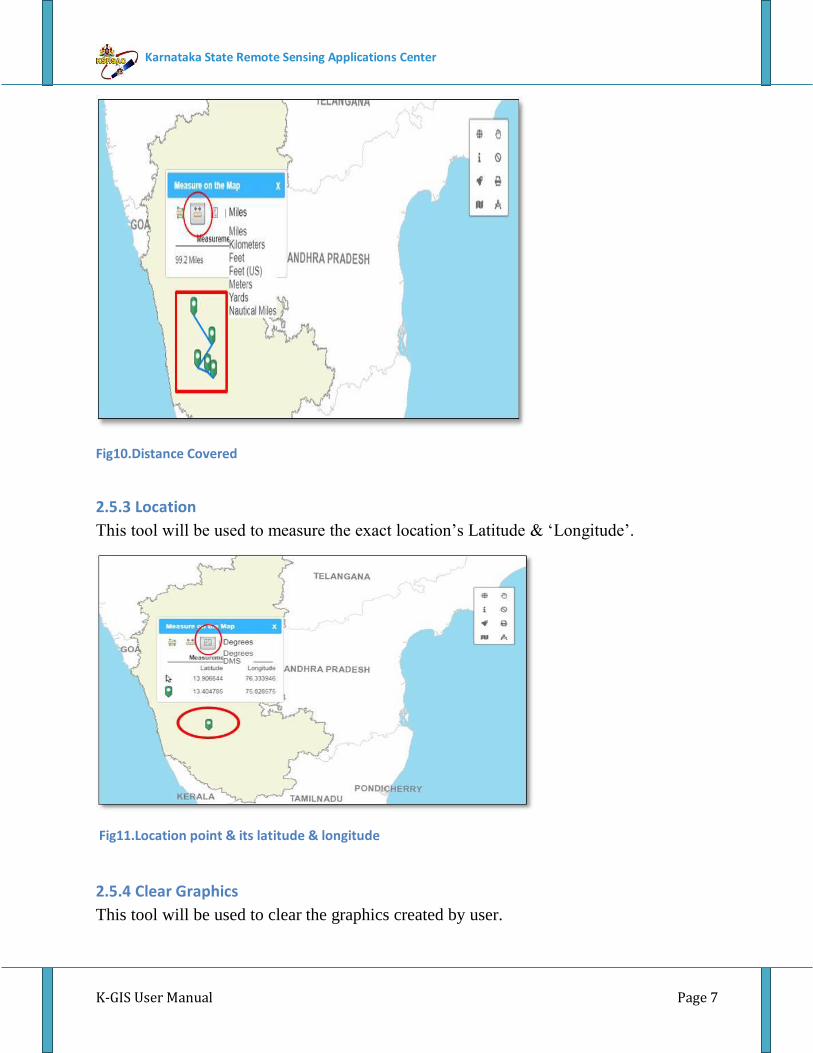
2.5.2 Distance
This tool will be used to measure the distance between two locations on the map.
The distance can be measured in kilo meter, meter etc.
K-GIS User Manual Page 7
Karnataka State Remote Sensing Applications Center
Fig10.Distance Covered
2.5.3 Location
This tool will be used to measure the exact location’s Latitude & ‘Longitude’.
Fig11.Location point & its latitude & longitude
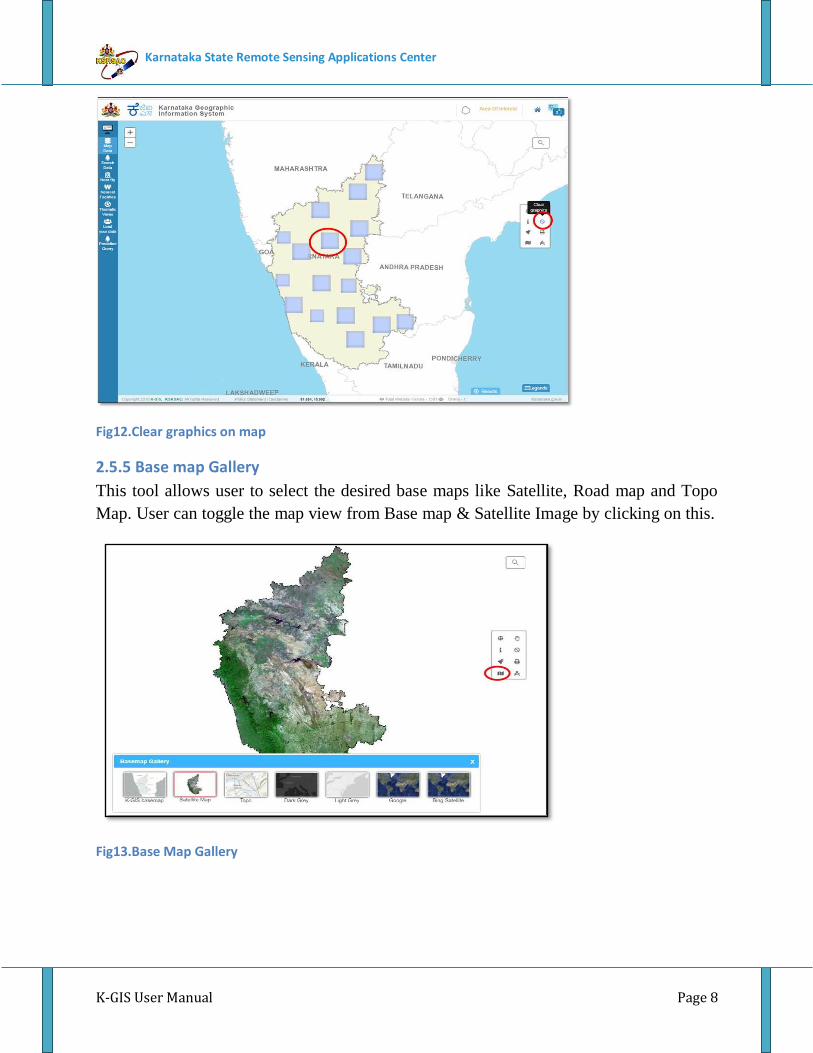
2.5.4 Clear Graphics
This tool will be used to clear the graphics created by user.
K-GIS User Manual Page 8
Karnataka State Remote Sensing Applications Center
Fig12.Clear graphics on map
2.5.5 Base map Gallery
This tool allows user to select the desired base maps like Satellite, Road map and Topo
Map. User can toggle the map view from Base map & Satellite Image by clicking on this.
Fig13.Base Map Gallery
K-GIS User Manual Page 9
Karnataka State Remote Sensing Applications Center
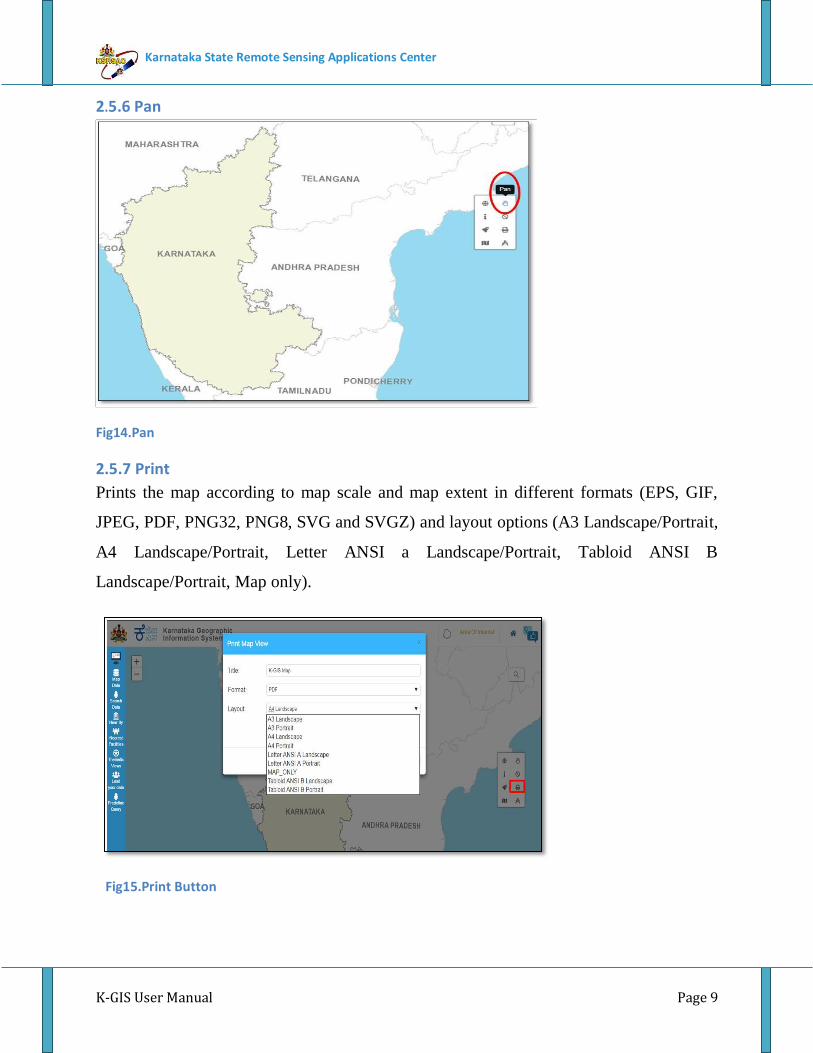
2.5.6 Pan
Fig14.Pan
2.5.7 Print
Prints the map according to map scale and map extent in different formats (EPS, GIF,
JPEG, PDF, PNG32, PNG8, SVG and SVGZ) and layout options (A3 Landscape/Portrait,
A4 Landscape/Portrait, Letter ANSI a Landscape/Portrait, Tabloid ANSI B
Landscape/Portrait, Map only).
Fig15.Print Button
K-GIS User Manual Page 10
Karnataka State Remote Sensing Applications Center
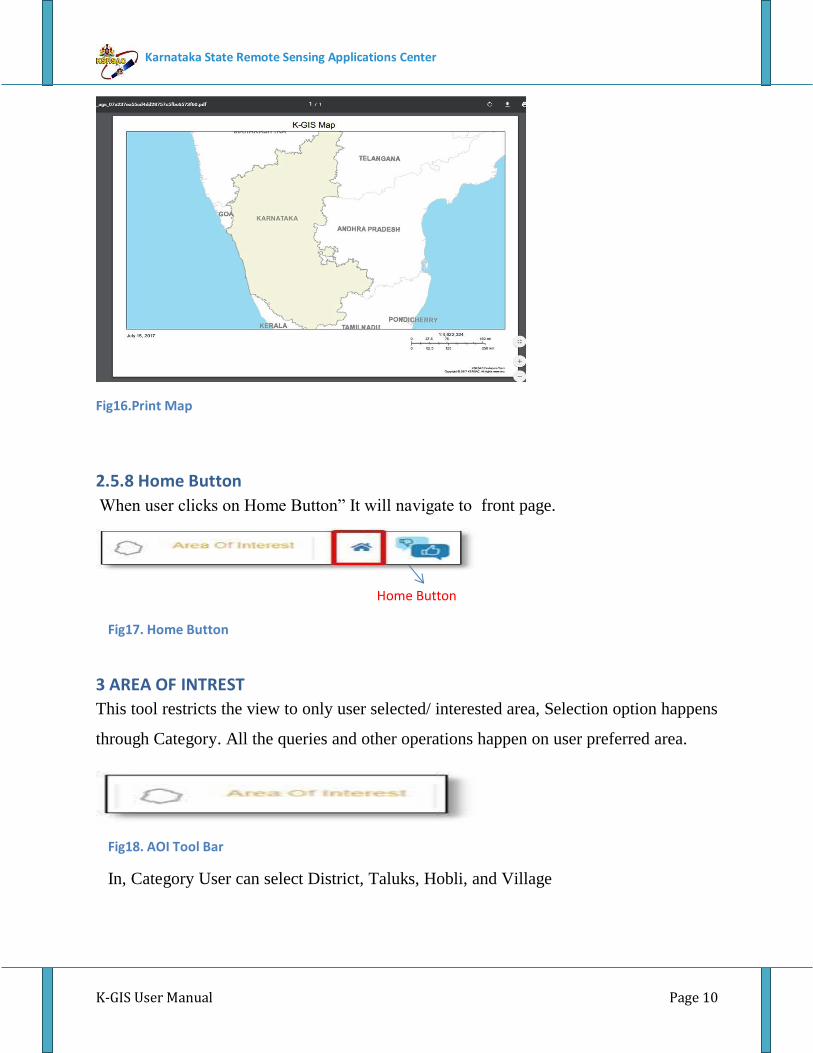
Fig16.Print Map
2.5.8 Home Button
When user clicks on Home Button” It will navigate to front page.
Home Button
Fig17. Home Button
3 AREA OF INTREST
This tool restricts the view to only user selected/ interested area, Selection option happens
through Category. All the queries and other operations happen on user preferred area.
Fig18. AOI Tool Bar
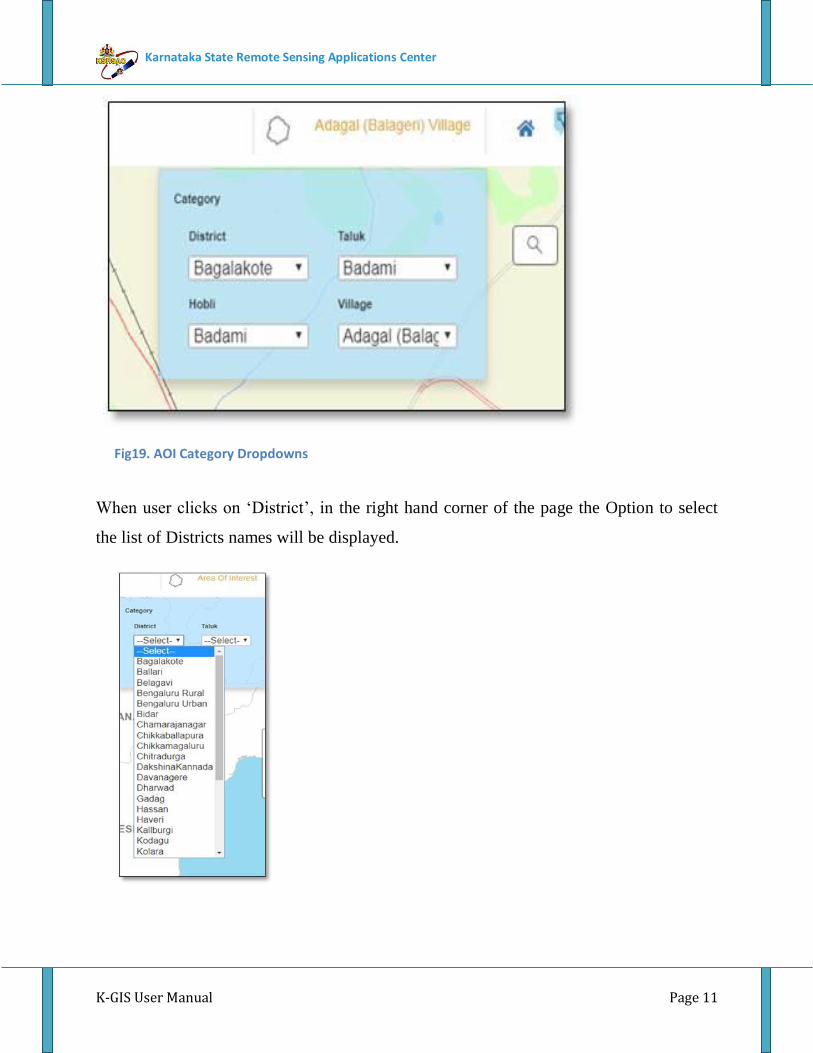
In, Category User can select District, Taluks, Hobli, and Village
K-GIS User Manual Page 11
Karnataka State Remote Sensing Applications Center
Fig19. AOI Category Dropdowns
When user clicks on ‘District’, in the right hand corner of the page the Option to select
the list of Districts names will be displayed.
K-GIS User Manual Page 12
Karnataka State Remote Sensing Applications Center
Fig20. District Selected Dropdown
4 K-GIS VISULIZATION
4.1 Map Data
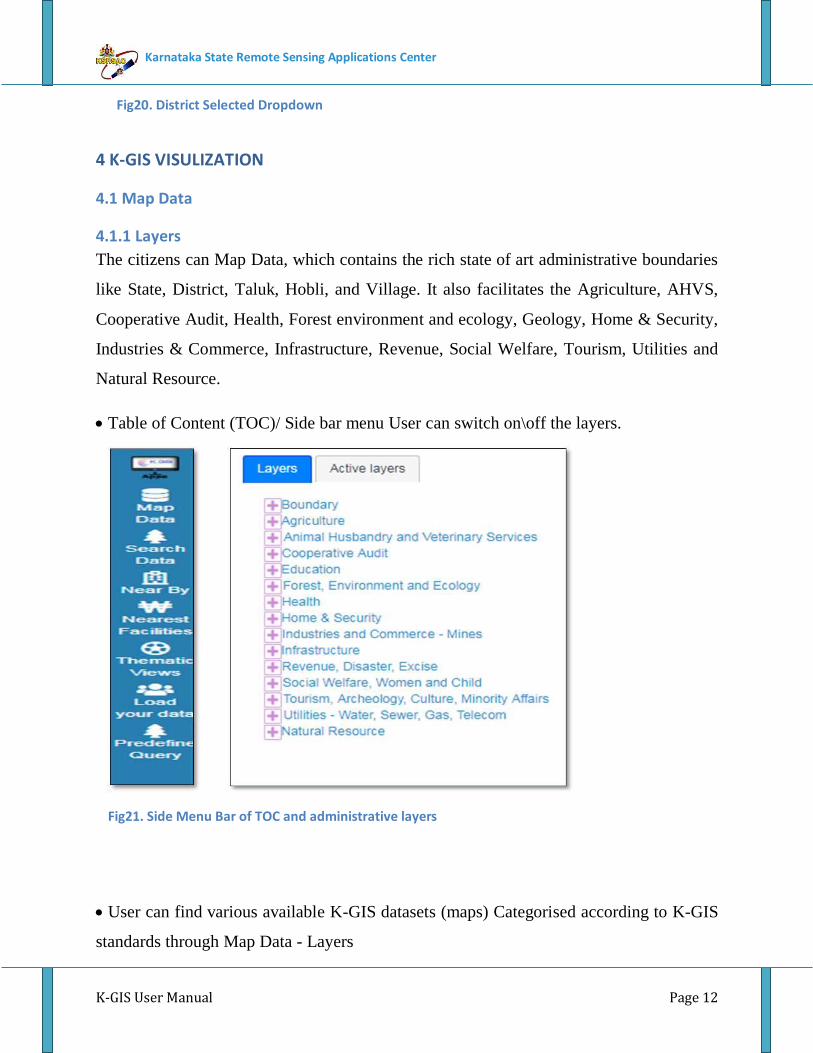
4.1.1 Layers
The citizens can Map Data, which contains the rich state of art administrative boundaries
like State, District, Taluk, Hobli, and Village. It also facilitates the Agriculture, AHVS,
Cooperative Audit, Health, Forest environment and ecology, Geology, Home & Security,
Industries & Commerce, Infrastructure, Revenue, Social Welfare, Tourism, Utilities and
Natural Resource.
Table of Content (TOC)/ Side bar menu User can switch on\off the layers.
Fig21. Side Menu Bar of TOC and administrative layers
User can find various available K-GIS datasets (maps) Categorised according to K-GIS
standards through Map Data - Layers
K-GIS User Manual Page 13
Karnataka State Remote Sensing Applications Center
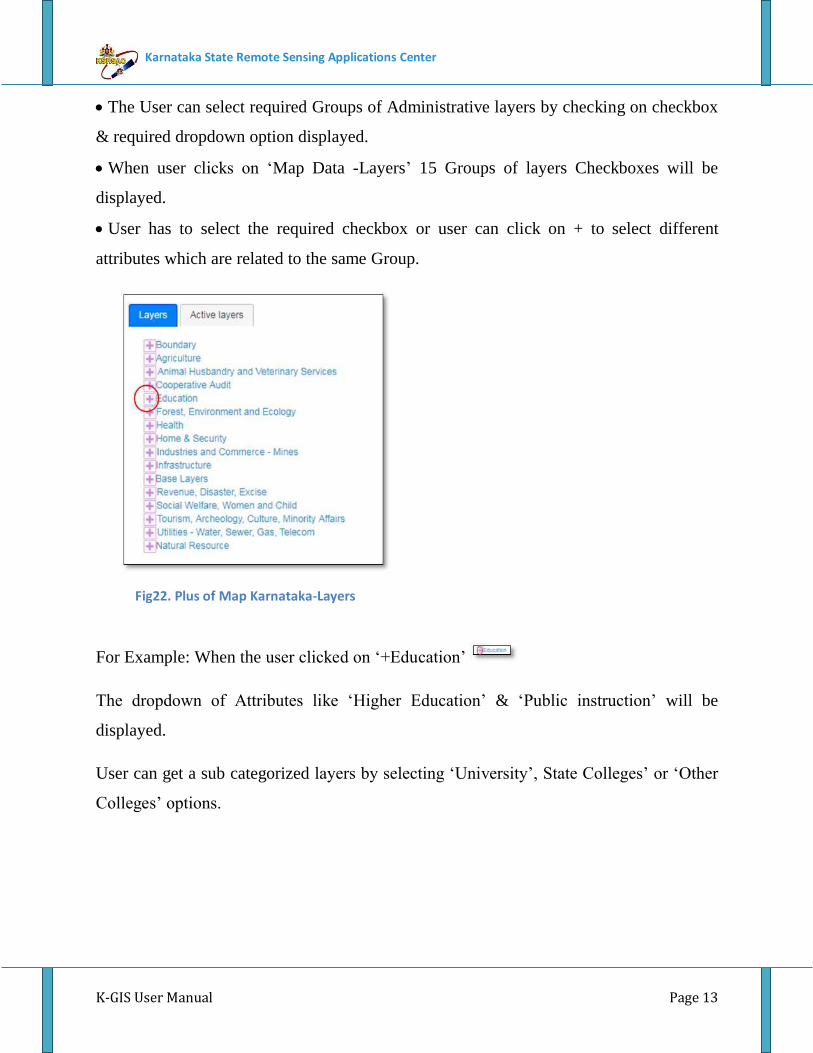
The User can select required Groups of Administrative layers by checking on checkbox
& required dropdown option displayed.
When user clicks on ‘Map Data -Layers’ 15 Groups of layers Checkboxes will be
displayed.
User has to select the required checkbox or user can click on + to select different
attributes which are related to the same Group.
Fig22. Plus of Map Karnataka-Layers
For Example: When the user clicked on ‘+Education’
The dropdown of Attributes like ‘Higher Education’ & ‘Public instruction’ will be
displayed.
User can get a sub categorized layers by selecting ‘University’, State Colleges’ or ‘Other
Colleges’ options.
K-GIS User Manual Page 14
Karnataka State Remote Sensing Applications Center
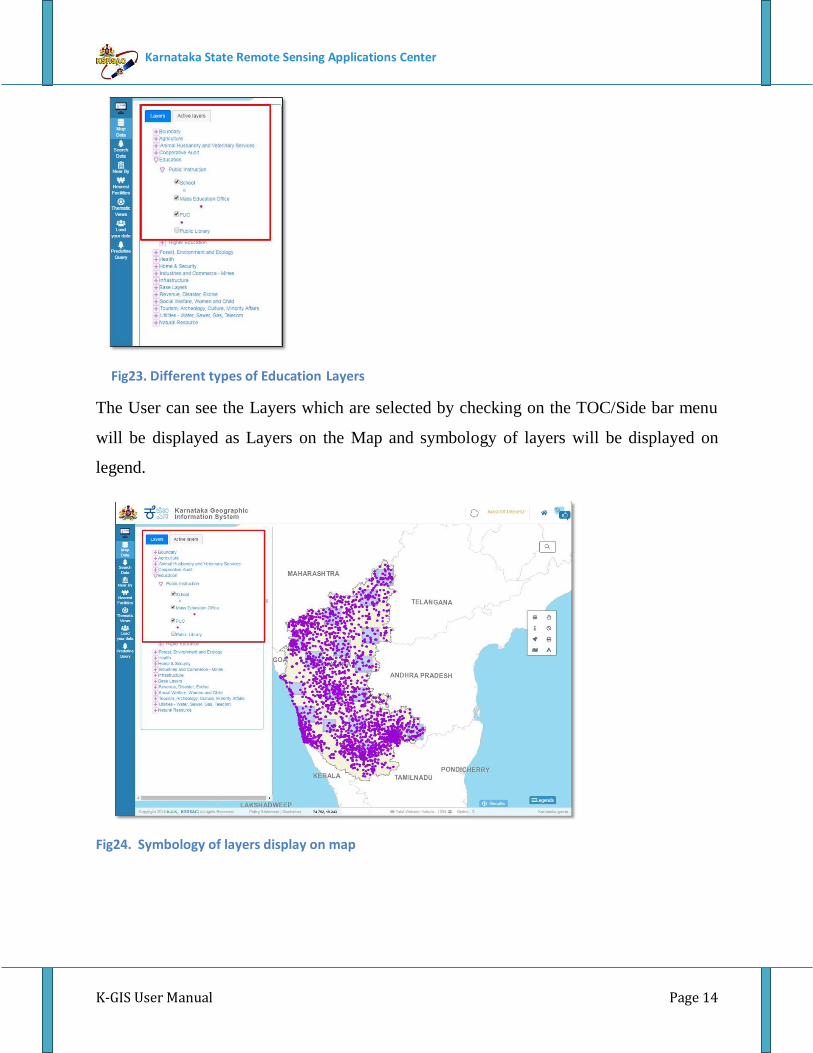
Fig23. Different types of Education Layers
The User can see the Layers which are selected by checking on the TOC/Side bar menu
will be displayed as Layers on the Map and symbology of layers will be displayed on
legend.
Fig24. Symbology of layers display on map

K-GIS User Manual Page 15
Karnataka State Remote Sensing Applications Center
4.1.2 Active Layers
The User can see the Active Layers which are selected by checking on the Layers will be
displayed as Layers on the Map and symbology of layers will be displayed.
Fig25. Symbology of active layers display on map
4.2 Search Data
4.2.1 Data
After selecting desired Sector, Layer, Fields, Operator & Values user can search Simple
and Complex queries by selecting ‘Data’ Tab.
The dialogue box of ‘Search Queries” will be displayed. With the checkbox of different
departments like ‘Education’ ‘Health’, ‘Agriculture’ & ‘IDD’
K-GIS User Manual Page 16
Karnataka State Remote Sensing Applications Center
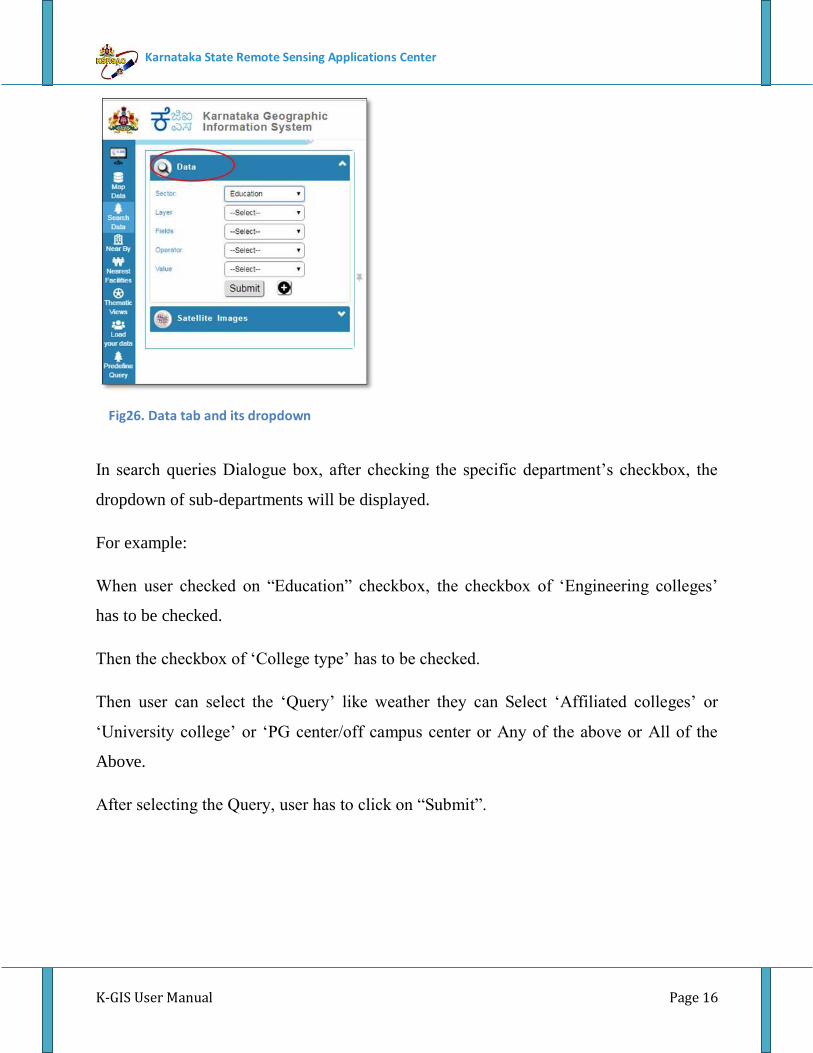
Fig26. Data tab and its dropdown
In search queries Dialogue box, after checking the specific department’s checkbox, the
dropdown of sub-departments will be displayed.
For example:
When user checked on “Education” checkbox, the checkbox of ‘Engineering colleges’
has to be checked.
Then the checkbox of ‘College type’ has to be checked.
Then user can select the ‘Query’ like weather they can Select ‘Affiliated colleges’ or
‘University college’ or ‘PG center/off campus center or Any of the above or All of the
Above.
After selecting the Query, user has to click on “Submit”.
K-GIS User Manual Page 17
Karnataka State Remote Sensing Applications Center
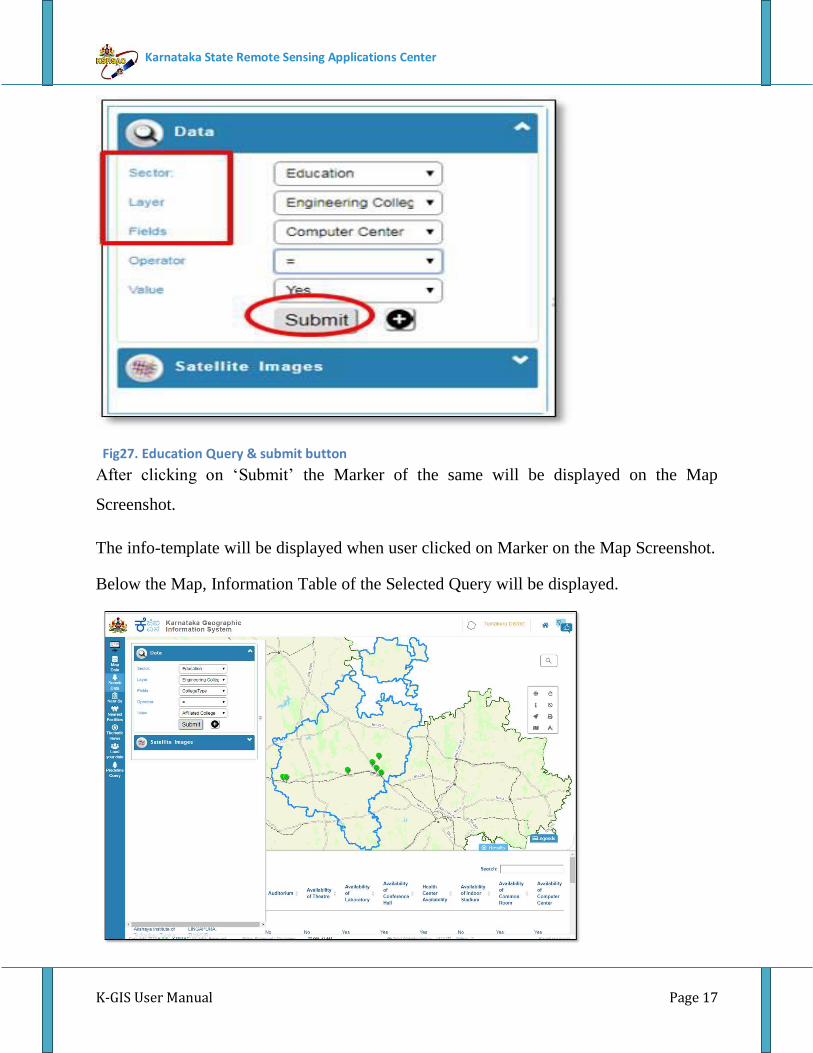
Fig27. Education Query & submit button
After clicking on ‘Submit’ the Marker of the same will be displayed on the Map
Screenshot.
The info-template will be displayed when user clicked on Marker on the Map Screenshot.
Below the Map, Information Table of the Selected Query will be displayed.
K-GIS User Manual Page 18
Karnataka State Remote Sensing Applications Center
Fig28. Result of the selected Query with Markers and table
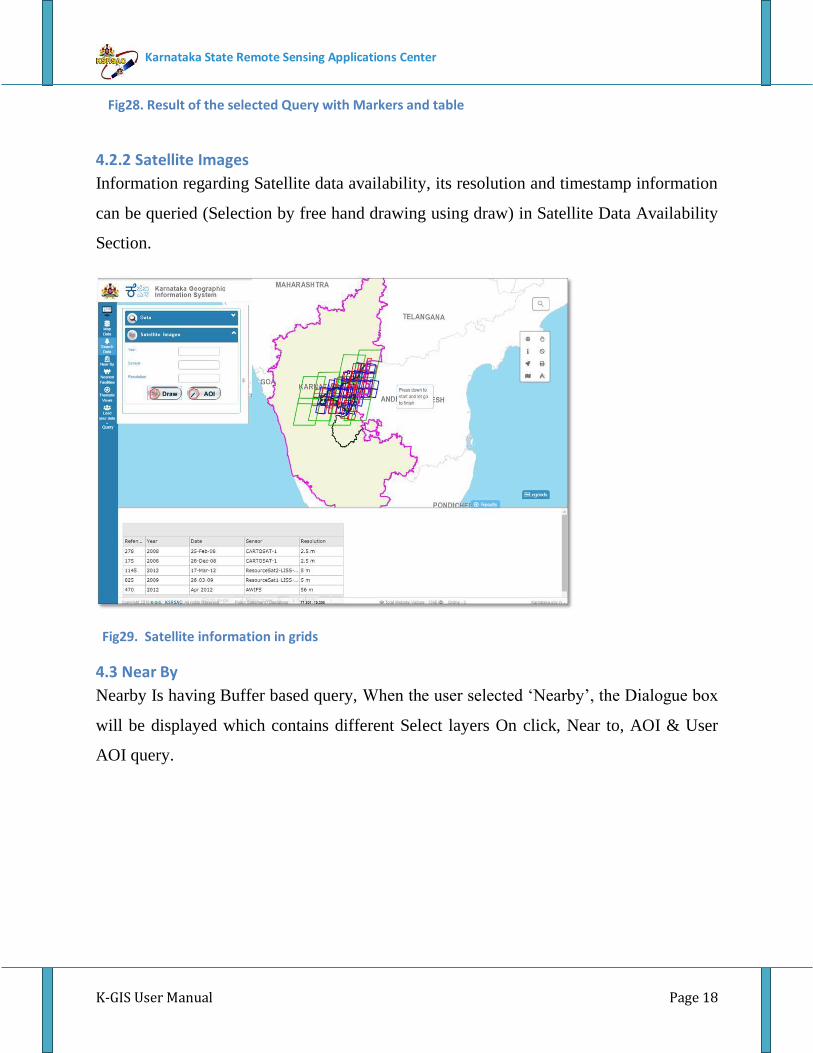
4.2.2 Satellite Images
Information regarding Satellite data availability, its resolution and timestamp information
can be queried (Selection by free hand drawing using draw) in Satellite Data Availability
Section.
Fig29. Satellite information in grids
4.3 Near By
Nearby Is having Buffer based query, When the user selected ‘Nearby’, the Dialogue box
will be displayed which contains different Select layers On click, Near to, AOI & User
AOI query.
K-GIS User Manual Page 19
Karnataka State Remote Sensing Applications Center
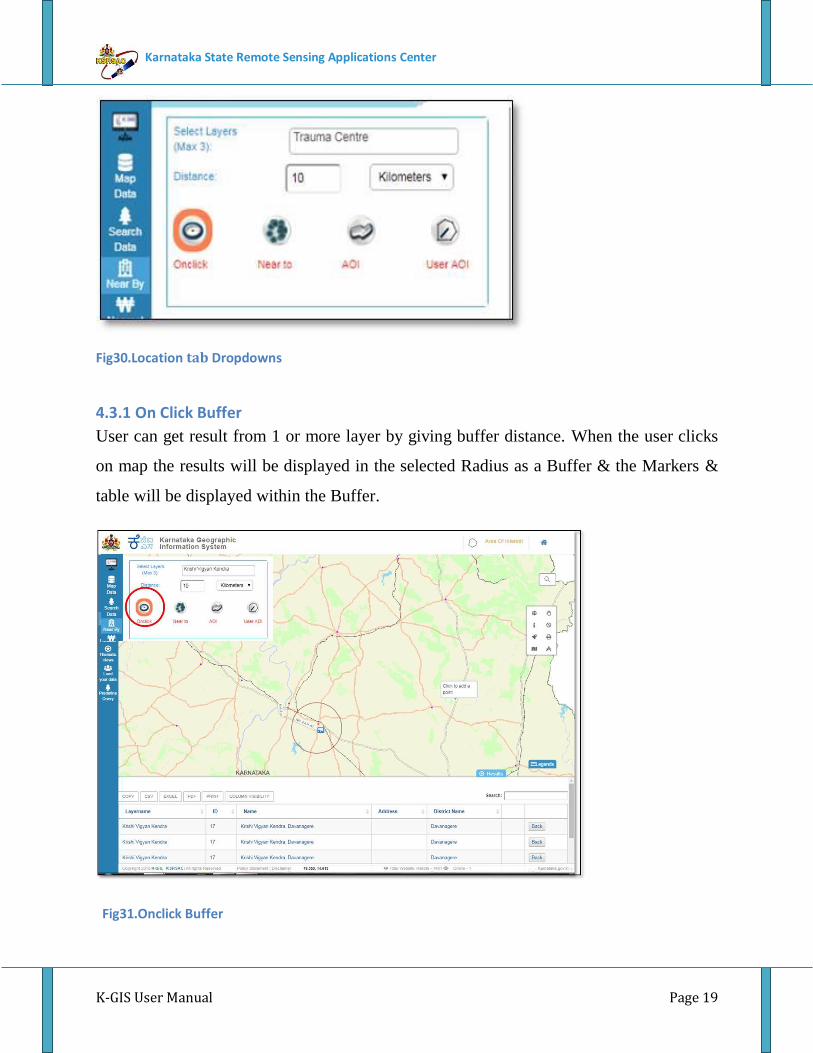
Fig30.Location tab Dropdowns
4.3.1 On Click Buffer
User can get result from 1 or more layer by giving buffer distance. When the user clicks
on map the results will be displayed in the selected Radius as a Buffer & the Markers &
table will be displayed within the Buffer.
Fig31.Onclick Buffer
K-GIS User Manual Page 20
Karnataka State Remote Sensing Applications Center
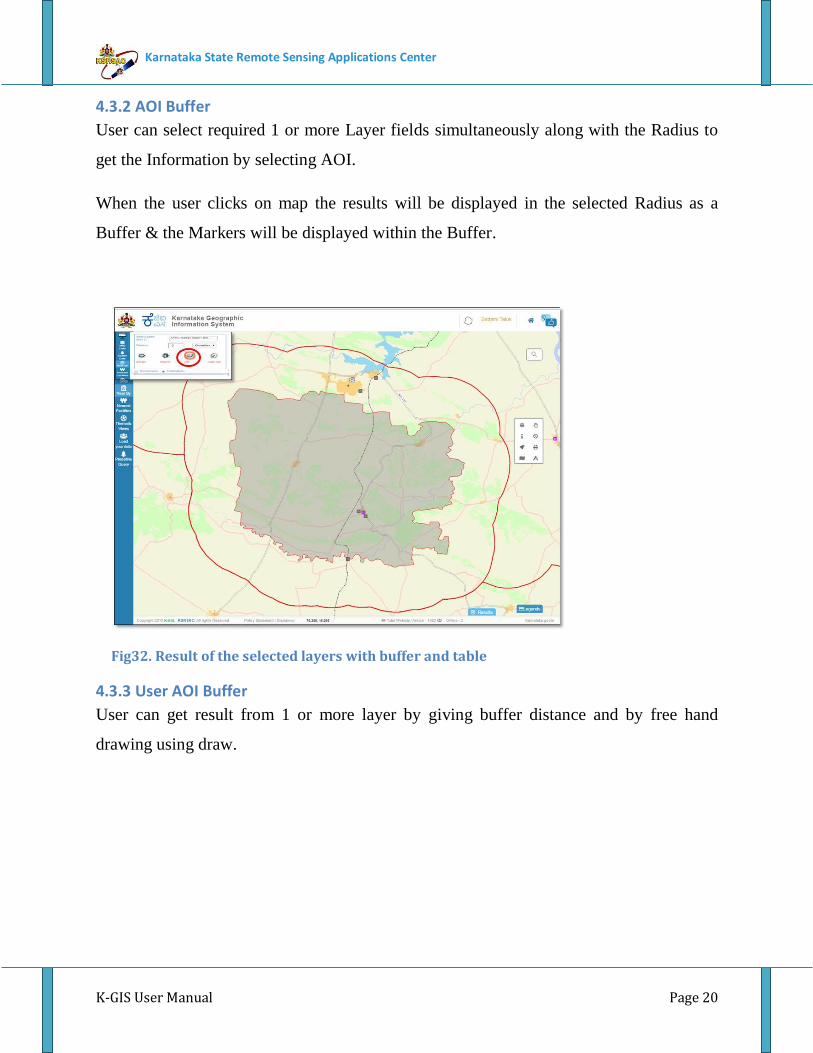
4.3.2 AOI Buffer
User can select required 1 or more Layer fields simultaneously along with the Radius to
get the Information by selecting AOI.
When the user clicks on map the results will be displayed in the selected Radius as a
Buffer & the Markers will be displayed within the Buffer.
Fig32. Result of the selected layers with buffer and table
4.3.3 User AOI Buffer
User can get result from 1 or more layer by giving buffer distance and by free hand
drawing using draw.

K-GIS User Manual Page 21
Karnataka State Remote Sensing Applications Center
Fig33. User AOI Buffer
4.4 Nearest Facilities
User can select required one or more Layer fields Simultaneously by Click on Map to get
Result, the results will be displayed on selected layers Markers & table will be displayed
on map.
K-GIS User Manual Page 22
Karnataka State Remote Sensing Applications Center
Fig34. Nearest Facilities Result of the selected dropdown with Markers and Table
4.5 Thematic Views
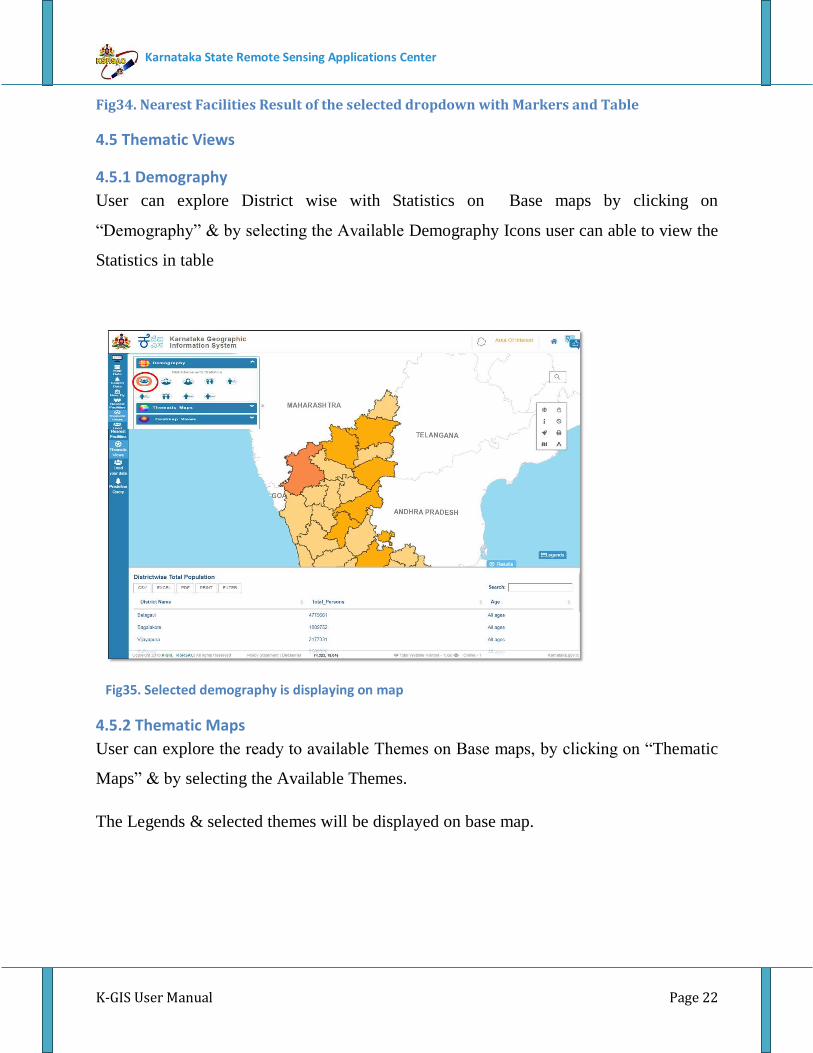
4.5.1 Demography
User can explore District wise with Statistics on Base maps by clicking on
“Demography” & by selecting the Available Demography Icons user can able to view the
Statistics in table
Fig35. Selected demography is displaying on map
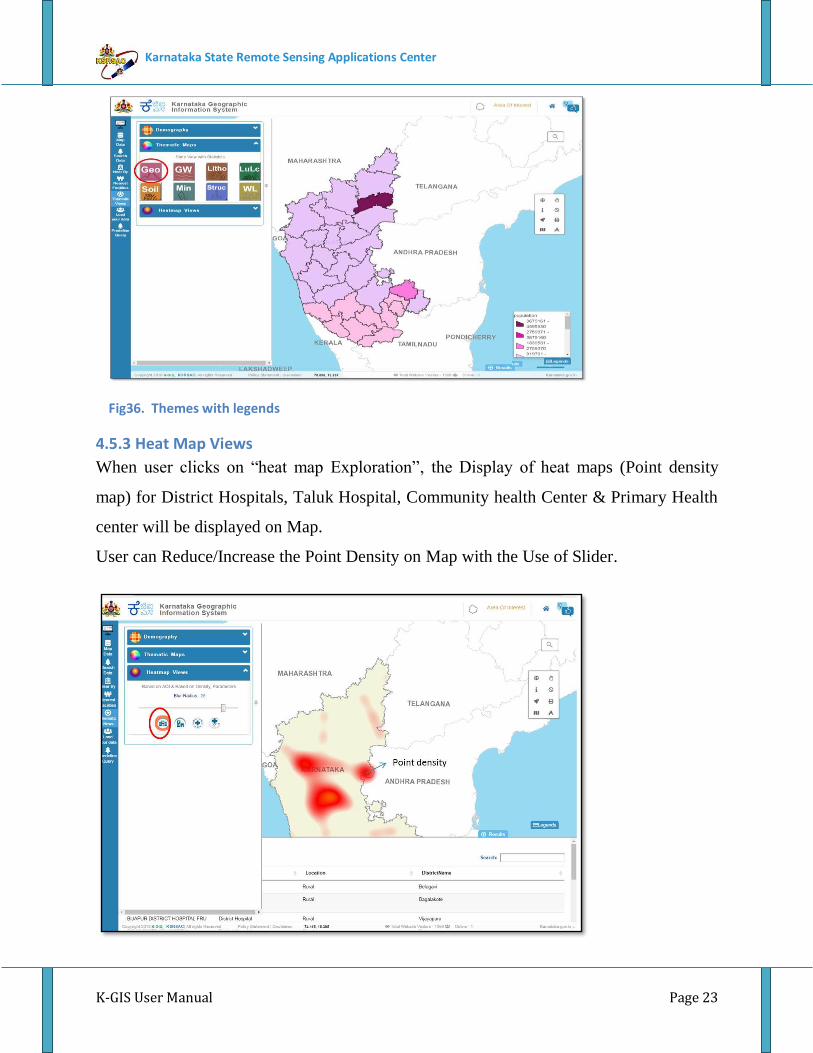
4.5.2 Thematic Maps
User can explore the ready to available Themes on Base maps, by clicking on “Thematic
Maps” & by selecting the Available Themes.
The Legends & selected themes will be displayed on base map.
K-GIS User Manual Page 23
Karnataka State Remote Sensing Applications Center
Fig36. Themes with legends
4.5.3 Heat Map Views
When user clicks on “heat map Exploration”, the Display of heat maps (Point density
map) for District Hospitals, Taluk Hospital, Community health Center & Primary Health
center will be displayed on Map.
User can Reduce/Increase the Point Density on Map with the Use of Slider.
K-GIS User Manual Page 24
Karnataka State Remote Sensing Applications Center
Fig37. Heat map Exploration with Point Density display on map
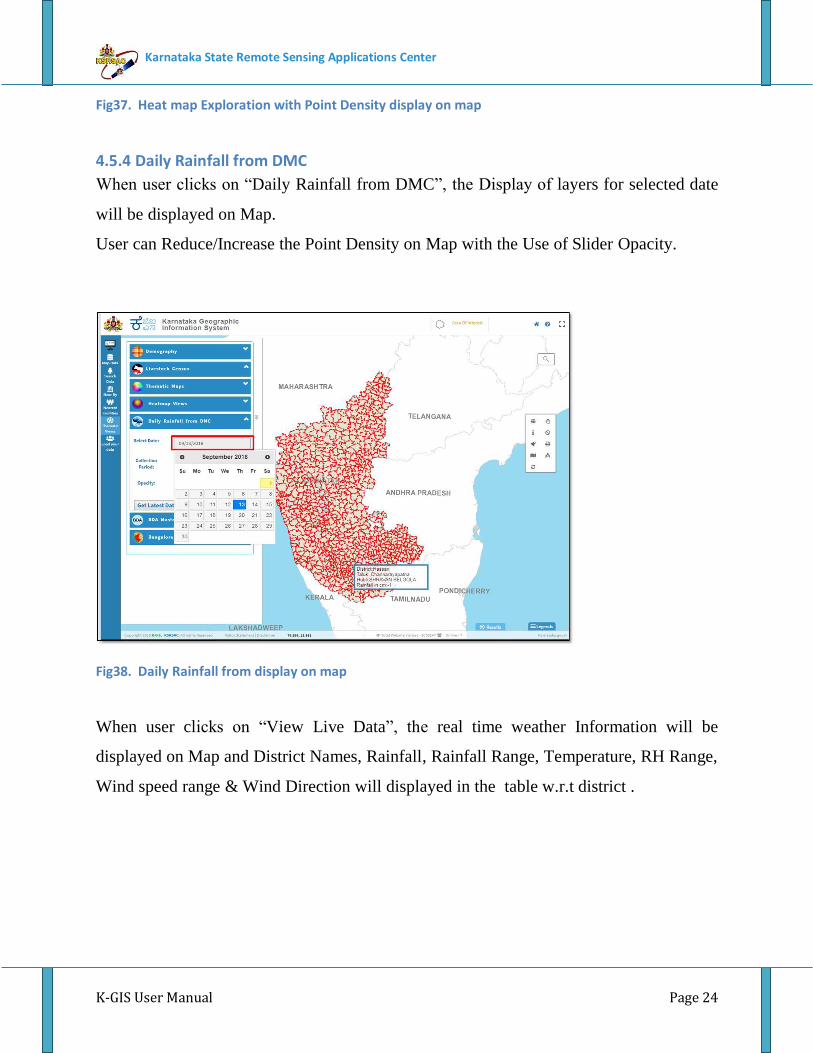
4.5.4 Daily Rainfall from DMC
When user clicks on “Daily Rainfall from DMC”, the Display of layers for selected date
will be displayed on Map.
User can Reduce/Increase the Point Density on Map with the Use of Slider Opacity.
Fig38. Daily Rainfall from display on map
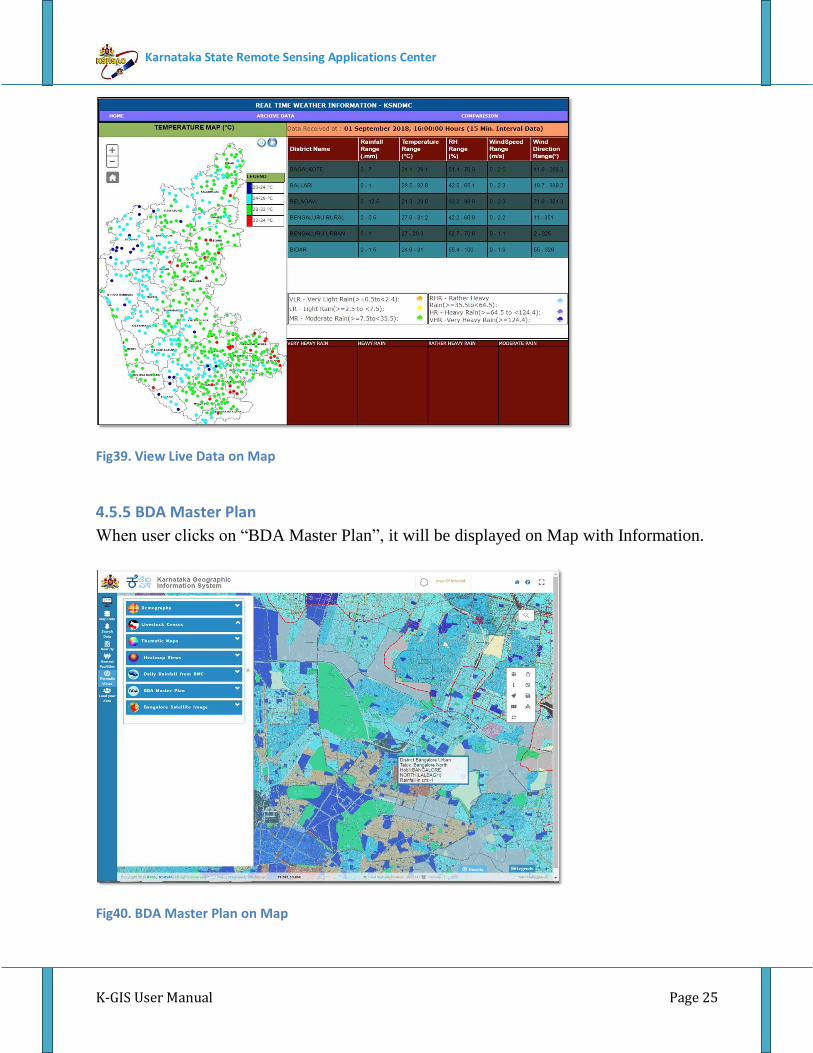
When user clicks on “View Live Data”, the real time weather Information will be
displayed on Map and District Names, Rainfall, Rainfall Range, Temperature, RH Range,
Wind speed range & Wind Direction will displayed in the table w.r.t district .
K-GIS User Manual Page 25
Karnataka State Remote Sensing Applications Center
Fig39. View Live Data on Map
4.5.5 BDA Master Plan
When user clicks on “BDA Master Plan”, it will be displayed on Map with Information.
Fig40. BDA Master Plan on Map
K-GIS User Manual Page 26
Karnataka State Remote Sensing Applications Center
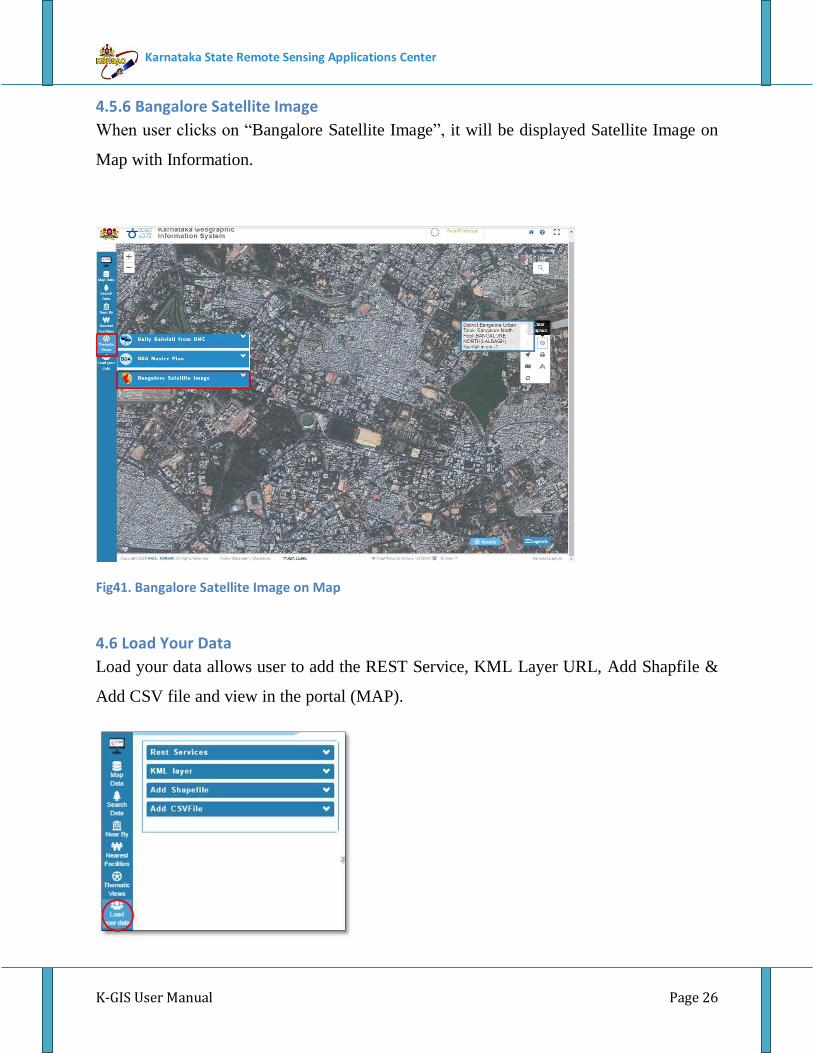
4.5.6 Bangalore Satellite Image
When user clicks on “Bangalore Satellite Image”, it will be displayed Satellite Image on
Map with Information.
Fig41. Bangalore Satellite Image on Map
4.6 Load Your Data
Load your data allows user to add the REST Service, KML Layer URL, Add Shapfile &
Add CSV file and view in the portal (MAP).
K-GIS User Manual Page 27
Karnataka State Remote Sensing Applications Center
Fig42. Load Your Data
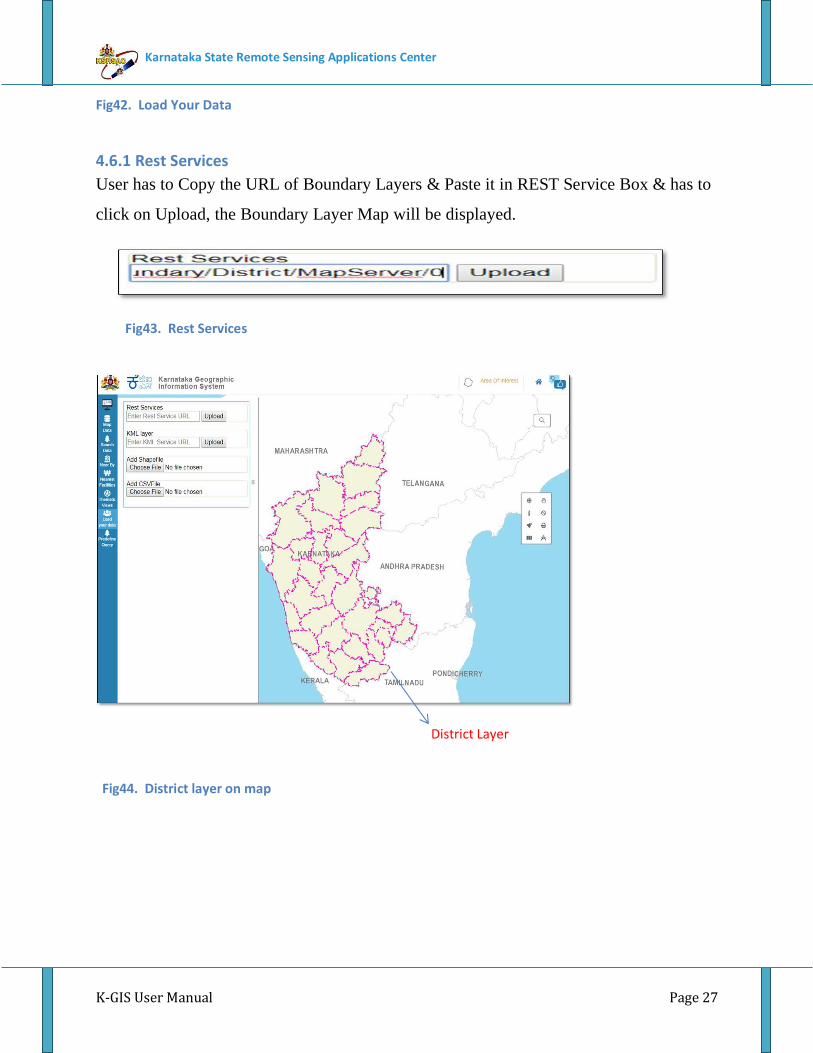
4.6.1 Rest Services
User has to Copy the URL of Boundary Layers & Paste it in REST Service Box & has to
click on Upload, the Boundary Layer Map will be displayed.
Fig43. Rest Services
District Layer
Fig44. District layer on map
K-GIS User Manual Page 28
Karnataka State Remote Sensing Applications Center
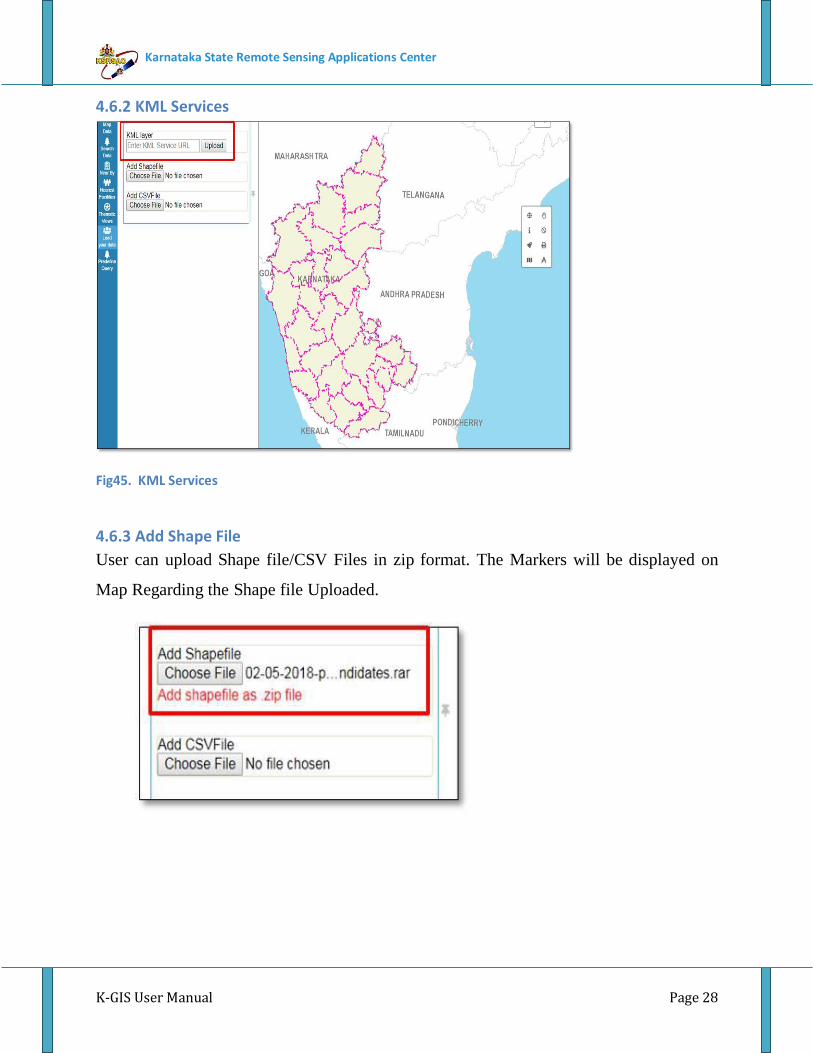
4.6.2 KML Services
Fig45. KML Services
4.6.3 Add Shape File
User can upload Shape file/CSV Files in zip format. The Markers will be displayed on
Map Regarding the Shape file Uploaded.
K-GIS User Manual Page 29
Karnataka State Remote Sensing Applications Center
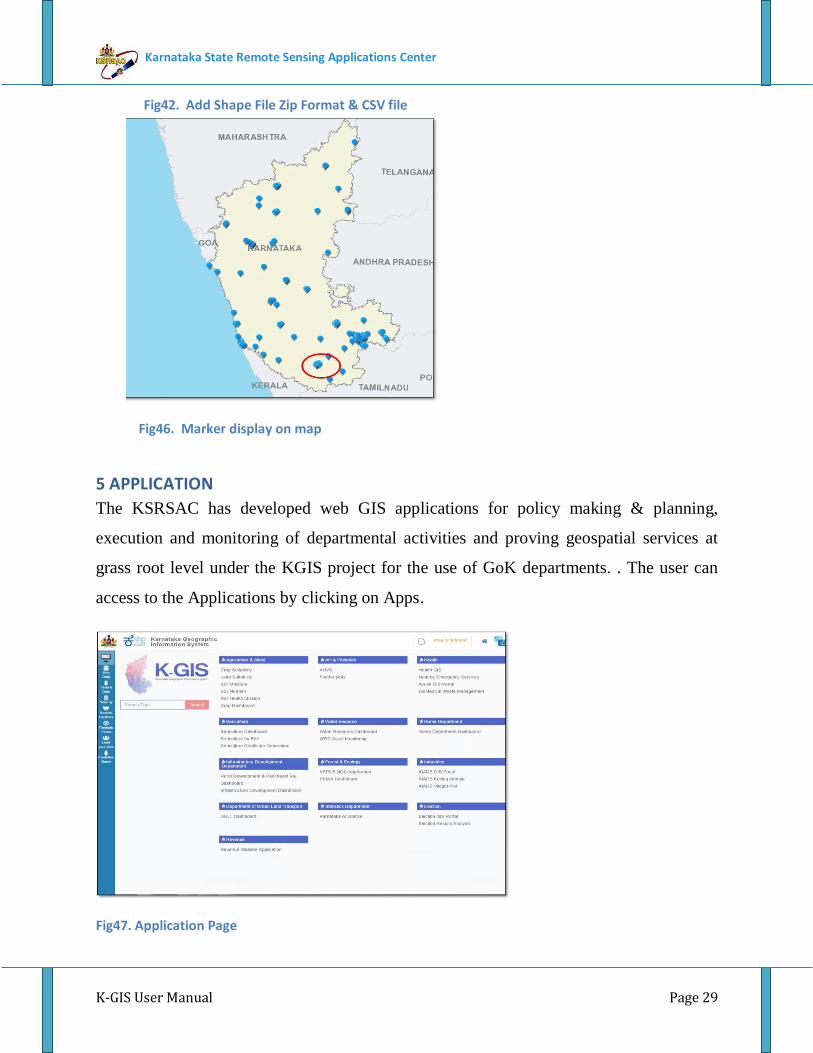
Fig42. Add Shape File Zip Format & CSV file
Fig46. Marker display on map
5 APPLICATION
The KSRSAC has developed web GIS applications for policy making & planning,
execution and monitoring of departmental activities and proving geospatial services at
grass root level under the KGIS project for the use of GoK departments. . The user can
access to the Applications by clicking on Apps.
Fig47. Application Page