karen poster
1
Boosting microalgal productivity: Effect of incubation parameters under mixotrophic conditions K.A. Canon-Rubio 1 , M. Ibarra, H. De la Hoz Siegler 2 1. [email protected] 2. [email protected] Background Microalgae is a promising alternative for environmental remediation and biofuel production. Chlamydomonas reinhardtii under mixotrophic conditions have show a significant increase of the culture density during the first week of incubation. Goals Using Chlamydomonas reinhardtii as test organism , this project aims to: • Evaluate the influence in the culture density and volumetric productivities of incubation parameters like sunlight cycles, inoculum concentration, type of organic carbon source and initial organic carbon concentration. • Determine the values of the studied incubation parameters that maximize the biomass production of Chlamydomonas reinhardtii within the fist week of growing. Conclusions Experimental results Materials and Methods Using Box-Behenken design and response surface methodology, it was possible to determine the incubation conditions that improve culture densities and volumetric productivities in a shorter time. Besides, through this methodology we were able to determine the influence of the explanatory variables, as well as the potential interactions between them. Test organism was cultivated in batch cultures using Bristol medium supplemented with yeast. Duplicates of each experimental data were performed. Analysis of the data were performed through biomass dry weight protocols, HPLC and Laser Scanning Confocal Fluorescence Microscopy. References [1] Beckmann, J., Lehr, F., Finazzi, G., Hankamer, B., Posten, C., Wobbe, L., & Kruse, O. (2009). Improvement of light to biomass conversion by de-regulation of light-harvesting protein translation in Chlamydomonas reinhardtii. Journal of Biotechnology, 142(1), 70–7. doi:10.1016/j.jbiotec.2009.02.015 [2] De la Hoz Siegler, H., Ben-Zvi, a, Burrell, R. E., & McCaffrey, W. C. (2011). The dynamics of heterotrophic algal cultures. Bioresource Technology, 102(10), 5764–74. doi:10.1016/j.biortech.2011.01.081 [3] Grobbelaar, J. U. (1991). 2 The influence of light/dark cycles in mixed algal cultures on their productivity. Bioresource Technology, 38(2-3), 189–194. doi:10.1016/0960-8524(91)90153-B [4] Cui, Y., Blackburn, J. W., & Liang, Y. (2012). Fermentation optimization for the production of lipid by Cryptococcus curvatus: Use of response surface methodology. Biomass and Bioenergy, 47, 410–417. http://doi.org/10.1016/j.biombioe.2012.09.017 Figure 1. Biomass production over time, results of previous experiments. Day/night ratio Inoculum concentration (g/L) 16/8 12/12 8/16 0.01 0.02 0.03 10 20 30 Figure 3. Advantages and disadvantages of microalgae production systems. Runs Inoculum (gCell/L) Light (N/D) Glucose conc. (g/L) Productivity (g/L.d) day 3 day 4 A 0.02 8 16 10 0.14 0.09 B 0.01 12 12 10 0.16 0.16 C 0.02 16 8 10 0.25 0.11 D 0.01 8 16 20 0.43 0.12 E 0.03 16 8 20 0.44 0.42 F 0.02 16 8 30 1.15 0.36 G 0.01 16 8 20 0.10 0.19 H 0.02 12 12 20 0.13 0.07 I 0.02 12 12 20 0.11 0.29 J 0.03 12 12 30 0.22 0.28 K 0.03 12 12 10 0.09 0.14 L 0.02 8 16 30 0.20 0.30 M 0.02 12 12 20 0.08 0.17 N 0.03 8 16 20 0.08 0.12 O 0.01 12 12 30 0.17 0.44 Table 1.Box-Behenken design of the variables and biomass productivity. A B C Figure 5. Experimental results when the ration of day/night changes. A) 8 hours night and 16 hours day, B) 12 hours night and 12 hours day and C) 16 hours night and 8 hours day. Figure 4. Time evolution of cultures, and the effect of initial cells concentration. All experiments shown were incubated at 16:8 night:day ratio. Central row had glucose initial concentration of 30g/L, all others had 20g/L. Initial biomass concentration 0.012 g/l Day 0 Day 1 Day 6 Day 8 Figure 2. Time evolution of previous experiments. Incubated at 12:12 night:day ratio, 20g/L of glucose and 0.01g/L of cells. Incubation time (days) Initial Cells concentration (mg/L) 30 20 10 2 3 4 5 Department of Chemical and Petroleum Engineering. University of Calgary Calculated biomass productivity Color change as function of time and cells concentration Biomass production as function of time Surface response analysis = 1.820 − 0.072 1 − 11.291 2 − 1.796 3 + 0.001 1 2 − 595.83 2 2 +0.382 3 2 + 0.3 1 2 + 0.028 1 3 + 23 2 3 2 = 0.7921 A B C D E F Figure 6. Contour and surface plots of the productivity at day 3 as function of the explanatory variables. Confocal laser scanning microscopy A E F G 12 days of incubation 3 days of incubation Figure 7.Laser scanning confocal fluorescence microscopy images. Left columns in day 3 and 12 show the merged transmitted light images for 540-600 nm in green and 660-680 nm in red. • Sunlight cycles, night duration and inoculum concentration significantly influence culture density productivity of C. reinhardtii. • At 16:8 night:day ratio, the highest biomass concentrations was in synchrony with the change in cell pigmentation, indicating that C. reinhardtii successfully regulates its metabolic machinery. • An empirical expression that correlates this explanatory variables with the biomass production within the first week of incubation was obtained. • High glucose concentration, high night:day ratio (up to 16:8) and high inoculum concentration enhance the biomass production.
-
Upload
mary-ibarra-vidal -
Category
Documents
-
view
82 -
download
3
Transcript of karen poster
Boosting microalgal productivity:Effect of incubation parameters under mixotrophic conditions
K.A. Canon-Rubio1, M. Ibarra, H. De la Hoz Siegler2
1. [email protected] 2. [email protected]
BackgroundMicroalgae is a promising alternative for environmental remediation and biofuelproduction. Chlamydomonas reinhardtii under mixotrophic conditions have show asignificant increase of the culture density during the first week of incubation.
GoalsUsing Chlamydomonas reinhardtii as test organism , this project aims to:
• Evaluate the influence in the culture density and volumetric productivities ofincubation parameters like sunlight cycles, inoculum concentration, type oforganic carbon source and initial organic carbon concentration.
• Determine the values of the studied incubation parameters that maximize thebiomass production of Chlamydomonas reinhardtii within the fist week ofgrowing.
Conclusions
Experimental results
Materials and MethodsUsing Box-Behenken design and response surface methodology, it was possible todetermine the incubation conditions that improve culture densities and volumetricproductivities in a shorter time. Besides, through this methodology we were able todetermine the influence of the explanatory variables, as well as the potentialinteractions between them.
Test organism was cultivated in batch cultures using Bristol medium supplementedwith yeast. Duplicates of each experimental data were performed. Analysis of thedata were performed through biomass dry weight protocols, HPLC and LaserScanning Confocal Fluorescence Microscopy.
References[1] Beckmann, J., Lehr, F., Finazzi, G., Hankamer, B., Posten, C., Wobbe, L., & Kruse, O. (2009). Improvement of light to biomass conversion by de-regulation of light-harvesting protein translation in Chlamydomonas reinhardtii. Journal of Biotechnology, 142(1), 70–7. doi:10.1016/j.jbiotec.2009.02.015[2] De la Hoz Siegler, H., Ben-Zvi, a, Burrell, R. E., & McCaffrey, W. C. (2011). The dynamics of heterotrophic algal cultures. Bioresource Technology, 102(10), 5764–74. doi:10.1016/j.biortech.2011.01.081[3] Grobbelaar, J. U. (1991). 2 The influence of light/dark cycles in mixed algal cultures on their productivity. Bioresource Technology, 38(2-3), 189–194. doi:10.1016/0960-8524(91)90153-B[4] Cui, Y., Blackburn, J. W., & Liang, Y. (2012). Fermentation optimization for the production of lipid by Cryptococcus curvatus: Use of response surface methodology. Biomass and Bioenergy, 47, 410–417. http://doi.org/10.1016/j.biombioe.2012.09.017
Figure 1. Biomass production over time, results of previous experiments.
Day
/nig
ht
rati
o
Inoculum concentration(g/L)
16/8
12/12
8/16
0.01 0.02 0.03
10
20
30
Figure 3. Advantages and disadvantages of microalgae production systems.
RunsInoculum (gCell/L)
Light (N/D)
Glucose conc. (g/L)
Productivity (g/L.d)
day 3 day 4A 0.02 8 16 10 0.14 0.09B 0.01 12 12 10 0.16 0.16C 0.02 16 8 10 0.25 0.11D 0.01 8 16 20 0.43 0.12E 0.03 16 8 20 0.44 0.42F 0.02 16 8 30 1.15 0.36G 0.01 16 8 20 0.10 0.19H 0.02 12 12 20 0.13 0.07I 0.02 12 12 20 0.11 0.29J 0.03 12 12 30 0.22 0.28K 0.03 12 12 10 0.09 0.14L 0.02 8 16 30 0.20 0.30M 0.02 12 12 20 0.08 0.17N 0.03 8 16 20 0.08 0.12O 0.01 12 12 30 0.17 0.44
Table 1.Box-Behenken design of the variables and biomass productivity. A B C
Figure 5. Experimental results when the ration of day/night changes. A) 8 hours night and 16 hours day, B) 12 hours night and 12 hours day and C) 16 hours night and 8 hours day.
Figure 4. Time evolution of cultures, and the effect of initial cells concentration. All experiments shown were incubated at 16:8 night:day ratio. Central row had glucose initial concentration
of 30g/L, all others had 20g/L.
Initial biomass concentration 0.012 g/l
Day 0 Day 1 Day 6 Day 8
Figure 2. Time evolution of previous experiments. Incubated at 12:12 night:day ratio, 20g/L of glucose and 0.01g/L of cells.
Incubation time (days)
Init
ial C
ells
co
nce
ntr
atio
n (
mg
/L)
30
20
10
2 3 4 5
Department of Chemical and Petroleum Engineering. University of Calgary
Calculated biomass productivity
Color change as function of time and cells concentration
Biomass production as function of time
Surface response analysis
𝐵𝑖𝑜𝑚𝑎𝑠𝑠 𝑔𝐿 = 1.820 − 0.072𝑋1 − 11.291𝑋2 − 1.796𝑋3 + 0.001𝑋1
2 − 595.83𝑋22
+0.382𝑋32 + 0.3𝑋1𝑋2 + 0.028𝑋1𝑋3 + 23𝑋2𝑋3
𝑟2 = 0.7921
A B C
D E F
Figure 6. Contour and surface plots of the productivity at day 3 as function of the explanatory variables.
Confocal laser scanning microscopy
A
E
F
G
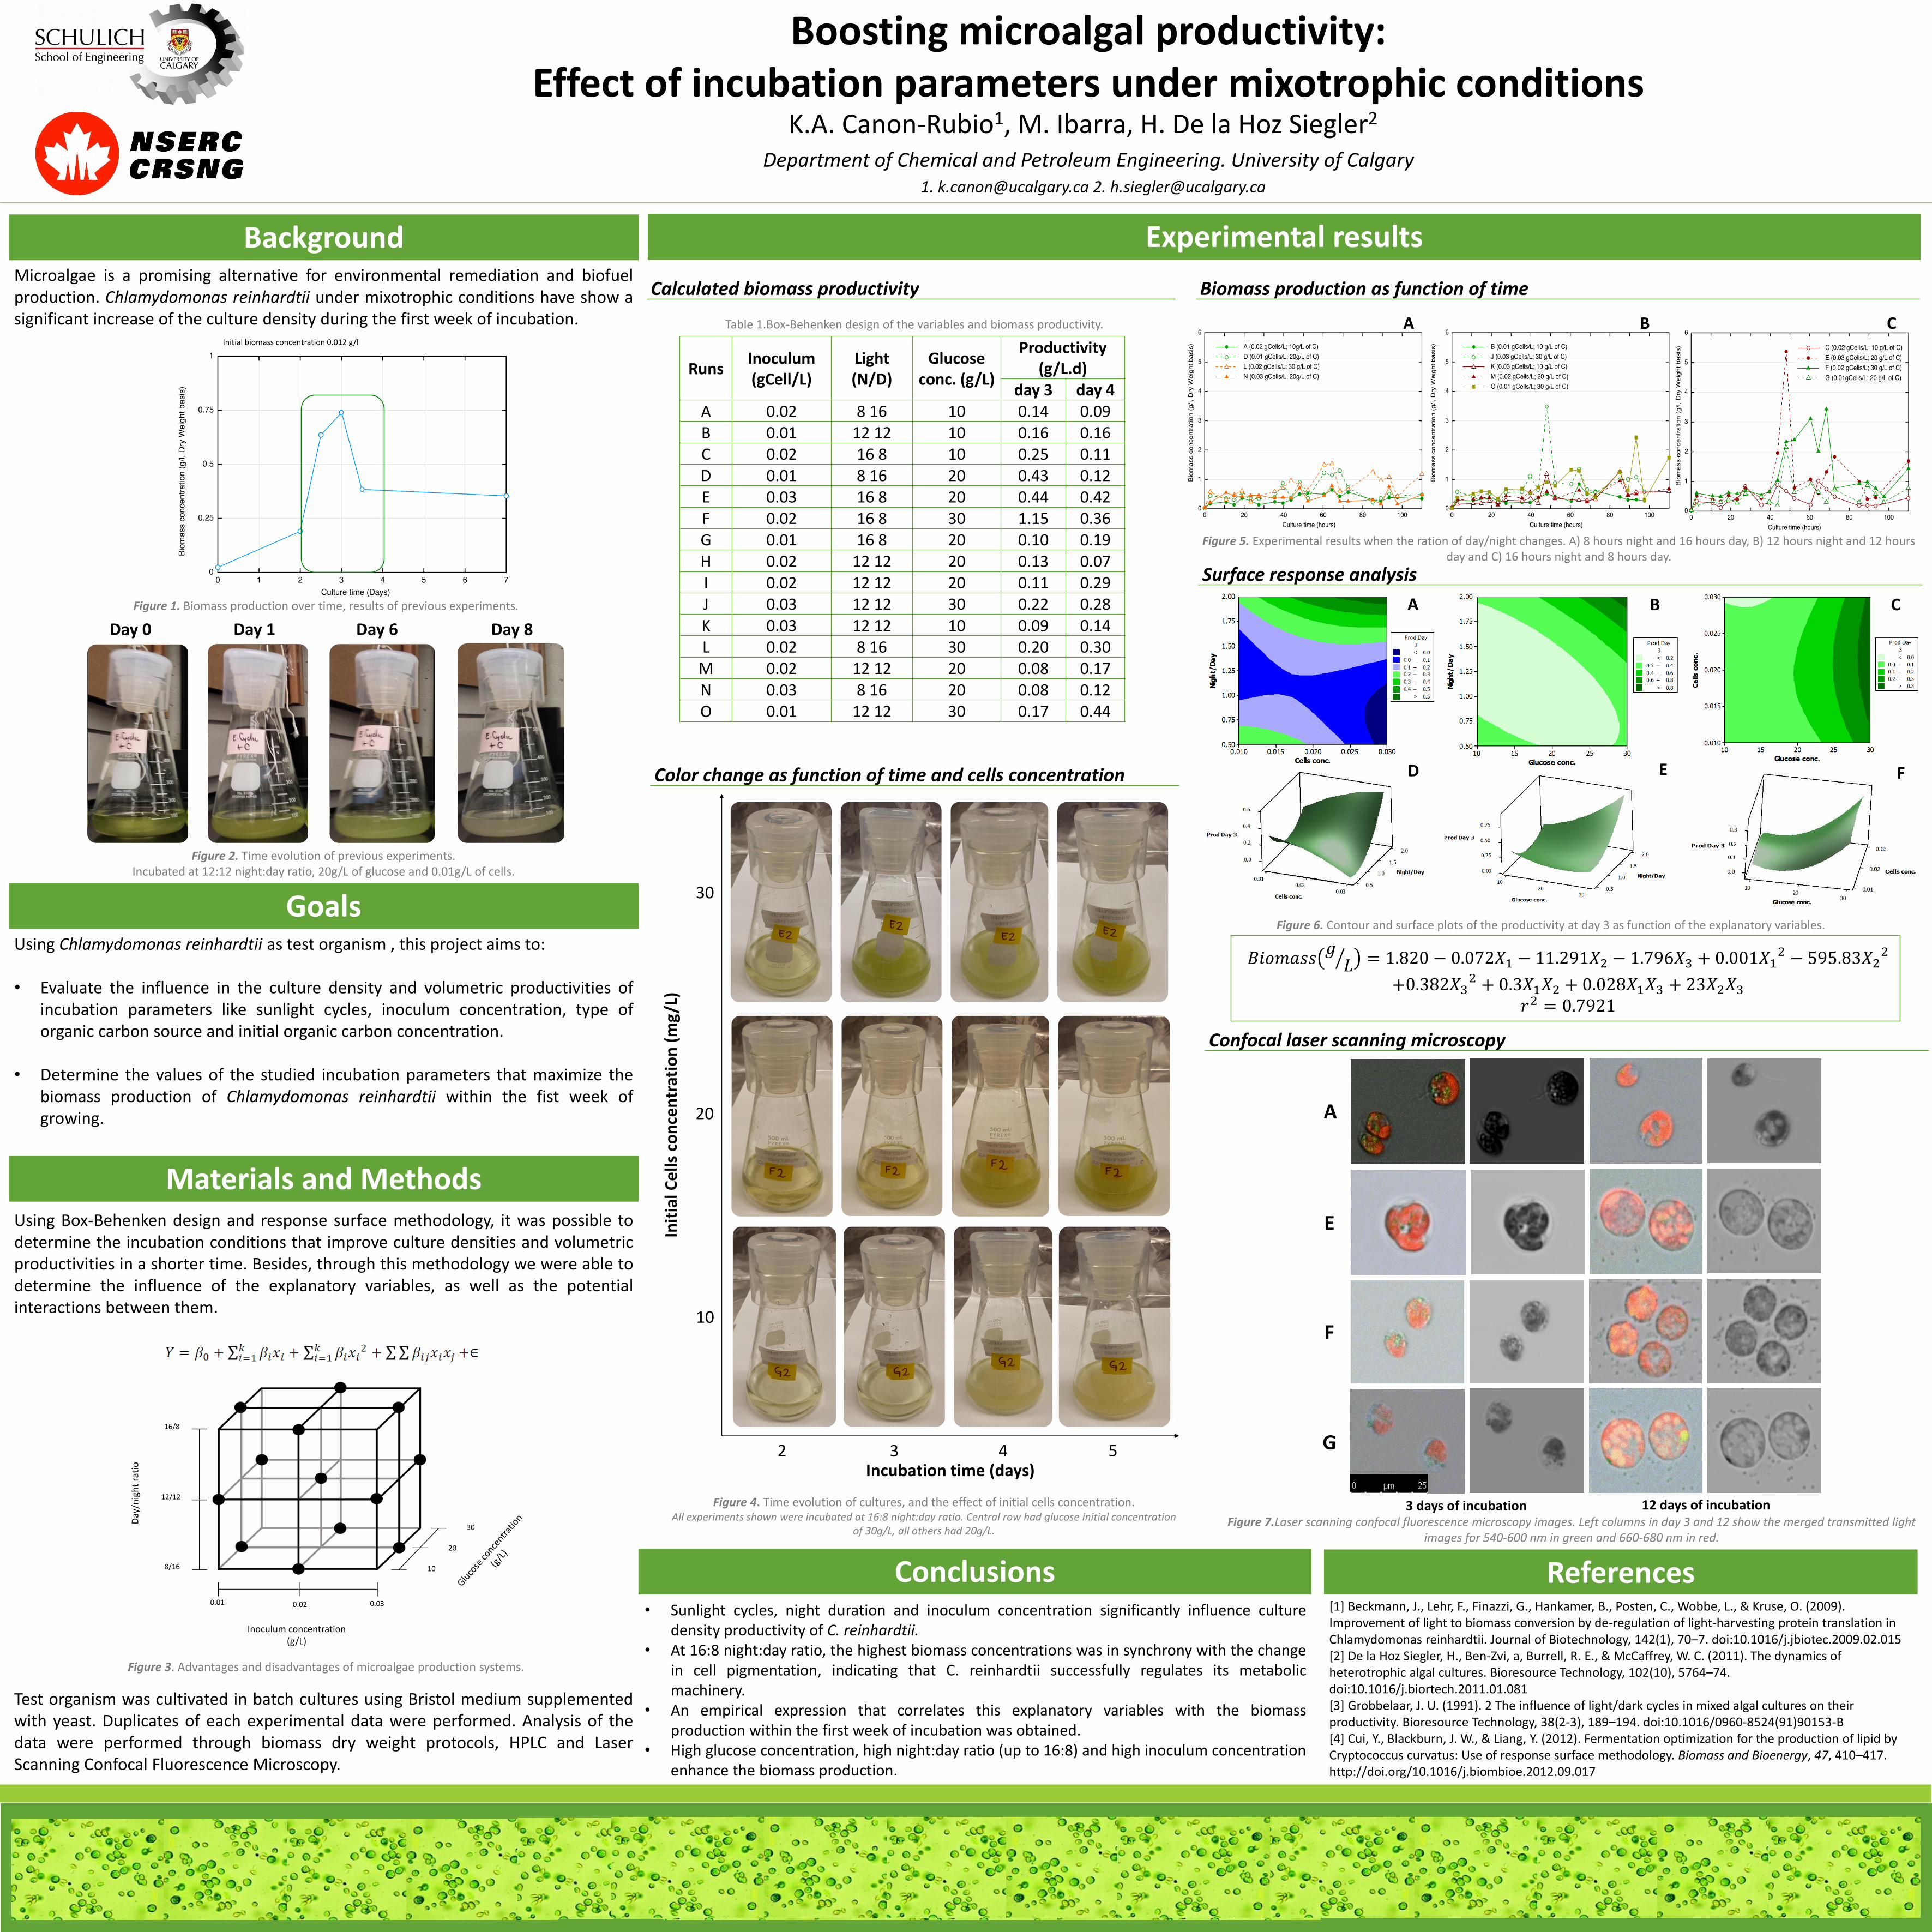
12 days of incubation3 days of incubationFigure 7.Laser scanning confocal fluorescence microscopy images. Left columns in day 3 and 12 show the merged transmitted light
images for 540-600 nm in green and 660-680 nm in red.
• Sunlight cycles, night duration and inoculum concentration significantly influence culturedensity productivity of C. reinhardtii.
• At 16:8 night:day ratio, the highest biomass concentrations was in synchrony with the changein cell pigmentation, indicating that C. reinhardtii successfully regulates its metabolicmachinery.
• An empirical expression that correlates this explanatory variables with the biomassproduction within the first week of incubation was obtained.
• High glucose concentration, high night:day ratio (up to 16:8) and high inoculum concentrationenhance the biomass production.