Kansei Evaluation Model of Tractor Shape Design...
18
92 AMSE JOURNALS-2016-Series: Advances C; Vol. 71; N°1; pp 92-109 Submitted July 2016; Revised Oct. 15, 2016, Accepted Dec. 10, 2016 Kansei Evaluation Model of Tractor Shape Design Based on GA-BP Neural Network *Huiping Guo, **Fuzeng Yang* *College of Mechanical and Electronic Engineering, Northwest A&F University, Yangling 712100, Shaanxi, China. ([email protected]) **College of Mechanical and Electronic Engineering, Northwest A&F University, Yangling 712100, Shaanxi, China. (Corresponding author: [email protected]) Abstract To mine users’ perceptual demand for product shape, it is very important to build the relational model between design elements of product shape and users’ Kansei evaluation. We apply Kansei engineering to the shape design of wheeled tractor. The design elements obtained by morphological analysis constitute the input layer, and perceptual semantic evaluation obtained by semantic differential method constitutes the output layer. Genetic algorithm-back propagation (GA-BP) neural network is used to construct the relational model between design elements of product shape and users’ Kansei evaluation. Experiment shows that the predicted values using the training samples are consistent with Kansei evaluation values based on GA-BP neural network. Meanwhile, the relative error between the predicted and measured values of users’ Kansei evaluation using the testing samples is less than 3%. However, There is a larger deviation between the predicted values using the training samples and Kansei evaluation values based on BP model. Furthermore, the relative error between the predicted and measured values of users’ Kansei evaluation using the testing samples is more than 10%. Comparison GA-BP with BP neural network modeling shows the perceptual evaluation model based on GA-BP is superior to BP network model. Therefore, the model is capable of accurate prediction of users’ Kansei evaluation about product shape utilizing GA-BP neural network modeling and can be used to guide product shape design. This will not only improve the efficiency of product research and development, but also enhance enterprises’ competitiveness.
Transcript of Kansei Evaluation Model of Tractor Shape Design...

92
AMSE JOURNALS-2016-Series: Advances C; Vol. 71; N°1; pp 92-109
Submitted July 2016; Revised Oct. 15, 2016, Accepted Dec. 10, 2016
Kansei Evaluation Model of Tractor Shape Design Based on GA-BP
Neural Network
*Huiping Guo, **Fuzeng Yang*
*College of Mechanical and Electronic Engineering, Northwest A&F University, Yangling
712100, Shaanxi, China. ([email protected])
**College of Mechanical and Electronic Engineering, Northwest A&F University, Yangling
712100, Shaanxi, China. (Corresponding author: [email protected])
Abstract
To mine users’ perceptual demand for product shape, it is very important to build the
relational model between design elements of product shape and users’ Kansei evaluation. We
apply Kansei engineering to the shape design of wheeled tractor. The design elements obtained
by morphological analysis constitute the input layer, and perceptual semantic evaluation obtained
by semantic differential method constitutes the output layer. Genetic algorithm-back propagation
(GA-BP) neural network is used to construct the relational model between design elements of
product shape and users’ Kansei evaluation. Experiment shows that the predicted values using the
training samples are consistent with Kansei evaluation values based on GA-BP neural network.
Meanwhile, the relative error between the predicted and measured values of users’ Kansei
evaluation using the testing samples is less than 3%. However, There is a larger deviation
between the predicted values using the training samples and Kansei evaluation values based on
BP model. Furthermore, the relative error between the predicted and measured values of users’
Kansei evaluation using the testing samples is more than 10%. Comparison GA-BP with BP
neural network modeling shows the perceptual evaluation model based on GA-BP is superior to
BP network model. Therefore, the model is capable of accurate prediction of users’ Kansei
evaluation about product shape utilizing GA-BP neural network modeling and can be used to
guide product shape design. This will not only improve the efficiency of product research and
development, but also enhance enterprises’ competitiveness.

93
Key words: Kansei evaluation, The tractor shape, GA-BP neural network, Design element
1. Introduction
With the progress of economy and technology, the product market has been transformed
from the mode of designer and manufacturer domination to the mode of consumer demand
domination. Therefore, mining for deep psychological and perceptual demand of the consumers is
the route that must be taken towards innovative product design. Product shape is an important
part of product design, and users’ perception and perceptual evaluation of the product shape
determines the value of the products and the style of the brand.
Kansei engineering (KE) is the process of converting users’ vague and perceptual demand
and sensory perception into design elements of the product. The core issue is quantification of
Kansei and to turn the quantification results into guidelines for automatic innovative design of
product shape. This also represents a major aspect of KE [1].
To visualize the unobservable emotions and perceptions of the consumers, some
psychological methods are needed. Conventional evaluation methods in KE include semantic
differential, verbal protocol analysis, factor analysis, clustering analysis and multi-scale analysis
[2-5]. These methods only quantify the perceptions, without building the relational model
between Kansei semantics and design elements. Thus they cannot be used to provide guidance for
the practice of product shape design. To find out quantified connections between users’ Kansei
information and design elements, regression analysis, quantification theory I and neural network
algorithm have been adopted. Mathematical statistics and regression analysis are the most
commonly used methods for building linear relations. For example, Chitoshi Tanoue et al.[6] and
Yongfeng Li applied quantification theory I to the design of automotive interiors and door lock
and built the relations between design elements and Kansei semantics [7]. The dominant variables
were used to predict quantitative baseline variables, and the perceptual descriptions were related
to the design elements of product shape. Ying Wang and Yan Chen used KE principles and
techniques to quantify the design elements of women’s overcoat and built the linear regression
model based on users’ Kansei evaluation, by combining with quantification theory I [8].
Junsheng Kuang and Pingyu Jiang performed questionnaire survey and regression analysis to
explore for consumers’ sensory perception about mobile phone and then established the
quantitative relationship with respect to the design parameters [9]. Zhenghong Liu et al.
proposed the use of multiple regression analysis to build the mapping relationship between multi-

94
dimensional modeling features and Kansei experience about numerically controlled machine tool
[10]. Thus the Kansei evaluation model was obtained.
But when it comes to highly delicate objects, linear models may fail to meet the precision
requirement for correlation analysis. Addressing this problem, intelligent algorithms are now
used, especially neural network algorithm. Meiyu Zhou and Qian Li [11]built the relationship
between Kansei experience and design elements of product shape for computer-controlled
microwave oven by using neural network algorithm. An optimal combination of shape features
with the highest value of Kansei evaluation was determined by the training of neural network and
then used for redesign of product shape. Yan Zhou et al. decomposed the shape of mobile phone
into elements and built the relational model between design elements and Kansei evaluation using
BP neural network [12]. On this basis, the product shape design was improved by KE and the
perceptual design was finished. Mengdar Shie and Yuen Yeh combined partial least squares
method and neural network algorithm in designing a shape design support system for running
shoes based on the mining for users’ perception [13]. Thus the appearance elements were
quantitatively correlated to consumers’ Kansei. Lijing Wang et al. decomposed the interiors of
airplane cabin into elements and applied KE to obtain users’ Kansei evaluation[14]. Finally the
relational model between interior design elements and Kansei evaluation was constructed by
neural network algorithm.
2. GA-BP neural network
Some achievements have been made in the applications of BP neural network to the
correlation between perceptual evaluation and design elements. But BP neural network alone
lacks global optimization ability and has slow convergence. It is still inferior to some objective
evaluation techniques. We propose GA-BP neural network algorithm for building the relationship
between design elements and users’ perception for tractors. This provides an effective and
objective method of shape design evaluation and serves as the basis for redesign.
2.1 BP neural network
2.1.1 Fundamental principle of the BP neural network
The concept of Back Propagation Neural Network (BPNN, the same below) was initiated by
a group of scientists led by Rinehart and McClelland in 1986. This multi-layer feedforward
network that is trained by backward propagation of errors has become one of the most
popularized neural network models [15]. BP neural network can learn and store a large amount of

95
mapping relations of input-output model without the need for revealing the mathematical
functions that describe the mapping relations. Method of gradient descent is used as the learning
rule, by which the weights and thresholds are constantly based on the propagation direction so
that the error sum of squares is the smallest. The typology of the BP neural network consists of
input layer, hidden layer and output layer, as shown in Fig. 1.
Fig.1. Typology of BP neural network
The BP algorithm consists of two processes: forward propagation of data flow input, and
backward propagation of error signals [16]. The direction of forward propagation is “input layer-
→hidden layer-→output layer”, and the status of one layer of neurons can and only can act on the
neurons of the next layer. If any actual output in the output layer is not the target one, the
backward propagation of error signals begins [17]. Through the two alternative processes, the
gradient descent strategy is performed in the weight vector space where a group of weight vector
is searched in a dynamic and iterative manner to minimize network error function, so that the
process of information extraction and memory is completed.
2.1.2 characteristics of BP neural network modeling
The main characteristics of BP neural network contain:
(1) Nonlinear mapping capability. The BP neural network can approach any nonlinear
continuous function at arbitrary precision;
(2) Parallel processing and distributed processing. Data in BP neural network undergo
distributive storage and parallel processing.
(3) The ability of self-study and self-adaptability. The neural network that receives training
can extract regular knowledge from input data and output data, remembering and generalizing it
in the form of neural weight. Online learning is also allowed.
(4) Data integrity. BP is capable of simultaneous processing with regard to quantitative data
and qualitative data.

96
(5) Multi-variable system. The number of input variables and output variables is arbitrary.
2.2 BP neural network trained by GA
The genetic algorithm, initiated mainly by Prof. John Holland at the University of Michigan
during 1960s -1970s, is essentially a parallel and global search heuristic that generates useful
solutions to optimization and search problems in a highly-efficient manner [18]. Information of
search space (possible solutions) can be automatically acquired and accumulated when genetic
algorithm traverses the solution space. What is more, the search process undergoes self-adapting
control in search for optimal solutions. Currently, there are three methods for the genetic
algorithm to solve problems in limited neural networks: the evolution of network weight and
threshold, the evolution of network structure, and the evolution of learning principles.
The evolution of network weight and threshold is adopted in the paper to offset the low rate
of global optimization and convergence [19]. It starts from an initialized population. By
conducting genetic operations on this group, such as stochastic selection, crossover, and
mutation, this method endows the fittest chromosome with the maximum chance to survive. In
this way, after evolution from generation to generation, the population members enter better and
better localities in the search space.

97
Start
End
Read data
Iteration Complete?
Setting GA algorithm
parameters
Initialization chromosome
GA iterative
Mutation
Crossing
Chromosome decoding
Calculation of the objective function
Initialization BP neural network weights and
thresholds
Training Network
Training error
Output
Y
N
Fig.2. Flow chart of GA-BP neural network
The connection weights of all neurons in BP neural network are encoded into individuals
represented by binary strings, and the initial population of the strings is generated randomly.
Then, the conventional optimization computation can be done with the help of the genetic
algorithm. The strings are decoded into weights to constitute a new BP neural network every
generation of computation. By calculating the training samples, the mean square error of neural
network output is obtained for determination of individual fitness. After several generations of
calculation, the BP neural network will evolve to the extent that producing the minimum global
error. BP neural network can be trained by GA, which optimizes weights and thresholds, while
the number of hidden layer, node number and connection mode between the nodes remain
constant. The work flow is shown in Fig. 2.

98
3. KE analysis of tractor shape
The shape design schemes of tractors are screened, analyzed and decomposed to obtain the
design elements. Users’ Kansei is measured and analyzed using adjective describing perception
about product shape. KE is applied to build the relationship between shape design elements and
users’ Kansei evaluation. To do this, we need to first collect the shape design samples and
perform optimization of users’ perception information.
3.1 Collection of tractor shape design samples
Tractors have more complicated shape than other industrial products because its model,
power, working environment and purposes all have an impact on shape [20]. By structure tractors
are divided into walking tractors, wheeled tractors and caterpillar tractors, which have very
different shape design [21]. In this study, we focus on wheeled tractors. The design schemes are
collected from the Internet, books, magazines, periodicals, and photos of outlets and exhibitions.
The brands of tractors collected include John Deere, Dongfanghong, Kubota, Shifeng, Foton,
JCB, Fendt, Valtra, Masseyferguson, Claas, Caterpillar, Caseih and Newholland. The samples of
tractor shape design total 120 and a sample library is built.
First the graphics are processed to eliminate the influence of color and logo. All shape design
schemes display tractors from the same angle. By multi-group analysis, discussion and 3 rounds
of sample screening, 18 shape design samples are finally included and numbered. Fig.3 is the
front view of the tractors.

99
Fig.3. Front views of tractors
3.2 Collection of adjectives
The selected design samples are made into electronic album. The subjects tested include
experts, users and people who are interested in the product, and more 200 adjectives describing
tractor shape are collected by on-line interview. Fifty-five pairs of high-frequency words are
selected with the removal of words having the same or similar meanings. By factor analysis and
clustering analysis, four pairs of adjectives are obtained for subsequent mining for users’
perceptual evaluation [22]. They are light-heavy, compact-complex, smooth-stiff, and linear-
streamlined.
3.3 Decomposition of design elements
Morphological analysis is applied to shape decomposition, first into several independent
items and then into many independent design elements. These variable design elements are the
provenance of product shape redesign and design evaluation [23]. Through several rounds of
discussion with the designers and ordering by significance of design features perceived by the
users, the tractors are divided into three parts: front face, cabin and side face of the trunk. The
front face is further divided into 5 design elements and 22 design categories; cabin is divided into
4 design elements and 17 design categories; side face of the trunk is divided into 5 design

100
elements and 23 design categories. Thus there are a total of 14 design elements, as shown in
Table 1.
Table.1. List of shape design elements
Design area Design element Design category
Front engine hood Arc type
Air-inlet screen X1 Right angle type
Curve type
other type
Lamp X2
Front engine hood X3
Functional area transition X4
Suspension member X5
Cabin Windshield X6
Roof X7 ……
Side frame X8
Rear frame X9
Side bodywork Side contour of the trunk X10
Lateral engine hood X11
Heat exchange area X12
Fender X13
Side shield X14
3.4 Kansei evaluation and design elements
The light-heavy semantic pair is selected for Kansei evaluation. A questionnaire is prepared
based on the electronic album of 18 design samples using Likert scale and semantic differential
[24]. The users are instructed to score the design samples on the 1-5 point scale with an interval
of 1. Point 1 indicates very light, and point 5 indicates very heavy, with point 3 neutral. Thirty
subjects with some professional background, including Industrial Design, Mechanical Design,
Agricultural Mechanical Design and so on, are chosen so as to eliminate potential interference.
The results of Kansei evaluation are shown in Table 2.

101
Table.2. Kansei evaluation values of the samples (light-heavy)
The
sample X1 X2 X3 X4 X5 X6 X7 X8 X9 X10 X11 X12 X13 X14
Kansei
evaluation
value
1 1 2 2 1 1 1 2 1 1 1 1 1 2 2 2.31
2 3 2 1 2 1 1 2 1 1 1 1 1 1 2 2.08
3 4 3 3 2 1 2 2 4 2 3 2 3 2 1 3.38
4 3 3 2 1 2 1 3 2 3 1 3 3 1 1 4.47
5 1 2 2 2 3 1 1 1 2 2 2 1 1 1 2.75
6 1 3 3 2 1 1 2 2 2 3 1 1 1 1 3.53
7 2 3 2 1 2 1 2 2 1 3 2 1 3 1 2.96
8 3 2 3 1 2 3 1 3 1 2 2 1 2 1 3.60
9 2 4 4 3 4 4 3 4 3 5 4 3 4 4 3.78
10 4 1 3 1 1 1 2 2 1 3 2 2 1 3 3.22
11 1 1 1 2 4 1 2 1 2 2 2 1 1 1 3.17
12 2 2 2 1 2 2 1 2 1 2 1 2 1 2 3.01
13 2 4 5 5 4 3 4 5 4 5 4 5 3 5 2.55
14 3 2 1 2 1 1 1 1 3 1 2 1 2 3 3.48
15 2 2 3 3 1 3 1 2 1 1 3 2 1 1 1.97
16 4 3 4 2 3 4 1 2 3 4 3 2 3 1 2.11
17 3 1 3 1 1 3 1 2 1 2 2 2 2 1 3.21
18 4 4 4 5 4 4 4 5 4 3 5 4 4 3 2.84
4. Kansei evaluation model based on GA-BP neural network
It is necessary to build the relationships between users’ Kansei and design elements if the
design is consumer-oriented. But the problem is made difficult by individual variation in users’
perceptual demand. To fit the non-linear relationship between the two, we use GA-BP neural
network.
4.1 Structuring of Kansei evaluation model based on BP neural network
Before the BP-based model is built up, it is a necessity to determine the types of parameters
in the input layer and the output layer, and the number of modes in all the layers as well. For this
research, the design factors of tractor shape are used as the input vector, being represented by
x=(x1,…xm)T. The emotional evaluation result for tractor shape design is the output vector that
is denoted by y. Wi is the weight coefficient. The relationship between input vector and output
vector is:
m
i
ii xwfy1
)( (1)

102
Where θ is a threshold, and f(X) is an excitation function which can be either linear or
nonlinear.
Assuming that there are P training samples, which are equal to P input-output pairs. (Ip, Tp) =
1, ..., P, Where the input vector is:
T
pmpp iiI ),...,( 1 (2)
The targeted output vector is:
T
pnpp ttT ),...,( 1 (3)
The actual output vector is:
T
pnpp ooO ),...,( 1 (4)
Wij represents the weight from the jth input vector component (j=1,…,m) to the ith output
vector component (i=1,…,n). In general, there is an error between the ideal output value and
actual output value. The meaning of neural network learning is to minimize error sum of squares
through a constant comparison between the pair of output values as well as wij modification
according to the minimum principle.
n
i
pipi ot1
2)(min (5)
4.2 Structuring of Kansei evaluation model based on GA-BP neural network
The steps to establish a GA-BP neural network compound model that is correlated with the
said BP-based model are:
(1) Preprocess the design form data and emotional evaluation data of tractor shape design,
and normalize the initial data in a way that the data interval is within [0, 1]. The normalization
formula is:
mixxxxx ii ,...,2,1),/()( minmaxmin (6)
103
Where xi denotes either input data or output data, xmin represents the minimum value in the
data interval, and xmax is the maximum value in the data interval.
(2) Initial weight optimization
Below is the steps to optimize learning process by the genetic algorithm:
Initialize parameters of population P, including the crossover scale, the crossover
probability Pc, and the mutation probability Pm.
Compute the error function of the neural network, and determine the function value of its
fitness. The larger the error is, the smaller the fitness value is.
Some individuals with large fitness values are directly passed to the next generation, and
the rest are passed according to the corresponding probability determined according to fitness
values.
④Process the present population with genetic operations such as mutation and crossover, and
the next generation of population is produced accordingly.
⑤Repeat - until the satisfying solution occurs.
(3) Establishment of a modified GA-BP neural network compound model
After n times of iterative GA optimization, the globally optimized network weight and
threshold are obtained to replace the initial counterparts in all BP neural network layers. Then,
the sample data undergo normalized processing, with the shape design factors as the input layer
and the emotional user evaluation as the output layer. Finally, the modified GA-BP neural
network compound model is established, mapping sensual user data to shape design factors.
(4) Data processing in the model
The normalized sample data are inputted to the modified BP-based model, and the predicted
result data are outputted. Then, with anti-normalization, the predicted value is compared with the
actual value for error computation.
(5) Evaluation on the network model
After the sample data undergo learning, training and prediction with the use of BP and GA-
BP neural network, the relative error rate, namely the ratio of the actual value to the prediction
value, is analyzed. Finally, the performance of the system model is summarized and evaluated.
5 Training of BP neural network by GA
The light-heavy semantic pair is chosen. In the optimized BP neural network, 14 design
elements constitute the input layer (input node number 14) and Kansei evaluation values

104
constitute the output layer (output node number 1); the hidden layer has 8 nodes. From 18
samples, 13 samples are selected as the training samples, and the remaining as the testing
samples. The learning rate is set as 0.05, network learning precision 0.00001, and 1000 times
trainings. The number of populations and number of generations are constantly varied in GA,
with mutation probability of 0.05 and probability of crossover 0.7. The final number of
populations is 50 and the number of generations is 300. Fig. 4 shows the convergence curve.
Fig.4. Convergence curve
As shown in Fig.5, the randomly simulated values of Kansei evaluation using 13 out of 18
training samples are basically consistent with the measured values of Kansei evaluation. This
indicates high prediction precision using the training samples. According to Figure 6, the
prediction trend of the test sample resembles the actual trend.
By contrast, for both the training sample and the test sample in the BP-based model, the
prediction values fit the actual values poorly, as shown in Fig. 7-8.

105
Fig.5. Comparison of predicted and measured values of Kansei evaluation based on GA-BP
neural network from the training samples
Fig.6. Comparison of predicted and measured values of Kansei evaluation based on GA-BP
neural network from the testing samples
Fig.7. Comparison of predicted and measured values of Kansei evaluation based on BP neural
network from the training samples
106
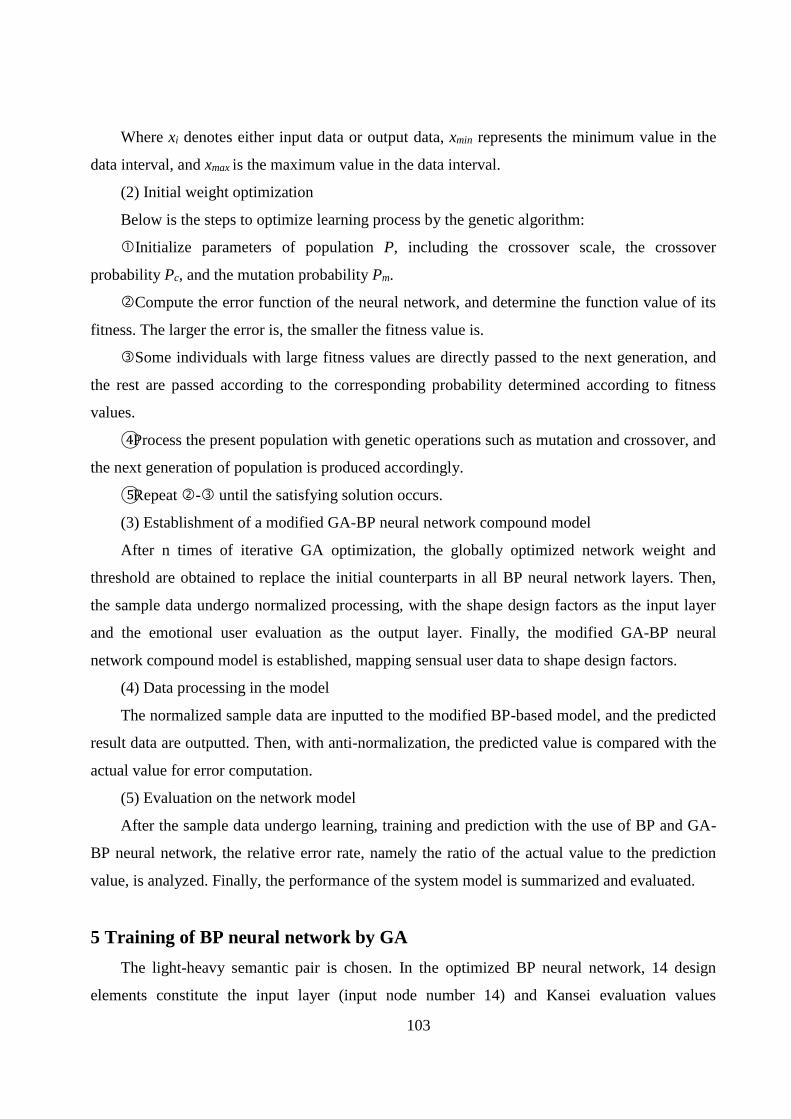
Fig.8. Comparison of predicted and measured values of Kansei evaluation based on BP neural
network from the testing samples
To test for generality, the prediction performance is evaluated using 5 testing samples. The
comparison between the predicted and measured values of Kansei evaluation is shown in Table 3.
Relative errors of sample 1-5 are 0.3966%, 2.4101%, 2.6284%, 2.1464% and 0.4372%,
respectively, all of which are below 3%. Moreover, a good agreement is achieved with the
subjective evaluation surveyed.
However, in the BP-based model, the relative error rates for the same test samples are
43.1785%、13.4841%、33.5304%、28.8287%、90.4459%, respectively, all of which exceed
10%. This phenomenon shows that the relative error rate of the BP-based model is high.
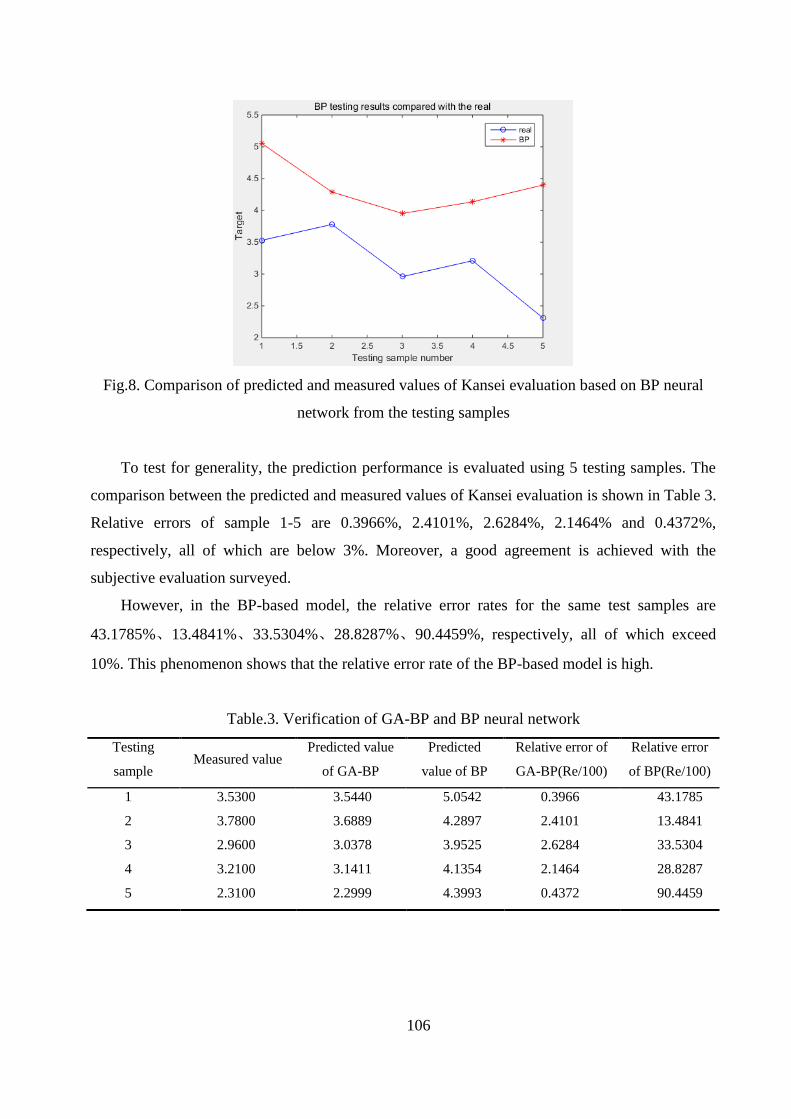
Table.3. Verification of GA-BP and BP neural network
Testing
sample Measured value
Predicted value
of GA-BP
Predicted
value of BP
Relative error of
GA-BP(Re/100)
Relative error
of BP(Re/100)
1 3.5300 3.5440 5.0542 0.3966 43.1785
2 3.7800 3.6889 4.2897 2.4101 13.4841
3 2.9600 3.0378 3.9525 2.6284 33.5304
4 3.2100 3.1411 4.1354 2.1464 28.8287
5 2.3100 2.2999 4.3993 0.4372 90.4459

107
6 Discussion
In order to study on the sensual evaluation characteristics of product form, quantitative
research is conducted during the collection of fuzzy sensual evaluation data. With a transition
from the simple quantitative methods, linear methods, and numerical statistical methods to
nonlinear approaches, the relationship between emotional factors and shape elements has been
modelled, albeit at an exploratory stage. The intelligent algorithm is the main solution to
nonlinear problems. Single algorithm has already been used for quantitative research into sensual
evaluation. For the research herein, the relative error rate of the BP-based model is high, while
the relative error rate of the GM-modified BP-based model is low, and as such the test result and
the simulation result for the latter model is favorable. This achievement shows that the classical
GA-BP neural network compound algorithm can mitigate the shortages of single algorithm.
Despite some achievements, the research in the paper still has several deficiencies of sensual
evaluation quantification for follow-up in-depth research, such as:
(1) How we deal with the fitness of sensual evaluation model for a new product type?
(2) For various kinds of compound algorithms, what is the difference among their
requirements on research objective data?
(3) For a fixed research objective, what is the impact of different compound algorithms on
data processing and model establishment during the construction of a sensual evaluation model?
7 Conclusion
We apply KE to capture the non-linear relationship between shape design elements of
tractors and users’ Kansei evaluation with the building of GA-BP neural network. Tractor shape
is decomposed into design elements by morphological analysis, and users’ Kansei evaluation is
extracted by semantic differential. The GA-BP neural network takes the design elements as the
input layer and the Kansei evaluation as the output layer, and the network is trained using 13 out
of 18 samples. The remaining 5 samples are used for testing. The results show that the relative
errors between the predicted and measured values of Kansei evaluation are 0.3966%, 2.4101%,
2.6284%, 2.1464% and 0.4372%, respectively, all of which are below 3%. However, for both the
training sample and the test sample in the BP-based model, the prediction values fit the actual
values poorly, and all the relative error rates for the test samples exceed 10%. Therefore, the
usage of Modified GA-BP neural network model to establish a sensual evaluation model
complies with reality better. Moreover, the prediction results agree well with the subjective
evaluation surveyed. The model can be applied to acquire users’ Kansei about tractor shape

108
design and achieve efficient Kansei evaluation. This provides valuable reference for product
redesign.
References
1. Lianyin Zhai, Lipheng Khoo, Zhaowei Zhong, A dominance-based rough set approach to
Kansei Engineering in product development, 2009, Expert System with Applications, vol. 36,
no.1, pp.393-402.
2. Hungyuan Chen, Yuming Chang, Extraction of product form features critical to determining
consumers’ perceptions of product image using a numerical definition-based systematic
approach, 2009, International Journal of Industrial Ergonomics, vol. 39, no.1, pp.133–145.
3. Ogawa Taisuke, Nagai, Yukari, Ikeda, Mitsuru, An ontological approach to designers’ idea
explanation style: Towards supporting the sharing of Kansei-ideas in textile design, 2009,
Advanced Engineering Informatics, vol. 23, no.2, pp.157-164.
4. Weifeng Hu, Jianghong Zhao, Danhua Zhao, Study on Styling Image of Vehicle Based on
Form Feature Lines, 2009, China Mechanical Engineering, vol. 20, no.4, pp. 496-500.
5. Zixia Mao, Academic Analysis of Applying Kansei Engineering to Product Design, 2007,
Nanjing University, Nanjing, China.
6. Chitoshi Tanoue, Kenji Ishizaka, Mitsuo Nagamachi, Kansei Engineering: A study on
perception of vehicle interior image, 1997, International Journal of Industrial Ergonomics,
vol. 19, no.2, pp. 115-128.
7. Yongfeng Li, Research on product image form design based on quantification theory type I,
2010, Journal of Machine Design,vol. 27, no.1, pp.40-43.
8. Ying Wang, Yan Chen, Relationship between Perception and Designing Elements of
Woman’s Overcoats, 2007, Journal of Textile Research, vol. 28, no.11, pp.97-100.
9. Junsheng Kuang, Pingyu Jiang, Product Configuration Design with Customization Mode
Based on Kansei Engineering, 2007, Journal of Computer-Aided Design & Computer
Graphics, vol. 19, no.2, 178-183.
10. Zhenghong Liu, Weijie Pan, Jian Lv, Li Lin, Multi-dimensional KE Model Construction
Based on Multiple Linear Regression, 2015, Modular Machine Tool& Automatic
Manufacturing Technique, no.12, pp.15-18.
11. Meiyu Zhou, Qian Li, Application of Neural Network in Kansei Design, 2011, Journal of
Dong Hua University (Natural Science), vol. 37, no.4, pp.509-513.

109
12. Yan Zhou, Ping Yang, Siyu Wang, Research Of Kansei Image Based On Product Appearance
Form Deconstruction, 2014, Advanced Materials Research, vol. 971-973, pp.1316-1320.
13. Mengdar Shie, Yuen Yeh, Developing a design support system for the exterior form of
running shoes using partial least squares and neural networks, 2013, Computers & Industrial
Engineering, vol. 65, no.4, pp.704-718.
14. Lijing Wang, Qiyan Cao, Xingzhi Mo, Jinhai Yu, Baofeng Li, Study of Users’ Kansei on
Commercial Aircraft Cockpit Interior Design, 2014, Journal of Mechanical Engineering, vol.
50, no.22, pp.122-126.
15. Lei Han, Rui Li, Huili Zhu, Comprehensive Evaluation Model of Soil Nutrient Based on BP
Neural Network, 2011, Transactions of The Chinese Society of Agricultural Machinery, vol.
42, no.7, pp. 109-115.
16. Changzheng He, Li Xiaofeng, Yu Hai, The new improvement of BP neural network and its
application, 2002, Mathematics in Practice and Theory, vol. 32, no.4, pp. 554-561.
17. Xue Liu, Yamei Li, Jiao Liu, Mengmeng Zhong, Yu Chen, Xingmin Li, BP Neural Network
Based Prediction Model for Fresh Egg’s Shelf Life, 2015, Transactions of the Chinese
Society for Agricultural Machinery, vol. 46, no.10, pp. 328-334.
18. Hongjiang Lin, Buxiang Zhou, Yi Ran, Changjie Zhan, Changyu Yang, Research on the
Maximum Power Point Tracking of the Photovoltaic System Based on the Genetic
Optimization BP Neural Network Algorithm, Electrical Measurement & Instrumentation,
vol.52, no.5, pp.35-40.
19. Wenjun Mao, Mining Subsidence Prediction Method Based on Genetic BP Neural Network
Model, Metal Mine, 2016, no.2, pp.164-167.
20. Wenlong Wang, The Traetor Morphology, 1981, Science Press, Beijing, China.
21. Yuhong Zhang, The Study on The Traetor Shape Design, 2009, Jiangnan University,
Jiangnan, China.
22. Song Wu, Faming Pan, SPSS Statistical Analysis, 2014, Tsinghua University Press, Beijing,
China.
23. Yingqi Zhuang, Construction of Product Shape Based the Multiple Kansei Image, 2002,
National Cheng Kung University, Tainan, China.
24. Charles Egerton Osgood, The measurement of meaning, 1957, University of IIIinois Press,
Urbana, America.