Kansas City Metro Area Economic-Demographic Overview
12
Kansas City Metropolitan Area Economic-Demographic Overview April 2013
-
Upload
jeffpinkerton -
Category
Business
-
view
735 -
download
1
description
A general overview of the demographic trends and economy of the Kansas City Metropolitan Area.
Transcript of Kansas City Metro Area Economic-Demographic Overview
Kansas City Metropolitan Area Economic-Demographic Overview April 2013

ABOUT THE DATA
METRO INS IGHT
The data for this report comes from a variety of publically available sources such as the Census Bureau and Bureau of Labor Sta:s:cs. This report is intended to give a brief overview of the general demographics and economy of the Kansas City Metropolitan Area as defined in 2012.
Most of the data is updated at least annually. Some of the employment data sources do update on a monthly basis, but to avoid seasonal fluctua:ons, the data used here is the most current annual data.
CaldwellClinton
PlatteRay
Clay
Leavenworth
LafayetteJackson
Wyandotte
Johnson
Cass
MiamiFranklin
BatesLinn
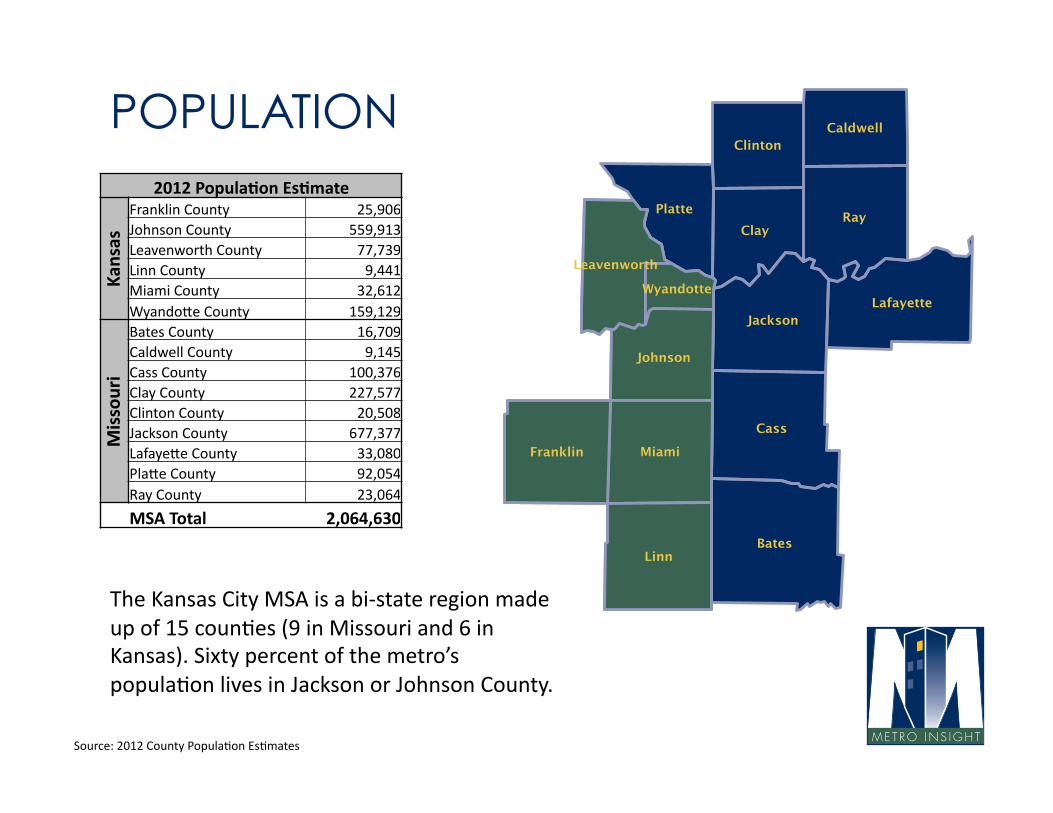
POPULATION
METRO INS IGHT
2012 Popula+on Es+mate
Kansas
Franklin County 25,906 Johnson County 559,913 Leavenworth County 77,739 Linn County 9,441 Miami County 32,612 WyandoQe County 159,129
Missouri
Bates County 16,709 Caldwell County 9,145 Cass County 100,376 Clay County 227,577 Clinton County 20,508 Jackson County 677,377 LafayeQe County 33,080 PlaQe County 92,054 Ray County 23,064
MSA Total 2,064,630
The Kansas City MSA is a bi-‐state region made up of 15 coun:es (9 in Missouri and 6 in Kansas). Sixty percent of the metro’s popula:on lives in Jackson or Johnson County.
Source: 2012 County Popula:on Es:mates

METRO INS IGHT
POPULATION The 2012 popula:on es:mate for the Kansas City MSA is 2,064,000 making it the 30th largest metro in the country.
Kansas City has experienced steady popula:on growth over that past 50 years. With the excep:on of the 1970’s the overall pace of growth has generally been on par with the na:onal growth rate.
0.00%
0.20%
0.40%
0.60%
0.80%
1.00%
1.20%
1.40%
1960's 1970's 1980's 1990's 2000's 2010-‐12
Average Annual Popula+on Change
Kansas City MSA
U.S.
-‐
500,000
1,000,000
1,500,000
2,000,000
2,500,000
1960
1970
1980
1990
2000
2010
Total Popula+on
Source: U.S. Census Bureau, 2012 County Popula:on Es:mates
METRO INS IGHT
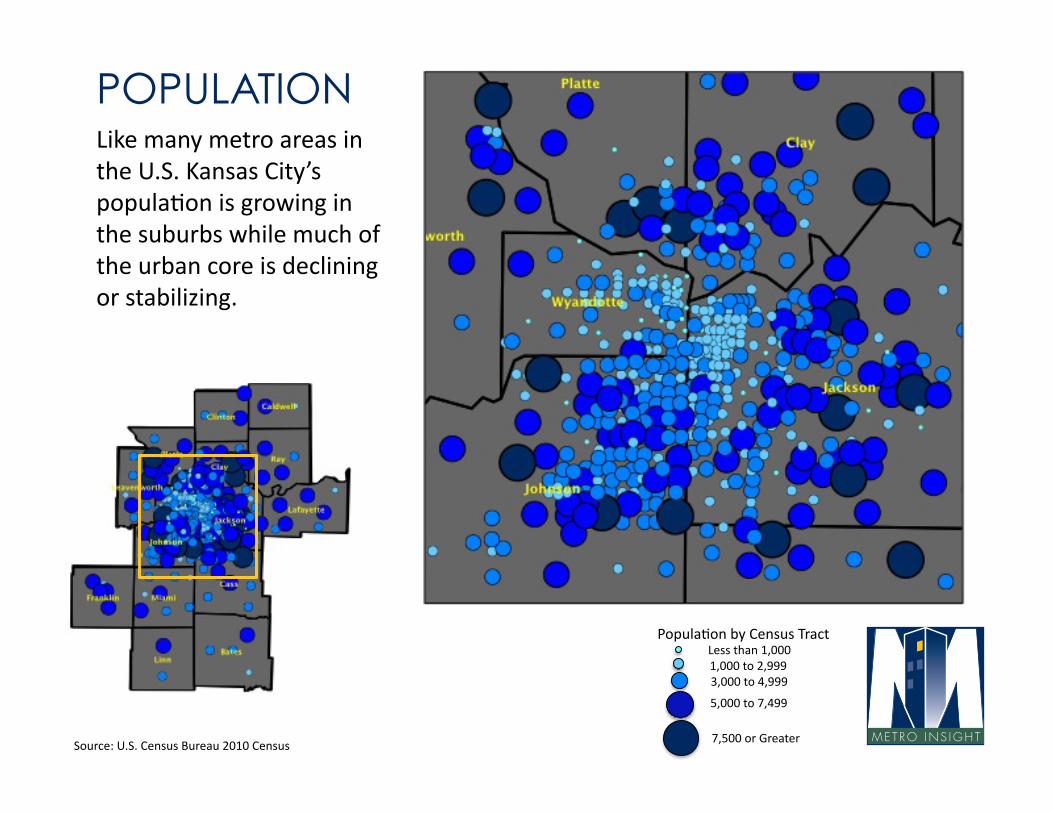
POPULATION Like many metro areas in the U.S. Kansas City’s popula:on is growing in the suburbs while much of the urban core is declining or stabilizing.
Less than 1,000 1,000 to 2,999 3,000 to 4,999
5,000 to 7,499
7,500 or Greater
Popula:on by Census Tract
Source: U.S. Census Bureau 2010 Census
METRO INS IGHT
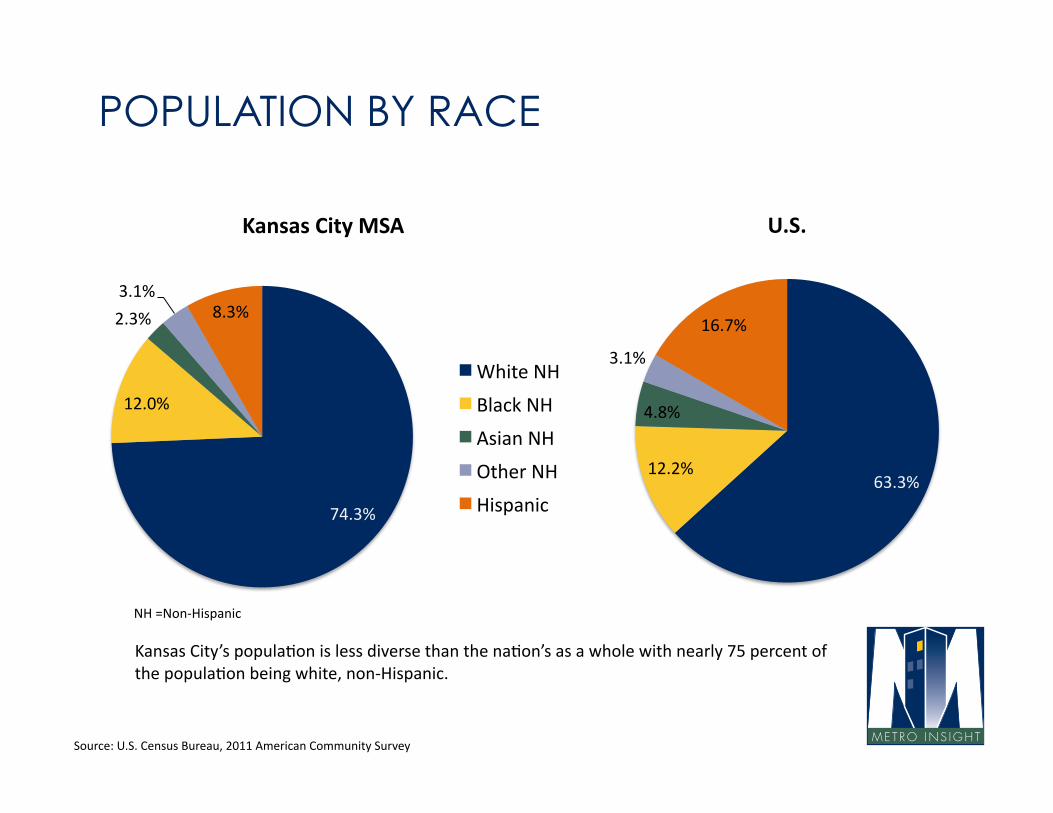
POPULATION BY RACE
Kansas City’s popula:on is less diverse than the na:on’s as a whole with nearly 75 percent of the popula:on being white, non-‐Hispanic.
74.3%
12.0%
2.3%
3.1% 8.3%
Kansas City MSA
White NH
Black NH
Asian NH
Other NH
Hispanic 63.3%
12.2%
4.8%
3.1%
16.7%
U.S.
NH =Non-‐Hispanic
Source: U.S. Census Bureau, 2011 American Community Survey
METRO INS IGHT
PlatteRay
Clay
Leavenworth
Lafayette
Jackson
Wyandotte
Johnson
Cass
MiamiFranklin
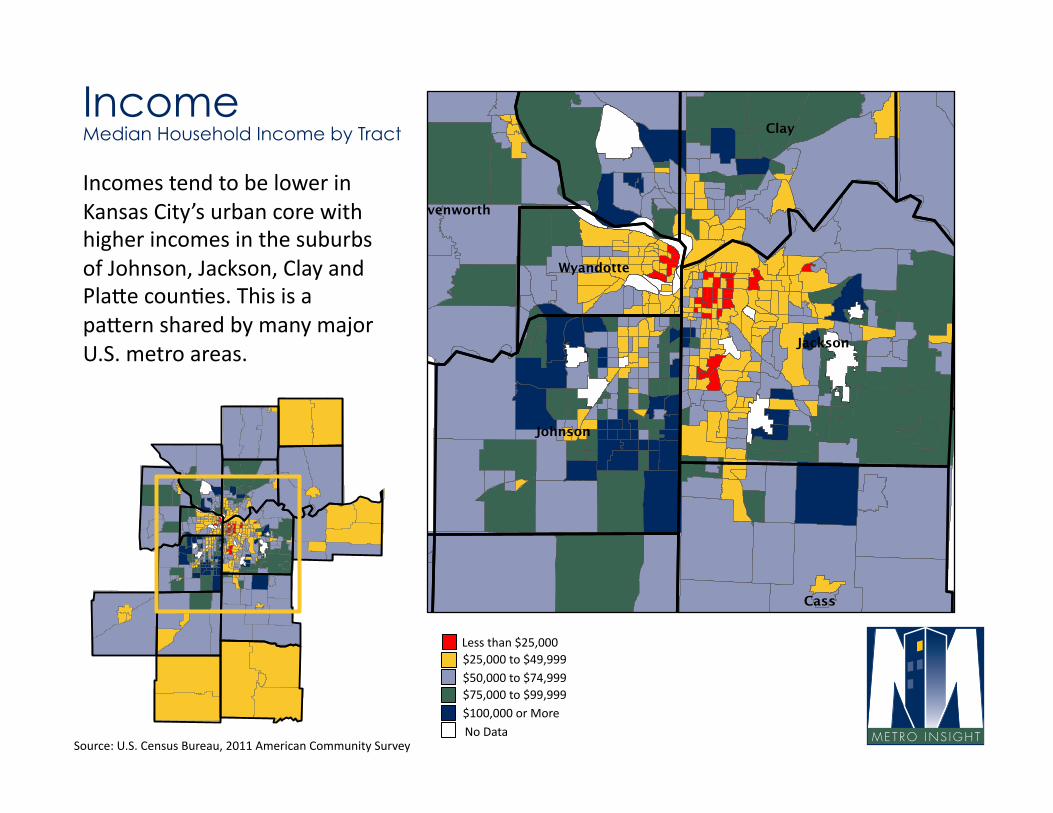
Income Median Household Income by Tract
No Data $100,000 or More $75,000 to $99,999 $50,000 to $74,999 $25,000 to $49,999 Less than $25,000
Incomes tend to be lower in Kansas City’s urban core with higher incomes in the suburbs of Johnson, Jackson, Clay and PlaQe coun:es. This is a paQern shared by many major U.S. metro areas.
Source: U.S. Census Bureau, 2011 American Community Survey
METRO INS IGHT
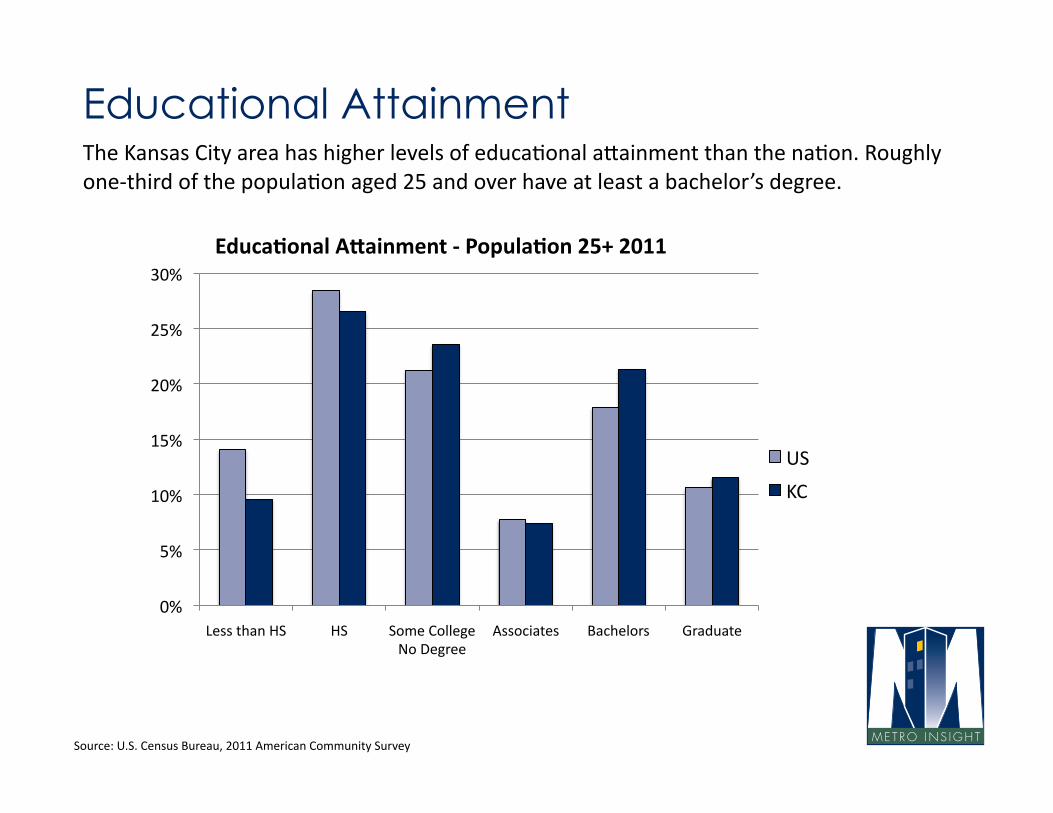
Educational Attainment The Kansas City area has higher levels of educa:onal aQainment than the na:on. Roughly one-‐third of the popula:on aged 25 and over have at least a bachelor’s degree.
0%
5%
10%
15%
20%
25%
30%
Less than HS HS Some College No Degree
Associates Bachelors Graduate
Educa+onal AFainment -‐ Popula+on 25+ 2011
US
KC
Source: U.S. Census Bureau, 2011 American Community Survey

METRO INS IGHT
ECONOMY
Loca:on quo:ents measure the level of specializa:on a region has in a given industry. A loca:on quo:ent over 1 indicates that the region specializes in this industry rela:ve to the country and likely exports this good or service. A loca:on quo:ent less than 1 indicates the region does not specialize in that industry rela:ve to the country.
Kansas City has significantly high loca:on quo:ents in Informa:on (telecommunica:ons, publishing) federal government, financial services and professional-‐scien:fic-‐technical services.
0.42
0.68
0.80
0.81
0.93
0.95
0.96
1.01
1.05
1.09
1.12
1.19
1.21
1.25
1.28
1.29
1.49
0 0.2 0.4 0.6 0.8 1 1.2 1.4 1.6
State Govt. Ed Svcs
Mining-‐Logging-‐Constr Manufacturing
Ed. And Hlth Svcs. Retail Trade
Leisure and Hosp. Local Govt.
Mgmt. of Companies Other Svcs.
Admin. Support and Waste Mgmt.
Wholesale Trade Transporta:on & U:li:es
Prof. Sci. Tech. Financial
Fed. Govt. Informa:on
Kansas City MSA -‐ Loca+on Quo+ent Location Quotient
Source: Bureau of Labor Sta:s:cs, Current Employment Sta:s:cs 2012 Annual Data
METRO INS IGHT
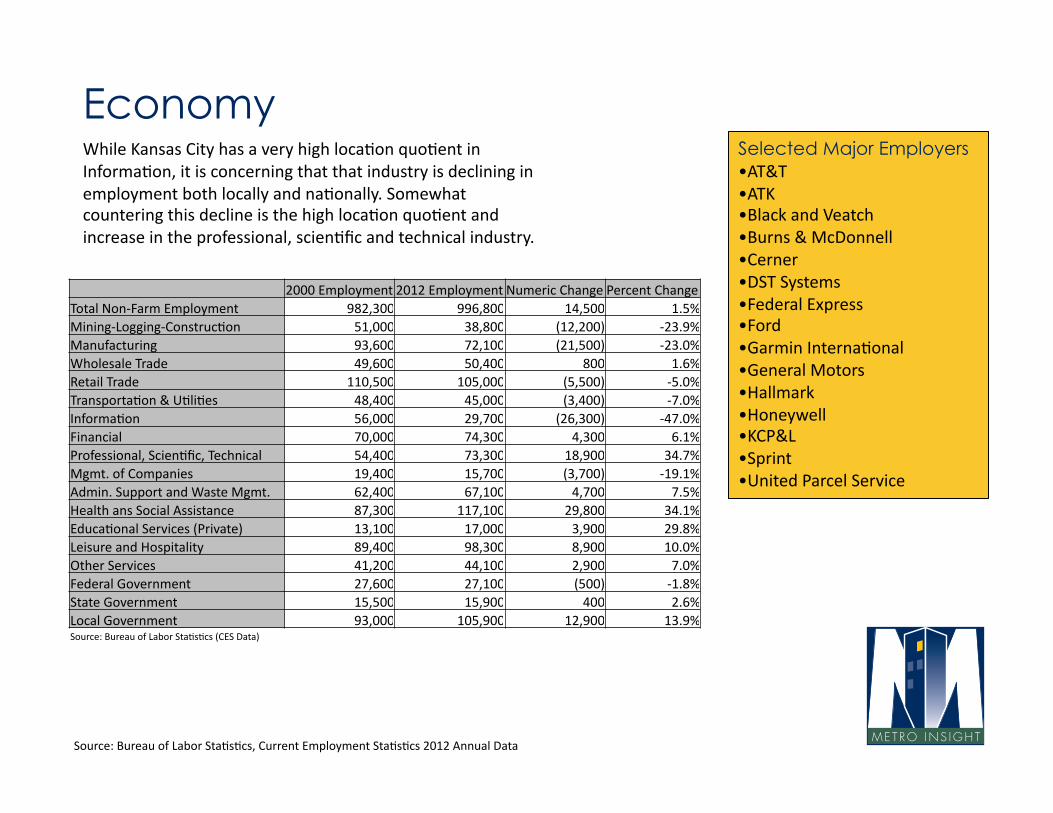
Economy While Kansas City has a very high loca:on quo:ent in Informa:on, it is concerning that that industry is declining in employment both locally and na:onally. Somewhat countering this decline is the high loca:on quo:ent and increase in the professional, scien:fic and technical industry.
2000 Employment 2012 Employment Numeric Change Percent Change Total Non-‐Farm Employment 982,300 996,800 14,500 1.5% Mining-‐Logging-‐Construc:on 51,000 38,800 (12,200) -‐23.9% Manufacturing 93,600 72,100 (21,500) -‐23.0% Wholesale Trade 49,600 50,400 800 1.6% Retail Trade 110,500 105,000 (5,500) -‐5.0% Transporta:on & U:li:es 48,400 45,000 (3,400) -‐7.0% Informa:on 56,000 29,700 (26,300) -‐47.0% Financial 70,000 74,300 4,300 6.1% Professional, Scien:fic, Technical 54,400 73,300 18,900 34.7% Mgmt. of Companies 19,400 15,700 (3,700) -‐19.1% Admin. Support and Waste Mgmt. 62,400 67,100 4,700 7.5% Health ans Social Assistance 87,300 117,100 29,800 34.1% Educa:onal Services (Private) 13,100 17,000 3,900 29.8% Leisure and Hospitality 89,400 98,300 8,900 10.0% Other Services 41,200 44,100 2,900 7.0% Federal Government 27,600 27,100 (500) -‐1.8% State Government 15,500 15,900 400 2.6% Local Government 93,000 105,900 12,900 13.9% Source: Bureau of Labor Sta:s:cs (CES Data)
Selected Major Employers •AT&T •ATK •Black and Veatch •Burns & McDonnell •Cerner •DST Systems •Federal Express •Ford •Garmin Interna:onal •General Motors •Hallmark •Honeywell •KCP&L •Sprint •United Parcel Service
Source: Bureau of Labor Sta:s:cs, Current Employment Sta:s:cs 2012 Annual Data
METRO INS IGHT
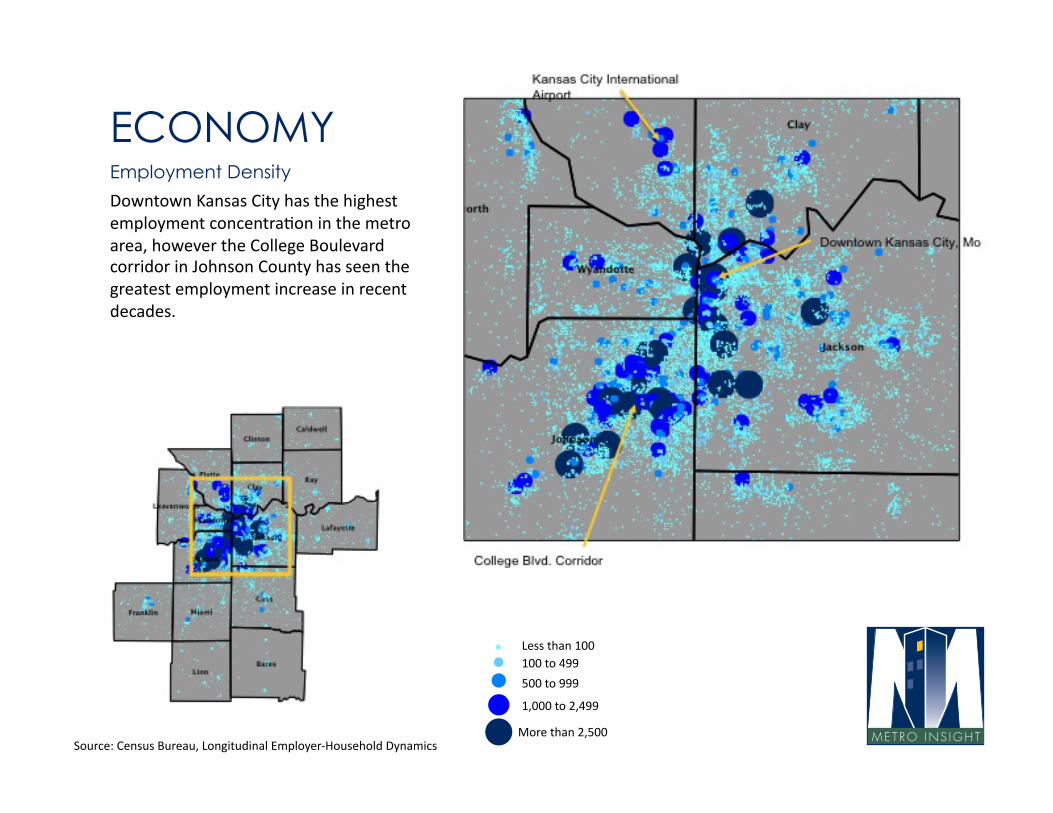
ECONOMY Employment Density
Less than 100 100 to 499
500 to 999
1,000 to 2,499
More than 2,500
Downtown Kansas City has the highest employment concentra:on in the metro area, however the College Boulevard corridor in Johnson County has seen the greatest employment increase in recent decades.
Source: Census Bureau, Longitudinal Employer-‐Household Dynamics

NEED MORE? There is a lot more data out there.
METRO INS IGHT
Follow our blog. www.metroinsight.com Follow us on TwiQer: @metroinsight1 Google+: Facebook: E-‐mail: [email protected]