KANPUR 16. FINANCIAL STATUS OF URBAN LOCAL BODIES …kmc.up.nic.in/PDF_Files/chapter 16 Financial...
21
KANPUR 16-150 Final Report: Kanpur City Development Plan Under JNNURM 16. FINANCIAL STATUS OF URBAN LOCAL BODIES (ULBs) IN KANPUR 16.1 INTRODUCTION In the development and smooth functioning of any city, there is, generally, more than one player, which plays the important role in the provision of efficient service delivery. The first and most important aspect is the identification of these major bodies of the urban centre. The second step is to make an evaluation and analysis of financial position of these agencies. This would help in assessing the sustainability in the development of the city. In the case of Kanpur city, there are three important bodies who responsible for the overall development and smooth running of the city. These are: 1. Kanpur Nagar Nigam (KNN); 2. Kanpur Jal Sansthan (KJS); and 3. Kanpur Development Authority (KDA) The KNN and KJS and mainly responsible for the provision of basic services to the city dwellers whereas the responsibility of KDA helping in the development of the city. In the era of decentralization, community participation has also assumed important role. However, here, we are focusing on the major responsibilities and financial status of these bodies above-mentioned bodies. 16.2 KANPUR NAGAR NIGAM Under the provision of Uttar Pradesh Nagar Nigam Adhiniyam, (UP Municipal Corporations Law) the Municipal Corporations are responsible for the provision of basic needs and maintenance core services in the city. To meet the requirement for the provision of these services, these bodies are empowered to levy certain municipal taxes and fees. Similarly, the KNN is responsible for upkeep and maintenance of basic minimum civic services the city. It provides the basic municipal services to the city dwellers residing in the municipal limit. The KNN meets it financial requirements by generating the resources through taxation, rental income from the municipal properties (own income) and the transfers from the centre and the state (which are constitutional obligations of these higher level of governments). The KNN is mainly responsible for the provision of basic services and not for the developmental activities (barring a few) in the city. The important services provided by the KNN includes: provision (maintenance) of good roads in the city, maintenance of streetlights, drainage and sewers, solid waste management, parks, gardens and the play grounds, basic educational and medical needs, provision of markets, cremation grounds, slaughter houses, and controlling the advertisement agencies.
Transcript of KANPUR 16. FINANCIAL STATUS OF URBAN LOCAL BODIES …kmc.up.nic.in/PDF_Files/chapter 16 Financial...
KANPUR
16-150Final Report: Kanpur City Development Plan Under JNNURM
16. FINANCIAL STATUS OF URBAN LOCAL BODIES (ULBs)IN KANPUR
16.1 INTRODUCTIONIn the development and smooth functioning of any city, there is, generally,more than one player, which plays the important role in the provision ofefficient service delivery. The first and most important aspect is theidentification of these major bodies of the urban centre. The second step is tomake an evaluation and analysis of financial position of these agencies. Thiswould help in assessing the sustainability in the development of the city.
In the case of Kanpur city, there are three important bodies who responsible forthe overall development and smooth running of the city. These are:
1. Kanpur Nagar Nigam (KNN);2. Kanpur Jal Sansthan (KJS); and 3. Kanpur Development Authority (KDA)
The KNN and KJS and mainly responsible for the provision of basic services tothe city dwellers whereas the responsibility of KDA helping in the developmentof the city. In the era of decentralization, community participation has alsoassumed important role. However, here, we are focusing on the majorresponsibilities and financial status of these bodies above-mentioned bodies.
16.2 KANPUR NAGAR NIGAMUnder the provision of Uttar Pradesh Nagar Nigam Adhiniyam, (UPMunicipal Corporations Law) the Municipal Corporations are responsible forthe provision of basic needs and maintenance core services in the city. To meetthe requirement for the provision of these services, these bodies areempowered to levy certain municipal taxes and fees. Similarly, the KNN isresponsible for upkeep and maintenance of basic minimum civic services thecity. It provides the basic municipal services to the city dwellers residing in themunicipal limit. The KNN meets it financial requirements by generating theresources through taxation, rental income from the municipal properties (ownincome) and the transfers from the centre and the state (which areconstitutional obligations of these higher level of governments).
The KNN is mainly responsible for the provision of basic services and not forthe developmental activities (barring a few) in the city. The important servicesprovided by the KNN includes: provision (maintenance) of good roads in thecity, maintenance of streetlights, drainage and sewers, solid waste management,parks, gardens and the play grounds, basic educational and medical needs,provision of markets, cremation grounds, slaughter houses, and controlling theadvertisement agencies.
KANPUR
16-151Final Report: Kanpur City Development Plan Under JNNURM
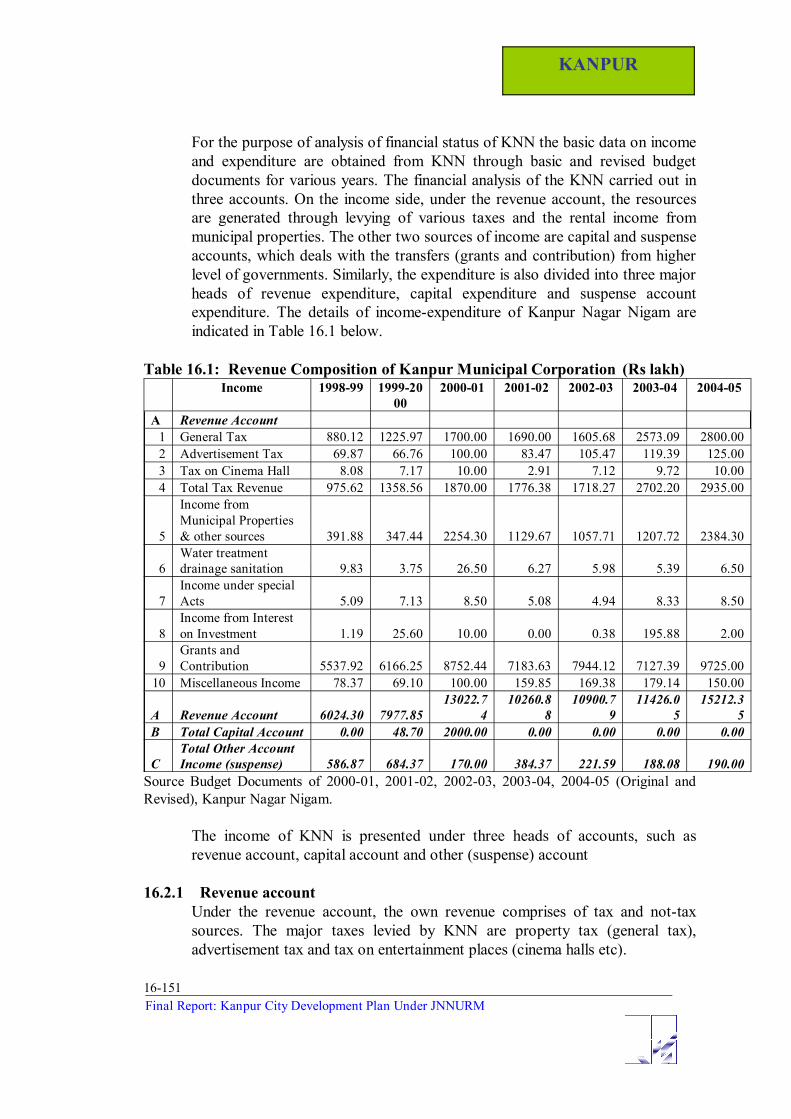
For the purpose of analysis of financial status of KNN the basic data on incomeand expenditure are obtained from KNN through basic and revised budgetdocuments for various years. The financial analysis of the KNN carried out inthree accounts. On the income side, under the revenue account, the resourcesare generated through levying of various taxes and the rental income frommunicipal properties. The other two sources of income are capital and suspenseaccounts, which deals with the transfers (grants and contribution) from higherlevel of governments. Similarly, the expenditure is also divided into three majorheads of revenue expenditure, capital expenditure and suspense accountexpenditure. The details of income-expenditure of Kanpur Nagar Nigam areindicated in Table 16.1 below.
Table 16.1: Revenue Composition of Kanpur Municipal Corporation (Rs lakh)Income 1998-99 1999-20
002000-01 2001-02 2002-03 2003-04 2004-05
A Revenue Account1 General Tax 880.12 1225.97 1700.00 1690.00 1605.68 2573.09 2800.002 Advertisement Tax 69.87 66.76 100.00 83.47 105.47 119.39 125.003 Tax on Cinema Hall 8.08 7.17 10.00 2.91 7.12 9.72 10.004 Total Tax Revenue 975.62 1358.56 1870.00 1776.38 1718.27 2702.20 2935.00
5
Income fromMunicipal Properties& other sources 391.88 347.44 2254.30 1129.67 1057.71 1207.72 2384.30
6Water treatmentdrainage sanitation 9.83 3.75 26.50 6.27 5.98 5.39 6.50
7Income under specialActs 5.09 7.13 8.50 5.08 4.94 8.33 8.50
8Income from Intereston Investment 1.19 25.60 10.00 0.00 0.38 195.88 2.00
9Grants andContribution 5537.92 6166.25 8752.44 7183.63 7944.12 7127.39 9725.00
10 Miscellaneous Income 78.37 69.10 100.00 159.85 169.38 179.14 150.00
A Revenue Account 6024.30 7977.8513022.7
410260.8
810900.7
911426.0
515212.3
5B Total Capital Account 0.00 48.70 2000.00 0.00 0.00 0.00 0.00
CTotal Other AccountIncome (suspense) 586.87 684.37 170.00 384.37 221.59 188.08 190.00
Source Budget Documents of 2000-01, 2001-02, 2002-03, 2003-04, 2004-05 (Original andRevised), Kanpur Nagar Nigam.
The income of KNN is presented under three heads of accounts, such asrevenue account, capital account and other (suspense) account
16.2.1 Revenue accountUnder the revenue account, the own revenue comprises of tax and not-taxsources. The major taxes levied by KNN are property tax (general tax),advertisement tax and tax on entertainment places (cinema halls etc).

KANPUR
16-152Final Report: Kanpur City Development Plan Under JNNURM
16.2.1.1 Tax RevenueThe share of tax revenue in total income increased from 16% to 24% for theyears from 1998-99 to 2003-04. However, the share has declined in 2004-05to 19%. In absolute term, the tax income has gone up from Rs 98 million toRs 294 million.
Property TaxAmongst the important taxes, the major share comes from property tax. Itcontributes more than 95% in the total tax revenue. The share of property taxin total income of KNN was 15% in 1998-99 which has gone up to 23% by2003-04, but declined to 18% in 2004-05. In absolute term, the revenuefrom property tax has increased from Rs 88 million to Rs 280 million. Withthe reforms package, such as shifting of assessment method from AnnualRatable Value (ARV) to Unit Area Method, reviewing of properties underexemption, Rent Controlled Properties, survey of all properties in the city,computerization of data base in various zones, as carried out by the KNN, therevenue from this source is expected to increase in future.
Other TaxesThe share of other taxes (advertisement tax and entertainment tax) was lessthan 10%. The contribution of tax on advertisement has declined from 7% to4% during the period from 1998-99 to 2004-05. In rupee term the revenuefrom this source has increased from Rs 6 million to Rs 13 million. The tax onentertainment places (cinema halls) has increased marginally from less thanone million to one million from 1998-99 to 2004-05.
16.2.1.2 Non- Tax RevenueThe non-tax revenue comprises of rental income from municipal properties,rent from Nazul land, interest and miscellaneous receipts. Amongst them,most important source is rental income from municipal properties. Thecontribution from this source in the non-tax revenue accounts for more than96%. Its share in the total income was 7% in 1998-99, which has reached to16% in 2004-05. The earnings from this source were Rs 39 million, whichincreased to Rs 238 million during 1998-99 to 2004-05. Assuming that thegrowth in population would lead to increase in demand for houses,considering such demand of real estate in view, the non-tax income expectedto grow more in the coming years.
16.2.1.3 Transfers (Grants and Contributions)In the post decentralization reform period and introduction of 74thAmendment, the transfers from the higher level of governments, both centreand state, has increased substantially. However, in the case of KNN, thetransfers under the head of grants and contribution, accounted for 92%, butdeclined to 64% during 1998-99 to 2004-05. The amount transferred under

KANPUR
16-153Final Report: Kanpur City Development Plan Under JNNURM
this head was Rs 554 million, which further increased to Rs 973 million forthe same period.
The total income under the revenue account was Rs 602 million in 1998-99,which have gone up to Rs 1521million in 2004-05. On the basis ofassumption that the KNN would introduce the reforms in property tax andother taxes, that the income under revenue head would likely to increase inthe coming years.
16.2.2 Expenditure Account
16.2.2.1 Revenue ExpenditureSimilar to income pattern, the expenditure is also accounted under three headsof revenue, capital and suspense. In total expenditure of KNN, the major sharewas spent on revenue account only, its share was 97% during 1998-99, whichincreased to 99% in 2003-04, but slightly declined to 94% in 2004-05. Inabsolute term the expenditure incurred under the revenue account in 1998-99was Rs 715 million. In 2004-05, it has increased to the tune of Rs 1293 million(see Table16.2). On the assumption that the expenditure may grow initially, butwould come down because of many expenditure compression package (such asVRS, right sizing of staff strength, public- private partnership and the partiallyor wholly privatization of some the services) of KNN, which it would beintroducing in the near future.
As the KNN has to provide various services related to education, medical andpublic health, O & M of street lighting, water supply and sewerage, parks andgardens, public works, roads, it has to incur a substantial amount of its earningson the provision/maintenance of these basic needs. A large work force is alsoengaged for the purpose of revenue collection and the provision of theseservices.
Table 16.2: Expenditure Pattern of Kanpur Municipal Corporation (Rs lakh)Expenditure 1998-99 1999-2000 2000-01 2001-02 2002-03 2003-04 2004-05
A Revenue AccountExpenditure
1 GeneralAdministration
221.23 267.62 282.13 292.88 299.35 351.19 340.00
2 Revenue Collection 288.99 327.24 383.50 367.07 376.71 409.26 405.003 Total General
Administration &Revenue .Collection
510.22 594.87 665.63 659.95 676.06 760.45 745.00
4 Sanitation 3306.20 3572.94 3922.00 3676.82 3883.67 4222.07 4506.005 Medical and Public
Health372.74 469.95 486.55 505.53 521.84 681.54 640.70
6 Public Safety/Publicconvenience:-
533.36 777.22 996.09 876.47 949.94 970.62 1847.75
KANPUR
16-154Final Report: Kanpur City Development Plan Under JNNURM
7 Public Works(construction)
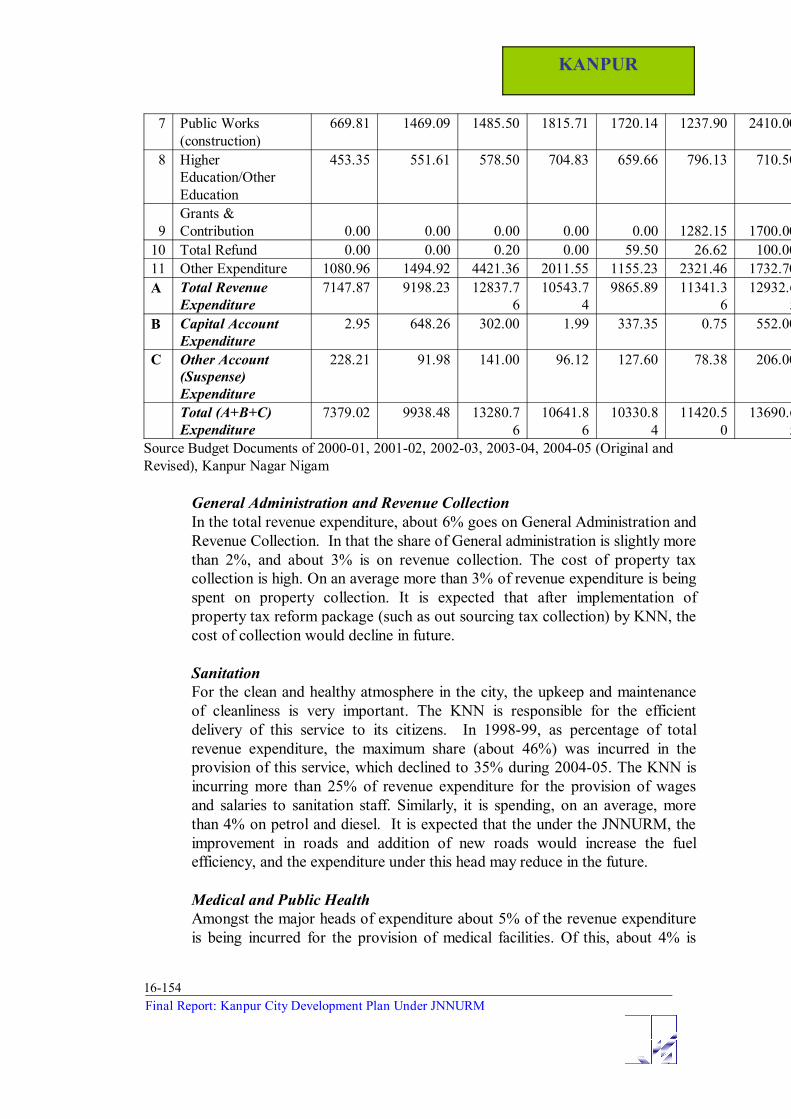
669.81 1469.09 1485.50 1815.71 1720.14 1237.90 2410.00
8 HigherEducation/OtherEducation
453.35 551.61 578.50 704.83 659.66 796.13 710.50
9Grants &Contribution 0.00 0.00 0.00 0.00 0.00 1282.15 1700.00
10 Total Refund 0.00 0.00 0.20 0.00 59.50 26.62 100.0011 Other Expenditure 1080.96 1494.92 4421.36 2011.55 1155.23 2321.46 1732.70A Total Revenue
Expenditure7147.87 9198.23 12837.7
610543.7
49865.89 11341.3
612932.6
5B Capital Account
Expenditure2.95 648.26 302.00 1.99 337.35 0.75 552.00
C Other Account(Suspense)Expenditure
228.21 91.98 141.00 96.12 127.60 78.38 206.00
Total (A+B+C)Expenditure
7379.02 9938.48 13280.76
10641.86
10330.84
11420.50
13690.65
Source Budget Documents of 2000-01, 2001-02, 2002-03, 2003-04, 2004-05 (Original andRevised), Kanpur Nagar Nigam
General Administration and Revenue CollectionIn the total revenue expenditure, about 6% goes on General Administration andRevenue Collection. In that the share of General administration is slightly morethan 2%, and about 3% is on revenue collection. The cost of property taxcollection is high. On an average more than 3% of revenue expenditure is beingspent on property collection. It is expected that after implementation ofproperty tax reform package (such as out sourcing tax collection) by KNN, thecost of collection would decline in future.
SanitationFor the clean and healthy atmosphere in the city, the upkeep and maintenanceof cleanliness is very important. The KNN is responsible for the efficientdelivery of this service to its citizens. In 1998-99, as percentage of totalrevenue expenditure, the maximum share (about 46%) was incurred in theprovision of this service, which declined to 35% during 2004-05. The KNN isincurring more than 25% of revenue expenditure for the provision of wagesand salaries to sanitation staff. Similarly, it is spending, on an average, morethan 4% on petrol and diesel. It is expected that the under the JNNURM, theimprovement in roads and addition of new roads would increase the fuelefficiency, and the expenditure under this head may reduce in the future.
Medical and Public HealthAmongst the major heads of expenditure about 5% of the revenue expenditureis being incurred for the provision of medical facilities. Of this, about 4% is
KANPUR
16-155Final Report: Kanpur City Development Plan Under JNNURM
incurred by way of wages and salaries/establishment. The absolute figures wereRs 32 million, Rs 64 million for the years 1998-99 and 2004-05 respectively.
Public Safety and Public ConvenienceThe expenditure on public safety and public convenience accounted for 7% in1998-99, has gone up to 14% by 2004-05. Of this, the share of wages andsalaries (establishment) is more than 2 % for the entire period. The maintenanceof parks is one of the important components of this service. The KNN isspending more than 1 % of total revenue expenditure on this service. Aspracticed in some of the Municipal corporations such as Ludhiana MunicipalCorporation and Udaipur Municipal Council, it is expected that KNN wouldinvolve business houses/industrial groups for the maintenance of parks in thecity. The supervision of maintenance parks can be done through communityparticipation in the wards/mohllas etc. If this were implemented effectively, itwould help in reduction of expenditure under this head.
Public Works (construction)Though the KNN is not directly involved in the development and expansion ofthe city, still it undertakes the work of repair and maintenance of roads,government building etc. In 1998-99, its share in total revenue expenditure wasa little less than 10%, which was continuously increasing and reached to 19%in 2004-05, except in 2003-04 when it has declined to 11 %.
Higher Education and Other EducationOf the total expenditure incurred (about 6%) on this service, almost all of itgoes for the payment of wages and salaries (establishment). Under this head,the amount in 1998-99 was Rs 45 million that increased to Rs 71 million in2004-05.
Other ExpenditureThe share of other expenditure, comprising of miscellaneous expenditure forthe development of councilors’, nominated members’ areas, expenditure oncomputer and stationery etc. accounted for 15% in 1998-99 and reached to20% in 2003-04, but declined to 13% in the following year.
16.2.2.2 Capital and Suspense AccountAs per the budget definition, the capital expenditure is generally meant forthe capital (development) works in the city. As discussed earlier, the KNN isnot directly involved in large capital works. For KNN, the capital works arethe works carried out under water treatment, World Bank project, GangaAction Plan, UPUDP, Indo-Dutch, Low cost sanitation and equipment forsolid waste management. The works related to MPLADS are also accountedunder Suspense account. On an average, the KNN is incurring expenditure tothe tune of 4% of the total expenditure on capital and other works.
KANPUR
16-156Final Report: Kanpur City Development Plan Under JNNURM
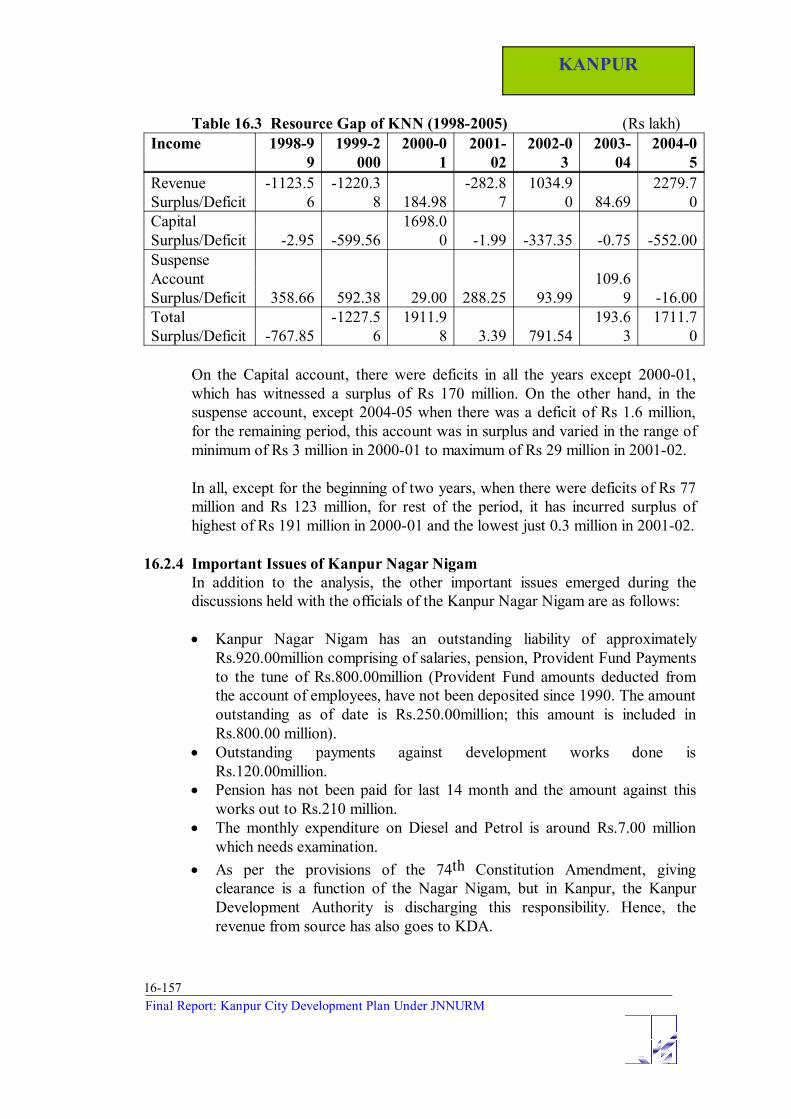
16.2.3 Surplus/Deficit of Kanpur Nagar Nigam (Exiting Scenario)Based on the budget figures provided by the KNN, there was deficit under therevenue account for the years 1998-99, 1999-2000 and 2001-02. It was of theorder of Rs 112 million, Rs 122 million and Rs 28 million respectively. For theyear 2000-01 there was revenue surplus of Rs 18 million, which has increasedto Rs 103 million and further to Rs 228 million for the years, 2002-03, 2003-04and 2004-5 respectively. Except 2003-04, when there was a surplus of Rs 8million only (see Table 16.3).
KANPUR
16-157Final Report: Kanpur City Development Plan Under JNNURM
Table 16.3 Resource Gap of KNN (1998-2005) (Rs lakh)Income 1998-9
91999-2
0002000-0
12001-
022002-0
3 2003-
042004-0
5RevenueSurplus/Deficit
-1123.56
-1220.38 184.98
-282.87
1034.90 84.69
2279.70
CapitalSurplus/Deficit -2.95 -599.56
1698.00 -1.99 -337.35 -0.75 -552.00
SuspenseAccountSurplus/Deficit 358.66 592.38 29.00 288.25 93.99
109.69 -16.00
TotalSurplus/Deficit -767.85
-1227.56
1911.98 3.39 791.54
193.63
1711.70
On the Capital account, there were deficits in all the years except 2000-01,which has witnessed a surplus of Rs 170 million. On the other hand, in thesuspense account, except 2004-05 when there was a deficit of Rs 1.6 million,for the remaining period, this account was in surplus and varied in the range ofminimum of Rs 3 million in 2000-01 to maximum of Rs 29 million in 2001-02.
In all, except for the beginning of two years, when there were deficits of Rs 77million and Rs 123 million, for rest of the period, it has incurred surplus ofhighest of Rs 191 million in 2000-01 and the lowest just 0.3 million in 2001-02.
16.2.4 Important Issues of Kanpur Nagar NigamIn addition to the analysis, the other important issues emerged during thediscussions held with the officials of the Kanpur Nagar Nigam are as follows:
Kanpur Nagar Nigam has an outstanding liability of approximatelyRs.920.00million comprising of salaries, pension, Provident Fund Paymentsto the tune of Rs.800.00million (Provident Fund amounts deducted fromthe account of employees, have not been deposited since 1990. The amountoutstanding as of date is Rs.250.00million; this amount is included inRs.800.00 million).Outstanding payments against development works done isRs.120.00million.Pension has not been paid for last 14 month and the amount against thisworks out to Rs.210 million.The monthly expenditure on Diesel and Petrol is around Rs.7.00 millionwhich needs examination.As per the provisions of the 74th Constitution Amendment, givingclearance is a function of the Nagar Nigam, but in Kanpur, the KanpurDevelopment Authority is discharging this responsibility. Hence, therevenue from source has also goes to KDA.

KANPUR
16-158Final Report: Kanpur City Development Plan Under JNNURM
16.2.5 Suggestion for Revenue EnhancementReforms in Property Tax, i.e. completely shifting from ARV to unit areamethod;Assessment of all the properties of KNN;Reviewing of exemption under the property tax;Out sourcing the collection of Property tax;Effective Enforcement of property tax laws;Computerization of data base at all the Zones;Community participation in maintenance of service (such as parks etc.)Expenditure compression through VRS, right sizing of staff strength;Introduction of Public-Private-Partnership programmes in selected services;Wholly/partially privatization of selected services (such ascleaning/sweeping of roads etc)
16.3 UTTAR PRADESH JAL NIGAMThough the provision of water supply and sewerage service is the mainresponsibility of the local government (Municipal Corporation), but in UttarPradesh, this responsibility is assigned to Uttar Pradesh Jal Nigam and JalSansthan. The Uttar Pradesh Jal Nigam is a State Level organization and isresponsible for setting up water supply and sewerage infrastructure in variouscities of Uttar Pradesh. After setting up the infrastructure the same is handedover to the city level Water supply & Sewerage Organization for Operationsand Maintenance. In case of Kanpur, Uttar Pradesh Jal Nigam after setting upthe water and sewerage system hands over the same to Kanpur Jal Sansthan forOperations and Maintenance.
Since the Uttar Pradesh Jal Nigam is a state level organization it will be difficultto analyze its financial status for the city of Kanpur separately. The UP JalNigam as such does not generate any revenue of its own. The operational andmaintenance (O&M) of water supply and sewerage system is carried out by theKanpur Jal Sansthan and it collects water tax, sewer tax, water charges andsewer charges. Therefore, it would be more meaningful to analyze the financialposition of Kanpur Jal Sansthan than the UP Jal Nigam.
16.4 KANPUR JAL SANSTHAN (KJS)In Kanpur, as mentioned above the Kanpur Jal Sansthan is responsible for thesupply of water and provision of sewerage services to the city dwellers.
16.4.1 Financial Position of Kanpur Jal SansthanThe main taxes/charges imposed by the KJS are: (a) water tax; (b) Sewer tax;(c) Water charge and (d) Sewer charge.
The basis of charging Water Tax, Water Charge, Sewer Tax and Sewer Chargeis that both tax and charge are calculated and the higher of the two is chargedfrom the consumer.
KANPUR
16-159Final Report: Kanpur City Development Plan Under JNNURM
Water and Sewer TaxThe Water Tax and Sewer Tax are charged based on Annual RentalValue/Annual Ratable Value of the properties, as assessed by the KanpurNagar Nigam. The current maximum rate of tax is 12.5% for water and 4% forsewer. The water tax rate has been dropped from 14 % to 12.5% with effectfrom 1-4-2003.
Water ChargesThe Water Charge on the other hand was fixed at a base price Rs.3.00 perkiloliter in December 1999 and the same is increased by 7.5% every year as perthe Government order. The consumers are charged on the basis of waterconsumed as per meter reading. In case the meter is not working then theconsumer is charged on the basis of minimum average consumption (It wasinformed that most of the water supply is not metered in residential areas. Onlynon-residential areas are connected through water meter.
Sewer ChargesThe Sewer charge is fixed at 25% of the water charge or Rs.435/= per seat peryear which ever is higher.
16.4.2 Revenue of Kanpur Jal SansthanAmongst the major sources of revenue for the KJS the water charge is veryimportant. The share of water charge in total income in 1999-2000 was 53%,which declined to 51% during 2006-07. In absolute amount, it has gone upfrom Rs 76 million in 1999-2000 to Rs 181 million in 2006-07 (see Table16.4).
The next important source is water tax. The revenue yield under this head hasalso become double from Rs 52 million to Rs 107 million. The percent share intotal income declined from 37% to 30% for the same period.
The income from sewer charges has also gone down from 1.58 % to 1.34%,from 2003-04 to 2006-07. In rupee term it has increased to Rs 7 million in2004-05 against Rs 4 million in previous year. However, it has declined to Rs 4million in next year.
The other income is the compensation received against the electricity chargespayment from the state government. It has increased from 1.95% in 1999-2000to 4% in 2003-04, but gone down to 1.34 % in 2006-07. In rupee term, thecompensation increased to Rs 10 million in 2003-04 against Rs 3 million in1999-2000, but decreased to Rs 5 million in 2006-07.
KANPUR
16-160Final Report: Kanpur City Development Plan Under JNNURM
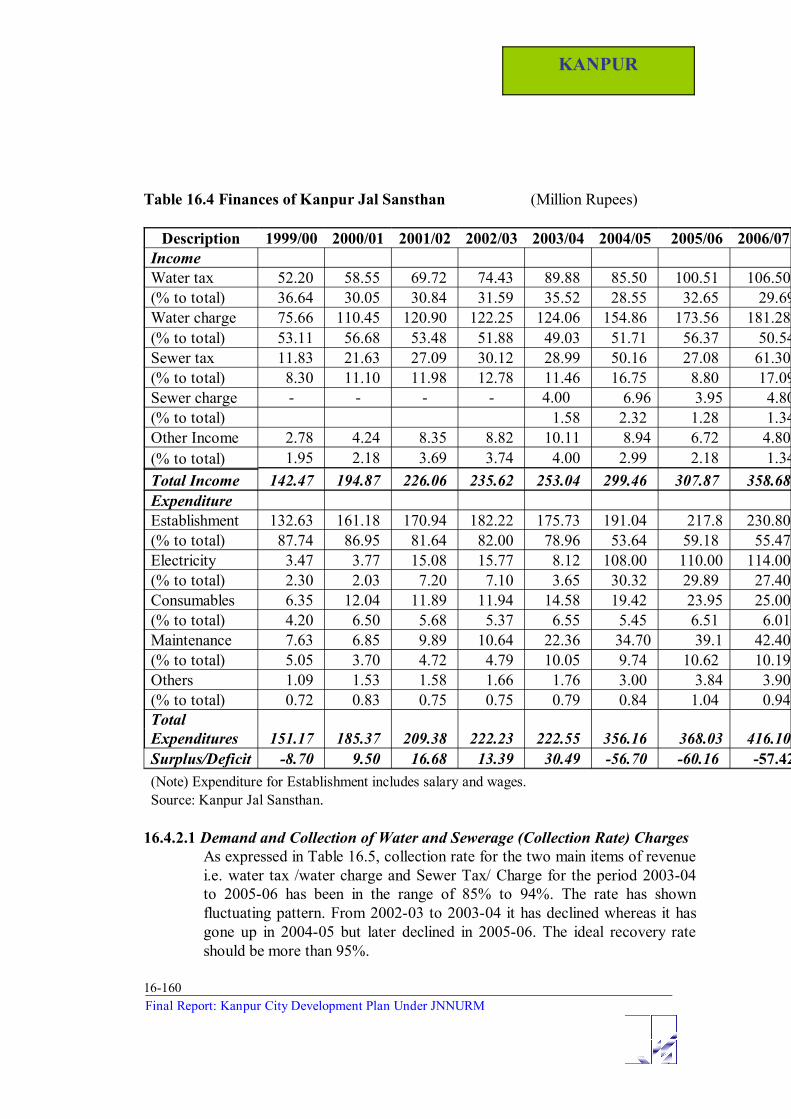
Table 16.4 Finances of Kanpur Jal Sansthan (Million Rupees)
Description 1999/00 2000/01 2001/02 2002/03 2003/04 2004/05 2005/06 2006/07IncomeWater tax 52.20 58.55 69.72 74.43 89.88 85.50 100.51 106.50 (% to total) 36.64 30.05 30.84 31.59 35.52 28.55 32.65 29.69Water charge 75.66 110.45 120.90 122.25 124.06 154.86 173.56 181.28 (% to total) 53.11 56.68 53.48 51.88 49.03 51.71 56.37 50.54Sewer tax 11.83 21.63 27.09 30.12 28.99 50.16 27.08 61.30 (% to total) 8.30 11.10 11.98 12.78 11.46 16.75 8.80 17.09Sewer charge - - - - 4.00 6.96 3.95 4.80(% to total) 1.58 2.32 1.28 1.34Other Income 2.78 4.24 8.35 8.82 10.11 8.94 6.72 4.80 (% to total) 1.95 2.18 3.69 3.74 4.00 2.99 2.18 1.34Total Income 142.47 194.87 226.06 235.62 253.04 299.46 307.87 358.68 ExpenditureEstablishment 132.63 161.18 170.94 182.22 175.73 191.04 217.8 230.80 (% to total) 87.74 86.95 81.64 82.00 78.96 53.64 59.18 55.47 Electricity 3.47 3.77 15.08 15.77 8.12 108.00 110.00 114.00 (% to total) 2.30 2.03 7.20 7.10 3.65 30.32 29.89 27.40 Consumables 6.35 12.04 11.89 11.94 14.58 19.42 23.95 25.00 (% to total) 4.20 6.50 5.68 5.37 6.55 5.45 6.51 6.01 Maintenance 7.63 6.85 9.89 10.64 22.36 34.70 39.1 42.40 (% to total) 5.05 3.70 4.72 4.79 10.05 9.74 10.62 10.19 Others 1.09 1.53 1.58 1.66 1.76 3.00 3.84 3.90 (% to total) 0.72 0.83 0.75 0.75 0.79 0.84 1.04 0.94 TotalExpenditures 151.17 185.37 209.38 222.23 222.55 356.16 368.03 416.10 Surplus/Deficit -8.70 9.50 16.68 13.39 30.49 -56.70 -60.16 -57.42(Note) Expenditure for Establishment includes salary and wages.Source: Kanpur Jal Sansthan.
16.4.2.1 Demand and Collection of Water and Sewerage (Collection Rate) ChargesAs expressed in Table 16.5, collection rate for the two main items of revenuei.e. water tax /water charge and Sewer Tax/ Charge for the period 2003-04to 2005-06 has been in the range of 85% to 94%. The rate has shownfluctuating pattern. From 2002-03 to 2003-04 it has declined whereas it hasgone up in 2004-05 but later declined in 2005-06. The ideal recovery rateshould be more than 95%.
KANPUR
16-161Final Report: Kanpur City Development Plan Under JNNURM
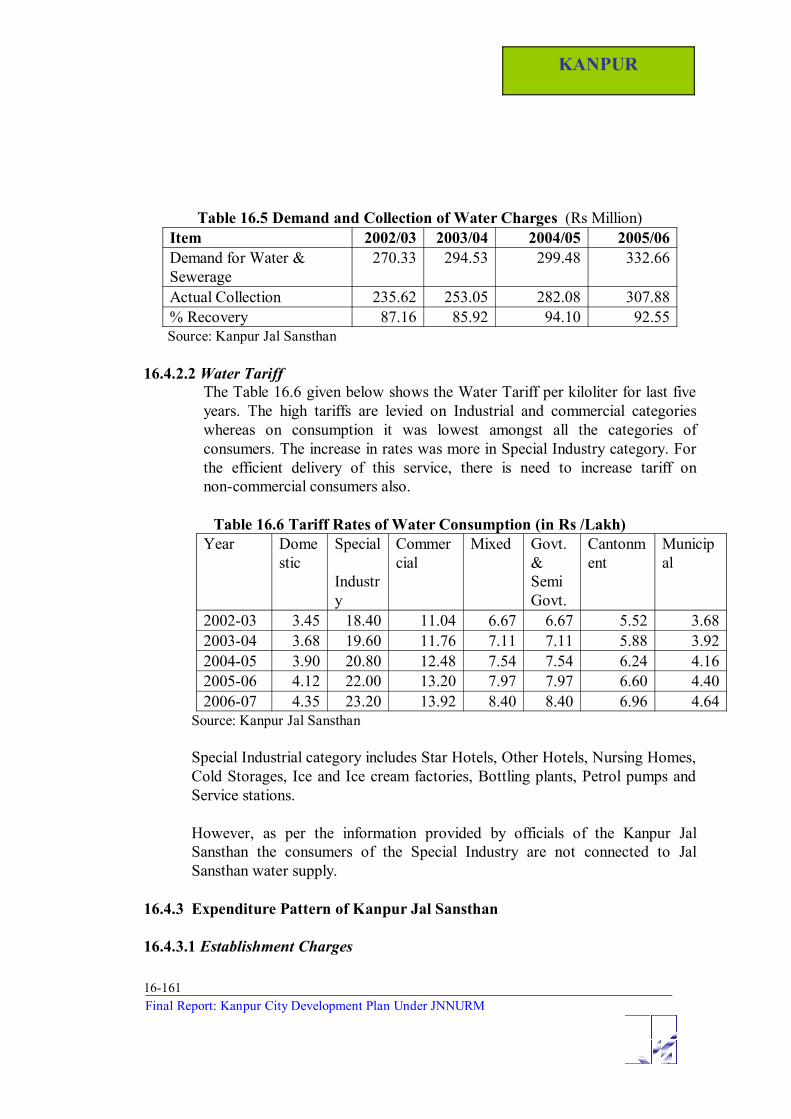
Table 16.5 Demand and Collection of Water Charges (Rs Million)Item 2002/03 2003/04 2004/05 2005/06Demand for Water &Sewerage
270.33 294.53 299.48 332.66
Actual Collection 235.62 253.05 282.08 307.88% Recovery 87.16 85.92 94.10 92.55Source: Kanpur Jal Sansthan
16.4.2.2 Water Tariff The Table 16.6 given below shows the Water Tariff per kiloliter for last fiveyears. The high tariffs are levied on Industrial and commercial categorieswhereas on consumption it was lowest amongst all the categories ofconsumers. The increase in rates was more in Special Industry category. Forthe efficient delivery of this service, there is need to increase tariff onnon-commercial consumers also.
Table 16.6 Tariff Rates of Water Consumption (in Rs /Lakh)Year Dome
sticSpecial
Industry
Commercial
Mixed Govt.&SemiGovt.
Cantonment
Municipal
2002-03 3.45 18.40 11.04 6.67 6.67 5.52 3.682003-04 3.68 19.60 11.76 7.11 7.11 5.88 3.922004-05 3.90 20.80 12.48 7.54 7.54 6.24 4.162005-06 4.12 22.00 13.20 7.97 7.97 6.60 4.402006-07 4.35 23.20 13.92 8.40 8.40 6.96 4.64
Source: Kanpur Jal Sansthan
Special Industrial category includes Star Hotels, Other Hotels, Nursing Homes,Cold Storages, Ice and Ice cream factories, Bottling plants, Petrol pumps andService stations.
However, as per the information provided by officials of the Kanpur JalSansthan the consumers of the Special Industry are not connected to JalSansthan water supply.
16.4.3 Expenditure Pattern of Kanpur Jal Sansthan
16.4.3.1 Establishment Charges
KANPUR
16-162Final Report: Kanpur City Development Plan Under JNNURM
Similar to KNN, amongst the major heads of expenditure of KJS, the mostimportant is the establishment. More than half of the expenditure goes inpayment of the wages and salaries. In the beginning of period, from 1999-2000to 2003-04, it was near 80% but declined to 54% in 2004-05, which againmarginally increased in the following two years.
16.4.3.2 Expenditure on Maintenance and ConsumablesThe second important head of expenditure is the maintenance followed byconsumables. The percent share of maintenance increased from 5% to 10% forthe entire period under consideration. The proportion of expenditure onconsumables has gone up to 5% in 2004-05 against the figure of 4% in1999-2000.
16.4.3.3 Electricity ExpenditureElectricity is the next major head of expenditure having a share of around 28%.The estimated expenditure is around Rs.114.00 million for the year 2006-07. Itis clear that the Jal Sansthan is unable to pay its own electricity bill hence thesame is paid directly by the State Government.
16.4.3.4 Other ExpenditureThe expenditure on other head was less than one percent for the whole period.
16.4.4 Issues of Kanpur Jal SansthanThe increase in revenue is mainly due to the increase in tariff every year by7.5% and as well as due to increase in number of connectionsAnnual increase in tariff is having a negative impact on the revenue andconnections.As per the survey conducted by the Jal Sansthan, there is not even a singleSpecial Category consumer connected to the Jal Sansthan water supply.The rate under this category is approximately Rs.23/= per kilo liter.
It was also observed during the discussion with the official of Jal Sansthan thatthere is a lack of coordination between Kanpur Development Authority andKanpur Jal Sansthan. The KDA does not inform KJS about the new projects,and by the time, KJS is informed about the development the demand for waterand sewer is met out of a different source. Hence there is no gain in number ofconsumers.
There should be coordination between the departments in general and KNN,KDA and KJS in particular. This would not only enhance the efficiency inservice delivery but also increase revenue collection.
Assumptions:KJS is expected to mobilize more resources due to:(a) Improvement in water quality
KANPUR
16-163Final Report: Kanpur City Development Plan Under JNNURM
(b) Increase in water supply(c) With the renewed system and reduction in water leakage(d) Coverage of water connection would go up and also the water tax and
water charges
Expenditure(e) As a result of improved system consumption of electricity would drop
and accordingly its electricity charges would go down in the future
16.5 KANPUR DEVELOPMENT AUTHORITY (KDA)As discussed in previous sections, the KDA is an important organizationplaying the crucial role in the overall development of city and its expansion.Therefore, it would be more useful to evaluate and analyse its financial positionin detail. This would help in assessment of the financial support the KDA isexpected to provide for JNNURM.
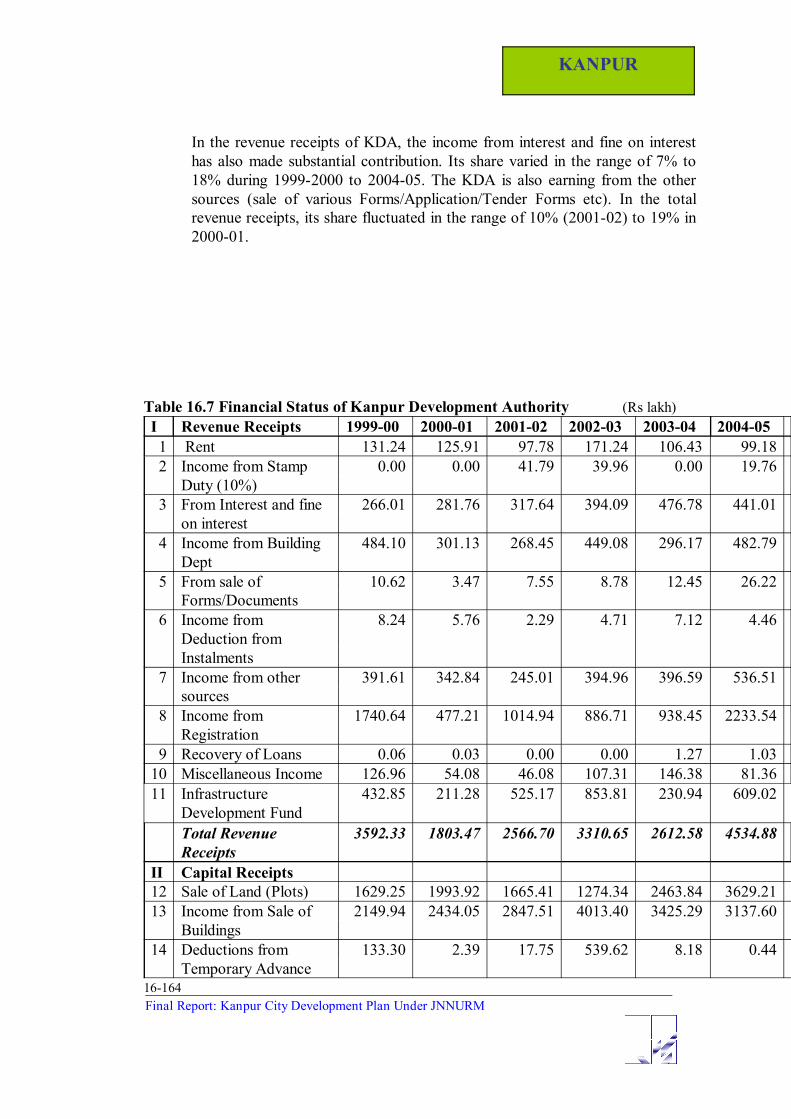
16.5.1 Revenue Account of KDAThe major source of revenue of KDA comprises of rent from lease and freehold, rent from the buildings, income from stamp duty, interest receipts, incomefrom the building department against the regulation and approval of maps forthe construction of building, shops and commercial complexes, from sale ofdifferent Forms (Application Forms etc), deduction from the deposits ofallottees not taking the possession of land, and other sources such as,surcharge/fee on non-construction on the allotted land, registration of sale ofvarious land and buildings etc. (see Table 16.7).
16.5.1.1 Revenue ReceiptsOut of total income of KDA, the revenue receipts contributed about 46 percentin 1999-2000 but dropped over the period to 38% in 2004-05. In absoluteterm, it was Rs 359 million in 1999-2000, which increased over the periodgone up to Rs 453 million in 2004-05.
Under revenue receipts, the major share of income comes from registration. Itscontribution in total income has increased from 48% to 49 % from 1999-2000to 2004-05.
The income from building department and infrastructure development fundcontributed more than 10% in total income. The share of income from thissource (building department) varied from 11 % (2003-04) to 17% (2000-01).On the other hand, the receipts under the infrastructure development fundfluctuated during the entire period. Its minimum share was 9% in 2003-04whereas highest amount was 26% in 2002-03.
KANPUR
16-164Final Report: Kanpur City Development Plan Under JNNURM
In the revenue receipts of KDA, the income from interest and fine on interesthas also made substantial contribution. Its share varied in the range of 7% to18% during 1999-2000 to 2004-05. The KDA is also earning from the othersources (sale of various Forms/Application/Tender Forms etc). In the totalrevenue receipts, its share fluctuated in the range of 10% (2001-02) to 19% in2000-01.
Table 16.7 Financial Status of Kanpur Development Authority (Rs lakh)I Revenue Receipts 1999-00 2000-01 2001-02 2002-03 2003-04 2004-05 2005-06BE1 Rent 131.24 125.91 97.78 171.24 106.43 99.18 163.002 Income from Stamp
Duty (10%)0.00 0.00 41.79 39.96 0.00 19.76 30.00
3 From Interest and fineon interest
266.01 281.76 317.64 394.09 476.78 441.01 482.00
4 Income from BuildingDept
484.10 301.13 268.45 449.08 296.17 482.79 476.00
5 From sale ofForms/Documents
10.62 3.47 7.55 8.78 12.45 26.22 10.00
6 Income fromDeduction fromInstalments
8.24 5.76 2.29 4.71 7.12 4.46 10.00
7 Income from othersources
391.61 342.84 245.01 394.96 396.59 536.51 455.00
8 Income fromRegistration
1740.64 477.21 1014.94 886.71 938.45 2233.54 1500.00
9 Recovery of Loans 0.06 0.03 0.00 0.00 1.27 1.03 1.0010 Miscellaneous Income 126.96 54.08 46.08 107.31 146.38 81.36 120.0011 Infrastructure
Development Fund432.85 211.28 525.17 853.81 230.94 609.02 707.00
Total RevenueReceipts
3592.33 1803.47 2566.70 3310.65 2612.58 4534.88 3954.00
II Capital Receipts12 Sale of Land (Plots) 1629.25 1993.92 1665.41 1274.34 2463.84 3629.21 18948.0013 Income from Sale of
Buildings2149.94 2434.05 2847.51 4013.40 3425.29 3137.60 5810.00
14 Deductions fromTemporary Advance
133.30 2.39 17.75 539.62 8.18 0.44 10.00

KANPUR
16-165Final Report: Kanpur City Development Plan Under JNNURM
15 Income fromsale/auctions of oldmachinery
0.00 0.00 0.00 0.00 42.25 9.07 15.00
16 Loans 62.32 2533.09 0.00 0.00 0.00 0.00 12320.0017 Grants 0.00 0.00 0.00 62.31 75.14 171.12 1.0018 Income from Deposits 23.63 585.98 280.00 235.28 10.40 12.50 341.0019 Recovery of advances
from staff24.97 35.55 33.15 34.96 34.07 33.21 40.00
20 InfrastructureDevelopment Fund
203.43 235.09 165.17 146.03 80.75 331.49 450.00
Total Capital Receipts 4226.84 7820.07 5008.99 6305.94 6139.92 7324.64 37935.00Total (Revenue+Capital) Receipts
7819.17 9623.54 7575.69 9616.59 8752.50 11859.52
41889.00
Opening Balance 3176.23 3629.67 6708.76 5167.77 7159.38 8716.51 11634.00Grand Total 10995.4
013253.2
114284.4
514784.3
615911.8
820576.0
353523.00
Source: Budget Documents of KDA for various years
16.5.1.2 Capital Receipts In the total income of KDA, the contribution from capital receipts hasincreased over the period. The highest earning under this head was 81% in2000-01, whereas the lowest income 54% received during 1999-2000. Inabsolute term the capital receipts contributed in the total income, Rs 423million to Rs 732 million for the years from 1999-2000 to 2004-05.
Under capital receipts, the major source of income comes from sale of land andsale of buildings. Both put together accounted for 91% in 2004-05 against 26%in 2000-01. The earning from the sale of plots was Rs 162 million (1999-2000)which has gone up to Rs 363 million (2004-05).
The total income of KDA increased from Rs 782 million to Rs 1186 millionfrom 1999-2000 to 2004-05.
16.5.2 Expenditure patternIn the total expenditure of KDA, the expenditure under revenue headaccounted for about one third whereas under capital head it varied from 65%to 74%.
16.5.2.1 Revenue ExpenditureSimilar to KNN and KJS, the major head of revenue expenditure is ‘wages andsalaries’ paid to its employees. It accounted for more than fifty percent. Theother important heads of expenditure are refund of deposits and miscellaneousexpenditure. These both put together contributed about 50% in the revenue

KANPUR
16-166Final Report: Kanpur City Development Plan Under JNNURM
expenditure. In absolute amount, it was Rs 124 million increased to Rs 145million for the wages and salaries.
16.5.2.2 Capital ExpenditureIn the capital expenditure, the major heads were development works,construction works, repayment of loans and interest payments. The share ofdevelopment works declined from 58% to 35%. Similarly, on constructionworks, it has decreased from 6% to 3% for the period under consideration(1999-2000 to 2004-05). The expenditure on repayments of loans hasincreased from 13% to 22%. The expenditure on infrastructure developmentworks undertaken under the World Bank project has gone up from merely lessthan one percent to 8% during the entire period.
16.5.3 Surplus/Deficit of KDA financesUnder the revenue head, it has generated surplus for all the years, except2000-01, when the deficit was to the tune of Rs 50 million. The surplus amountvaried from minimum of Rs 11 million in 2003-04 to highest figure of Rs 172million in the following year of 2004-05.
On capital account, there was deficit for the years 1999-2000, Rs 67 millionand Rs 177 million in 2001-02. The surplus generated under this accountvaried in the range of Rs 120 million in 2004-05 against the highest amount ofRs 358 million for the year 2000-01.
In overall, the KDA has generated surplus of Rs 45 million in 1999-2000, to Rs308 million in next year. The deficit year was 2001-02 when it has incurred adeficit of Rs 154 million.
16.6 OVERALL ISSUES AND THE STRATEGIES
IssuesEfficient service delivery to the existing and future population;Resource mobilization by all the stakeholders for meeting financialrequirements
StrategiesReforms in existing taxation system (property tax and other taxes)Expenditure compressionPublic-private partnershipPrivatization of selected servicesCommunity participationGood governance
7 REFORMS AND ITS IMPACT ON FINANCES OF ULBS
KANPUR
16-167Final Report: Kanpur City Development Plan Under JNNURM
In the above sections, the financial positions of KNN, KJS and KDA have beenanalyzed. As proposed, the KNN and KJS would improve their efficiency andenhance their fiscal health by adoption of certain measures related to thereforms in resource mobilization and expenditure compression. The followingassumptions, as suggested, would help in overall improvement in the financesof KNN and KJS.
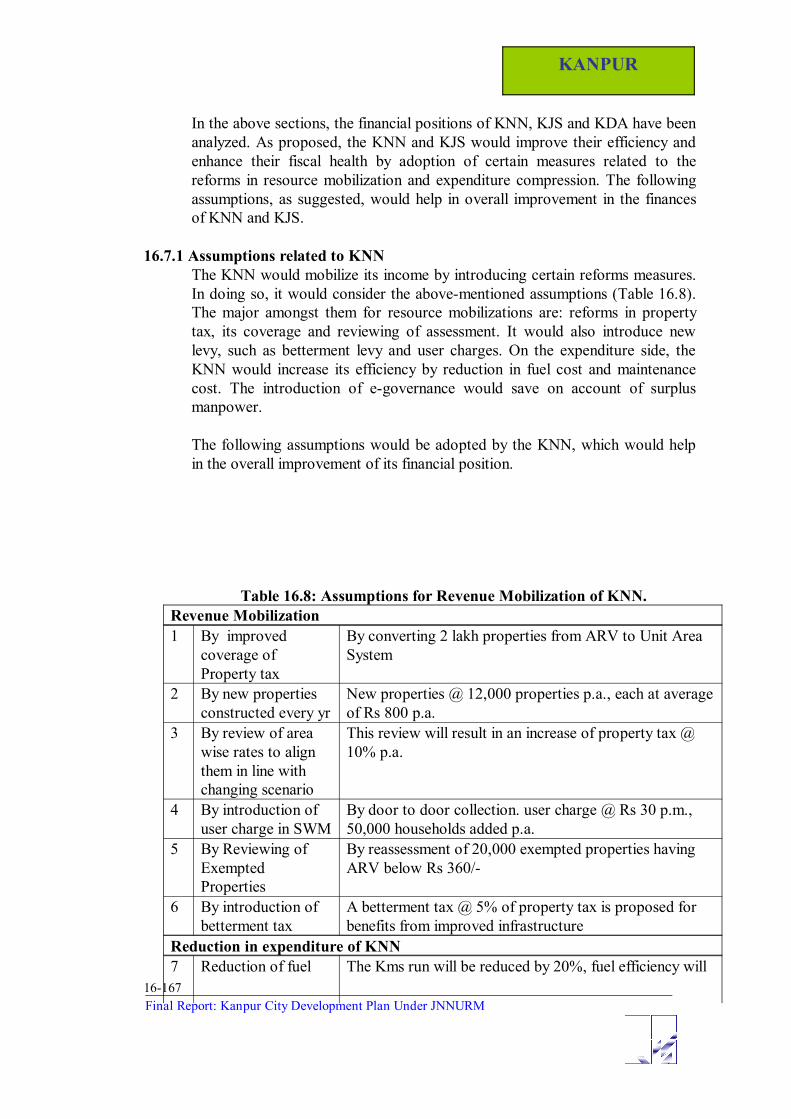
16.7.1 Assumptions related to KNNThe KNN would mobilize its income by introducing certain reforms measures.In doing so, it would consider the above-mentioned assumptions (Table 16.8).The major amongst them for resource mobilizations are: reforms in propertytax, its coverage and reviewing of assessment. It would also introduce newlevy, such as betterment levy and user charges. On the expenditure side, theKNN would increase its efficiency by reduction in fuel cost and maintenancecost. The introduction of e-governance would save on account of surplusmanpower.
The following assumptions would be adopted by the KNN, which would helpin the overall improvement of its financial position.
Table 16.8: Assumptions for Revenue Mobilization of KNN.Revenue Mobilization1 By improved
coverage ofProperty tax
By converting 2 lakh properties from ARV to Unit AreaSystem
2 By new propertiesconstructed every yr
New properties @ 12,000 properties p.a., each at averageof Rs 800 p.a.
3 By review of areawise rates to alignthem in line withchanging scenario
This review will result in an increase of property tax @10% p.a.
4 By introduction ofuser charge in SWM
By door to door collection. user charge @ Rs 30 p.m.,50,000 households added p.a.
5 By Reviewing ofExemptedProperties
By reassessment of 20,000 exempted properties havingARV below Rs 360/-
6 By introduction ofbetterment tax
A betterment tax @ 5% of property tax is proposed forbenefits from improved infrastructure
Reduction in expenditure of KNN7 Reduction of fuel The Kms run will be reduced by 20%, fuel efficiency will
KANPUR
16-168Final Report: Kanpur City Development Plan Under JNNURM
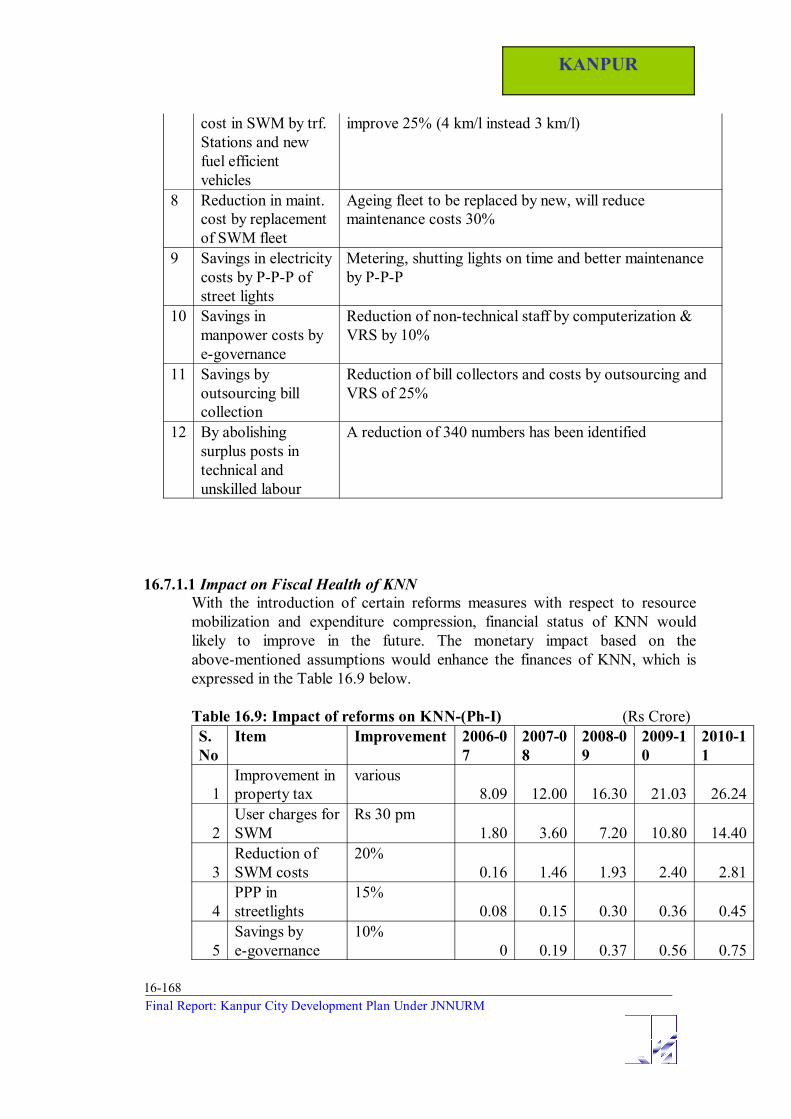
cost in SWM by trf.Stations and newfuel efficientvehicles
improve 25% (4 km/l instead 3 km/l)
8 Reduction in maint.cost by replacementof SWM fleet
Ageing fleet to be replaced by new, will reducemaintenance costs 30%
9 Savings in electricitycosts by P-P-P ofstreet lights
Metering, shutting lights on time and better maintenanceby P-P-P
10 Savings inmanpower costs bye-governance
Reduction of non-technical staff by computerization &VRS by 10%
11 Savings byoutsourcing billcollection
Reduction of bill collectors and costs by outsourcing andVRS of 25%
12 By abolishingsurplus posts intechnical andunskilled labour
A reduction of 340 numbers has been identified
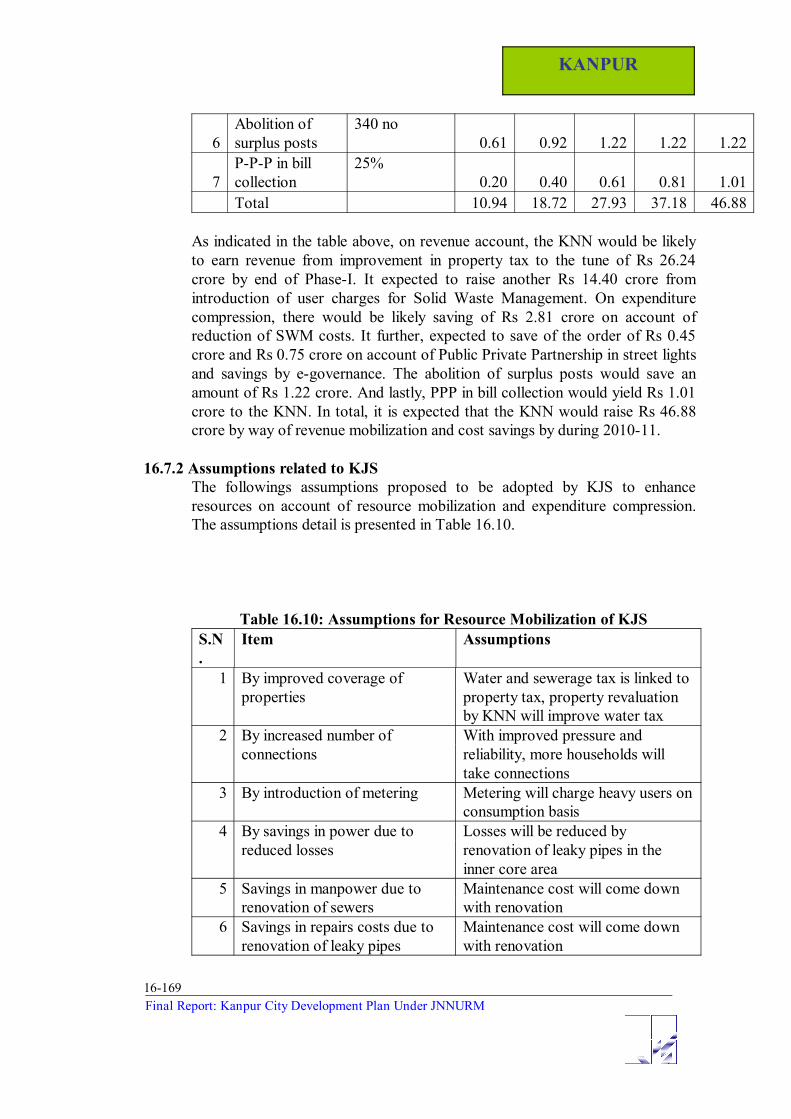
16.7.1.1 Impact on Fiscal Health of KNNWith the introduction of certain reforms measures with respect to resourcemobilization and expenditure compression, financial status of KNN wouldlikely to improve in the future. The monetary impact based on theabove-mentioned assumptions would enhance the finances of KNN, which isexpressed in the Table 16.9 below.
Table 16.9: Impact of reforms on KNN-(Ph-I) (Rs Crore)S.No
Item Improvement 2006-07
2007-08
2008-09
2009-10
2010-11
1Improvement inproperty tax
various8.09 12.00 16.30 21.03 26.24
2User charges forSWM
Rs 30 pm1.80 3.60 7.20 10.80 14.40
3Reduction ofSWM costs
20%0.16 1.46 1.93 2.40 2.81
4PPP instreetlights
15%0.08 0.15 0.30 0.36 0.45
5Savings bye-governance
10%0 0.19 0.37 0.56 0.75
KANPUR
16-169Final Report: Kanpur City Development Plan Under JNNURM
6Abolition ofsurplus posts
340 no0.61 0.92 1.22 1.22 1.22
7P-P-P in billcollection
25%0.20 0.40 0.61 0.81 1.01
Total 10.94 18.72 27.93 37.18 46.88
As indicated in the table above, on revenue account, the KNN would be likelyto earn revenue from improvement in property tax to the tune of Rs 26.24crore by end of Phase-I. It expected to raise another Rs 14.40 crore fromintroduction of user charges for Solid Waste Management. On expenditurecompression, there would be likely saving of Rs 2.81 crore on account ofreduction of SWM costs. It further, expected to save of the order of Rs 0.45crore and Rs 0.75 crore on account of Public Private Partnership in street lightsand savings by e-governance. The abolition of surplus posts would save anamount of Rs 1.22 crore. And lastly, PPP in bill collection would yield Rs 1.01crore to the KNN. In total, it is expected that the KNN would raise Rs 46.88crore by way of revenue mobilization and cost savings by during 2010-11.
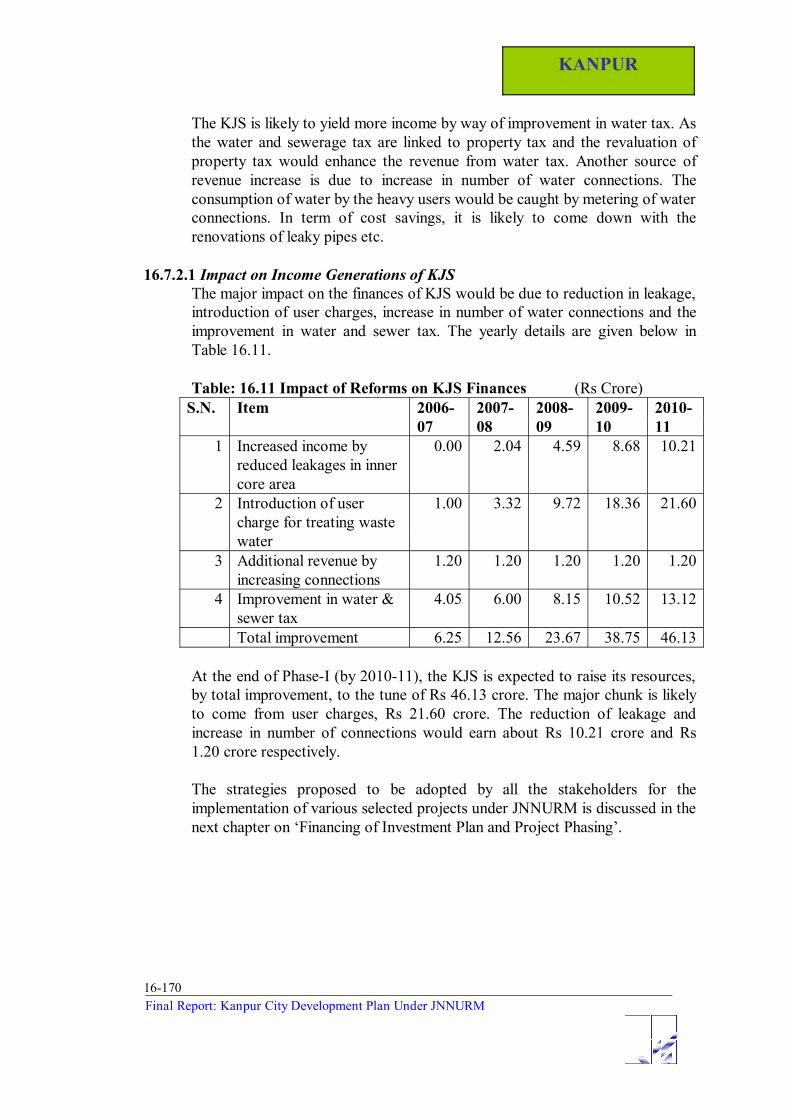
16.7.2 Assumptions related to KJSThe followings assumptions proposed to be adopted by KJS to enhanceresources on account of resource mobilization and expenditure compression.The assumptions detail is presented in Table 16.10.
Table 16.10: Assumptions for Resource Mobilization of KJSS.N.
Item Assumptions
1 By improved coverage ofproperties
Water and sewerage tax is linked toproperty tax, property revaluationby KNN will improve water tax
2 By increased number ofconnections
With improved pressure andreliability, more households willtake connections
3 By introduction of metering Metering will charge heavy users onconsumption basis
4 By savings in power due toreduced losses
Losses will be reduced byrenovation of leaky pipes in theinner core area
5 Savings in manpower due torenovation of sewers
Maintenance cost will come downwith renovation
6 Savings in repairs costs due torenovation of leaky pipes
Maintenance cost will come downwith renovation
KANPUR
16-170Final Report: Kanpur City Development Plan Under JNNURM
The KJS is likely to yield more income by way of improvement in water tax. Asthe water and sewerage tax are linked to property tax and the revaluation ofproperty tax would enhance the revenue from water tax. Another source ofrevenue increase is due to increase in number of water connections. Theconsumption of water by the heavy users would be caught by metering of waterconnections. In term of cost savings, it is likely to come down with therenovations of leaky pipes etc.
16.7.2.1 Impact on Income Generations of KJSThe major impact on the finances of KJS would be due to reduction in leakage,introduction of user charges, increase in number of water connections and theimprovement in water and sewer tax. The yearly details are given below inTable 16.11.
Table: 16.11 Impact of Reforms on KJS Finances (Rs Crore)S.N. Item 2006-
072007-08
2008-09
2009-10
2010-11
1 Increased income byreduced leakages in innercore area
0.00 2.04 4.59 8.68 10.21
2 Introduction of usercharge for treating wastewater
1.00 3.32 9.72 18.36 21.60
3 Additional revenue byincreasing connections
1.20 1.20 1.20 1.20 1.20
4 Improvement in water &sewer tax
4.05 6.00 8.15 10.52 13.12
Total improvement 6.25 12.56 23.67 38.75 46.13
At the end of Phase-I (by 2010-11), the KJS is expected to raise its resources,by total improvement, to the tune of Rs 46.13 crore. The major chunk is likelyto come from user charges, Rs 21.60 crore. The reduction of leakage andincrease in number of connections would earn about Rs 10.21 crore and Rs1.20 crore respectively.
The strategies proposed to be adopted by all the stakeholders for theimplementation of various selected projects under JNNURM is discussed in thenext chapter on ‘Financing of Investment Plan and Project Phasing’.