Kaktovik Wind-Diesel Analysis - V3 Energy Wind -Diesel Analysis Page | i. ... (or wind power...
35
Kaktovik Wind-Diesel Analysis November 5, 2013 Douglas Vaught, P.E. [email protected] V3 Energy, LLC Eagle River, Alaska
Transcript of Kaktovik Wind-Diesel Analysis - V3 Energy Wind -Diesel Analysis Page | i. ... (or wind power...

Kaktovik Wind-Diesel Analysis
November 5, 2013
Douglas Vaught, P.E. [email protected]
V3 Energy, LLC Eagle River, Alaska
Kaktovik Wind-Diesel Analysis P a g e | i
This report was prepared by V3 Energy, LLC under contract to Hattenburg, Dilley and Linnell (HDL) for development of wind power for the village of Kaktovik, Alaska. This analysis is part of a conceptual design project funded by the North Slope Borough.
Contents Introduction ............................................................................................................................................ 1
Project Management ........................................................................................................................... 1
Kaktovik .................................................................................................................................................. 1
Wind Resource ........................................................................................................................................ 2
Wind Roses .......................................................................................................................................... 4
Wind Frequency Rose (measured) ................................................................................................... 5
Total Value (power density) Rose ..................................................................................................... 5
Wind Frequency Rose (declination adjusted) ................................................................................... 6
Total Value (power density) Rose ..................................................................................................... 6
AWS Truepower and AWOS data ......................................................................................................... 6
Cold Climate Considerations of Wind Power ........................................................................................ 9
Wind-Diesel Hybrid System Overview .................................................................................................... 11
Wind-diesel Design Options ............................................................................................................... 11
Low Penetration Configuration ...................................................................................................... 11
Medium Penetration Configuration ............................................................................................... 12
High Penetration Configuration ..................................................................................................... 12
Wind-Diesel System Components ...................................................................................................... 14
Wind Turbine(s) ............................................................................................................................. 14
Supervisory Control System ........................................................................................................... 14
Synchronous Condenser ................................................................................................................ 14
Secondary Load ............................................................................................................................. 15
Deferrable Load ............................................................................................................................. 15
Interruptible Load .......................................................................................................................... 15
Storage Options ............................................................................................................................. 16
Wind Turbine Options ........................................................................................................................... 17
Aeronautica 29-225 ........................................................................................................................... 17
Northern Power Systems 100 (NPS 100) ............................................................................................ 18
Kaktovik Wind-Diesel Analysis P a g e | ii
Vestas V27 ......................................................................................................................................... 19
Wind-Diesel Model ................................................................................................................................ 19
Kaktovik Powerplant .......................................................................................................................... 19
Diesel Generators .......................................................................................................................... 20
Caterpillar 3512 Diesel Generator .................................................................................................. 20
Caterpillar 3508 Diesel Generator .................................................................................................. 21
Wind Turbines ................................................................................................................................... 21
Electric Load ...................................................................................................................................... 22
Thermal Load..................................................................................................................................... 24
Wind Turbine Configuration Options ................................................................................................. 25
Economic Analysis ................................................................................................................................. 26
Fuel Cost ........................................................................................................................................... 27
Modeling Assumptions ...................................................................................................................... 27
Wind Turbine Project Costs................................................................................................................ 29
Modeling Results ............................................................................................................................... 29
Discussion ............................................................................................................................................. 31
Kaktovik Wind-Diesel Analysis P a g e | 1
Introduction North Slope Borough (NSB) is the electric utility for the City of Kaktovik. In October, 2012 North Slope Borough awarded a contract to Hattenberg, Dilley, and Linnell (HDL) to complete a conceptual design report for a possible wind-diesel project in Kaktovik. HDL subsequently subcontracted V3 Energy, LLC to evaluate the wind resource in the community, model the Kaktovik power system with a selection of wind turbines, and perform basic economic analyses of the proposed projects.
Project Management The North Slope Borough has executive oversight of this project. North Slope Borough and the City of Kaktovik are interested in the installation of wind turbines in Kaktovik primarily to reduce diesel fuel consumption, but also to:
• Reduce long-term dependence on outside sources of energy • Reduce exposure to fuel price volatility • Reduce air pollution resulting from reducing fossil fuel combustion • Reduce possibility of spills from fuel transport & storage • Reduce overall carbon footprint and its contribution to climate change.
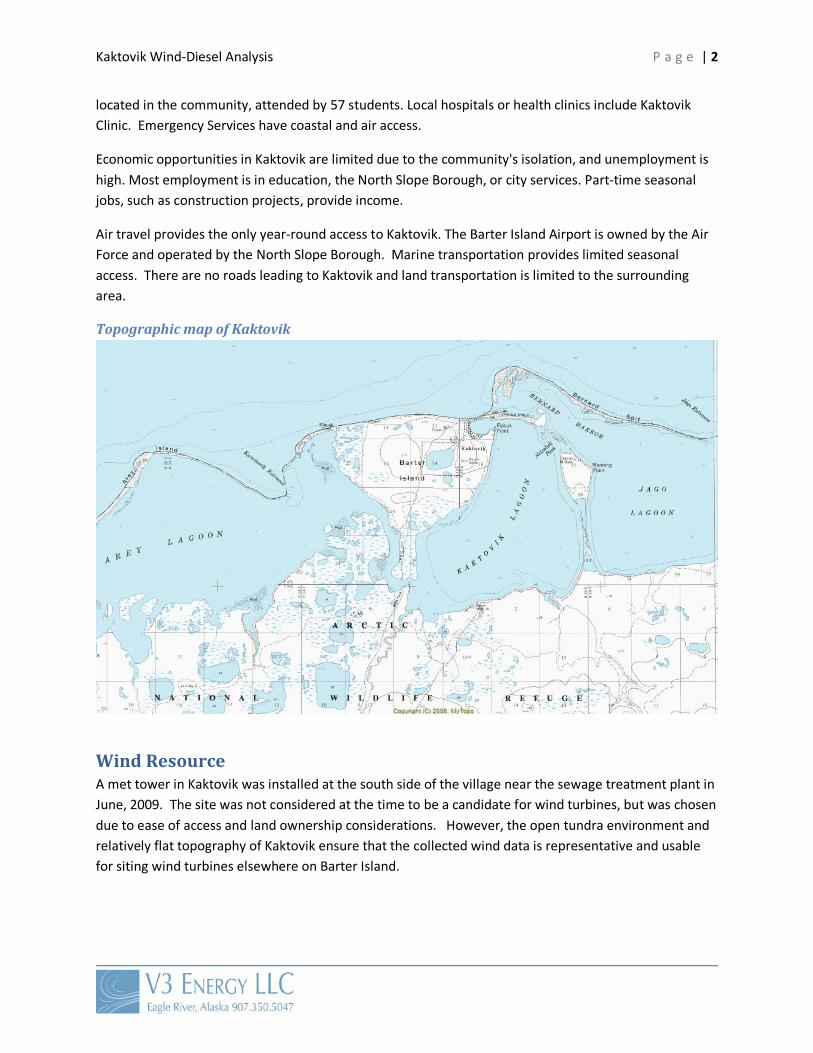
Kaktovik Kaktovik lies on the north shore of Barter Island, between the Okpilak and Jago Rivers on the Beaufort Sea coast. It lies in the 19.6-million-acre Arctic National Wildlife Refuge, an occasional calving ground for
the porcupine caribou herd. The climate of Kaktovik is arctic. Temperatures range from -56 to 78 °F. Precipitation is light, averaging 5 inches, with snowfall averaging 20 inches.
Until the late nineteenth century, the island was a major trade center for the Inupiat and was especially important as a bartering place for Inupiat from Alaska and Inuit from Canada. The city was incorporated in 1971. Due to Kaktovik's isolation, the village has maintained its Inupiat Eskimo traditions. Subsistence is highly dependent upon caribou.
A federally-recognized tribe is located in the community -- the Kaktovik Village. According to Census 2010, there were 87 housing units in the community and 72 were occupied. Its population was 88.7 percent American Indian or Alaska Native; 10 percent white; 1.3 percent of the local residents had multi-racial backgrounds.
The North Slope Borough provides all utilities in Kaktovik. Water is derived from a surface source and is treated and stored in a 680,000-gallon water tank. Water is delivered by truck to holding tanks; all homes have running water in the kitchen. For the most part, the village is still on water and sewage haul. Electricity is provided by North Slope Borough Power and Lights Systems. There is one school
Kaktovik Wind-Diesel Analysis P a g e | 2
located in the community, attended by 57 students. Local hospitals or health clinics include Kaktovik Clinic. Emergency Services have coastal and air access.
Economic opportunities in Kaktovik are limited due to the community's isolation, and unemployment is high. Most employment is in education, the North Slope Borough, or city services. Part-time seasonal jobs, such as construction projects, provide income.
Air travel provides the only year-round access to Kaktovik. The Barter Island Airport is owned by the Air Force and operated by the North Slope Borough. Marine transportation provides limited seasonal access. There are no roads leading to Kaktovik and land transportation is limited to the surrounding area.
Topographic map of Kaktovik
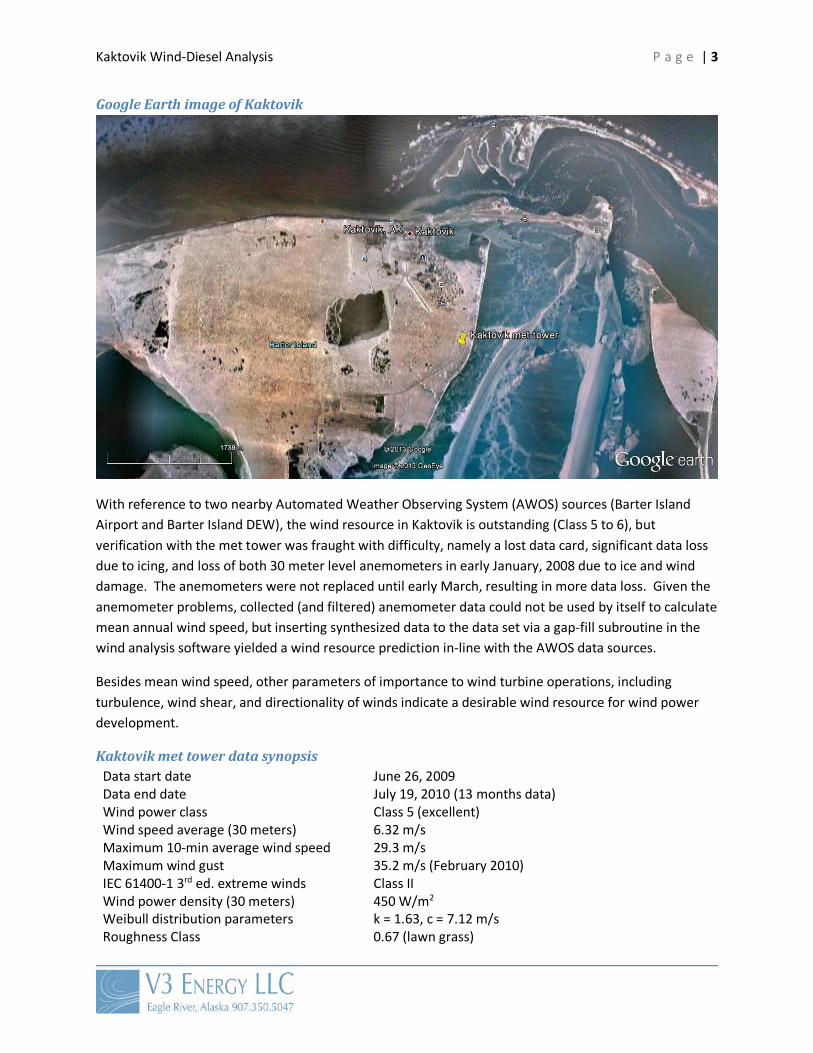
Wind Resource A met tower in Kaktovik was installed at the south side of the village near the sewage treatment plant in June, 2009. The site was not considered at the time to be a candidate for wind turbines, but was chosen due to ease of access and land ownership considerations. However, the open tundra environment and relatively flat topography of Kaktovik ensure that the collected wind data is representative and usable for siting wind turbines elsewhere on Barter Island.
Kaktovik Wind-Diesel Analysis P a g e | 3
Google Earth image of Kaktovik
With reference to two nearby Automated Weather Observing System (AWOS) sources (Barter Island Airport and Barter Island DEW), the wind resource in Kaktovik is outstanding (Class 5 to 6), but verification with the met tower was fraught with difficulty, namely a lost data card, significant data loss due to icing, and loss of both 30 meter level anemometers in early January, 2008 due to ice and wind damage. The anemometers were not replaced until early March, resulting in more data loss. Given the anemometer problems, collected (and filtered) anemometer data could not be used by itself to calculate mean annual wind speed, but inserting synthesized data to the data set via a gap-fill subroutine in the wind analysis software yielded a wind resource prediction in-line with the AWOS data sources.
Besides mean wind speed, other parameters of importance to wind turbine operations, including turbulence, wind shear, and directionality of winds indicate a desirable wind resource for wind power development.
Kaktovik met tower data synopsis Data start date June 26, 2009 Data end date July 19, 2010 (13 months data) Wind power class Class 5 (excellent) Wind speed average (30 meters) 6.32 m/s Maximum 10-min average wind speed 29.3 m/s Maximum wind gust 35.2 m/s (February 2010) IEC 61400-1 3rd ed. extreme winds Class II Wind power density (30 meters) 450 W/m2 Weibull distribution parameters k = 1.63, c = 7.12 m/s Roughness Class 0.67 (lawn grass)

Kaktovik Wind-Diesel Analysis P a g e | 4
Power law exponent 0.14 (moderate wind shear) Frequency of calms (3.5 m/s threshold) 31% Mean Turbulence Intensity 0.071 (IEC 61400-1 3rd ed. turbulence category C)
Wind Speed Sensor Summary, Kaktovik Original data set Synthesized data set
Variable Speed 30 A
Speed 30 B
Speed 20
Speed 30 A
Speed 30 B
Speed 20
Measurement height (m) 30 30 20 30 30 20 MMM wind speed (m/s) 6.26 6.03 6.07 6.36 6.24 6.01 Max 10-min avg wind speed (m/s) 26.4 26.2 29.3 Max gust wind speed (m/s) 32.7 30.2 35.2 Weibull k 1.75 1.75 1.62 1.63 1.62 1.62 Weibull c (m/s) 7.04 6.79 6.78 7.12 6.98 6.71 MMM power density (W/m²) 360 324 393 450 431 384 MMM energy content (kWh/m²/yr) 3,158 2,834 3,440 3,943 3,774 3,361 Energy pattern factor 2.22 2.23 2.57 2.56 2.59 2.60 Frequency of calms (%) 31.8 33.5 35.0 32.4 33.2 35.6
Kaktovik Wind speed graph (with synthesized data)
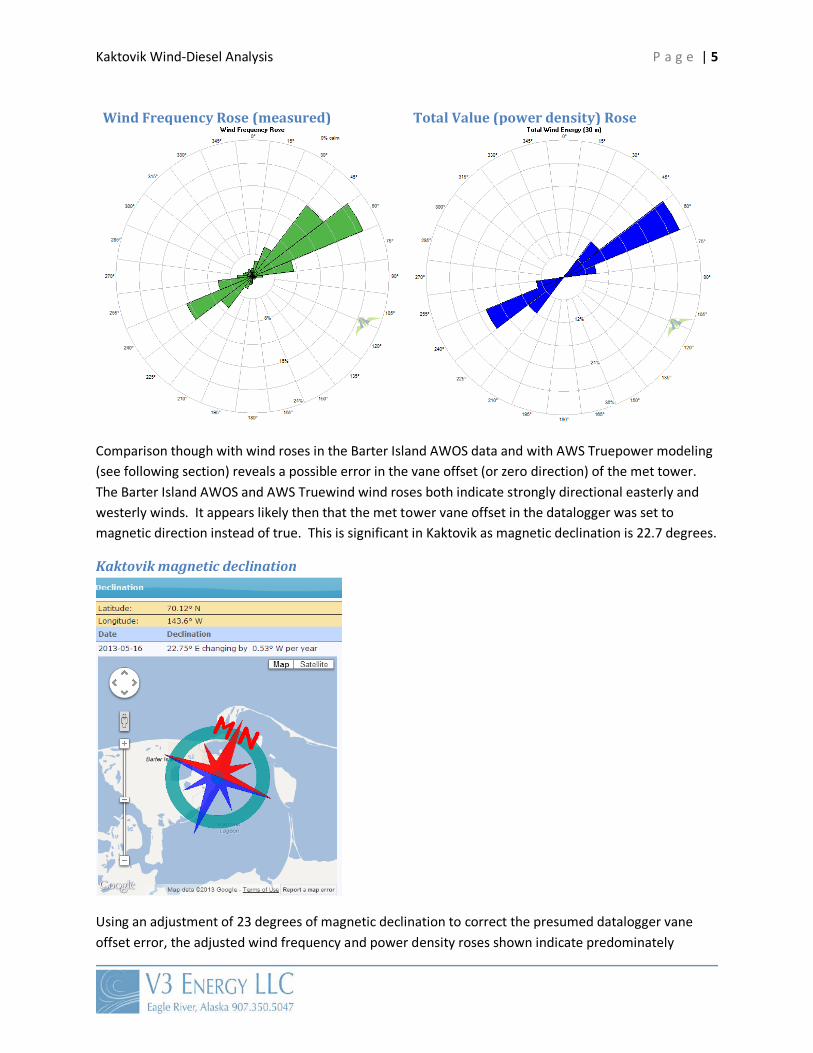
Wind Roses Winds at the Kaktovik met tower test site were measured as strongly direction east-northeast and west-southwest. The total value (or wind power density) rose indicates that the ENE and WSW Kaktovik winds were of nearly equal power over the course of the measurement period.
Kaktovik Wind-Diesel Analysis P a g e | 5
Wind Frequency Rose (measured) Total Value (power density) Rose
Comparison though with wind roses in the Barter Island AWOS data and with AWS Truepower modeling (see following section) reveals a possible error in the vane offset (or zero direction) of the met tower. The Barter Island AWOS and AWS Truewind wind roses both indicate strongly directional easterly and westerly winds. It appears likely then that the met tower vane offset in the datalogger was set to magnetic direction instead of true. This is significant in Kaktovik as magnetic declination is 22.7 degrees.
Kaktovik magnetic declination
Using an adjustment of 23 degrees of magnetic declination to correct the presumed datalogger vane offset error, the adjusted wind frequency and power density roses shown indicate predominately

Kaktovik Wind-Diesel Analysis P a g e | 6
easterly and westerly winds. This agrees within approximately 10 degrees of the wind roses obtained from the Barter Island AWOS and AWS Truewind data and modeling.
Wind Frequency Rose (declination adjusted)
Total Value (power density) Rose
AWS Truepower and AWOS data It is acknowledged that the wind resource measured by the met tower and nearby AWOS weather stations has some limitations in that the met tower was operational for a relatively short period of time and experienced significant data problems. The nearby AWOS weather stations (the airport and the USAF Barter Island DEW) are a very long term source of data but measurement height is only 8 meters and the averaging method is somewhat different than that for the met tower, although with a long-term perspective the averaging methodology converges.
To validate the met tower and AWOS wind speed data, AWS Truepower’s wind site assessment dashboard software was used to survey the wind resource in Kaktovik. The wind site assessment dashboard is a web-based too that uses AWS Truepower’s proprietary MesoMap system of mesoscale and microscale atmospheric models. The mesoscale model simulates weather conditions for a representative meteorological year on a horizontal grid of 2 km. Starting from an initial condition established by regional weather data and physical equations governing the atmosphere, the model simulates the evolution of weather conditions from the start to end of each day in the representative year. The microscale model then refines the wind fields from the mesoscale model to capture the local influences of the topography and surface roughness changes at a higher resolution of 200 m. For each region, the wind maps are fine-tuned using best available surface observations.
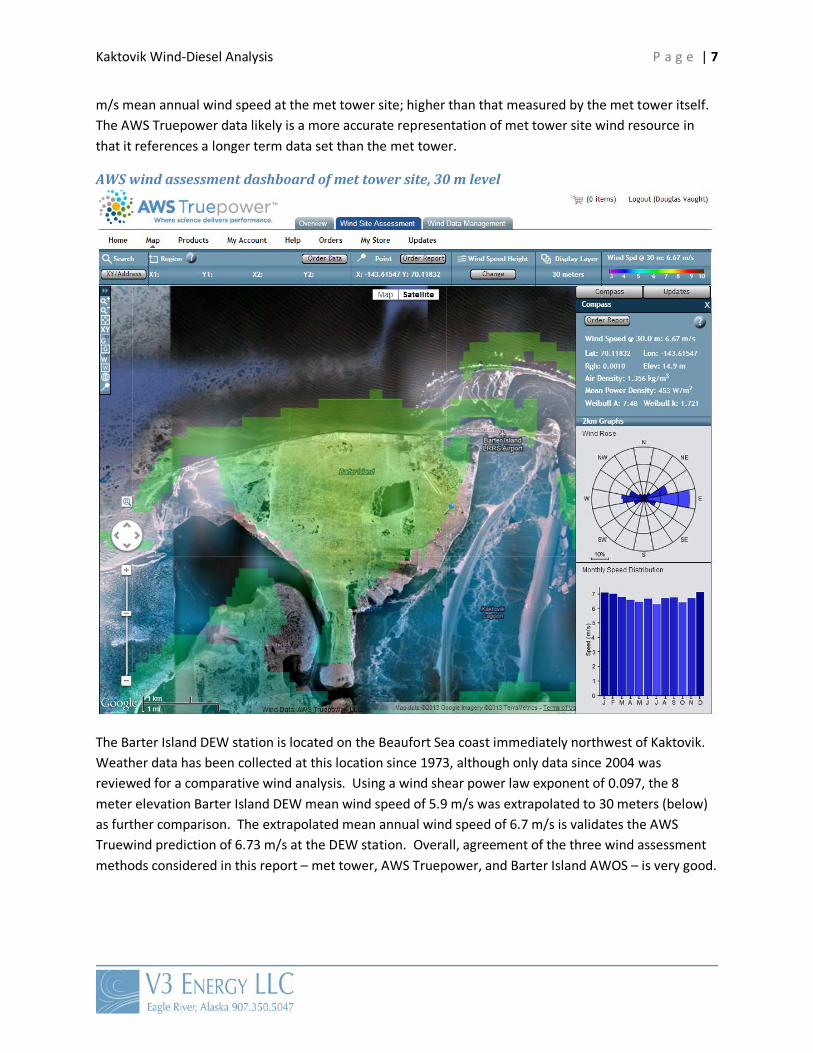
Filtered met tower 30 meter A anemometer data indicated a mean annual wind speed of 6.26 m/s. With inclusion of synthesized data via the Windographer gap-fill subroutine, the mean wind speed increases to 6.36 m/s at the 30 meter level. Note below that AWS Truepower software predicts a 6.67
Kaktovik Wind-Diesel Analysis P a g e | 7
m/s mean annual wind speed at the met tower site; higher than that measured by the met tower itself. The AWS Truepower data likely is a more accurate representation of met tower site wind resource in that it references a longer term data set than the met tower.
AWS wind assessment dashboard of met tower site, 30 m level
The Barter Island DEW station is located on the Beaufort Sea coast immediately northwest of Kaktovik. Weather data has been collected at this location since 1973, although only data since 2004 was reviewed for a comparative wind analysis. Using a wind shear power law exponent of 0.097, the 8 meter elevation Barter Island DEW mean wind speed of 5.9 m/s was extrapolated to 30 meters (below) as further comparison. The extrapolated mean annual wind speed of 6.7 m/s is validates the AWS Truewind prediction of 6.73 m/s at the DEW station. Overall, agreement of the three wind assessment methods considered in this report – met tower, AWS Truepower, and Barter Island AWOS – is very good.
Kaktovik Wind-Diesel Analysis P a g e | 8
Barter Island DEW Station AWOS data
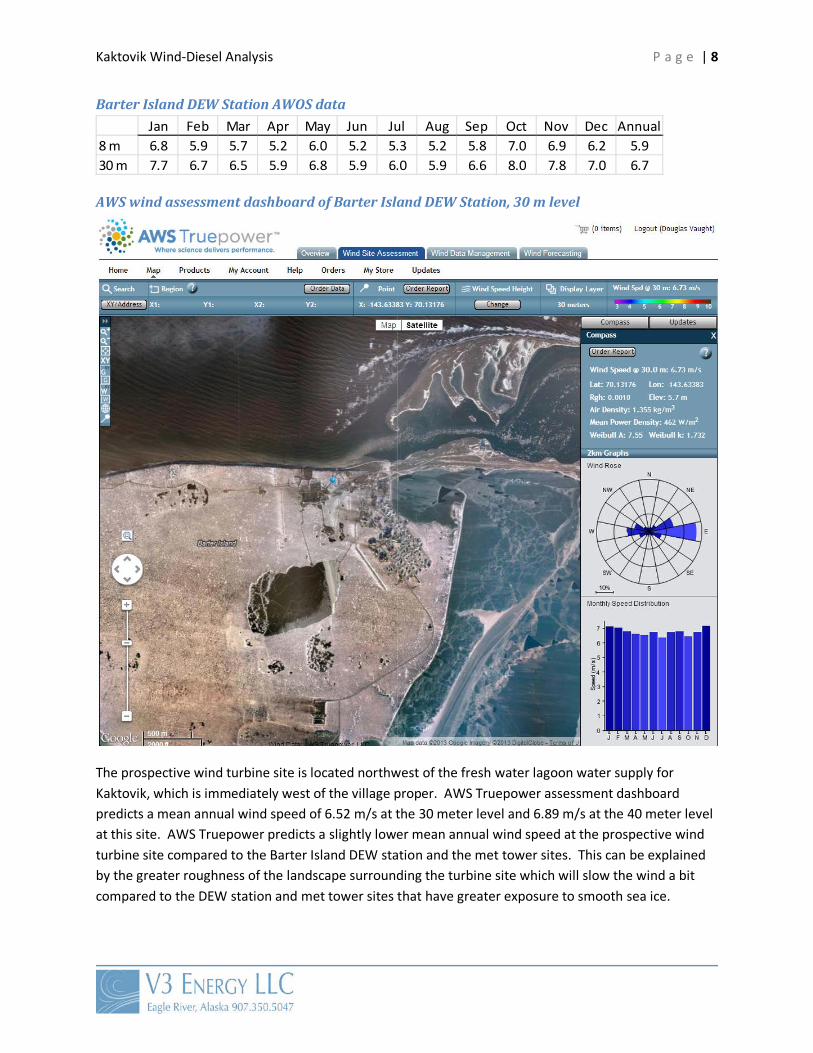
AWS wind assessment dashboard of Barter Island DEW Station, 30 m level
The prospective wind turbine site is located northwest of the fresh water lagoon water supply for Kaktovik, which is immediately west of the village proper. AWS Truepower assessment dashboard predicts a mean annual wind speed of 6.52 m/s at the 30 meter level and 6.89 m/s at the 40 meter level at this site. AWS Truepower predicts a slightly lower mean annual wind speed at the prospective wind turbine site compared to the Barter Island DEW station and the met tower sites. This can be explained by the greater roughness of the landscape surrounding the turbine site which will slow the wind a bit compared to the DEW station and met tower sites that have greater exposure to smooth sea ice.
Jan Feb Mar Apr May Jun Jul Aug Sep Oct Nov Dec Annual8 m 6.8 5.9 5.7 5.2 6.0 5.2 5.3 5.2 5.8 7.0 6.9 6.2 5.930 m 7.7 6.7 6.5 5.9 6.8 5.9 6.0 5.9 6.6 8.0 7.8 7.0 6.7
Kaktovik Wind-Diesel Analysis P a g e | 9
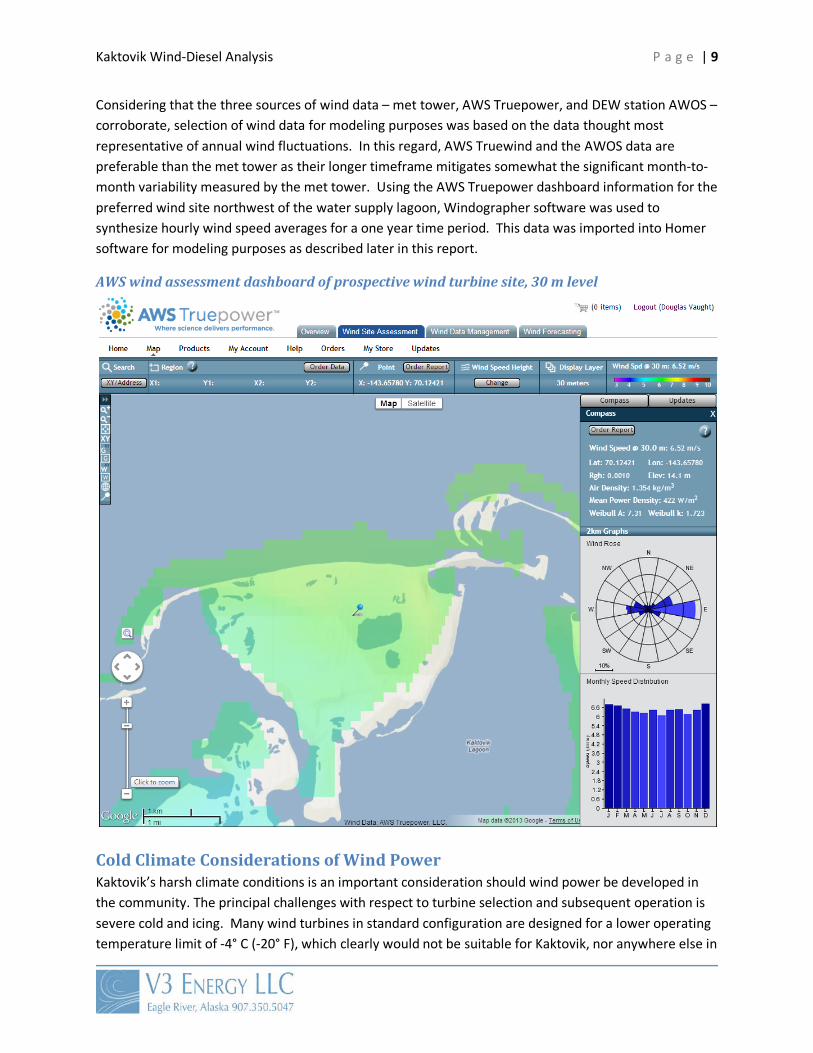
Considering that the three sources of wind data – met tower, AWS Truepower, and DEW station AWOS – corroborate, selection of wind data for modeling purposes was based on the data thought most representative of annual wind fluctuations. In this regard, AWS Truewind and the AWOS data are preferable than the met tower as their longer timeframe mitigates somewhat the significant month-to-month variability measured by the met tower. Using the AWS Truepower dashboard information for the preferred wind site northwest of the water supply lagoon, Windographer software was used to synthesize hourly wind speed averages for a one year time period. This data was imported into Homer software for modeling purposes as described later in this report.
AWS wind assessment dashboard of prospective wind turbine site, 30 m level
Cold Climate Considerations of Wind Power Kaktovik’s harsh climate conditions is an important consideration should wind power be developed in the community. The principal challenges with respect to turbine selection and subsequent operation is severe cold and icing. Many wind turbines in standard configuration are designed for a lower operating temperature limit of -4° C (-20° F), which clearly would not be suitable for Kaktovik, nor anywhere else in

Kaktovik Wind-Diesel Analysis P a g e | 10
Alaska. A number of wind turbine manufacturers offer their turbine in an “arctic” configuration which includes verification that structural and other system critical metal components are fatigue tested for severe cold capability. In addition, arctic-rated turbines are fitted with insulation and heaters in the nacelle and power electronics space to ensure proper operating temperatures. With an arctic rating, the lower temperature operating limit generally extends to -40° C (-40° F). On occasion during winter Kaktovik may experience temperatures colder than -40° C which would signal the wind turbines to stop. Temperatures below -40° C are relatively infrequent however and when they do occur, are generally accompanied by lighter winds.
A second aspect of concern regarding Kaktovik’s arctic climate is icing conditions. Atmospheric icing is a complex phenomenon characterized by astonishing variability and diversity of forms, density, and tenacity of frozen precipitation, some of which is harmless to wind turbine operations and others highly problematic. Although highly complex, with respect to wind turbines and aircraft five types of icing are recognized: clear ice, rime ice, mixed ice, frost ice, and SLD ice (Wikipedia.org/wiki/icing_conditions).
• Clear ice is often clear and smooth. Super-cooled water droplets, or freezing rain, strike a surface but do not freeze instantly. Forming mostly along the stagnation point on an airfoil, it generally conforms to the shape of the airfoil.
• Rime ice is rough and opaque, formed by super-cooled drops rapidly freezing on impact. Often "horns" or protrusions are formed and project into the airflow.
• Mixed ice is a combination of clear and rime ice. • Frost ice is the result of water freezing on unprotected surfaces. It often forms behind deicing
boots or heated leading edges of an airfoil and has been a factor airplane crashes. • SLD ice refers to ice formed in super-cooled large droplet (SLD) conditions. It is similar to clear
ice, but because droplet size is large, it often extends to unprotected parts of a wind turbine (or aircraft) and forms large ice shapes faster than normal icing conditions.
SLD ice on an airplane

Kaktovik Wind-Diesel Analysis P a g e | 11
Wind-Diesel Hybrid System Overview There are now over twenty-four wind-diesel projects in the state, making Alaska a world leader in wind-diesel hybrid technology. There are a variety of system configurations and turbine types in operation and accordingly there is a spectrum of success in all of these systems. As experience and statewide industry support has increased so has overall system performance. The following figure illustrates the locations of installed wind projects in Alaska.
Alaska wind-diesel projects
Wind-diesel Design Options Wind-diesel power systems are categorized based on their average penetration levels, or the overall proportion of wind-generated electricity compared to the total amount of electrical energy generated. Commonly used categories of wind-diesel penetration levels are low penetration, medium penetration, and high penetration. The wind penetration level is roughly equivalent to the amount of diesel fuel displaced by wind power. Note however that the higher the level of wind penetration, the more complex and expensive a control system and demand-management strategy is required. This is a good compromise between of displaced fuel usage and relatively minimal system complexity and is AVEC’s preferred system configuration.
Low Penetration Configuration Low-penetration wind-diesel systems require the fewest modifications to the existing system. However, they tend to be less economical for village installations due to the limited annual fuel savings compared to the total wind system installation costs.
Kaktovik Wind-Diesel Analysis P a g e | 12
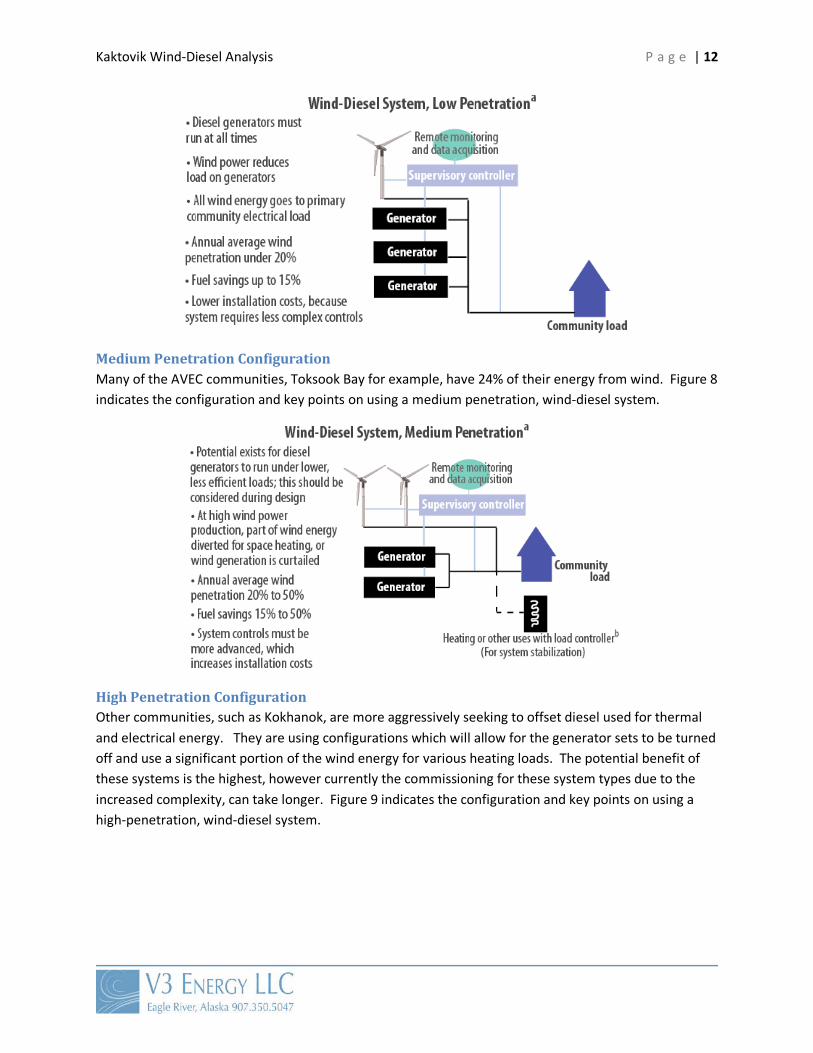
Medium Penetration Configuration Many of the AVEC communities, Toksook Bay for example, have 24% of their energy from wind. Figure 8 indicates the configuration and key points on using a medium penetration, wind-diesel system.
High Penetration Configuration Other communities, such as Kokhanok, are more aggressively seeking to offset diesel used for thermal and electrical energy. They are using configurations which will allow for the generator sets to be turned off and use a significant portion of the wind energy for various heating loads. The potential benefit of these systems is the highest, however currently the commissioning for these system types due to the increased complexity, can take longer. Figure 9 indicates the configuration and key points on using a high-penetration, wind-diesel system.

Kaktovik Wind-Diesel Analysis P a g e | 13
The above system descriptions can be summarized in Table 2 below. The level of instantaneous penetration is important for power quality design considerations. The annual amount of wind energy on the system is considered the average penetration level and helps to provide a picture of the overall economic benefit.
Categories of wind-diesel penetration levels Penetration
Category Wind Penetration Level
Operating Characteristics and System Requirements Instantaneous Average Very Low <60% <8% • Diesel generator(s) runs full time
• Wind power reduces net load on diesel • All wind energy serves primary load • No supervisory control system
Low 60 to 120% 8 to 20% • Diesel generator(s) runs full time • At high wind power levels, secondary loads are
dispatched to insure sufficient diesel loading, or wind generation is curtailed
• Relatively simple control system Medium 120 to 300% 20 to 50% • Diesel generator(s) runs full time
• At medium to high wind power levels, secondary loads are dispatched to insure sufficient diesel loading
• At high wind power levels, complex secondary load control system is needed to ensure heat loads do not become saturated
• Sophisticated control system

Kaktovik Wind-Diesel Analysis P a g e | 14
Penetration Category
Wind Penetration Level Operating Characteristics and System Requirements Instantaneous Average
High (Diesels-off
Capable)
300+% 50 to 150% • At high wind power levels, diesel generator(s) may be shut down for diesels-off capability
• Auxiliary components required to regulate voltage and frequency
• Sophisticated control system
Wind-Diesel System Components Listed below are the main components of a medium to high-penetration wind-diesel system:
• Wind turbine(s), plus tower and foundation • Supervisory control system • Synchronous condenser • Secondary load • Deferrable load • Interruptible load • Storage
Wind Turbine(s) Village-scale wind turbines are generally considered to be 50 kW to 250 kW rated output capacity. This turbine size once dominated with worldwide wind power industry but has been left behind in favor of much larger 1,000 kW plus capacity turbines. Conversely, many turbines are manufactured for home or farm application, but generally these are 10 kW capacity or less. Consequently, few new village size-class turbines are on the market, although a large supply of used and/or remanufactured turbines are available. The latter typically result from repowering older wind farms with new, larger wind turbines.
Supervisory Control System Medium- and high-penetration wind-diesel systems require fast-acting real and reactive power management to compensate for rapid variation in village load and wind turbine power output. A wind-diesel system master controller, also called a supervisory controller, would be installed inside the Kaktovik power plant or in a new module adjacent to it. The supervisory controller would select the optimum system configuration based on village load demand and available wind power.
Synchronous Condenser A synchronous condenser, sometimes called a synchronous compensator, is a specialized synchronous electric motor with an output shaft that spins freely. Its excitation field is controlled by a voltage regulator to either generate or absorb reactive power as needed to support the grid voltage or to maintain the grid power factor at a specified level. Grid power factor and voltage support is essential for a wind-diesel system’s reliability.
For the Kaktovik power system, a synchronous condenser may be an economical option for voltage and reactive power support.
Kaktovik Wind-Diesel Analysis P a g e | 15
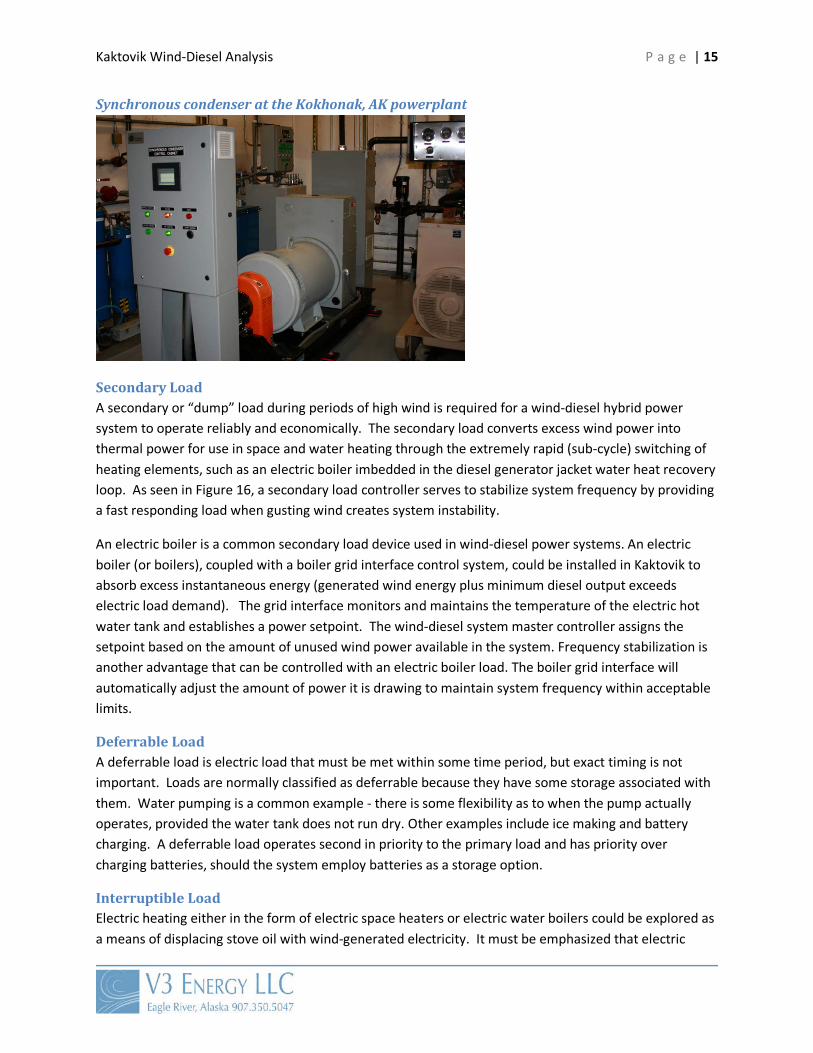
Synchronous condenser at the Kokhonak, AK powerplant
Secondary Load A secondary or “dump” load during periods of high wind is required for a wind-diesel hybrid power system to operate reliably and economically. The secondary load converts excess wind power into thermal power for use in space and water heating through the extremely rapid (sub-cycle) switching of heating elements, such as an electric boiler imbedded in the diesel generator jacket water heat recovery loop. As seen in Figure 16, a secondary load controller serves to stabilize system frequency by providing a fast responding load when gusting wind creates system instability.
An electric boiler is a common secondary load device used in wind-diesel power systems. An electric boiler (or boilers), coupled with a boiler grid interface control system, could be installed in Kaktovik to absorb excess instantaneous energy (generated wind energy plus minimum diesel output exceeds electric load demand). The grid interface monitors and maintains the temperature of the electric hot water tank and establishes a power setpoint. The wind-diesel system master controller assigns the setpoint based on the amount of unused wind power available in the system. Frequency stabilization is another advantage that can be controlled with an electric boiler load. The boiler grid interface will automatically adjust the amount of power it is drawing to maintain system frequency within acceptable limits.
Deferrable Load A deferrable load is electric load that must be met within some time period, but exact timing is not important. Loads are normally classified as deferrable because they have some storage associated with them. Water pumping is a common example - there is some flexibility as to when the pump actually operates, provided the water tank does not run dry. Other examples include ice making and battery charging. A deferrable load operates second in priority to the primary load and has priority over charging batteries, should the system employ batteries as a storage option.
Interruptible Load Electric heating either in the form of electric space heaters or electric water boilers could be explored as a means of displacing stove oil with wind-generated electricity. It must be emphasized that electric
Kaktovik Wind-Diesel Analysis P a g e | 16
heating is only economically viable with excess electricity generated by a renewable energy source such as wind and not from diesel-generated power. It is typically assumed that 40 kWh of electric heat is equivalent to one gallon of heating fuel oil.
Storage Options Electrical energy storage provides a means of storing wind generated power during periods of high winds and then releasing the power as winds subside. Energy storage has a similar function to a secondary load but the stored, excess wind energy can be converted back to electric power at a later time. There is an efficiency loss with the conversion of power to storage and out of storage. The descriptions below are informative but are not currently part of the overall system design.
Flywheels A flywheel energy system has the capability of short-term energy storage to further smooth out short-term variability of wind power, and has the additional advantage of frequency regulation. The smallest capacity flywheel available from Powercorp (now ABB), however, is 500 kW capacity, so it is only suitable for large village power generation systems.
Batteries Battery storage is a generally well-proven technology and has been used in Alaskan power systems including Fairbanks (Golden Valley Electric Association), Wales and Kokhanok, but with mixed results in the smaller communities. Batteries are most appropriate for providing medium-term energy storage to allow a transition, or bridge, between the variable output of wind turbines and diesel generation. This “bridging” period is typically 5 to 15 minutes long. Storage for several hours or days is also possible with batteries, but this requires higher capacity and cost. In general, the disadvantages of batteries for utility-scale energy storage, even for small utility systems, are high capital and maintenance costs and limited lifetime. Of particular concern to rural Alaska communities is that batteries are heavy and expensive ship and most contain hazardous substances that require special removal from the village at end of service life and disposal in specially-equipped recycling centers.
There are a wide variety of battery types with different operating characteristics. Advanced lead acid and zinc-bromide flow batteries were identified as “technologically simple” energy storage options appropriate for rural Alaska in an Alaska Center for Energy and Power (ACEP) July, 2009 report on energy storage. Nickel-cadmium (NiCad) batteries have been used in rural Alaska applications such as the Wales wind-diesel system. Advantages of NiCad batteries compared to lead-acid batteries include a deeper discharge capability, lighter weight, higher energy density, a constant output voltage, and much better performance during cold temperatures. However, NiCads are considerably more expensive than lead-acid batteries and one must note that the Wales wind-diesel system had a poor operational history and has not been functional for over ten years.
Because batteries operate on direct current (DC), a converter is required to charge or discharge when connected to an alternating current (AC) system. A typical battery storage system would include a bank of batteries and a power conversion device. The batteries would be wired for a nominal voltage of roughly 300 volts. Individual battery voltages on a large scale system are typically 1.2 volts DC. Recent

Kaktovik Wind-Diesel Analysis P a g e | 17
advances in power electronics have made solid state inverter/converter systems cost effective and preferable a power conversion device. The Kokhanok wind-diesel system is designed with a 300 volts DC battery bank coupled to a grid-forming power converter for production of utility-grade real and reactive power. Following some design and commissioning delays, the solid state converter system in Kokhanok should be operational by late 2013 and will be monitored closely for reliability and effectiveness.
Wind Turbine Options The most significant factor with respect to choice of wind turbines for Kaktovik is the height limitation dictated by the proximity of the prospective wind turbine site to the new airport. This height limitation eliminates consideration of larger wind turbines that would potentially be suitable, such as the 900 kW Emergya Wind Technologies DW 52-900 wind turbine presently operational in Kotzebue or the 500 kW Vestas V39 wind turbine operational in Sandpoint.
Turbine choice therefore was oriented turbines that are large enough to match well with the Kaktovik load but not so large to exceed FAA height restrictions with respect to the new airport. Turbines that meet these criteria are generally in the 100 to 250 kW size range. The wind power industry, however, does not provide many options as village wind power is a small market worldwide compared to utility grid-connected projects where wind turbines are 1,000 kW and larger capacity, or home and farm applications where wind turbines are generally 10 kW or less capacity. For this project, three wind turbines are considered:
1. Aeronautica AW 29-225: 225 kW rated output; new 2. Northern Power Systems 100-21, 100 kW rated output; new 3. Vestas V27: 225 kW rated output; remanufactured
The choice of selecting new or remanufactured wind turbines is an important consideration and one which North Slope Borough will want to consider carefully. There are advantages and potential disadvantages of each, including cost, support and parts availability. Note however that the three wind turbines presented in this report have solid track records and very good support capacity within Alaska.
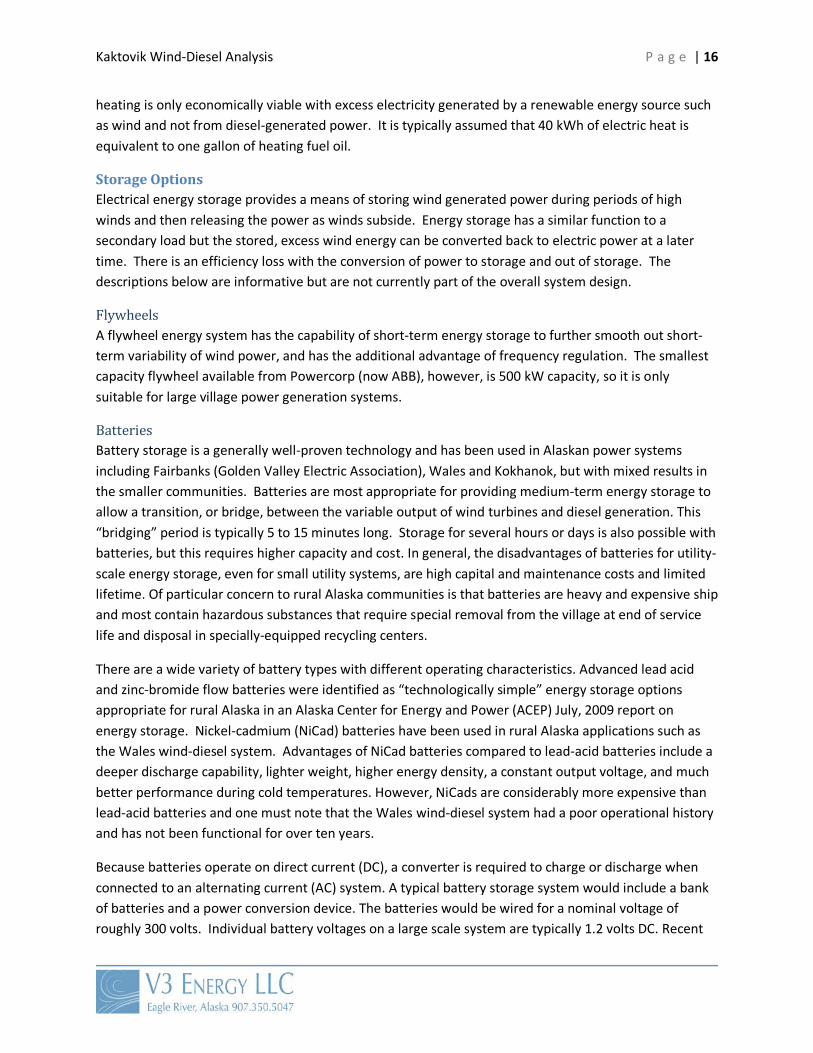
Aeronautica 29-225 The Aeronautica AW29-225 wind turbine is manufactured new by Aeronautica in Durham, New Hampshire. This turbine was originally designed by the Danish-manufacturer Norwin in the 1980’s and had a long and successful history in the wind industry before being replaced by larger capacity turbines for utility-scale grid-connect installations. The AW29-225 turbine is stall-regulated, has a synchronous (induction) generator, active yaw control, a 29 meter diameter rotor, is rated at 225 kW power output, and is available with 30, 40, or 50 meter tubular steel towers. The AW29-225 is fully arctic-climate certified to -40° C and is new to the Alaska market with no in-state installations at present. More information can be found at http://aeronauticawind.com/aw/index.html.
Kaktovik Wind-Diesel Analysis P a g e | 18
Aeronautica AW 29-225 wind turbine
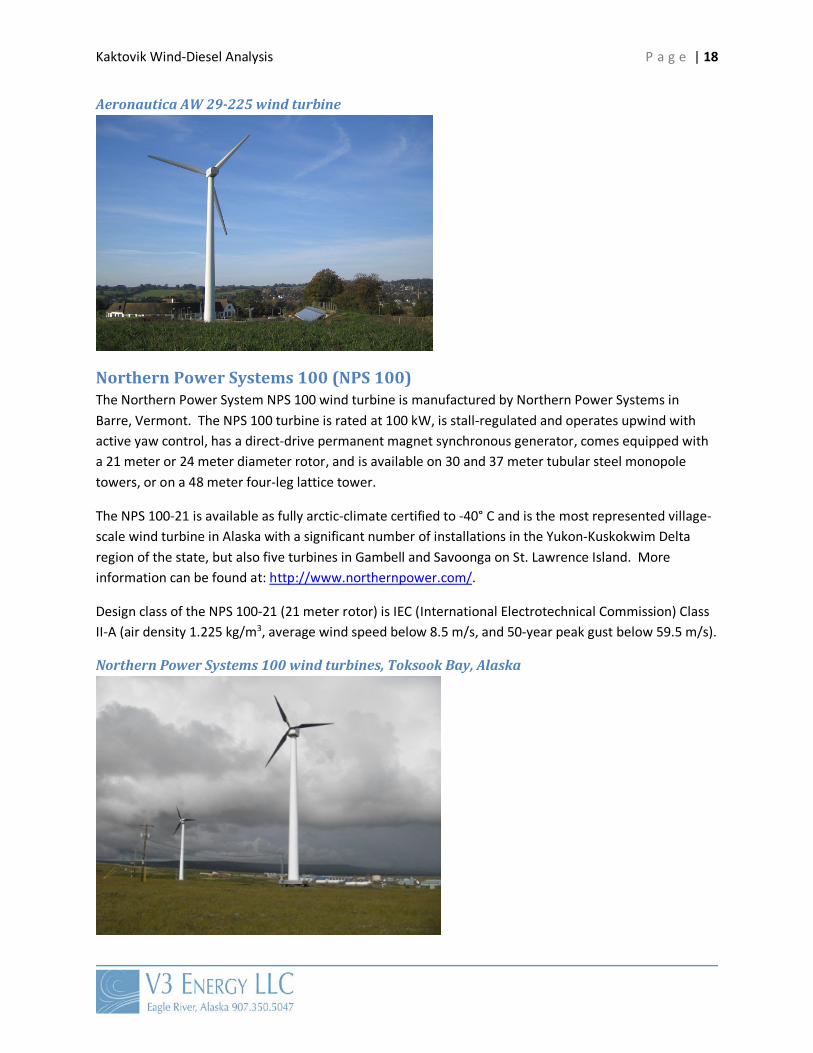
Northern Power Systems 100 (NPS 100) The Northern Power System NPS 100 wind turbine is manufactured by Northern Power Systems in Barre, Vermont. The NPS 100 turbine is rated at 100 kW, is stall-regulated and operates upwind with active yaw control, has a direct-drive permanent magnet synchronous generator, comes equipped with a 21 meter or 24 meter diameter rotor, and is available on 30 and 37 meter tubular steel monopole towers, or on a 48 meter four-leg lattice tower.
The NPS 100-21 is available as fully arctic-climate certified to -40° C and is the most represented village-scale wind turbine in Alaska with a significant number of installations in the Yukon-Kuskokwim Delta region of the state, but also five turbines in Gambell and Savoonga on St. Lawrence Island. More information can be found at: http://www.northernpower.com/.
Design class of the NPS 100-21 (21 meter rotor) is IEC (International Electrotechnical Commission) Class II-A (air density 1.225 kg/m3, average wind speed below 8.5 m/s, and 50-year peak gust below 59.5 m/s).
Northern Power Systems 100 wind turbines, Toksook Bay, Alaska
Kaktovik Wind-Diesel Analysis P a g e | 19
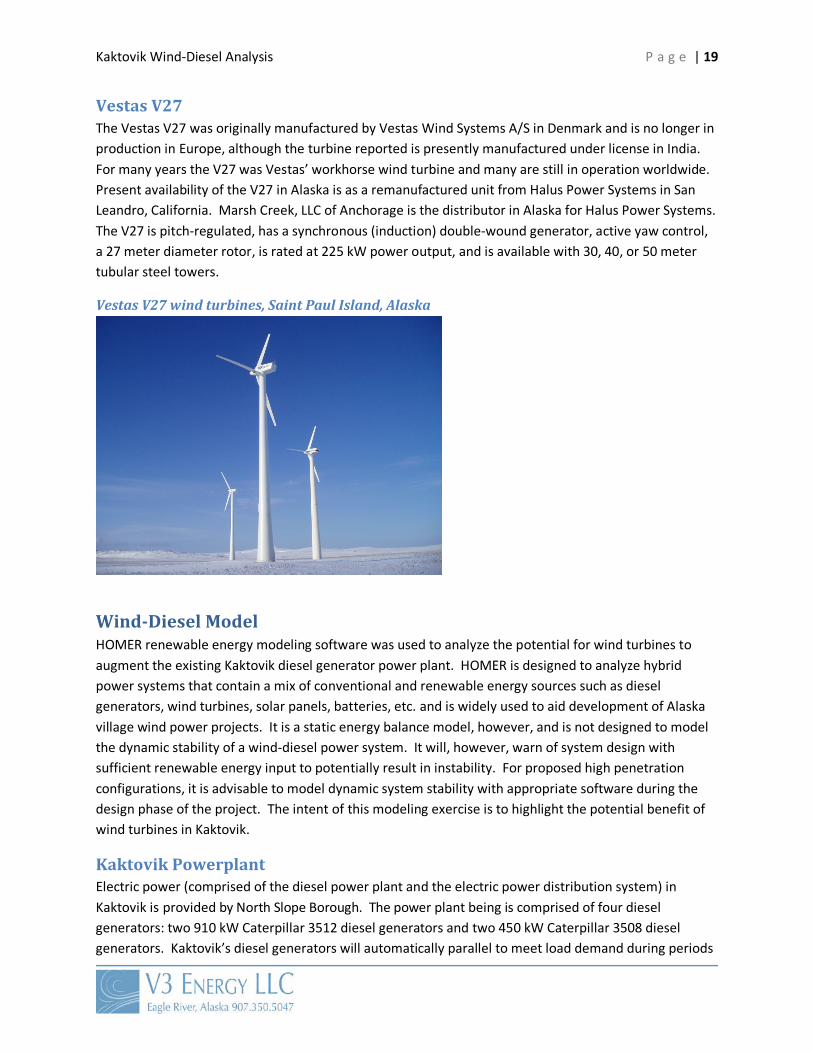
Vestas V27 The Vestas V27 was originally manufactured by Vestas Wind Systems A/S in Denmark and is no longer in production in Europe, although the turbine reported is presently manufactured under license in India. For many years the V27 was Vestas’ workhorse wind turbine and many are still in operation worldwide. Present availability of the V27 in Alaska is as a remanufactured unit from Halus Power Systems in San Leandro, California. Marsh Creek, LLC of Anchorage is the distributor in Alaska for Halus Power Systems. The V27 is pitch-regulated, has a synchronous (induction) double-wound generator, active yaw control, a 27 meter diameter rotor, is rated at 225 kW power output, and is available with 30, 40, or 50 meter tubular steel towers.
Vestas V27 wind turbines, Saint Paul Island, Alaska
Wind-Diesel Model HOMER renewable energy modeling software was used to analyze the potential for wind turbines to augment the existing Kaktovik diesel generator power plant. HOMER is designed to analyze hybrid power systems that contain a mix of conventional and renewable energy sources such as diesel generators, wind turbines, solar panels, batteries, etc. and is widely used to aid development of Alaska village wind power projects. It is a static energy balance model, however, and is not designed to model the dynamic stability of a wind-diesel power system. It will, however, warn of system design with sufficient renewable energy input to potentially result in instability. For proposed high penetration configurations, it is advisable to model dynamic system stability with appropriate software during the design phase of the project. The intent of this modeling exercise is to highlight the potential benefit of wind turbines in Kaktovik.
Kaktovik Powerplant Electric power (comprised of the diesel power plant and the electric power distribution system) in Kaktovik is provided by North Slope Borough. The power plant being is comprised of four diesel generators: two 910 kW Caterpillar 3512 diesel generators and two 450 kW Caterpillar 3508 diesel generators. Kaktovik’s diesel generators will automatically parallel to meet load demand during periods

Kaktovik Wind-Diesel Analysis P a g e | 20
of high power usage. Via a review of the powerplant operational records, a typical operational configuration is one Cat 3512 and one Cat 3508 on-line.
Diesel Generators For purposes of modeling, the Kaktovik diesel generators are assigned bays (or positions) 1 through 4 in the power house, although note that position of generators in the actual power house may be different. Bays 1 and 2 are for the two 910 kW Caterpillar 3512 marine diesels and bays 3 and 4 are the smaller 450 kW Caterpillar 3508C marine diesels.
New powerplant diesel generators in Homer model Generator Diesel Engine Model Generator Electrical Rating Heat Recovery
1 Caterpillar 3512 Leroy-Sommer SR4 910 kW Jacket water 2 Caterpillar 3512 Leroy-Sommer SR4 910 kW Jacket water 3 Caterpillar 3508 Leroy-Sommer SR4 450 kW Jacket water 4 Caterpillar 3508 Leroy-Sommer SR4 450 kW Jacket water
Diesel generator HOMER modeling information Diesel generator Cat 3512 Cat 3508 Power output (kW) 910 450 Intercept coeff. (L/hr/kW rated) 0.02029 0.02184 Slope (L/hr/kW output) 0.2328 0.2378 Minimum electric load (%)
15.0% (135 kW)
15.0% (67 kW)
Heat recovery ratio (% of generator waste heat energy available to serve the thermal load; when modeled)
40 40
Notes: Intercept coefficient – the no-load fuel consumption of the generator divided by its capacity Slope – the marginal fuel consumption of the generator
Caterpillar 3512 Diesel Generator The graphs below illustrate fuel usage and consequent electrical and thermal efficiency of the Cat 3512 diesel generator used in Homer modeling. Note that NSB did not report a seasonal or other specific scheduling plan, hence Homer software was programmed to select the most efficient diesel for any time period. Also note that Homer was programmed to allow parallel diesel generator operation, although this was not specifically verified.
Cat 3512 fuel curve Cat 3512 electrical energy efficiency curve

Kaktovik Wind-Diesel Analysis P a g e | 21
Cat 3512 electrical and thermal energy efficiency curve
Caterpillar 3508 Diesel Generator The graphs below illustrate fuel usage and consequent electrical and thermal efficiency of the Cat 3508 diesel generator used in Homer modeling. Note again that NSB did not report a seasonal or other specific scheduling plan, hence Homer software was programmed to select the most efficient diesel for any time period.
Cat 3508 fuel curve Cat 3508 electrical energy efficiency curve
Cat 3508 electrical and thermal energy efficiency curve
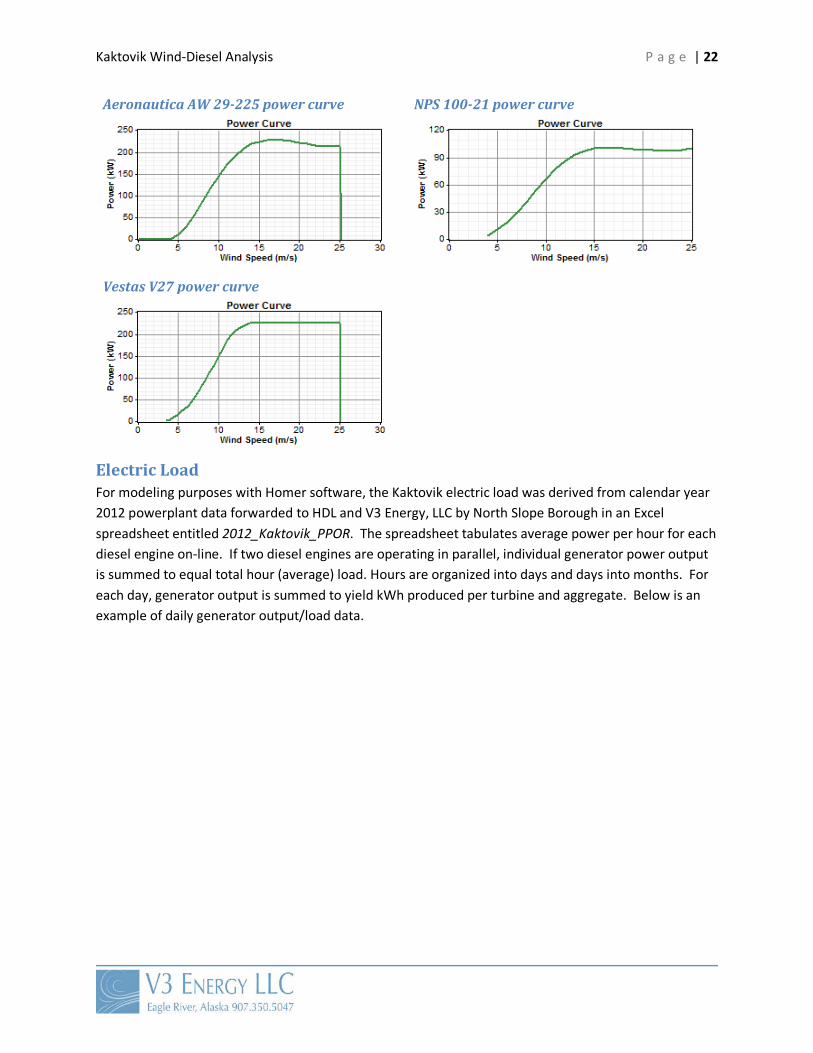
Wind Turbines Wind turbine options for Kaktovik are discussed previously in this report. For Homer modeling, standard temperature and pressure (STP) power curves were used. This is quite conservative in that actual turbine power production in Kaktovik will typically be higher than predicted by the STP power curves due to the cold temperature climate and consequent high air density of the area.
Kaktovik Wind-Diesel Analysis P a g e | 22
Aeronautica AW 29-225 power curve NPS 100-21 power curve
Vestas V27 power curve
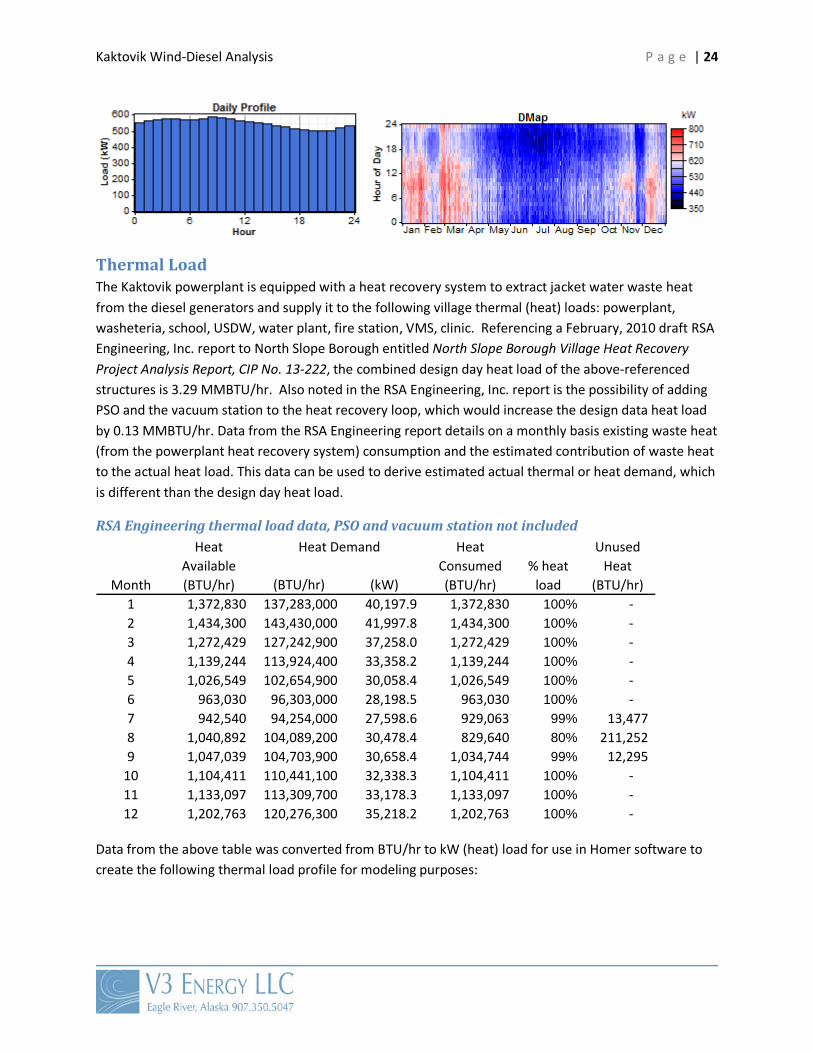
Electric Load For modeling purposes with Homer software, the Kaktovik electric load was derived from calendar year 2012 powerplant data forwarded to HDL and V3 Energy, LLC by North Slope Borough in an Excel spreadsheet entitled 2012_Kaktovik_PPOR. The spreadsheet tabulates average power per hour for each diesel engine on-line. If two diesel engines are operating in parallel, individual generator power output is summed to equal total hour (average) load. Hours are organized into days and days into months. For each day, generator output is summed to yield kWh produced per turbine and aggregate. Below is an example of daily generator output/load data.

Kaktovik Wind-Diesel Analysis P a g e | 23
Kaktovik powerplant data, 1/3/2012
For Homer input, load data is organized into 8,760 lines, representing 24 hours per day for 365 days per year. In a number of instances diesel generator power (load) data was missing from the data set. In these cases, missing data was filled by interpolating from before and after the blank sections. The graphs below show a summary of the Kaktovik load from the powerplant data.
Kaktovik electric load
Engine 1Caterpillar 3512
Serial # 67Z01838
Engine 2Caterpillar 3512
Serial # 67Z01839
Engine 3Caterpillar 3508
Serial # 70Z01055
Engine 4Caterpillar 3508
Serial # 70Z01054
Total Load Total Load Total Load Total Load0:00 345 242 587 6891:00 387 245 6322:00 385 246 6313:00 388 250 6384:00 389 245 6345:00 408 245 6536:00 400 245 6457:00 410 247 6578:00 440 242 6829:00 446 243 68910:00 385 245 63011:00 383 246 62912:00 416 250 66613:00 393 245 63814:00 385 244 62915:00 371 242 61316:00 383 245 62817:00 372 235 60718:00 343 244 58719:00 327 241 56820:00 326 242 56821:00 326 240 56622:00 330 241 57123:00 351 244 595Total 9,089 0 0 5,854 14,943
Kaktovik Power PlantJanuary 3, 2012
Total Hourly Load
Peak Load of the DayHour
Kaktovik Wind-Diesel Analysis P a g e | 24
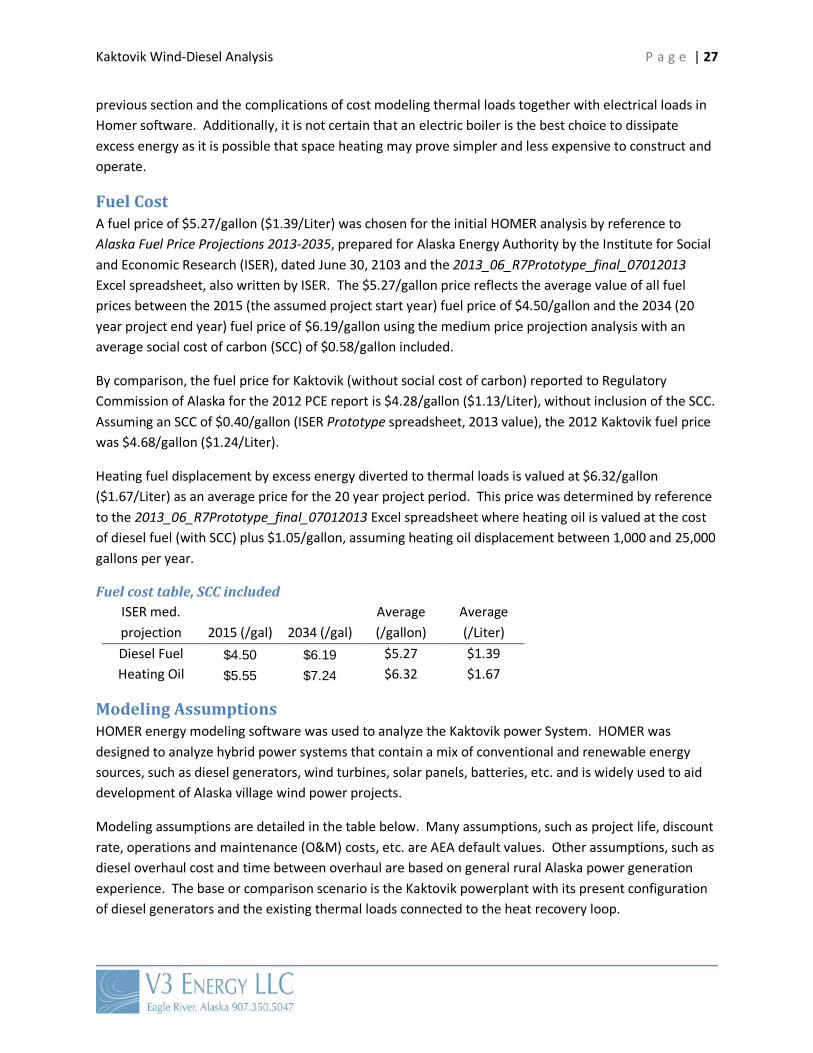
Thermal Load The Kaktovik powerplant is equipped with a heat recovery system to extract jacket water waste heat from the diesel generators and supply it to the following village thermal (heat) loads: powerplant, washeteria, school, USDW, water plant, fire station, VMS, clinic. Referencing a February, 2010 draft RSA Engineering, Inc. report to North Slope Borough entitled North Slope Borough Village Heat Recovery Project Analysis Report, CIP No. 13-222, the combined design day heat load of the above-referenced structures is 3.29 MMBTU/hr. Also noted in the RSA Engineering, Inc. report is the possibility of adding PSO and the vacuum station to the heat recovery loop, which would increase the design data heat load by 0.13 MMBTU/hr. Data from the RSA Engineering report details on a monthly basis existing waste heat (from the powerplant heat recovery system) consumption and the estimated contribution of waste heat to the actual heat load. This data can be used to derive estimated actual thermal or heat demand, which is different than the design day heat load.
RSA Engineering thermal load data, PSO and vacuum station not included
Data from the above table was converted from BTU/hr to kW (heat) load for use in Homer software to create the following thermal load profile for modeling purposes:
Month (BTU/hr) (kW)1 1,372,830 137,283,000 40,197.9 1,372,830 100% - 2 1,434,300 143,430,000 41,997.8 1,434,300 100% - 3 1,272,429 127,242,900 37,258.0 1,272,429 100% - 4 1,139,244 113,924,400 33,358.2 1,139,244 100% - 5 1,026,549 102,654,900 30,058.4 1,026,549 100% - 6 963,030 96,303,000 28,198.5 963,030 100% - 7 942,540 94,254,000 27,598.6 929,063 99% 13,477 8 1,040,892 104,089,200 30,478.4 829,640 80% 211,252 9 1,047,039 104,703,900 30,658.4 1,034,744 99% 12,295
10 1,104,411 110,441,100 32,338.3 1,104,411 100% - 11 1,133,097 113,309,700 33,178.3 1,133,097 100% - 12 1,202,763 120,276,300 35,218.2 1,202,763 100% -
Heat Available (BTU/hr)
Heat Consumed (BTU/hr)
% heat load
Unused Heat
(BTU/hr)
Heat Demand

Kaktovik Wind-Diesel Analysis P a g e | 25
Kaktovik thermal load
Wind Turbine Configuration Options Discussions between HDL and North Slope Borough have indicated that the borough’s goals with a wind-diesel system in Kaktovik is to offset a significant percentage of fuel used in the powerplant, but not create a highly complex system with significant thermal offset and/or electrical storage capability. This philosophy dictates a medium penetration design approach (see previous section of this report) where wind power supplies 20 to 50 percent of the electric load, but at least one diesel generator is always on-line to provide spinning reserve and control grid frequency. Medium penetration design does, though, mean that instantaneous wind power will at times be well over 100 percent of the load. This can result in unstable grid frequency, which can occur when electrical power generated exceeds the load demand. In a wind-diesel power system without electrical storage, there are two options to prevent this possibility:
1. Curtail one or more wind turbines to prevent instantaneous wind penetration from exceeding 100 percent (one must also account for minimum loading of the diesel generator).
2. Install a secondary load controller with a resistive heater. The secondary load controller is the fast-acting switching mechanism commanding heating elements to turn on and off to order to maintain stable frequency. The resistive heater can be as simple as a heater ejecting energy to the atmosphere or an interior air space or, more desirably, a boiler serving one or more thermal loads. The boiler can be installed in the powerplant heat recovery loop and operated in parallel with fuel oil boilers.
In either case, system frequency control features are necessary in medium penetration design as, generally speaking, the diesel generator paralleled with the wind turbines during periods of high wind energy input may not have sufficient inertia to control frequency by itself. This design philosophy is typical of most wind-diesel systems presently operational in Alaska and provides a solid compromise

Kaktovik Wind-Diesel Analysis P a g e | 26
between the minimal benefit of low penetration wind systems and the cost and complexity of high penetration wind systems.
Many utilities prefer to install more than one wind turbine in a village wind power project to provide redundancy and continued renewable energy generation should one turbine be out-of-service for maintenance or other reasons. With this guideline in mind, and referencing the medium wind power penetration design philosophy discussed above, modeled wind turbine configuration options considered in this report are as follows:
• Aeronautica AW 29-225, three turbines (675 kW capacity) • Northern Power NPS 100-21, seven turbines (400 kW to 700 kW capacity) • Vestas 27, three turbines (675 kW capacity)
Turbine types are not mixed, however, as it is assumed that North Slope Borough will select only one type of wind turbine. A typical configuration for this project is show below. Note that turbine type can be switched from the AW 29-225 (shown) to the NPS 100-21 or V27.
Wind-diesel configuration for Kaktovik
Economic Analysis Installation of wind turbines in medium penetration mode is evaluated in this report to demonstrate the economic impact of these turbines with the following configuration philosophy: turbines are connected to the electrical distribution system to serve the electrical load. Although system configuration will require a secondary load controller and an electric heater or boiler to divert excess electrical power, the offset of thermal load(s) via a secondary load controller is not modeled in this report. This is due to the relatively small amount of excess energy produced by the wind turbine configurations described in the
Kaktovik Wind-Diesel Analysis P a g e | 27
previous section and the complications of cost modeling thermal loads together with electrical loads in Homer software. Additionally, it is not certain that an electric boiler is the best choice to dissipate excess energy as it is possible that space heating may prove simpler and less expensive to construct and operate.
Fuel Cost A fuel price of $5.27/gallon ($1.39/Liter) was chosen for the initial HOMER analysis by reference to Alaska Fuel Price Projections 2013-2035, prepared for Alaska Energy Authority by the Institute for Social and Economic Research (ISER), dated June 30, 2103 and the 2013_06_R7Prototype_final_07012013 Excel spreadsheet, also written by ISER. The $5.27/gallon price reflects the average value of all fuel prices between the 2015 (the assumed project start year) fuel price of $4.50/gallon and the 2034 (20 year project end year) fuel price of $6.19/gallon using the medium price projection analysis with an average social cost of carbon (SCC) of $0.58/gallon included.
By comparison, the fuel price for Kaktovik (without social cost of carbon) reported to Regulatory Commission of Alaska for the 2012 PCE report is $4.28/gallon ($1.13/Liter), without inclusion of the SCC. Assuming an SCC of $0.40/gallon (ISER Prototype spreadsheet, 2013 value), the 2012 Kaktovik fuel price was $4.68/gallon ($1.24/Liter).
Heating fuel displacement by excess energy diverted to thermal loads is valued at $6.32/gallon ($1.67/Liter) as an average price for the 20 year project period. This price was determined by reference to the 2013_06_R7Prototype_final_07012013 Excel spreadsheet where heating oil is valued at the cost of diesel fuel (with SCC) plus $1.05/gallon, assuming heating oil displacement between 1,000 and 25,000 gallons per year.
Fuel cost table, SCC included ISER med. projection 2015 (/gal) 2034 (/gal)
Average (/gallon)
Average (/Liter)
Diesel Fuel $4.50 $6.19 $5.27 $1.39 Heating Oil $5.55 $7.24 $6.32 $1.67
Modeling Assumptions HOMER energy modeling software was used to analyze the Kaktovik power System. HOMER was designed to analyze hybrid power systems that contain a mix of conventional and renewable energy sources, such as diesel generators, wind turbines, solar panels, batteries, etc. and is widely used to aid development of Alaska village wind power projects.
Modeling assumptions are detailed in the table below. Many assumptions, such as project life, discount rate, operations and maintenance (O&M) costs, etc. are AEA default values. Other assumptions, such as diesel overhaul cost and time between overhaul are based on general rural Alaska power generation experience. The base or comparison scenario is the Kaktovik powerplant with its present configuration of diesel generators and the existing thermal loads connected to the heat recovery loop.
Kaktovik Wind-Diesel Analysis P a g e | 28
Modeling assumes that wind turbines constructed in Kaktovik would operate in parallel with the diesel generators. Although excess energy could serve thermal loads via a secondary load controller and electric boiler that would augment the existing jacket water heat recovery system, it is not modeled as such. Installation cost of this turbine project assumes three-phase upgrade of the distribution system to the wind turbine site.
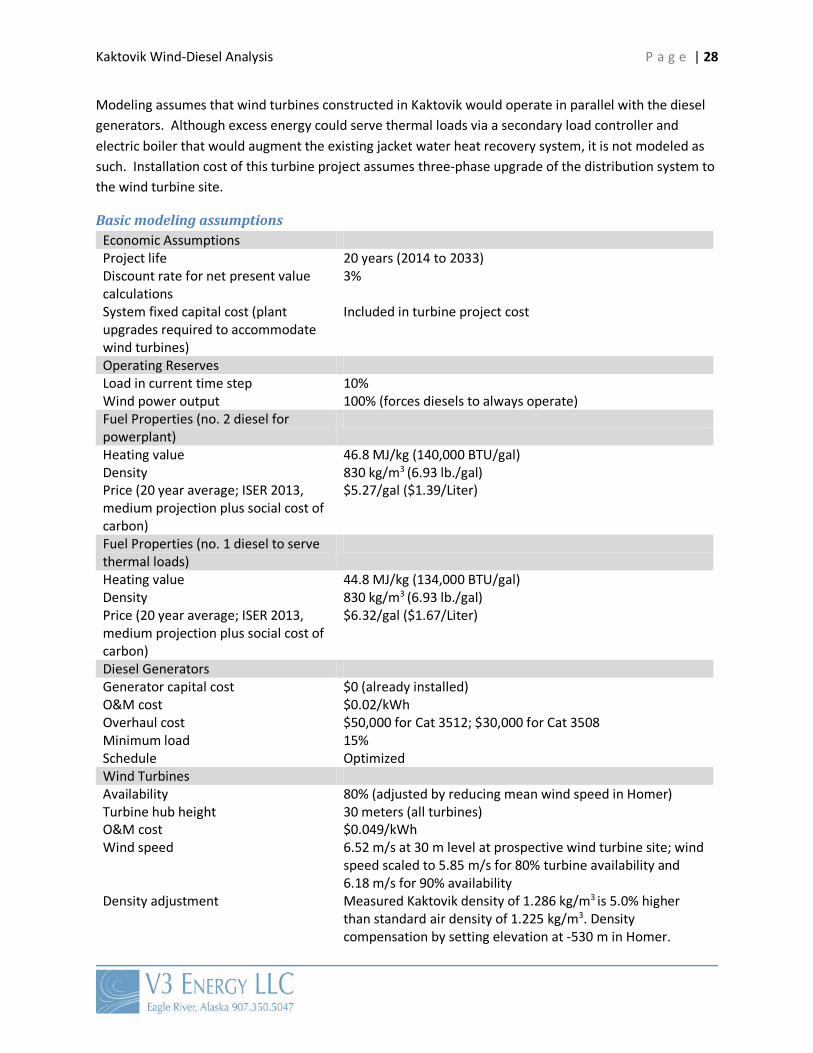
Basic modeling assumptions Economic Assumptions Project life 20 years (2014 to 2033) Discount rate for net present value calculations
3%
System fixed capital cost (plant upgrades required to accommodate wind turbines)
Included in turbine project cost
Operating Reserves Load in current time step 10% Wind power output 100% (forces diesels to always operate) Fuel Properties (no. 2 diesel for powerplant)
Heating value 46.8 MJ/kg (140,000 BTU/gal) Density 830 kg/m3 (6.93 lb./gal) Price (20 year average; ISER 2013, medium projection plus social cost of carbon)
$5.27/gal ($1.39/Liter)
Fuel Properties (no. 1 diesel to serve thermal loads)
Heating value 44.8 MJ/kg (134,000 BTU/gal) Density 830 kg/m3 (6.93 lb./gal) Price (20 year average; ISER 2013, medium projection plus social cost of carbon)
$6.32/gal ($1.67/Liter)
Diesel Generators Generator capital cost $0 (already installed) O&M cost $0.02/kWh Overhaul cost $50,000 for Cat 3512; $30,000 for Cat 3508 Minimum load 15% Schedule Optimized Wind Turbines Availability 80% (adjusted by reducing mean wind speed in Homer) Turbine hub height 30 meters (all turbines) O&M cost $0.049/kWh Wind speed 6.52 m/s at 30 m level at prospective wind turbine site; wind
speed scaled to 5.85 m/s for 80% turbine availability and 6.18 m/s for 90% availability
Density adjustment Measured Kaktovik density of 1.286 kg/m3 is 5.0% higher than standard air density of 1.225 kg/m3. Density compensation by setting elevation at -530 m in Homer.

Kaktovik Wind-Diesel Analysis P a g e | 29
Energy Loads Electric 13,124 kWh/day mean annual electrical load Thermal 12,110 kWh/day mean annual available via recovered heat
loop Fuel oil boiler efficiency 85% Electric boiler efficiency 100%
Wind Turbine Project Costs Construction cost for wind turbine installation and integration with the diesel power plant would be determined with high degree of accuracy during the design phase of the project. Note that costs listed below are estimates.
Wind Turbine Costs
Turbine No.
Turbines
HDL’s Estimated
Project Cost Installed
kW
Cost per kW
Capacity Tower Type
Tower Height
(meters) Aeronautica AW29-225 3 $7,815,795 675 $11,579 Monopole 30 Northern Power NPS100-21 7 $11,312,500 700 $16,161 Monopole 30 Vestas V27 3 $7,122,795 675 $10,552 Monopole 30
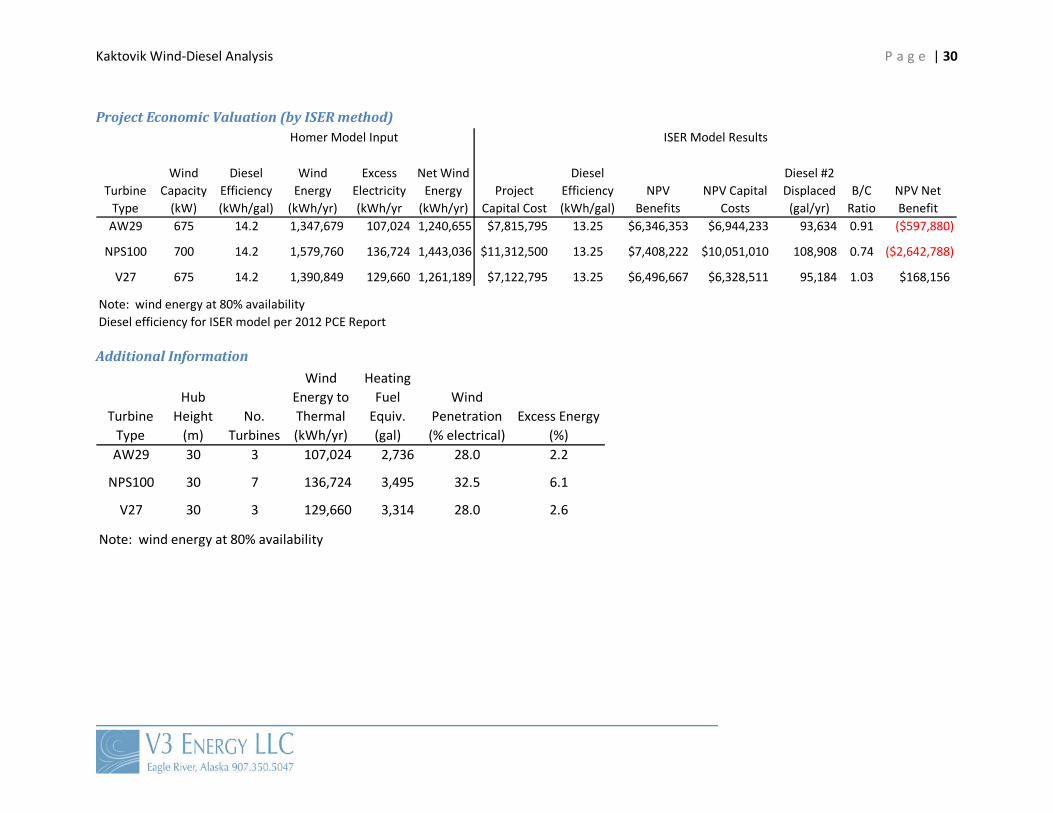
Modeling Results The following modeling information assumes the existing thermal loads without addition of the PSO and vacuum station. Economic benefit-to-cost is shown by the ISER method which does not account for heat loss from the diesel engines with respect to heating oil offset. ISER cost modeling assumptions are noted above or are discussed in the 2013_06_R7Prototype_final_07012013 Excel spreadsheet.
Kaktovik Wind-Diesel Analysis P a g e | 30
Project Economic Valuation (by ISER method)
Additional Information
Turbine Type
Wind Capacity
(kW)
Diesel Efficiency (kWh/gal)
Wind Energy
(kWh/yr)
Excess Electricity (kWh/yr
Net Wind Energy
(kWh/yr)Project
Capital Cost
Diesel Efficiency (kWh/gal)
NPV Benefits
NPV Capital Costs
Diesel #2 Displaced
(gal/yr)B/C
RatioNPV Net Benefit
AW29 675 14.2 1,347,679 107,024 1,240,655 $7,815,795 13.25 $6,346,353 $6,944,233 93,634 0.91 ($597,880)
NPS100 700 14.2 1,579,760 136,724 1,443,036 $11,312,500 13.25 $7,408,222 $10,051,010 108,908 0.74 ($2,642,788)
V27 675 14.2 1,390,849 129,660 1,261,189 $7,122,795 13.25 $6,496,667 $6,328,511 95,184 1.03 $168,156
Note: wind energy at 80% availabilityDiesel efficiency for ISER model per 2012 PCE Report
Homer Model Input ISER Model Results
Turbine Type
Hub Height
(m)No.
Turbines
Wind Energy to Thermal (kWh/yr)
Heating Fuel
Equiv. (gal)
Wind Penetration (% electrical)
Excess Energy (%)
AW29 30 3 107,024 2,736 28.0 2.2
NPS100 30 7 136,724 3,495 32.5 6.1
V27 30 3 129,660 3,314 28.0 2.6
Note: wind energy at 80% availability

Kaktovik Wind-Diesel Analysis P a g e | 31
Discussion Installing wind turbines and creating a wind-diesel power system in a small village is a demanding challenge. At first glance, the benefits of wind power are manifest: the fuel is free and it is simply a manner of capturing it. The reality of course is more complicated. Wind turbines are complex machines and integrating them into the diesel power system of a small community is complicated. With wind-diesel, a trade-off exists between fuel savings and complexity. A system that is simple and inexpensive to install and operate will displace relatively little diesel fuel, while a wind-diesel system of considerable complexity and sophistication can achieve very significant fuel savings.
The ideal balance of fuel savings and complexity is not the same for every community and requires careful consideration. Not only do the wind resource, electric and thermal load profiles, and powerhouse suitability vary between villages, so does technical capacity and community willingness to accept the opportunities and challenges of wind power. A very good wind-diesel solution for one village may not work as well in another village, for reasons that go beyond design and configuration questions. Ultimately, the electric utility and village residents must consider their capacity, desire for change and growth, and long-term goals when deciding the best solution to meets their needs.
The purpose of this Wind-Diesel Analysis report is to introduce and discuss the viability of wind power in Kaktovik. As discussed, many options are possible, ranging from a very simple low penetration system to a highly complex, diesels-off configuration theoretically capable of displacing 75 percent or more of fuel usage in the community. It’s possible that North Slope Borough and Kaktovik residents will ultimately prefer a very simple or very complex option, but from past discussions and work it has been determined and possibly also assumed that a moderate approach to wind power in Kaktovik is preferred, at least initially.
With a moderately complex project design framework in mind, a configuration of relatively high wind turbine capacity but without electrical storage and without diesels-off capability was chosen. This provides sufficient wind capacity to make a substantive impact on fuel usage but does not require an abrupt transition from low to high complexity. Although conceptually elegant, there is a trade-off to consider with this approach. Installing a large amount of wind power capacity (approximately 700 kW are recommended) is expensive, but without electrical or thermal storage some of the benefits of this wind power capacity cannot be captured and will be lost.
The thermodynamics of energy creation and use dictates that wind power is more valuable when used to offset fuel used by diesel generators to generate electricity than fuel used in fuel oil boilers to serve thermal loads. Referring to the energy production summaries for the three turbine configurations under Modeling Results, one can see that the wind turbines are expected to produce minimal excess electricity, even at 90 percent turbine availability. This excess electricity, although minimal, must be shunted via a secondary load controller to the diesel generator heat recovery loop or simple radiation heaters to avoid curtailing wind turbines during periods of high wind and relatively light electrical load.

Kaktovik Wind-Diesel Analysis P a g e | 32
Although perhaps not readily apparent in the report, this compromise of wind capacity versus complexity is contained within the economic benefit-to-cost tables. Because excess wind energy is not modeled as serving the thermal load nor stored in batteries, it is not valued in the net present value calculations. So, a compromise, which is common with wind-diesel designs, is that capital costs are high, but usage of energy generated is imperfect, from an efficiency point of view. The most efficient usage of energy from a technical point of view, however, may be too expensive from a cost-benefit perspective.
It is important to not focus strictly on benefit-to-cost ratio of a particular configuration design or particular turbine option, but also consider a wider view of the proposed wind project for Kaktovik. Installing approximately 700 kW capacity of wind power has considerable short-term benefit with reduction of diesel fuel usage, but more importantly it would provide a platform of sustainable renewable energy growth in Kaktovik for many years to come. This could include enhancements such as thermal load offset, battery storage to enable diesels-off capability, creation of deferred heat loads such as water heating, and installation of distributed electrical home heat units (Steffis heaters or similar) controlled by smart metering. The latter, presently operational to a limited extent in the villages of Kongiganak, Kwigillingok, Tuntutuliak, has enormous potential in rural Alaska to not only reduce the very high fuel oil expenses borne by village residents, but also to improve the efficiency and cost benefit of installed and future wind power projects. These opportunities and benefits are tangible and achievable, but their cost benefit was not modeled in this report.
Lastly, it must be acknowledged that a wind power project in Kaktovik will provide benefits that are not easily captured by the economic modeling contained in this report. These are the externalities of economics that are widely recognized as valuable, but often discounted because they are soft values compared to the hard numbers of capital cost, fuel quantity displaced, etc. These include ideals such as long-term sustainability of Kaktovik, independence of Kaktovik from foreign-sourced fuel, reduction of Kaktovik’s carbon footprint, and opportunities for education and training of Kaktovik residents, among others.