Kahuna: Problem Diagnosis for MapReduce-Based · PDF fileKahuna: Problem Diagnosis for...
8
Kahuna: Problem Diagnosis for MapReduce-Based Cloud Computing Environments Jiaqi Tan, Xinghao Pan DSO National Laboratories, Singapore Singapore 118230 {tjiaqi,pxinghao}@dso.org.sg Eugene Marinelli, Soila Kavulya, Rajeev Gandhi and Priya Narasimhan Electrical & Computer Engineering Dept. Carnegie Mellon University, Pittsburgh, PA 15213 [email protected],{spertet,rgandhi}@ece.cmu.edu, [email protected] Abstract—We present Kahuna, an approach that aims to diagnose performance problems in MapReduce systems. Central to Kahuna’s approach is our insight on peer-similarity, that nodes behave alike in the absence of performance problems, and that a node that behaves differently is the likely culprit of a perfor- mance problem. We present applications of Kahuna’s insight in techniques and their algorithms to statistically compare black- box (OS-level performance metrics) and white-box (Hadoop- log statistics) data across the different nodes of a MapReduce cluster, in order to identify the faulty node(s). We also present empirical evidence of our peer-similarity observations from the 4000-processor Yahoo! M45 Hadoop cluster. In addition, we demonstrate Kahuna’s effectiveness through experimental eval- uation of two algorithms for a number of reported performance problems, on four different workloads in a 100-node Hadoop cluster running on Amazon’s EC2 infrastructure. I. I NTRODUCTION Cloud computing is becoming increasingly common, and has been facilitated by frameworks such as Google’s MapReduce [1], which parallelizes and distributes jobs across large clus- ters. Hadoop [2], the open-source implementation of MapRe- duce, has been widely used at large companies such as Yahoo! and Facebook [3] for large-scale data-intensive tasks such as click-log mining and data analysis. Performance problems– faults that cause jobs to take longer to complete, but do not necessarily result in outright crashes–pose a significant concern because slow jobs limit the amount of data that can be processed. Commercial datacenters like Amazon’s Elastic Compute Cloud (EC2) charge $0.10-0.80/hour/node, and slow jobs impose financial costs on users. Determining the root cause of performance problems and mitigating their impact can enable users to be more cost-effective. Diagnosing performance problems in MapReduce environ- ments presents a different set of challenges than multi-tier web applications. Multi-tier web applications have intuitive time- based service-level objectives (SLOs) as they are required to have low latency. Current state-of-the-art problem-diagnosis techniques in distributed systems rely on knowing which requests have violated their SLOs and then identify the root- causes [4] [5] [6]. However, MapReduce jobs are typically long-running (relative to web-request processing), with Google jobs averaging 395 seconds on 394-node clusters [7], or equiv- alently, 43 node-hours (i.e., with a 43-node cluster, the average job will run for an hour). These job times are dependent on the input size and the specific MapReduce application. Thus, it is not easy to identify the ”normal” running time of a given MapReduce job, making it difficult for us to use time-based SLOs for identifying performance problems. In the Kahuna technique, we determine if a performance problem exists and identify the culprit nodes, in a MapReduce system, based on the key insight of peer-similarity among nodes in a MapReduce system: (1) the nodes (that we loosely regard as “peers”) in a MapReduce cluster tend to behave symmetrically in the absence of performance problems, and (2) a node that behaves differently from its peer nodes, is likely to be the culprit of a performance problem 1 . In this paper, (1) we evaluate the extent to which the peer-similarity insight is true on Hadoop, the most widely-used open-source MapReduce system, based on empirical evidence from data from real-world research jobs on the 4000-processor, 1.5 PB M45 cluster, a Yahoo! production cluster made available to Carnegie Mellon researchers, and (2) we investigate the extent to which this insight can be used to diagnose performance problems, and contrast these two algorithms based on peer-similarity. We ex- perimentally evaluate of two of our earlier problem-diagnosis algorithms based on the peer-similarity insight. These two algorithms diagnose problems in Hadoop clusters by compar- ing black-box, OS-level performance metrics [8], and white- box metrics derived from Hadoop’s logs [9], respectively, and are examples of algorithms that can be built around the peer-similarity insight. We refer to them as Kahuna-BB and Kahuna-WB respectively. We perform extensive evaluation of these algorithms using multiple workloads and realistically- injected faults. II. BACKGROUND:MAPREDUCE &HADOOP Hadoop [2] is an open-source implementation of Google’s MapReduce [7] framework that enables distributed, data- intensive, parallel applications by decomposing a massive job into smaller (map and reduce) tasks and a massive data-set into smaller partitions, such that each task processes a different partition in parallel. Hadoop uses the Hadoop Distributed File System (HDFS) implementation of the Google Filesystem 1 We do not claim the converse: we do not claim that a performance problem will necessarily result in an asymmetrically behaving node. In fact, we have observed correlated performance degradations for certain problems, whereby all of the nodes behave identically, albeit incorrectly. 112 978-1-4244-5367-2/10/$26.00 c 2010 IEEE
Transcript of Kahuna: Problem Diagnosis for MapReduce-Based · PDF fileKahuna: Problem Diagnosis for...
Kahuna: Problem Diagnosis for MapReduce-BasedCloud Computing Environments
Jiaqi Tan, Xinghao PanDSO National Laboratories, Singapore
Singapore 118230
{tjiaqi,pxinghao}@dso.org.sg
Eugene Marinelli, Soila Kavulya, Rajeev Gandhiand Priya Narasimhan
Electrical & Computer Engineering Dept.
Carnegie Mellon University, Pittsburgh, PA 15213
[email protected],{spertet,rgandhi}@ece.cmu.edu, [email protected]
Abstract—We present Kahuna, an approach that aims todiagnose performance problems in MapReduce systems. Centralto Kahuna’s approach is our insight on peer-similarity, that nodesbehave alike in the absence of performance problems, and thata node that behaves differently is the likely culprit of a perfor-mance problem. We present applications of Kahuna’s insight intechniques and their algorithms to statistically compare black-box (OS-level performance metrics) and white-box (Hadoop-log statistics) data across the different nodes of a MapReducecluster, in order to identify the faulty node(s). We also presentempirical evidence of our peer-similarity observations from the4000-processor Yahoo! M45 Hadoop cluster. In addition, wedemonstrate Kahuna’s effectiveness through experimental eval-uation of two algorithms for a number of reported performanceproblems, on four different workloads in a 100-node Hadoopcluster running on Amazon’s EC2 infrastructure.
I. INTRODUCTION
Cloud computing is becoming increasingly common, and has
been facilitated by frameworks such as Google’s MapReduce
[1], which parallelizes and distributes jobs across large clus-
ters. Hadoop [2], the open-source implementation of MapRe-
duce, has been widely used at large companies such as Yahoo!
and Facebook [3] for large-scale data-intensive tasks such as
click-log mining and data analysis. Performance problems–
faults that cause jobs to take longer to complete, but do
not necessarily result in outright crashes–pose a significant
concern because slow jobs limit the amount of data that can
be processed. Commercial datacenters like Amazon’s Elastic
Compute Cloud (EC2) charge $0.10-0.80/hour/node, and slow
jobs impose financial costs on users. Determining the root
cause of performance problems and mitigating their impact
can enable users to be more cost-effective.
Diagnosing performance problems in MapReduce environ-
ments presents a different set of challenges than multi-tier web
applications. Multi-tier web applications have intuitive time-
based service-level objectives (SLOs) as they are required to
have low latency. Current state-of-the-art problem-diagnosis
techniques in distributed systems rely on knowing which
requests have violated their SLOs and then identify the root-
causes [4] [5] [6]. However, MapReduce jobs are typically
long-running (relative to web-request processing), with Google
jobs averaging 395 seconds on 394-node clusters [7], or equiv-
alently, 43 node-hours (i.e., with a 43-node cluster, the average
job will run for an hour). These job times are dependent on
the input size and the specific MapReduce application. Thus,
it is not easy to identify the ”normal” running time of a given
MapReduce job, making it difficult for us to use time-based
SLOs for identifying performance problems.
In the Kahuna technique, we determine if a performance
problem exists and identify the culprit nodes, in a MapReduce
system, based on the key insight of peer-similarity among
nodes in a MapReduce system: (1) the nodes (that we loosely
regard as “peers”) in a MapReduce cluster tend to behave
symmetrically in the absence of performance problems, and (2)
a node that behaves differently from its peer nodes, is likely to
be the culprit of a performance problem1. In this paper, (1) we
evaluate the extent to which the peer-similarity insight is true
on Hadoop, the most widely-used open-source MapReduce
system, based on empirical evidence from data from real-world
research jobs on the 4000-processor, 1.5 PB M45 cluster, a
Yahoo! production cluster made available to Carnegie Mellon
researchers, and (2) we investigate the extent to which this
insight can be used to diagnose performance problems, and
contrast these two algorithms based on peer-similarity. We ex-
perimentally evaluate of two of our earlier problem-diagnosis
algorithms based on the peer-similarity insight. These two
algorithms diagnose problems in Hadoop clusters by compar-
ing black-box, OS-level performance metrics [8], and white-
box metrics derived from Hadoop’s logs [9], respectively,
and are examples of algorithms that can be built around the
peer-similarity insight. We refer to them as Kahuna-BB and
Kahuna-WB respectively. We perform extensive evaluation of
these algorithms using multiple workloads and realistically-
injected faults.
II. BACKGROUND: MAPREDUCE & HADOOP
Hadoop [2] is an open-source implementation of Google’s
MapReduce [7] framework that enables distributed, data-
intensive, parallel applications by decomposing a massive job
into smaller (map and reduce) tasks and a massive data-set
into smaller partitions, such that each task processes a different
partition in parallel. Hadoop uses the Hadoop Distributed File
System (HDFS) implementation of the Google Filesystem
1We do not claim the converse: we do not claim that a performance problemwill necessarily result in an asymmetrically behaving node. In fact, we haveobserved correlated performance degradations for certain problems, wherebyall of the nodes behave identically, albeit incorrectly.
112978-1-4244-5367-2/10/$26.00 c©2010 IEEE

HadoopHadoop
. . . . . . .
MASTER SLAVES
HDFS
HadoopTaskTracker
MapReduce
DataNode
datablocks
DataN
ode
log
TaskTracker
log
sadc
vector
s
/proc
HadoopJobTracker
NameNodeNam
eNode
log
JobT
racker log
sadc
vector
s
/proc
Fig. 1. Architecture of Hadoop, showing the logs of interest to Kahuna.
Crash with user!level error4%
Incorrectvalue34%
Hang (task halted)11%
PerformanceProblem (task slow)
20%
Crash with system!level error
31%
Fig. 2. Manifestations of Hadoop bugs reported in Jan 2007–Feb 2008.
[10], to share data amongst the tasks in the system. HDFS
splits and stores files as fixed-size blocks. Hadoop uses a
master-slave architecture, as shown in Figure 1, with a unique
master node and multiple slave nodes. The master node
typically runs the JobTracker daemon which schedules tasks
belonging to a running job and the NameNode daemon which
manages the HDFS regulates access to files by clients (i.e.,
the executing tasks). Each slave node runs the TaskTracker
daemon which launches and tracks tasks on its local node, as
directed by the remote JobTracker , and the DataNode which
serves data blocks (on its local disk) to HDFS clients. Figure 1
shows the inputs to Kahuna-BB, /proc-based OS perfor-
mance data (sadc-vectors), and to Kahuna-WB, Hadoop’s
TaskTracker and DataNode logs, respectively.
III. PROBLEM STATEMENT
Our primary research question focuses on whether a peer-
similarity based approach can localize performance problems
accurately, even in large clusters. Ancillary questions concern
the analysis of black-box vs. white-box data, and their respec-
tive fault-coverage with respect to their ability to capture the
symptoms of various performance problems.
Motivating evidence. To investigate the impact of perfor-
mance problems on Hadoop, we studied the manifestations
of reported bugs from the Hadoop bug database [11] over
a 14-month period from Jan 2007 to Feb 2008. We found
that 31% of bugs manifested as degraded performance (hangs,
performance problems), and a further 35% of bugs manifested
as crashes (see Figure 2), indicating that performance problems
are an important class of problems to address for diagnosis.
Furthermore, we believe that the impact of performance prob-
lems is underrepresented in the bug database, as those which
do not crash nor halt Hadoop are likely to go unreported.
Goals. Our diagnosis should run transparently to, and not
require any modifications of, both the hosted applications and
Hadoop itself. Our diagnosis should be usable in production
environments, where administrators might not have the luxury
of instrumenting applications for code-level debugging, but
could likely leverage readily available black-box data or ex-
isting native Hadoop logs. Our diagnosis should produce low
false-positive rates, in the face of a variety of workloads for the
system under diagnosis, even if these workloads fluctuate, as
in the case of real-world workloads such as Nutch and Pig.
Our data-collection should impose minimal instrumentation
overheads on the system under diagnosis.
Fault model. Performance problems in Hadoop clusters can
result in jobs taking longer than usual to complete. Such
abnormally long runtimes can be due to environmental factors
on the node (e.g., an external, non-Hadoop workload), due
to causes not specific to the node (e.g., non-deterministically
triggered bugs within Hadoop), or due to data-dependent
issues. The outcome of our diagnosis algorithm is a set of
slave nodes in the cluster that our algorithm has identified as
those that caused the job to take longer than usual to complete.
We do not attempt to predict the normal completion-time of a
given job. Instead, we identify jobs that undergo performance
problems that cause the jobs to take longer to complete than
if the problem were not present, and identify the nodes that
caused the slowdown.
Assumptions. We assume that the target MapReduce system
(i.e., the Hadoop infrastructure and Hadoop jobs) is the
dominant source of activity on every node. We assume that a
majority of the Hadoop slave nodes are problem-free and that
all nodes are homogeneous in hardware. As a part of future
work, we intend to study the peer-similarity principle in the
case of heterogeneous cluster configurations; this is outside
the scope of the current paper.
Non-goals. We currently aim for coarse-grained problem di-
agnosis that localizes problems to the culprit slave node(s).
This differs from finer-grained root-cause analysis that might
aim instead to identify the underlying fault or bug, or offending
line of code. While the presented algorithms can be run online,
we focus on the offline evaluation of collected data. We also
currently do not target master node problems, nor attempt to
predict normal runtimes of a given job.
2010 IEEE/IFIP Network Operations and Management Symposium - NOMS 2010: Mini-Conference 113

IV. EMPIRICAL EVIDENCE OF PEER-SIMILARITY
Over the past year, we have conducted several experiments
with, and analyzed data from, different large-scale MapReduce
systems, including our 100-processor Amazon EC2-based
Hadoop cluster [12] as well as the 4000-processor Yahoo!
M45 production cluster [13]. We experimented with multiple
workloads, such as the simple RandWriter and Sort and
the more realistic Nutch and Pig. We have also analyzed
traces of Hadoop jobs run by other researchers on M45.
We have observed that, in the absence of performance
problems, the slave nodes in a MapReduce cluster tend to
exhibit similar behavior, as measured in any number of ways,
e.g., CPU usage, network traffic, Map-task completion-times,
etc. When we inject a performance problem (or when we
observe a problem in the field, in the case of the M45
traces), we observed further that the slave node on which
the problem originated (the culprit node) deviated from the
other slave nodes in its behavior. These observations held
across multiple traces, multiple experiments, multiple users,
and testbeds. These two empirically-observed insights–peer
similarity under fault-free conditions and peer-divergence in-
dicates a performance problem–form the key motivators of
our Kahuna approach, as described in Section V.
Justification. This observed behavior is intuitive and reason-
able to expect in a MapReduce cluster. Slave nodes typically
process copies of the same task that operate on different
inputs; with each task processing large numbers of records,
the aggregate behavior of slave nodes that we observe would
be similar. In addition, we argue that, for a job to complete
as quickly as possible, nodes (with the same processing capa-
bilities) should spend comparable amounts of time handling
comparable amounts of work, as the system completes its job
only when the slowest node completes. Hence, peer-similarity
amongst (homongeous) nodes is not merely an observed, but
also a necessary, characteristic, for optimal performance.
Supporting evidence. We provide empirical evidence from
traces of real Hadoop jobs in the Yahoo! M45 production
cluster, to support our key insights. We obtained the Hadoop
logs for jobs that were run by researchers (whose data-
intensive jobs range from machine translation to large-scale
data mining) over the five-month period, April–September
2008. The logs spanned 12854 experiments run by 26 users.
Each experiment consisted of multiple Hadoop jobs. Table I
provides a summary of the log statistics. Apart from the
visual inspection of these log traces, we sought to establish,
in a statistical way, that (i) slave nodes performing the same
jobs behave similarly, and (ii) the similarity between nodes is
affected when a job suffers from performance problems.
We measured the similarity among nodes by computing the
absolute value of the Pearson’s pair-wise correlation coeffi-
cient (between 0 and 1, with 1 expressing maximum similarity)
of the average number of Maps/second being executed across
slave nodes during a job across every pair of nodes in each
job. We considered the number of Maps/second, rather than
the number of Reduces/second, because a third of the jobs
TABLE ISUMMARY OF M45 LOGS.
Number of experiments 12854
Number of users 26
Average jobs per experiment 3.84 ± 20
Average nodes per experiment 21.42 ± 24
Average experiment duration (mins) 19.74 ± 82
Longest running experiment (hours) 23.32
0 200 400 600 800 1000 1200
Time (seconds)
0
5
10
15
20
0
5
10
15
20
0
5
10
15
20
node1
node2
node3
slow host has fewermaps scheduled
Map
s/s
Map
s/s
Map
s/s
Fig. 3. Peer-comparison of Map tasks scheduled across M45 hosts helps tohighlight a slow host in a user’s Hadoop job.
(for this specific user and workload) did not involve any
Reduce tasks. Figure 3 shows a graphical view of the number
of Maps/second being executed on each node. We found
that, for successfully completed jobs, 89% of the nodes in
had correlation coefficients ≥ 0.6 with all of other nodes
involved in the job. On the other hand, for jobs aborted by
the JobTracker, only 43% of the nodes with correlations ≥ 0.6
with other nodes involved in the job. This evidence supports
our insights of peer-similarity amongst slave nodes in fault-
free conditions, while nodes behave much less similarly in jobs
that failed to complete. This is illustrated visually in Figure 3.
V. DIAGNOSIS APPROACH
Based on our key insights in Section IV, we assert that a
node whose behavior differs from the majority of nodes in
the cluster is anomalous and can be a potential source of
a performance problem. To enable us to quantify how sim-
ilar/dissimilar nodes are to each other, we need to define the
notion of “behavior” more concretely.Hence, Kahuna-BB sta-
tistically compares black-box data across nodes, and Kahuna-
WB statistically compares white-box data across nodes.
Black-box instrumentation. We gather and analyze black-
box (i.e., OS-level) performance metrics, without requiring any
modifications to Hadoop, its applications or the OS. We use the
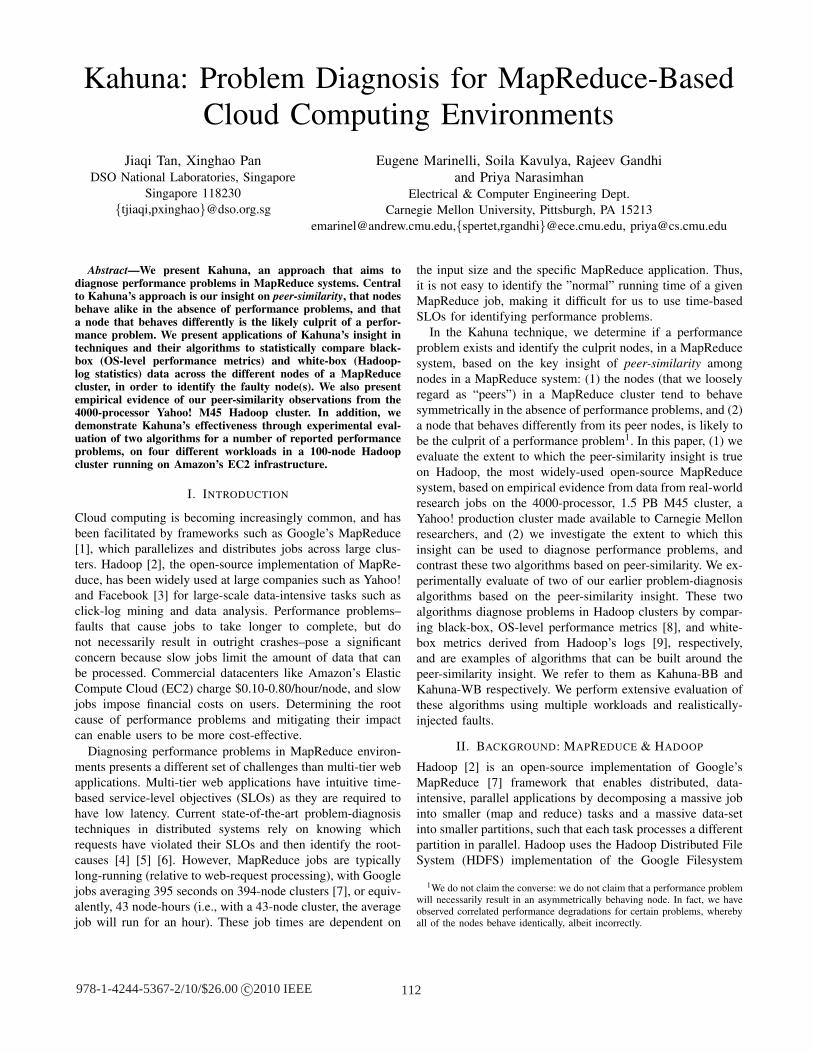
sadc program in the sysstat package [14] to collect 14 OS
metrics, as listed in Table II) from /proc, at a sampling interval
of one second. We denote each vector containing samples of
114 2010 IEEE/IFIP Network Operations and Management Symposium - NOMS 2010: Mini-Conference
user % CPU time in user-space
system % CPU time in kernel-space
iowait % CPU time waiting for I/O job
ctxt Context switches per second
runq-sz Number of processes waiting to run
plist-sz Total number of processes and threads
ldavg-1 system load average for the last minute
eth-rxbyt Network bytes received per second
eth-txbyt Network bytes transmitted per second
pgpgin KBytes paged in from disk per second
pgpgout KBytes paged out to disk per second
fault Page faults (major+minor) per second
bread Total bytes read from disk per second
bwrtn Total bytes written to disk per second
TABLE IIGATHERED BLACK-BOX METRICS (SADC-VECTOR).
these 14 metrics, all collected at the same instant of time,
sadc-vector. We use these sadc-vectors as our metric for
diagnosis in Kahuna-BB.
White-box instrumentation. We collect the system logs gen-
erated by Hadoop’s native logging code from the TaskTracker
and DataNode daemons on slave nodes, and use the SALSA
log-analysis technique [9] to extract state-machine views of
the execution of each daemon. Each entry in the log is
treated as an event, and particular events are used to identify
states in the control-flow of each daemon, e.g., Map and
Reduce states in the TaskTracker, and ReadBlock and
WriteBlock states in the DataNode. Sequences of state
executions are then generated, with data-flows between these
states, and durations of each state, for each node in the cluster.
Kahuna-WB compares these durations across slave nodes to
perform its diagnosis.
VI. DIAGNOSIS ALGORITHMS
For each of the metrics of diagnosis (sadc-vector for Kahuna-
BB and state durations for Kahuna-WB), over a given period
of time, we compare that metric’s values at each node with
the metric’s corresponding values at all of the other nodes. If
the values of metric X at a given node, N, differ significantly
from sufficiently many nodes in the cluster, metric X is said
to indict node N as the culprit, and our algorithms flag the
presence of a performance problem. Kahuna-BB and Kahuna-
WB are similar in their use of a peer-comparison strategy, but
differ in that (i) they operate on different sets of metrics, (ii)
they impose different hypotheses on the data, and (iii) they
can operate independently of each other.
A. Kahuna-WB: White-Box Diagnosis
We assume that state durations of interest have been extracted
from Hadoop’s logs using [9]. Kahuna-WB performs peer-
comparison on the durations of the states extracted through
log analysis, i.e. the Map, Reduce, ReduceCopy and
ReduceMergeCopy states from TaskTracker logs, and the
ReadBlock and WriteBlock states from DataNode logs.
For each state, for a given period of time, we generate a
histogram of the durations of that state for each node, in
order to create an aggregate view of the state’s durations for
that node. Then, for each node, we compare its histogram
for that state’s duration with the corresponding histograms of
every other node in the cluster. We perform this comparison
by computing a statistical measure (square-root of the Jensen-
Shannon divergence [15]) of the distance between histograms.
If a given node’s histogram differs significantly (by more than
a threshold value) from those of a majority of the other nodes,
then, we diagnose the cluster as undergoing a performance
problem with that node being the culprit.
B. Kahuna-BB: Black-Box Diagnosis
Unlike Kahuna-WB, which simply performs a statistical com-
parison across nodes, Kahuna-BB requires a priori training to
summarize system metrics into a small number of behavior
profiles. This enables it to extract meaning out of black-
box data typically devoid of semantic information. Kahuna-
BB is based on two related hypotheses about the behavior
of MapReduce slave nodes from the perspective of black-
box, OS-level performance counters: (i) that MapReduce slave
nodes exhibit a small number of distinct behaviors, and that (ii)
in a short interval of time (say, 1s), the system’s performance
tends to be dominated by one of these behaviors. We then
exploit our peer-similarity insight in Kahuna-BB to incriminate
any node whose dominant distinct behavior differs from those
of a majority of the other nodes in the cluster.
Learning. The K distinct profiles, each of which captures
one of the distinct Hadoop behaviors hypothesized above, are
first learned a priori from fault-free runs of various workloads
(described in Section VII-A). This phase involves collecting
sadc-vectors from these runs, and then using the Expectation-
Maximization (EM) algorithm [16] to cluster these sadc-
vectors into behavior profiles. These profiles have no semantic
meaning, and are used to condense Hadoop’s different behav-
iors into a small number of profiles, as manifested across all
14 elements of the sadc-vectors.
Diagnosis. First, we classify each node’s sadc-vector into
one of the learned K distinct profiles. We then compute the
histograms of these profiles for each node, decayed exponen-
tially with time to weight past behavior less. We then compute
the pairwise distance between the histograms of every pair of
nodes in the cluster in each time period, using a statistical
measure (the square-root of the Jensen-Shannon divergence
[15]). If a specific node’s histogram differs significantly (by
more than a threshold value) from those of a majority of the
other nodes, then we declare the system to be undergoing a
performance problem and indict that node to be the culprit.
VII. EXPERIMENTAL EVALUATION
Each experiment consists of a {problem, workload} pair, with
a Hadoop cluster running a particular workload, with a specific
single fault injected at one of the slave nodes during the
experiment. These injected performance problems increase the
workload’s running time, as compared to the control fault-
free case, as shown in Table IV. We evaluate Kahuna-BB’s
and Kahuna-WB’s ability to detect and localize the injected
performance problems for each Hadoop workload. We selected
2010 IEEE/IFIP Network Operations and Management Symposium - NOMS 2010: Mini-Conference 115

Fault / Workload RandWriter Sort Nutch Pig
Control (none) 0% 0% 0% 0%CPUHog 7.2% 28.2% 25.1% 11.6%DiskHog 5.7% 26.6% 10.6% 16.3%DiskFull 1.4% 4% 0% 0%
PacketLoss1 0% 0% 0% 0%PacketLoss5 0% 23.2% 30.1% 0%
PacketLoss50 0% 89.8% 116.5% 561.1%HANG-1036 1% 12.8% 99.4% 37.0%HANG-1152 0% 24.4% 44.0% 6.6%HANG-2080 0% 23.7% 6.1% 0.5%
TABLE IVIMPACT OF INJECTED PROBLEMS ON PERFORMANCE OF EACH
WORKLOAD. WE REPORT THE PERCENTAGE SLOWDOWN OF THE
COMPLETION TIME OF EACH JOB RELATIVE TO THE “CONTROL” CASE.
these injected problems to cover both (i) resource-contention
(CPU, disk, network) problems, as well as (ii) Hadoop bugs
that result in performance slowdowns or hangs.
A. Experimental Setup
We collected and analyzed traces from Hadoop clusters run-
ning on virtual machines on the Amazon EC2 virtual data-
center. Each node consisted of an “extra-large” node instance
on EC2, with 4 dual-core Intel Xeon-class CPUs, 15GB of
memory, and 1.6TB of Elastic Block Store (EBS) storage [12].
We collected traces from 10-, 25-, 50- and 100-node Hadoop
clusters. We collected both black-box, OS-level performance
counters throughout the experiment, and white-box Hadoop
logs at the end of each experiment for offline processing.
Black-box data collection incurred an overhead of less than
1% CPU utilization; white-box data-collection did not require
additional effort as Hadoop generates logs by default.
Workloads. To evaluate the effectiveness of Kahuna on a
variety of workloads, we collected traces of Hadoop under
four different workloads: two simple benchmarks that are
packaged with Hadoop (Sort , RandWriter), and two
Hadoop applications (Nutch, Pig) commonly used in real-
world installations. These are described below:
• RandWriter: Write-intensive workload that generated 24
GB of random data on each task
• Sort : Read/Write workload that sorts 5 GB of randomly-
ordered records generated by RandWriter. Sort and
RandWriter are common Hadoop benchmarks
• Nutch: Distributed web-crawler for Hadoop, in use
at several companies [3], representative of a real-world,
fluctuating workload typical of many Hadoop workloads
• Pig: High-level language for expressing data analysis
programs [17], that is compiled into Hadoop programs,
typical of a sophisticated, multi-job Hadoop workload
Fault Injection. Table III describes the faults that we injected
into one of the slave nodes in each experiment, and our
fault-injection methodology. These faults trigger performance
problems reported on the Hadoop users’ mailing list or on
the Hadoop bug database [11]. The faults studied were inten-
tionally selected to induce performance problems, specifically
those that caused Hadoop jobs to take longer to complete
Fig. 4. Results for all problems on Nutch for all cluster sizes.
Fig. 5. Results for all problems on Pig for all cluster sizes.
than expected, as compared with our control (i.e. fault-free)
experiments. Table IV captures the impact of these injected
faults on the job-completion times of the four workloads.
VIII. RESULTS
For each experimental trace, we analyzed the trace-data using
both Kahuna-WB and Kahuna-BB, each of which returned a
list of nodes it indicted as culprits. We evaluated this outcome
as follows: an indictment of the fault-injected node was a true-
positive, an indictment of any other node was a false-positive
(FP), and a failure to indict the fault-injected node was a
false-negative (FN). The true-positive (TP) and false-positive
rates (∈ [0.0,1.0], with T P = 1.0,FP = 0.0 representing a
perfect diagnosis) are presented here for 10 fault-induced
experimental runs for each {problem, workload} pair. These
results are computed for a specific threshold (for Kahuna-BB
and Kahuna-WB) for each {workload, cluster-size} pair.
A. Kahuna-BB: Black-box diagnosis
Figures 4, 5, 6, and 7 show the TP and FP rates for each
{fault,workload} pair. The bar graphs are grouped by injected
fault, and each set of 4 bars shows results for the 10-, 25-,
50-, and 100-node clusters respectively. In general, Kahuna-
BB was successful at diagnosing most injected faults on
116 2010 IEEE/IFIP Network Operations and Management Symposium - NOMS 2010: Mini-Conference

[Source] Reported Failure [Problem Name] Problem-Injection Methodology
[Hadoop users’ mailing list, Sep 13 2007] CPU bottleneck resultedfrom running master and slave daemons on same machine
[CPUHog] Emulate a CPU-intensive task that consumes 70%CPU utilization
[Hadoop users’ mailing list, Sep 26 2007] Excessive messages loggedto file during startup
[DiskHog] Sequential disk workload wrote 20GB of data tofilesystem
[HADOOP-2956] Degraded network connectivity between DataN-odes results in long block transfer times
[PacketLoss1/5/50] 1%,5%,50% packet losses by drop-ping all incoming/outcoming packets with probabilities of0.01,0.05,0.5
[HADOOP-1036] Hang at TaskTracker due to an unhandled excep-tion from a task terminating unexpectedly. The offending TaskTrackersends heartbeats although the task has terminated.
[HANG-1036] Revert to older version and trigger bug bythrowing NullPointerException
[HADOOP-1152] Reduces at TaskTrackers hang due to a race con-dition when a file is deleted between a rename and an attempt to callgetLength() on it.
[HANG-1152] Simulated the race by flagging a renamed file asbeing flushed to disk and throwing exceptions in the filesystemcode
[HADOOP-2080] Reduces at TaskTrackers hang due to a miscalcu-lated checksum.
[HANG-2080] Deliberately miscomputed checksum to triggera hang at reducer
TABLE IIIINJECTED PROBLEMS, AND THE REPORTED FAILURES THAT THEY SIMULATE. HADOOP-XXXX REPRESENTS A HADOOP BUG-DATABASE ENTRY.
Fig. 6. Results for all problems on RandWriter for all cluster sizes.
Fig. 7. Results for all problems on Sort for all cluster sizes.
all workloads, achieving high TP rates and low FP rates.
We candidly discuss deviations where and why Kahuna-BB
performed less than satisfactorily.
PacketLoss: The PacketLoss1 problem was generally not
diagnosed on all workloads, as compared to other problems,
because Hadoop uses TCP, which provides some resilience
against minor packet losses. The diagnosis of more severe
packet losses had high TP rates, indicating we could detect
the problem. However, the high FP rates indicated that we
regularly indicted wrong nodes, due to the correlated nature
of the problem since a packet loss on one node (e.g. due to
a flaky NIC) can also register as a problem on other nodes
communicating with it. Also, the PacketLoss problem was
less successfully detected on RandWriter because its jobs
largely involved disk I/O but minimal network communication.
HANG-2080, HANG-1152: The HANG-2080 and HANG-
1152 problems affect the Reduce stage of computation. Since
the RandWriter workload has no Reduce tasks, these hang
problems have less impact on it (as shown in Table IV) than
on Sort and Pig, which have relatively long Reduces.
We could not diagnose the problem on the Nutch workload
as it affected a majority of the nodes in the cluster, so that
peer-comparison failed to diagnose this problem.
DiskFull: The DiskFull problem was not diagnosed success-
fully on the Pig workload, with relatively low TP rates. In
this problem, the node with a full disk would use remote
DataNodes rather than its local one to perform operations,
so that workloads which perform more disk operations would
be more greatly impacted. However, the Pig job in our
experiments was largely compute-intensive, and less disk-
intensive, so that the drop in disk activity on the problematic
node did not cause the disk activity of that node to deviate
significantly from those of other nodes.
B. Kahuna-WB: White-box diagnosis
Kahuna-WB diagnosis was performed with the durations of
each of the following states: ReadBlock and WriteBlock
states on the DataNode, and the Map, Reduce, ReduceCopy
and ReduceMergeCopy states on the TaskTracker. We
found that diagnosis using the Map state was most effective;
we summarize the results for diagnosis using all other states
due to space constraints. The Map state was more effective
for diagnosis as our candidate workloads spent the majority
of their time in the Map state, while only Sort and
Pig had significant Reduce tasks, so that the Map state
2010 IEEE/IFIP Network Operations and Management Symposium - NOMS 2010: Mini-Conference 117

118 2010 IEEE/IFIP Network Operations and Management Symposium - NOMS 2010: Mini-Conference
2010 IEEE/IFIP Network Operations and Management Symposium - NOMS 2010: Mini-Conference 119