KABAROLE DISTRICT WASH MASTER PLAN 2018-2030
54
KABAROLE DISTRICT WASH MASTER PLAN 2018-2030 Safe Water Sanitation and Hygiene For All Kabarole District Local Government
Transcript of KABAROLE DISTRICT WASH MASTER PLAN 2018-2030
KABAROLE DISTRICT WASH MASTER PLAN 2018-2030
Safe Water Sanitation and Hygiene For All
Kabarole District Local Government
2 Kabarole District WASH master plan 2018-2030
© 2018 Kabarole District Council
Permission is hereby granted for sharing and adaptation of this material, in whole or in part, for non-commercial use, educational, scientific or development-related purposes, provided that the appropriate and full citation is given.
Photos used in this publication are the work of IRC Uganda
Editor: IRCDesign and layout: Punt Grafisch Ontwerp, Utrecht, the Netherlands
Cite this publication as follows:Kabarole District Council, 2018. Kabarole District Master Plan for Universal Access to WASH Services 2018 – 2030, Fort Portal, Uganda
ACRONYMS AND ABBREVIATIONS 6EXECUTIVE SUMMARY 8
1 INTRODUCTION TO THE WASH MASTER PLAN 121.0 Introduction 121.1 Rationale 121.2 Process of Developing the Master Plan 121.3 National Overview of WASH and WRM Sector 13
2 KABAROLE DISTRICT PROFILE 152.0 Introduction 152.1 Geography 152.2 Demographic Characteristics 152.3 Economic Context 182.4 District Administrative Structure 19
3 ANALYSIS OF WASH AND IWRM ISSUES 203.0 Introduction 203.1 Water Services 203.2 Sanitation and Hygiene 223.3 Institutional Water Sanitation and Hygiene 243.4 Water Resources Management 253.5 Governance: Capacity and Performance of Service providers 263.6 District WASH Financing 283.7 Resource Mobilization for the Master Plan 303.8 Equity and Inclusion Issues 30
4 PROJECTIONS FOR ACHIEVING UNIVERSAL ACCESS TO WASH IN KABAROLE 314.0 Introduction 314.1 Population Projections 314.2 Medium and Long term WASH Targets 314.3 Strategic Directions and Actions 334.4 Risks and Mitigation 34
5 PARTNERSHIPS AND IMPLEMENTATION OF THE WASH MASTER PLAN 365.1 District Actors 365.2 Regional and National Government Actors 365.3 Development Partners and NGOs 375.4. Implementation of the WASH master plan 37
6 COMMUNICATION, ADVOCACY AND NETWORKS 386.1 Introduction 386.2 Goal 386.3 Objectives and Activities 38
TABLE OF CONTENTS
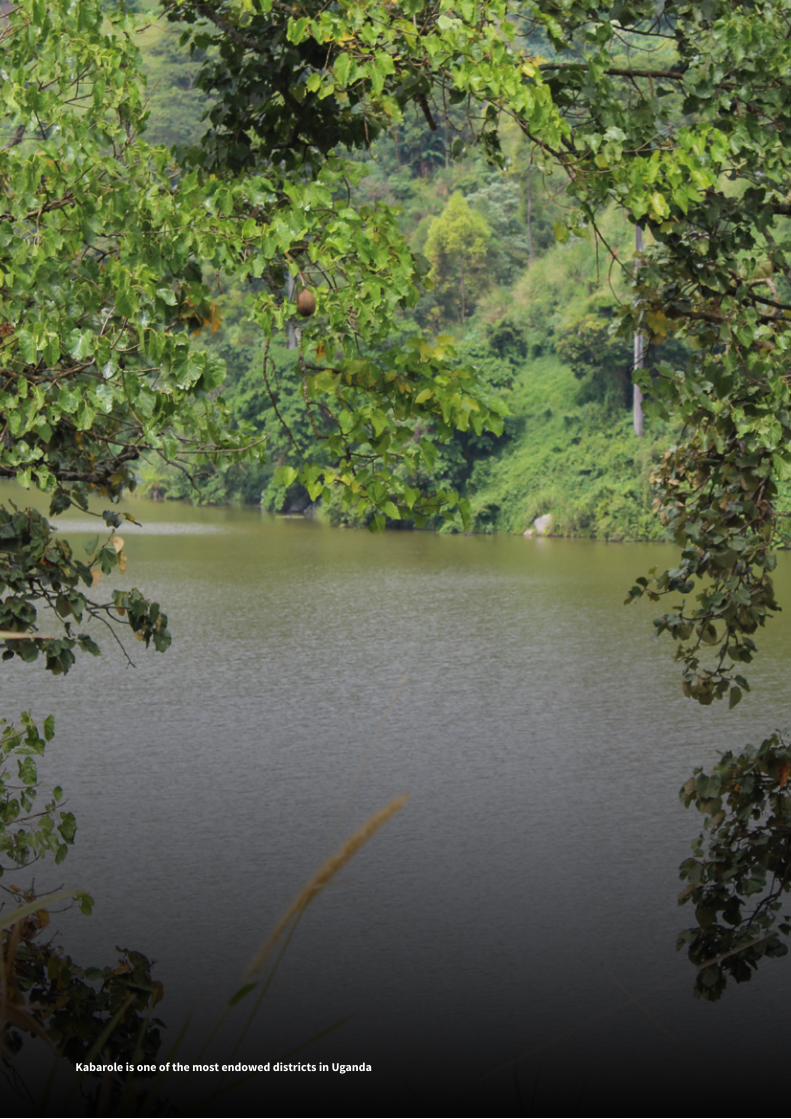
4 Kabarole District WASH master plan 2018-2030Kabarole is one of the most endowed districts in Uganda
7 MONITORING, EVALUATION AND LEARNING 417.0 Introduction 417.1 Monitoring Framework 417.2 Reporting 437.3 Evaluation 437.4 Learning Sharing and Adaptive Capacity 43
8 COSTING OF FULL WASH COVERAGE IN KABAROLE 448.0 Introduction 448.1 Methodology 448.2 Costing Water services 458.3 Costing Sanitation Services 46
REFERENCES 48
ANNEXES 49Annex 1: Communication Matrix 49Annex 2: Costing Framework for Urban Water services 53
LIST OF FIGURESFIGURE 1: WATER POINT TECHNOLOGY, TYPE AND FUNCTIONALITY IN KABAROLE DISTRICT 11FIGURE 2: MAP OF KABAROLE DISTRICT 16FIGURE 3: KABAROLE DISTRICT BUDGET AND REVENUE 2012-2017 18FIGURE 4: KABAROLE DISTRICT EXPENDITURE 2012 - 2017 19FIGURE 5: SANITATION COVERAGE 22FIGURE 6: ANALYSIS OF SANITATION INFRASTRUCTURE AGAINST PARAMETERS
FOR IMPROVED SERVICES 23FIGURE 7: SANITATION SERVICE COVERAGE 23
LIST OF TABLESTABLE 1: JMP UPDATES FOR UGANDA 2017 14TABLE 2: POPULATION OF KABAROLE DISTRICT AND AVERAGE HOUSEHOLD SIZE 17TABLE 3: KABAROLE DISTRICT ADMINISTRATIVE UNITS 19TABLE 4: STATUS OF WATER SERVICES 20TABLE 5: OVERVIEW OF WATER SDMS 21TABLE 6: FINANCIAL FLOWS FOR WASH IN KABAROLE DISTRICT 2012 - 2017 29TABLE 7: POPULATION PROJECTIONS 2018 - 2030 31TABLE 8: WATER SERVICE TARGETS 32TABLE 9: SANITATION TARGET 32TABLE 10: WASH IN HEALTH FACILITIES TARGETS 33TABLE 11: WASH IN SCHOOLS TARGETS 33TABLE 12: RISKS AND MITIGATION 35TABLE 13: MONITORING FRAMEWORK 42TABLE 14: UNIT COSTS FOR CALCULATING THE COST OF SERVICE DELIVERY PER CAPITA 44TABLE 15: TARGETS OF ACCESS TO WATER SERVICES FOR DIFFERENT TECHNOLOGIES
IN MEDIUM TERM AND LONG TERM 45TABLE 16: WATER COSTING FRAMEWORK FOR RURAL BASED ON HAND PUMP TECHNOLOGY 45TABLE 17: COSTS FOR FULL COVERAGE FOR WATER AND SANITATION SERVICES (US$) 46
6 Kabarole District WASH master plan 2018-2030
CAO Chief Administrative OfficerCBMS Community Based Maintenance SystemCCCC Community Contribution towards Capital CostDCDO District Community Development OfficerCLTS Community Led Total SanitationCMO Catchment Management OrganizationCMP Catchment Management PlanDEO District Environmental OfficerDHI District Health InspectorDIS District Inspector of SchoolsDIP District Investment PlanDLG District Local GovernmentDWSCDG District Water and Sanitation Conditional Development GrantDSHCG District Sanitation and Hygiene Conditional GrantDWD Directorate of Water DevelopmentDWO District Water OfficerFY Financial YearGoU Government of UgandaHEWASA Health through Water and Sanitation ProgrammeIWRM Integrated Water Resources ManagementJESE Joint Effort to Save the EnvironmentMoFPED Ministry of Finance Planning and Economic DevelopmentMWE Ministry of Water and EnvironmentMwUws Mid-Western Umbrella Water and SanitationNDP National Development PlanNGO Non-Governmental OrganizationNWSC National Water and Sewerage CorporationODF Open Defecation FreePO Private OperatorSDG Sustainable Development GoalsSPR Sector Performance ReportToRs Terms of ReferenceTSU Technical Support UnitsUBOS Uganda Bureau of StatisticsUO Umbrella OrganizationsUWASNET Uganda Water & Sanitation NetworkWASH Water Sanitation and HygieneWATSAN Water and SanitationWESWG Water & Environment Sector Working GroupWSC/WUC Water and Sanitation Committee/Water Users’ CommitteeWSSB Water Supply and Sanitation Board
ACRONYMS AND ABBREVIATIONS
Kabarole District WASH master plan 2018-2030 7
Kabarole is one of the most endowed districts in Uganda. With a picturesque setting, defined by mountain ranges, sprawling green hills, crater lakes, rivers, and forests teeming with enviable game, Kabarole promises to offer the quality of life that, to many Ugandans, is only a fantasy. The district is bustling with economic activity, and proudly contributes to the general Ugandan economy. Needless to say, Kabarole is the destination of choice for many tourists from Uganda and abroad, and a leading producer of agricultural items. Fort Portal within Kabarole, is also reputed for being the cleanest town in Uganda.
The district administration is keen to take Kabarole to even greater heights. Our goal is to promote people’s standards of living through efficient and effective service delivery. Such an ambitious goal requires us to multiply our efforts to address the issues most pertinent to our people’s standards of living.
One of the most critical aspects of people’s lives and livelihoods is access to safe water, sanitation and hygiene (WASH) services. Provision of safe and sustainable WASH services not only ensures a healthy and productive population, it also portends a good and clean environment, where natural resources are well-maintained and responsibly exploited. Thus, our forests, wetlands, water resources, rivers, lakes are key to the provision of water services – for consumption and production purposes.
Provision of WASH services takes more than just effective management of natural resources. It includes many other factors and actors that constantly interact to determine the kind of service delivered. We need the right infrastructure, institutions, legislation and regulation. We also need to undertake effective planning and financing as well as monitoring and learning from our experiences. All these aspects are now covered in one Kabarole District WASH master plan.
The master plan indicates our targets and the investment required to achieve them, as well as the implementation and coordination mechanisms. It provides insights on WASH infrastructure development and their sustainable management, financing options as well as monitoring for improvement whilst conserving and managing the water resources.
This WASH master plan offers Kabarole District an opportunity to align efforts to the national development agenda as indicated in the Water and Environment Sector Strategic Plan and the National Development Plan II. It commits us to ensuring that we are positioned to localize and achieve the Sustainable Development Goals (SDGs), particularly SDG6 on WASH.
I congratulate and thank the Kabarole District WASH Task Team who, with the support of our partners IRC WASH, has developed the master plan. As a district leader, with the mandate to ensure sustainable socio-economic development through provision of quality services, I pledge our commitment to provide guidance, lead mobilization of resources and create an enabling environment for the implementation of the WASH master plan.
I therefore appeal to the our local government institutions, lower local government at sub county, parish and village levels, development partners and all WASH stakeholders to effectively use this master plan in implementing sustainable WASH projects that will ensure that all our people have access to improved water, sanitation and hygiene services by 2030; leaving no one behind.
For “a Beautiful District with a Prosperous and Harmonious People; For God and My Country”.
Richard RwabuhingaKabarole District Chairman
FOREWORD
8 Kabarole District WASH master plan 2018-2030
BACKGROUNDKabarole District Local Government is committed to delivering universal access to Water Sanitation and Hygiene services (WASH) by 2030. This master plan provides a framework for planning, coordinating investments and guiding the implementation of the vision, and policy objectives for water and sanitation delivery. The plan articulates the long-term (2018-2030) WASH priorities of the District, reflecting national and international WASH priorities, as contained in Uganda’s National Development Plan II and in the United Nations Sustainable Development Goals (SDGs).
The process of developing the master plan was participatory and involved relevant stakeholders at district and regional level. These included; District Water Office, Planning Unit, heads of Department for Health, and Education, Civil Society Organizations, representatives of religious institutions, politicians, and Technical Support Unit of Ministry of Water and Environment. The process started in 2017 with a series of multi-stakeholder meetings that were used to articulate the medium, and long-term interventions for ensuring universal access to WASH services by 2030.
KABAROLE DISTRICT PROFILEKabarole District is located in Western Uganda and is part of the Kingdom of Toro. Its surface area is 1,814 km2 and has a population of 325,261 people with an average household size of 4.0 people. The district has one County (Burahya), 4 Town Councils, 11 Sub counties and 365 villages. Agriculture is the main source of livelihood and employs over 80% of the population. The rural areas mainly depend on subsistence farming while backyard gardening is commonly practised in urban areas to supplement on household income1.
ANALYSIS OF WASH AND IWRM ISSUES
WATER:• Access to water services is low (58%) and is less than the national average estimated at 70%. • Reliability of existing water supply facilities is very low (45%) due to poor operation and maintenance that leads to frequent
breakdown.• There is high level of contamination of drinking water sources (64%) especially in rural areas.• The willingness of water users to pay for water is still very low. Only 7% consistently pay yet evidence shows that the majority
is able to pay.• The service providers are very weak and are not able to fulfil their management tasks.
SANITATION:• Over 60% of latrines in rural areas are poorly constructed, do not meet the standards for basic sanitation services and cannot
be emptied. This hinders safe disposal of waste2. • Lack of awareness on technology options; suitable for different geographic areas and for improving level of services along the
sanitation ladder.• Limited capacity of the private sector to support different stages in the sanitation service chain; construction of appropriate
infrastructure, pit emptying and transportation services. The district has only one cesspool emptier.• The adoption of handwashing with soap at household level is very low. Less than 10% of the households had improved
sanitation facilities with handwashing facilities with water and soap.
EXECUTIVE SUMMARY
1 Kabarole District Development Plan 2015/16- 2019/20202 Sanitation Marketing Assessment for Kabarole 2017
Kabarole District WASH master plan 2018-2030 9
WASH IN SCHOOLS AND HEALTH FACILITIES• Lack of access to basic water services in some schools and health centres.• Majority of the schools lack separate WASH rooms for girls and facilities for safe disposal of menstrual pads.• Lack of functional handwashing facilities at schools.
WATER RESOURCE MANAGEMENT• Increasing human population and weak governance of the natural resources.• Unsustainable land use practices (deforestation, agriculture); river bank and wetland degradation; siltation of water bodies. • Deteriorating quality and quantity of lake and river waters due to pollution from commercial (chemical contamination from
tea growing) and domestic activities (faecal contamination)• Weak institutional capacity for water resources management and lack of sound governance for water resources management,
especially at the sub-catchments’ level.
CAPACITY OF DISTRICT AND SERVICE PROVIDERS The District Water Office (DWO) is well established with clear roles and responsibilities. There is a dedicated annual budget that has provision for Capital Investment, Capital Maintenance Expenditure and Direct Support. Routine monitoring is conducted annually to establish the status of services. However, the human resource capacity in the DWO is not adequate to fulfil the role of direct support to service providers. There is limited capacity in conducting water quality monitoring, asset management including asset inventories and maintenance planning. Less than 40% of Water Source Committees (WSCs) receive direct support from the DWO due to budget limitations.
COORDINATION OF WASH IN THE DISTRICTThe district has a number of platforms that provide opportunities for coordination and facilitating learning among stakeholders. The platforms include; the District Water and Sanitation Coordination Committee, the Bi-annual Sanitation and Hygiene Coordination Meetings and the Rwenzori WASH Alliance (Rwenzori Regional Learning Forum).
EQUITYKabarole District has 46 out of 365 villages that have never been served with water. This master plan will prioritize these communities on investment in new water supply facilities in line with the presidential directive on ensuring that each village is served with a water supply facility.
PROJECTIONS AND STRATEGIC ACTIONSThe WASH targets are based on the population projections, based on growth over the next 13 years. The Urban and Rural Populations are separately projected annually to determine the coverage and gaps in access to WASH services.
Access to safely managed water services in the district is expected to increase from 5.2% (2017) to 20.8% (2030) whereas access to basic water services will increase from 53% (2017) to 79.2% (2030). Access to safely managed water services in urban areas is expected to increase from 10% to 40% whereas basic services in rural areas will increase from 45% to 60%.Access to safely managed sanitation services in urban areas is expected to increase from 7% (2017) to 80% (2030) whereas basic sanitation services in rural areas will increase from 15.3% (2017) to 96% (2030). At institutional level, basic access to water services will increase from 11% (2017) to 100% (2030) for health centres and 10% to 100% for schools.
STRATEGIC ACTIONS
WATER SERVICESThe district will adopt appropriate technology mixes and maintenance options to ensure unserved villages and unserved populations are reached. Self-supply technologies such as rainwater harvesting will be promoted to increase access in water-stressed and hard-
10 Kabarole District WASH master plan 2018-2030
to-reach areas. Feasibility studies will be conducted to plan for and systematically upgrade hand pumps to small piped water supply systems to ensure piped networks cover 100% of the population by 2040 in line with Government of Uganda’s Vision 2040. The skills of area mechanics, Water and Sanitation Committees will be enhanced to improve operation and maintenance of water systems.
SANITATIONThe district will promote the construction and use of affordable and drainable toilet facilities at household level to ensure emptying and safe disposal of faecal sludge. Capacity of the local private sector in emptying and transportation will be developed and a new site for treatment and safe disposal of faecal sludge will be gazetted to cater for the rapid population growth and urbanization needs. District by-laws on sanitation will be reviewed and enforced to improve effectiveness of behavioural change and social marketing campaigns.
WATER RESOURCES MANAGEMENTThe district will enforce the implementation of water source protection guidelines; streamline water quality monitoring and water safety planning to ensure that drinking water consumed meets national standards. Water use efficiency techniques and practices will also be promoted.
PARTNERSHIPS AND IMPLEMENTATIONThis master plan will be integrated with the existing five year District Development Plan (DDP) for implementation. The consolidated costed plans will be extracted on an annual basis and harmonized with the Annual Work Plans. The District Water and Sanitation Coordination Committee (DWSCC) will provide a platform for coordinating Local Government departments, CSOs, and private sector. The partners identified to support implementation of the plan include; HEWASA, JESE, Protos, IRC, UNICEF, and SNV. Regional and national level actors such as; Ministry of Water and Environment –Technical Support Unit 6, Albert Water Management Zone, Mid-Western Water Authority and Mpanga Catchment Management Organizations and cultural institutions such as; Tooro Kingdom.
MONITORING AND EVALUATIONThe monitoring framework has been designed to track changes at three levels; level of WASH services delivered, performance of service providers, and service authorities. The district WASH task team will be the main entity that will monitor the implementation of the master plan on an annual basis and will report to the DWSCC. Learning and knowledge management will be mainstreamed during the implementation of the master plan. District WASH stakeholders will have opportunities to share lessons, apply different experiments on delivering and managing WASH services, and adapt implementation strategies.
COSTS OF THE MASTER PLANThe costing approach considered the existing and projected population, technologies needed for WASH service delivery and the costs for providing sustainable WASH services related to the technologies. The costs estimated include life-cycle costs required to sustain services. That is; Capital Investment, Rehabilitation (Capital Maintenance), and Direct Support costs. The estimated cost for water services is US$ 24,148,569 whereas the cost for sanitation services is US$ 48,187,105.
FINANCING THE MASTER PLANThe master plan will be financed through four main sources; District Water and Sanitation Coordination Grant, District Sanitation and Hygiene Conditional Grant, locally generated revenue and funding from development partners. Tariffs collected from users and community capital contribution will be used to finance routine maintenance. However, the district will have to increase its annual expenditure on WASH serves to more than 10 times the current level of spending to ensure universal access to WASH services by 2030. The following strategies will be adopted to increase financing for WASH services;• Establish a resource mobilization committee to support fundraising efforts for the master plan. • Develop joint proposals with CSOs on implementation of specific WASH projects. • Map the big private sector players/commercial consumers of water in the district and develop business cases for collaboration
on improving access to WASH services and sustaining water resources.
Kabarole District WASH master plan 2018-2030 11
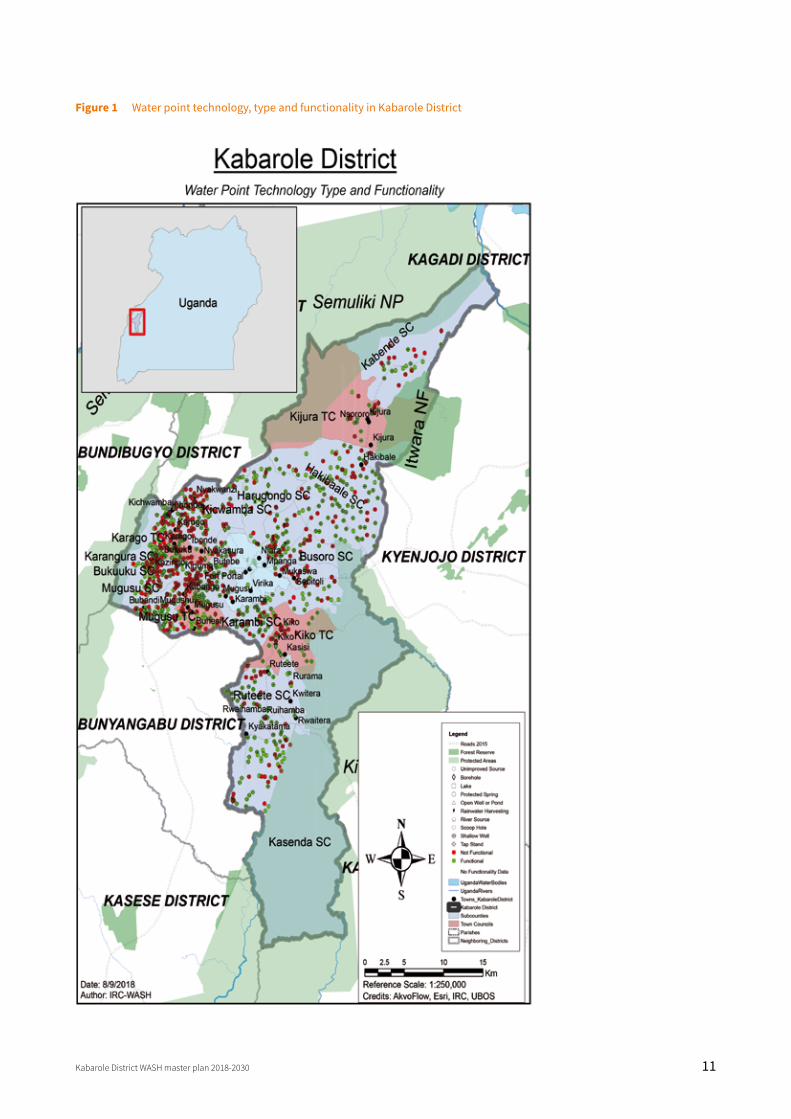
Figure 1 Water point technology, type and functionality in Kabarole District
12 Kabarole District WASH master plan 2018-2030
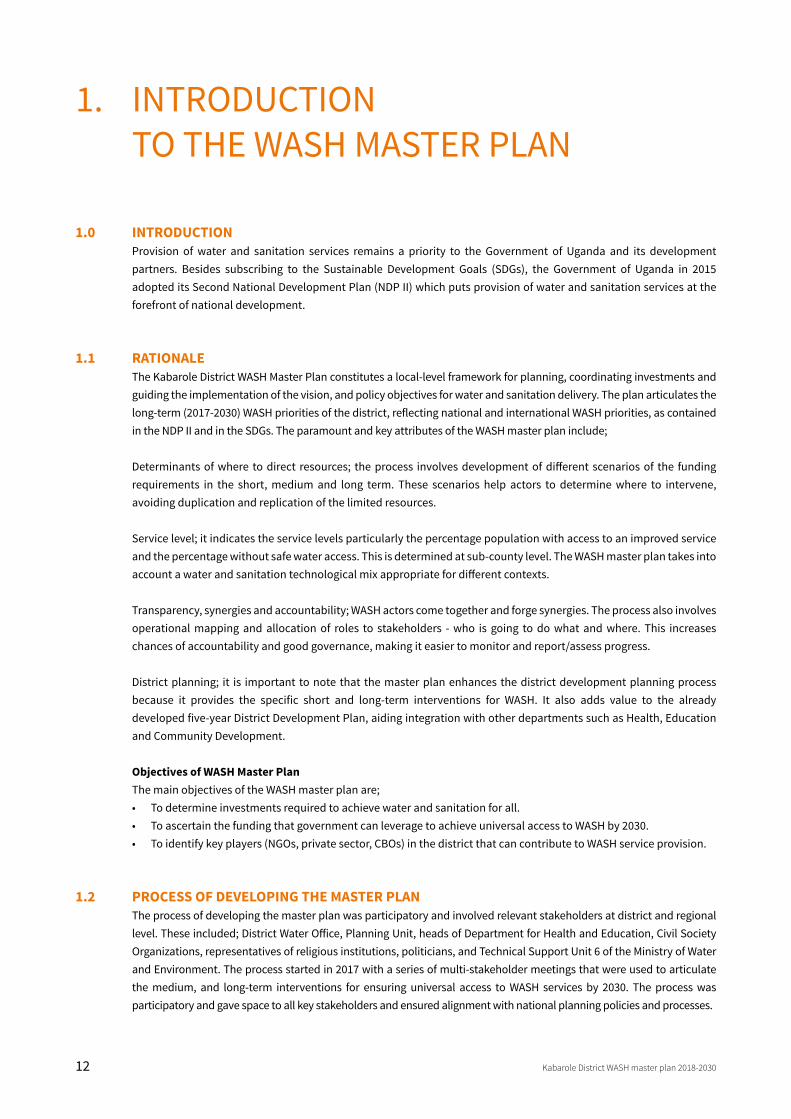
1.0 INTRODUCTIONProvision of water and sanitation services remains a priority to the Government of Uganda and its development partners. Besides subscribing to the Sustainable Development Goals (SDGs), the Government of Uganda in 2015 adopted its Second National Development Plan (NDP II) which puts provision of water and sanitation services at the forefront of national development.
1.1 RATIONALE The Kabarole District WASH Master Plan constitutes a local-level framework for planning, coordinating investments and guiding the implementation of the vision, and policy objectives for water and sanitation delivery. The plan articulates the long-term (2017-2030) WASH priorities of the district, reflecting national and international WASH priorities, as contained in the NDP II and in the SDGs. The paramount and key attributes of the WASH master plan include;
Determinants of where to direct resources; the process involves development of different scenarios of the funding requirements in the short, medium and long term. These scenarios help actors to determine where to intervene, avoiding duplication and replication of the limited resources.
Service level; it indicates the service levels particularly the percentage population with access to an improved service and the percentage without safe water access. This is determined at sub-county level. The WASH master plan takes into account a water and sanitation technological mix appropriate for different contexts.
Transparency, synergies and accountability; WASH actors come together and forge synergies. The process also involves operational mapping and allocation of roles to stakeholders - who is going to do what and where. This increases chances of accountability and good governance, making it easier to monitor and report/assess progress.
District planning; it is important to note that the master plan enhances the district development planning process because it provides the specific short and long-term interventions for WASH. It also adds value to the already developed five-year District Development Plan, aiding integration with other departments such as Health, Education and Community Development.
Objectives of WASH Master PlanThe main objectives of the WASH master plan are;• To determine investments required to achieve water and sanitation for all.• To ascertain the funding that government can leverage to achieve universal access to WASH by 2030.• To identify key players (NGOs, private sector, CBOs) in the district that can contribute to WASH service provision.
1.2 PROCESS OF DEVELOPING THE MASTER PLANThe process of developing the master plan was participatory and involved relevant stakeholders at district and regional level. These included; District Water Office, Planning Unit, heads of Department for Health and Education, Civil Society Organizations, representatives of religious institutions, politicians, and Technical Support Unit 6 of the Ministry of Water and Environment. The process started in 2017 with a series of multi-stakeholder meetings that were used to articulate the medium, and long-term interventions for ensuring universal access to WASH services by 2030. The process was participatory and gave space to all key stakeholders and ensured alignment with national planning policies and processes.
1. INTRODUCTION TO THE WASH MASTER PLAN
Kabarole District WASH master plan 2018-2030 13
The process followed the following steps;
1.2.1 CONTEXT AND GAP ANALYSISThe context analysis was conducted in order to understand the environment in which WASH services are delivered, managed and supported at district level. The analysis started with a synopsis of the WASH sector in Uganda looking at the sustainability of the WASH service delivery system at national and decentralized level highlighting the gaps and the enabling environment, political, social, economic, financial, institutional and environmental issues. Further analysis was done at district level that took stock of the capacity for WASH delivery, operational and service delivery issues and key opportunities, success factors and challenges.
1.2.2 STAKEHOLDERS VISIONING WORKSHOPSA WASH stakeholders visioning workshop was organized in March 2017, which drew stakeholders from the district local government, private sector, civil society, religious institutions, Technical Support Unit 6 among others. The workshop was used to share and validate findings from the context analysis, build consensus on the Roadmap for Universal Access to WASH services and initiate a district WASH task team to support the process of developing a WASH master plan for universal access. A follow-up workshop was organized in May 2017 for district political leaders to share the roadmap and get their full commitment and buy-in towards development of the master plan.
1.2.3 SERVICE MONITORING ASSESSMENT The water and sanitation service monitoring assessed the status of water service provision in April 2017. Data was collected from all hand pumps, a sample of piped water networks and sanitation facilities, Water and Sanitation Committees, health centres and schools. Data was collected by the District Water Office with support from the Hand Pump Mechanics Association. A mobile platform (Akvo Flow) was used to collect the data. The data was used to assess the functionality, level of service, and performance of service providers as per national norms and standards.
1.2.4 DISTRICT WASH TASK TEAM PLANNING MEETINGSKabarole District WASH Task Team is a select group of key and interested WASH stakeholders that was established to help in focused reflections, strategies and recommendations that would enable the district to achieve universal access to WASH by 2030. It has 25 members that include representatives of; politicians, religious institutions, private sector, CSOs and technical staff at district and sub county level.
A series of District WASH Task Team planning meetings established the priority needs, vision, defined outcomes, strategies, implementation arrangements and funding mechanisms towards achieving universal access to WASH services. The WASH task team meetings were useful in articulating; what universal access means in the context of Kabarole District and priority actions required. The findings from the context analysis and service monitoring were used to guide the discussions. The meetings were facilitated by the District Water Office with support from the Planning Unit and IRC Uganda.
1.3 NATIONAL OVERVIEW OF WASH AND IWRM SECTORUganda’s population currently stands at approximately 34.63 million, and is among the countries with the highest population growth of 3.5% per annum. The population is estimated to reach 35 million by 2025, with a projected 63% of that number living in urban areas. One of the implications of these population statistics is a rapid rise in the demand for water and sanitation services, particularly in urban areas.
According to the Sustainable Development Goals standards (JMP 2017), the population with access to safely managed water is 39%. There is no estimate available for access to safely managed sanitation; however, access to improved sanitation is estimated at 17.3% and 28.5% respectively for rural and urban areas.
3 According to the 2014 National Planning and Housing Census
14 Kabarole District WASH master plan 2018-2030
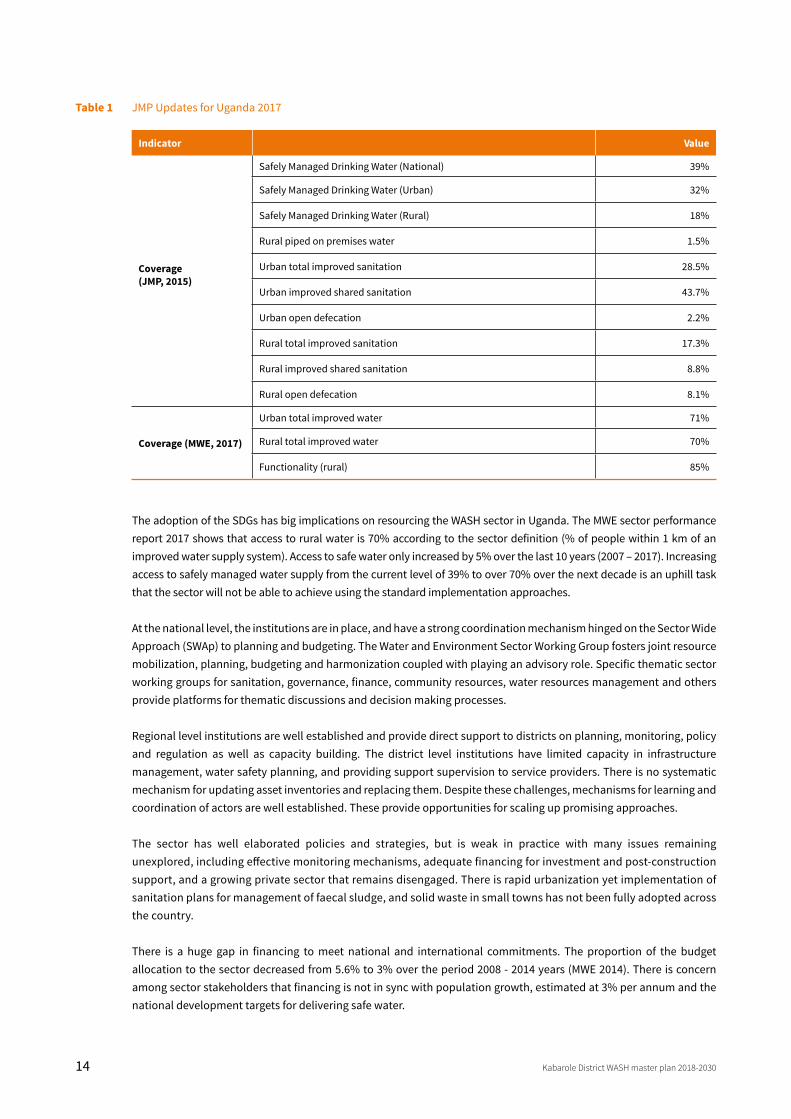
Table 1 JMP Updates for Uganda 2017
The adoption of the SDGs has big implications on resourcing the WASH sector in Uganda. The MWE sector performance report 2017 shows that access to rural water is 70% according to the sector definition (% of people within 1 km of an improved water supply system). Access to safe water only increased by 5% over the last 10 years (2007 – 2017). Increasing access to safely managed water supply from the current level of 39% to over 70% over the next decade is an uphill task that the sector will not be able to achieve using the standard implementation approaches.
At the national level, the institutions are in place, and have a strong coordination mechanism hinged on the Sector Wide Approach (SWAp) to planning and budgeting. The Water and Environment Sector Working Group fosters joint resource mobilization, planning, budgeting and harmonization coupled with playing an advisory role. Specific thematic sector working groups for sanitation, governance, finance, community resources, water resources management and others provide platforms for thematic discussions and decision making processes.
Regional level institutions are well established and provide direct support to districts on planning, monitoring, policy and regulation as well as capacity building. The district level institutions have limited capacity in infrastructure management, water safety planning, and providing support supervision to service providers. There is no systematic mechanism for updating asset inventories and replacing them. Despite these challenges, mechanisms for learning and coordination of actors are well established. These provide opportunities for scaling up promising approaches.
The sector has well elaborated policies and strategies, but is weak in practice with many issues remaining unexplored, including effective monitoring mechanisms, adequate financing for investment and post-construction support, and a growing private sector that remains disengaged. There is rapid urbanization yet implementation of sanitation plans for management of faecal sludge, and solid waste in small towns has not been fully adopted across the country.
There is a huge gap in financing to meet national and international commitments. The proportion of the budget allocation to the sector decreased from 5.6% to 3% over the period 2008 - 2014 years (MWE 2014). There is concern among sector stakeholders that financing is not in sync with population growth, estimated at 3% per annum and the national development targets for delivering safe water.
Indicator Value
Coverage(JMP, 2015)
Safely Managed Drinking Water (National) 39%
Safely Managed Drinking Water (Urban) 32%
Safely Managed Drinking Water (Rural) 18%
Rural piped on premises water 1.5%
Urban total improved sanitation 28.5%
Urban improved shared sanitation 43.7%
Urban open defecation 2.2%
Rural total improved sanitation 17.3%
Rural improved shared sanitation 8.8%
Rural open defecation 8.1%
Coverage (MWE, 2017)
Urban total improved water 71%
Rural total improved water 70%
Functionality (rural) 85%
2.0 INTRODUCTIONThis section presents an overview of the characteristics of the district in the key areas that affect the WASH sector and covers the physical context, the social, cultural and economic situation.
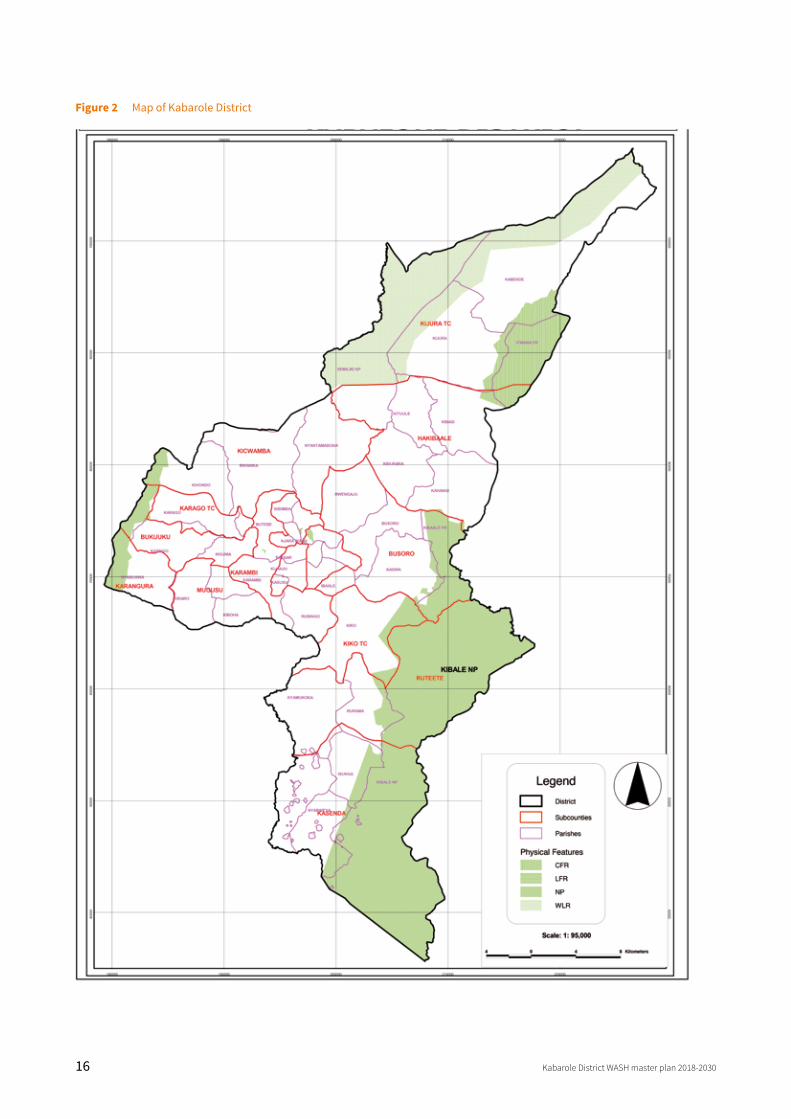
2.1 GEOGRAPHYKabarole District is located in Western Uganda and is part of the Kingdom of Toro. Its main town is Fort Portal. It is bordered by Ntoroko District to the north, Kibaale District to the northeast, Kyenjojo District to the east, Kamwenge District to the southeast and Kasese District to the south. Fort Portal town, lies approximately 320 kilometers (200 miles), by road, west of Kampala. The surface area is 1,814 km2. By 2016 the district population was 474,216 people and consisted of; one (urban) municipality (Fort Portal) and two (rural) counties Bunyangabu and Burahya. Effective 1st July 2017, Bunyangabu County became an independent district and the population of Kabarole reduced to 325,261 people with one County (Burahya), 4 Town Councils, 11 Sub counties and 365 villages.
2.2 DEMOGRAPHIC CHARACTERISTICSAccording to the 2014 National Population and Housing Census Projections for 2017, Kabarole has a population of 325,261 with an average household size of 4.0 people and 77,765 households. The male and female are equally represented at 50% each of the population.
Kabarole District has a relatively high population growth rate of 2.37 percent growth. The high growth rate is mainly due to the high fertility levels (over six children per woman) and migration from the neighboring districts like Kasese, Kyenjojo, Kamwenge and Ntoroko combined with a faster decline in mortality.
2. KABAROLE DISTRICT PROFILE
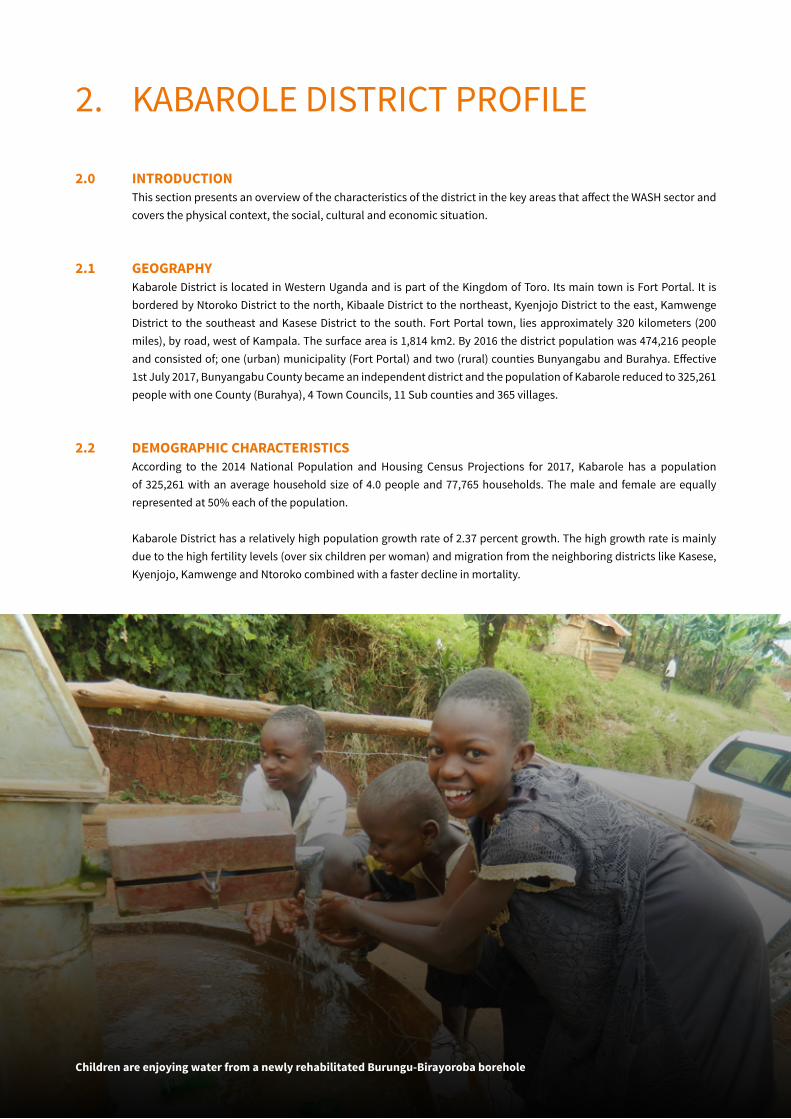
Children are enjoying water from a newly rehabilitated Burungu-Birayoroba borehole
16 Kabarole District WASH master plan 2018-2030
Figure 2 Map of Kabarole District
Kabarole District WASH master plan 2018-2030 17
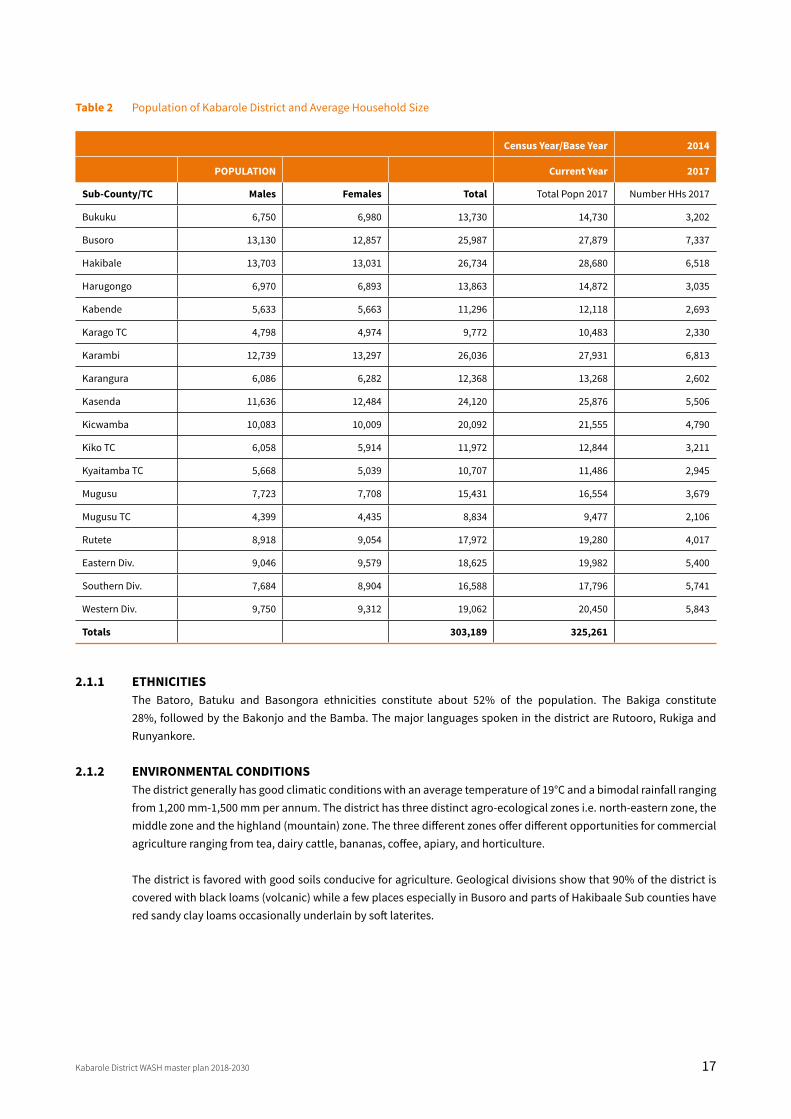
Table 2 Population of Kabarole District and Average Household Size
2.1.1 ETHNICITIESThe Batoro, Batuku and Basongora ethnicities constitute about 52% of the population. The Bakiga constitute 28%, followed by the Bakonjo and the Bamba. The major languages spoken in the district are Rutooro, Rukiga and Runyankore.
2.1.2 ENVIRONMENTAL CONDITIONSThe district generally has good climatic conditions with an average temperature of 19°C and a bimodal rainfall ranging from 1,200 mm-1,500 mm per annum. The district has three distinct agro-ecological zones i.e. north-eastern zone, the middle zone and the highland (mountain) zone. The three different zones offer different opportunities for commercial agriculture ranging from tea, dairy cattle, bananas, coffee, apiary, and horticulture.
The district is favored with good soils conducive for agriculture. Geological divisions show that 90% of the district is covered with black loams (volcanic) while a few places especially in Busoro and parts of Hakibaale Sub counties have red sandy clay loams occasionally underlain by soft laterites.
Census Year/Base Year 2014
POPULATION Current Year 2017
Sub-County/TC Males Females Total Total Popn 2017 Number HHs 2017
Bukuku 6,750 6,980 13,730 14,730 3,202
Busoro 13,130 12,857 25,987 27,879 7,337
Hakibale 13,703 13,031 26,734 28,680 6,518
Harugongo 6,970 6,893 13,863 14,872 3,035
Kabende 5,633 5,663 11,296 12,118 2,693
Karago TC 4,798 4,974 9,772 10,483 2,330
Karambi 12,739 13,297 26,036 27,931 6,813
Karangura 6,086 6,282 12,368 13,268 2,602
Kasenda 11,636 12,484 24,120 25,876 5,506
Kicwamba 10,083 10,009 20,092 21,555 4,790
Kiko TC 6,058 5,914 11,972 12,844 3,211
Kyaitamba TC 5,668 5,039 10,707 11,486 2,945
Mugusu 7,723 7,708 15,431 16,554 3,679
Mugusu TC 4,399 4,435 8,834 9,477 2,106
Rutete 8,918 9,054 17,972 19,280 4,017
Eastern Div. 9,046 9,579 18,625 19,982 5,400
Southern Div. 7,684 8,904 16,588 17,796 5,741
Western Div. 9,750 9,312 19,062 20,450 5,843
Totals 303,189 325,261
18 Kabarole District WASH master plan 2018-2030
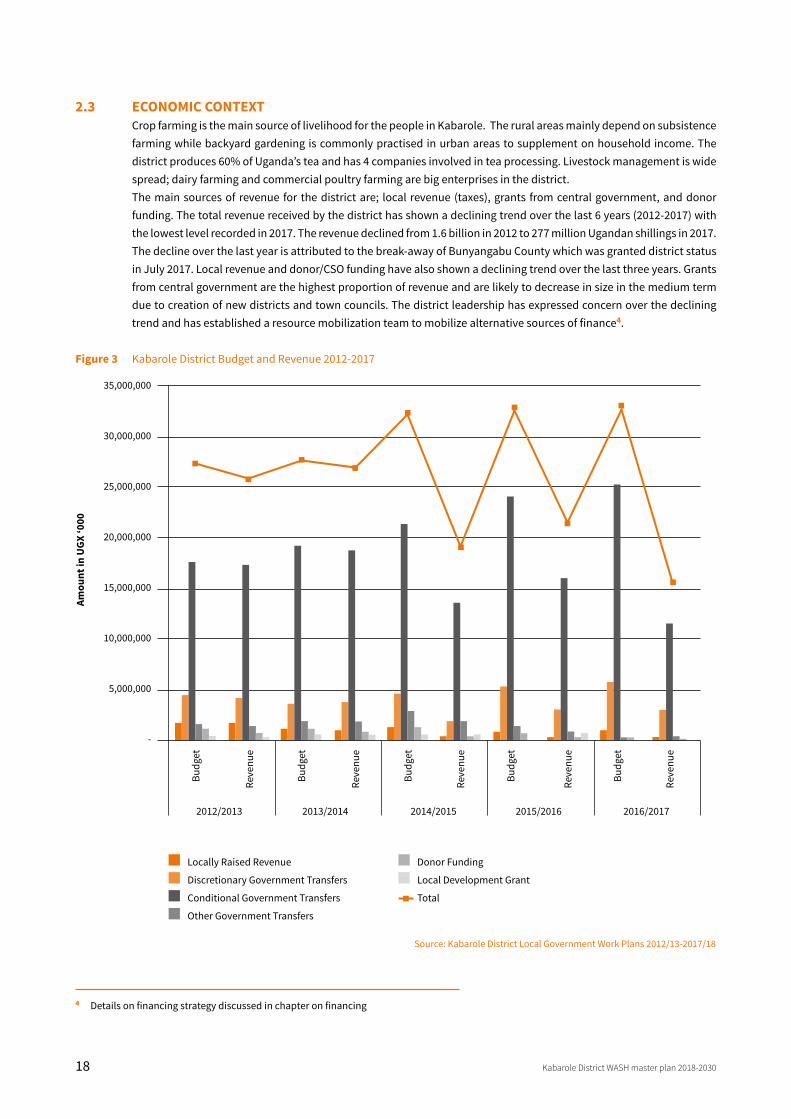
2.3 ECONOMIC CONTEXTCrop farming is the main source of livelihood for the people in Kabarole. The rural areas mainly depend on subsistence farming while backyard gardening is commonly practised in urban areas to supplement on household income. The district produces 60% of Uganda’s tea and has 4 companies involved in tea processing. Livestock management is wide spread; dairy farming and commercial poultry farming are big enterprises in the district. The main sources of revenue for the district are; local revenue (taxes), grants from central government, and donor funding. The total revenue received by the district has shown a declining trend over the last 6 years (2012-2017) with the lowest level recorded in 2017. The revenue declined from 1.6 billion in 2012 to 277 million Ugandan shillings in 2017. The decline over the last year is attributed to the break-away of Bunyangabu County which was granted district status in July 2017. Local revenue and donor/CSO funding have also shown a declining trend over the last three years. Grants from central government are the highest proportion of revenue and are likely to decrease in size in the medium term due to creation of new districts and town councils. The district leadership has expressed concern over the declining trend and has established a resource mobilization team to mobilize alternative sources of finance4.
Figure 3 Kabarole District Budget and Revenue 2012-2017
4 Details on financing strategy discussed in chapter on financing
35,000,000
30,000,000
25,000,000
20,000,000
15,000,000
10,000,000
5,000,000
-
Budg
et
Budg
et
Budg
et
Budg
et
Budg
et
Reve
nue
Reve
nue
Reve
nue
Reve
nue
Reve
nue
2012/2013 2013/2014 2014/2015 2015/2016 2016/2017
Amou
nt in
UGX
‘000
Locally Raised Revenue
Discretionary Government Transfers
Conditional Government Transfers
Other Government Transfers
Donor Funding
Local Development Grant
Total
Source: Kabarole District Local Government Work Plans 2012/13-2017/18
Kabarole District WASH master plan 2018-2030 19
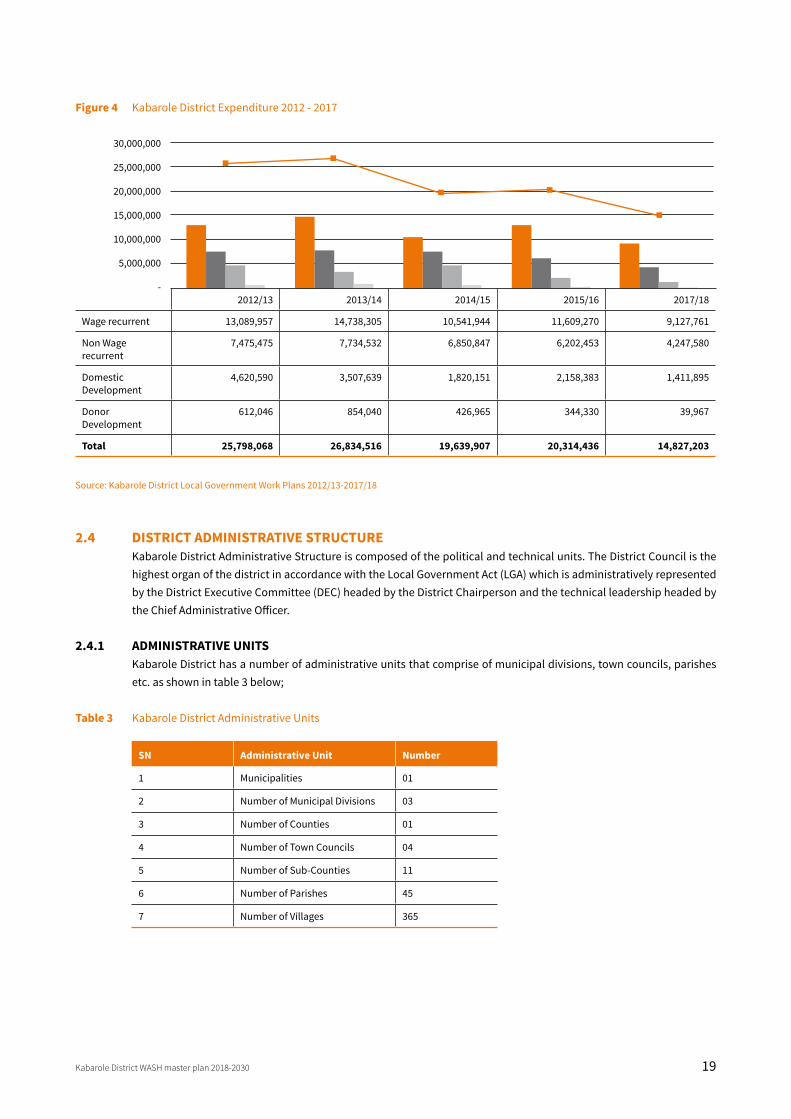
Figure 4 Kabarole District Expenditure 2012 - 2017
Source: Kabarole District Local Government Work Plans 2012/13-2017/18
2.4 DISTRICT ADMINISTRATIVE STRUCTUREKabarole District Administrative Structure is composed of the political and technical units. The District Council is the highest organ of the district in accordance with the Local Government Act (LGA) which is administratively represented by the District Executive Committee (DEC) headed by the District Chairperson and the technical leadership headed by the Chief Administrative Officer.
2.4.1 ADMINISTRATIVE UNITSKabarole District has a number of administrative units that comprise of municipal divisions, town councils, parishes etc. as shown in table 3 below;
Table 3 Kabarole District Administrative Units
2012/13 2013/14 2014/15 2015/16 2017/18
Wage recurrent 13,089,957 14,738,305 10,541,944 11,609,270 9,127,761
Non Wage recurrent
7,475,475 7,734,532 6,850,847 6,202,453 4,247,580
Domestic Development
4,620,590 3,507,639 1,820,151 2,158,383 1,411,895
Donor Development
612,046 854,040 426,965 344,330 39,967
Total 25,798,068 26,834,516 19,639,907 20,314,436 14,827,203
30,000,000
25,000,000
20,000,000
15,000,000
10,000,000
5,000,000
-
SN Administrative Unit Number
1 Municipalities 01
2 Number of Municipal Divisions 03
3 Number of Counties 01
4 Number of Town Councils 04
5 Number of Sub-Counties 11
6 Number of Parishes 45
7 Number of Villages 365
20 Kabarole District WASH master plan 2018-2030
3.0 INTRODUCTIONThis chapter provides a detailed assessment of WASH and IWRM situation and challenges in the district. It presents the state and gaps related to the following thematic areas; water services, sanitation and hygiene WASH in schools and health facilities, and water resources. It also presents the current state of WASH governance and financing and identified gaps, challenges related to these issues, and summary of key findings.
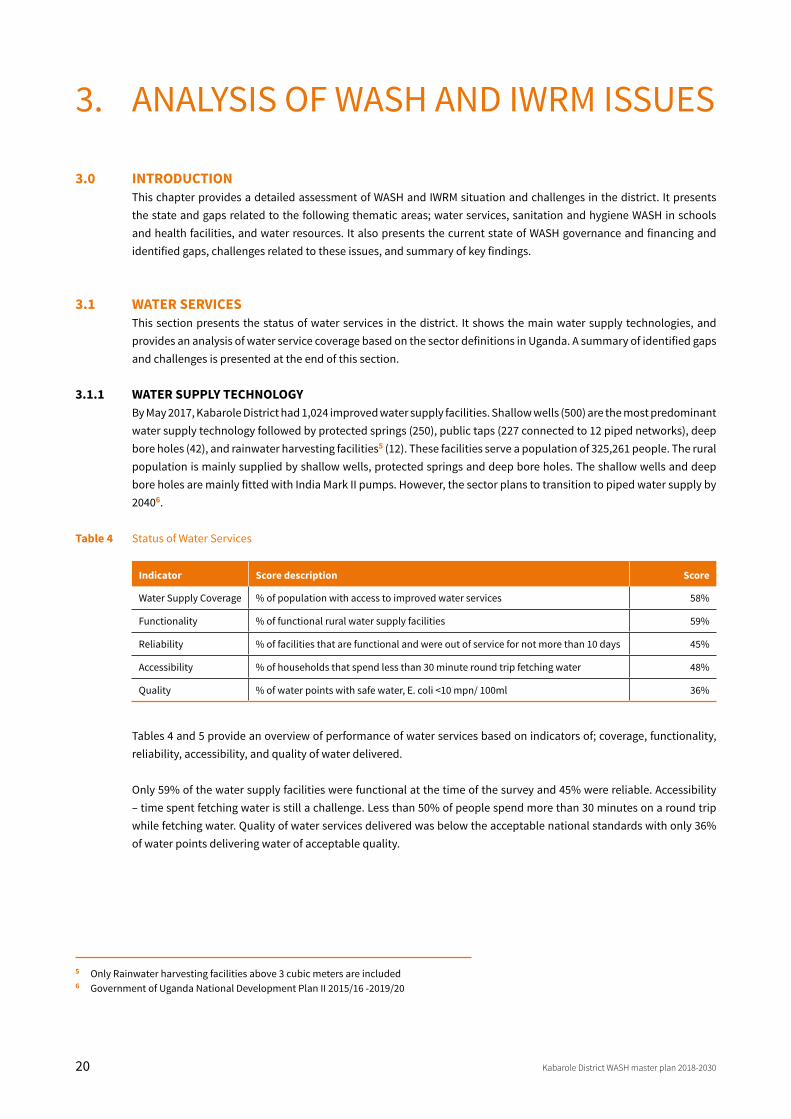
3.1 WATER SERVICESThis section presents the status of water services in the district. It shows the main water supply technologies, and provides an analysis of water service coverage based on the sector definitions in Uganda. A summary of identified gaps and challenges is presented at the end of this section.
3.1.1 WATER SUPPLY TECHNOLOGYBy May 2017, Kabarole District had 1,024 improved water supply facilities. Shallow wells (500) are the most predominant water supply technology followed by protected springs (250), public taps (227 connected to 12 piped networks), deep bore holes (42), and rainwater harvesting facilities5 (12). These facilities serve a population of 325,261 people. The rural population is mainly supplied by shallow wells, protected springs and deep bore holes. The shallow wells and deep bore holes are mainly fitted with India Mark II pumps. However, the sector plans to transition to piped water supply by 20406.
Table 4 Status of Water Services
Tables 4 and 5 provide an overview of performance of water services based on indicators of; coverage, functionality, reliability, accessibility, and quality of water delivered.
Only 59% of the water supply facilities were functional at the time of the survey and 45% were reliable. Accessibility – time spent fetching water is still a challenge. Less than 50% of people spend more than 30 minutes on a round trip while fetching water. Quality of water services delivered was below the acceptable national standards with only 36% of water points delivering water of acceptable quality.
3. ANALYSIS OF WASH AND IWRM ISSUES
Indicator Score description Score
Water Supply Coverage % of population with access to improved water services 58%
Functionality % of functional rural water supply facilities 59%
Reliability % of facilities that are functional and were out of service for not more than 10 days 45%
Accessibility % of households that spend less than 30 minute round trip fetching water 48%
Quality % of water points with safe water, E. coli <10 mpn/ 100ml 36%
5 Only Rainwater harvesting facilities above 3 cubic meters are included6 Government of Uganda National Development Plan II 2015/16 -2019/20
Kabarole District WASH master plan 2018-2030 21
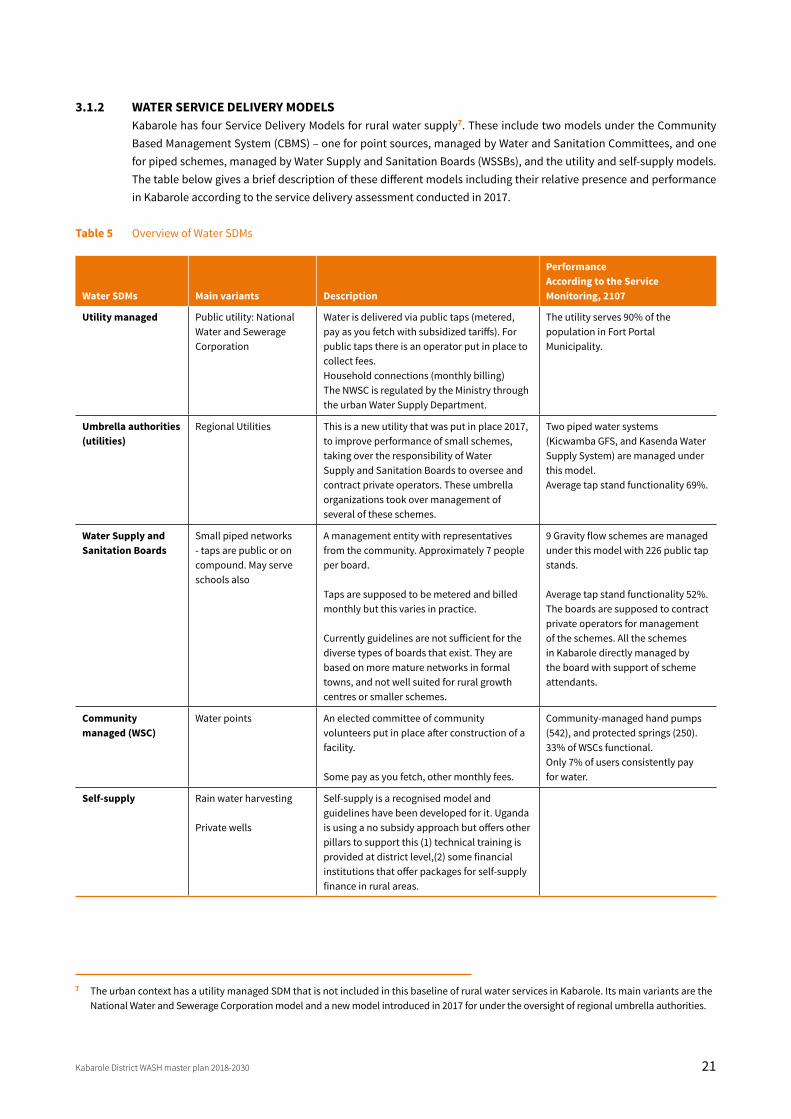
3.1.2 WATER SERVICE DELIVERY MODELSKabarole has four Service Delivery Models for rural water supply7. These include two models under the Community Based Management System (CBMS) – one for point sources, managed by Water and Sanitation Committees, and one for piped schemes, managed by Water Supply and Sanitation Boards (WSSBs), and the utility and self-supply models. The table below gives a brief description of these different models including their relative presence and performance in Kabarole according to the service delivery assessment conducted in 2017.
Table 5 Overview of Water SDMs
Water SDMs Main variants Description
PerformanceAccording to the Service Monitoring, 2107
Utility managed Public utility: National Water and Sewerage Corporation
Water is delivered via public taps (metered, pay as you fetch with subsidized tariffs). For public taps there is an operator put in place to collect fees. Household connections (monthly billing)The NWSC is regulated by the Ministry through the urban Water Supply Department.
The utility serves 90% of the population in Fort Portal Municipality.
Umbrella authorities (utilities)
Regional Utilities This is a new utility that was put in place 2017, to improve performance of small schemes, taking over the responsibility of Water Supply and Sanitation Boards to oversee and contract private operators. These umbrella organizations took over management of several of these schemes.
Two piped water systems (Kicwamba GFS, and Kasenda Water Supply System) are managed under this model.Average tap stand functionality 69%.
Water Supply and Sanitation Boards
Small piped networks - taps are public or on compound. May serve schools also
A management entity with representatives from the community. Approximately 7 people per board.
Taps are supposed to be metered and billed monthly but this varies in practice.
Currently guidelines are not sufficient for the diverse types of boards that exist. They are based on more mature networks in formal towns, and not well suited for rural growth centres or smaller schemes.
9 Gravity flow schemes are managed under this model with 226 public tap stands.
Average tap stand functionality 52%.The boards are supposed to contract private operators for management of the schemes. All the schemes in Kabarole directly managed by the board with support of scheme attendants.
Community managed (WSC)
Water points An elected committee of community volunteers put in place after construction of a facility.
Some pay as you fetch, other monthly fees.
Community-managed hand pumps (542), and protected springs (250).33% of WSCs functional. Only 7% of users consistently pay for water.
Self-supply Rain water harvesting
Private wells
Self-supply is a recognised model and guidelines have been developed for it. Uganda is using a no subsidy approach but offers other pillars to support this (1) technical training is provided at district level,(2) some financial institutions that offer packages for self-supply finance in rural areas.
7 The urban context has a utility managed SDM that is not included in this baseline of rural water services in Kabarole. Its main variants are the National Water and Sewerage Corporation model and a new model introduced in 2017 for under the oversight of regional umbrella authorities.
22 Kabarole District WASH master plan 2018-2030
3.1.3 WATER SUPPLY COVERAGE: SDG DEFINITION According to the Sustainable Development Goals, water services are defined as improved when meeting three criteria; accessible on premises, availability when needed, and free from contamination. Basic services are defined as drinking water from an improved source within a 30-minute round trip, while limited services are defined as drinking water from an improved source exceeding a 30-minute round trip.Although recent household survey data on water supply coverage, which is normally the main basis for this type of analysis, is not available in the district, an estimate of the level of service in line with the JMP service level classification has been made by combining information on population, accessibility of water supply systems, and quality of water services delivered. The available information is mainly on rural areas.
3.1.4 WATER SUPPLY CHALLENGES AND GAPS• Access to water services is low (58%) and is less than the national average estimated at 70%. • Reliability of existing water supply facilities is very low (45%) due to poor operation and maintenance that leads to
frequent breakdown.• High level of contamination of drinking water sources (64%) especially in rural areas.• The willingness of water users to pay for water is still very low. Only 7% consistently pay yet evidence shows that
the majority are able to pay.• The service providers are very weak and are not able to fulfil their management tasks.
3.2 SANITATION AND HYGIENE This section covers the status of sanitation and hygiene service delivery. The services are analyzed across the Sanitation Value Chain that includes; capture, containment, emptying, transport, treatment, and safe reuse or disposal.
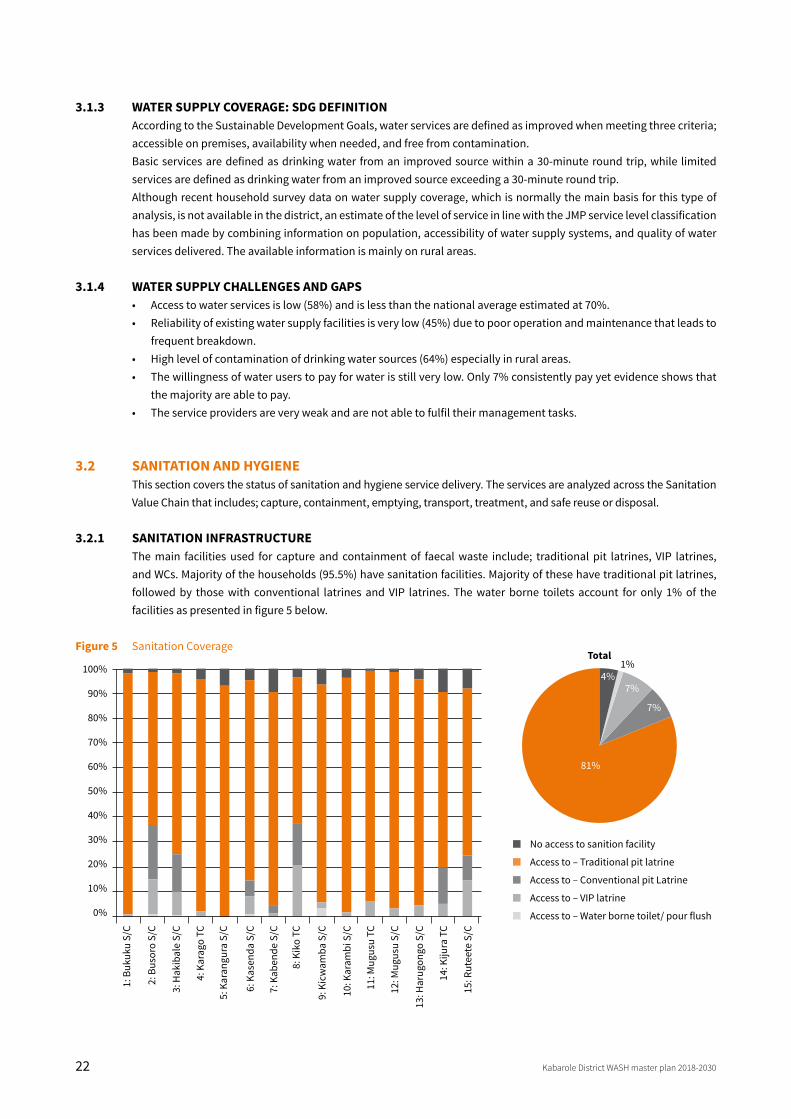
3.2.1 SANITATION INFRASTRUCTUREThe main facilities used for capture and containment of faecal waste include; traditional pit latrines, VIP latrines, and WCs. Majority of the households (95.5%) have sanitation facilities. Majority of these have traditional pit latrines, followed by those with conventional latrines and VIP latrines. The water borne toilets account for only 1% of the facilities as presented in figure 5 below.
Figure 5 Sanitation Coverage
1: B
ukuk
u S/
C
2: B
usor
o S/
C
3: H
akib
ale
S/C
4: K
arag
o TC
5: K
aran
gura
S/C
6: K
asen
da S
/C
7: K
aben
de S
/C
8: K
iko
TC
9: K
icw
amba
S/C
10: K
aram
bi S
/C
11: M
ugus
u TC
12: M
ugus
u S/
C
13: H
arug
ongo
S/C
14: K
ijura
TC
15: R
utee
te S
/C
100%
90%
80%
70%
60%
50%
40%
30%
20%
10%
0%
81%
4%1%
7%
7%
Total
No access to sanition facility
Access to – Traditional pit latrine
Access to – Conventional pit Latrine
Access to – VIP latrine
Access to – Water borne toilet/ pour flush
Kabarole District WASH master plan 2018-2030 23
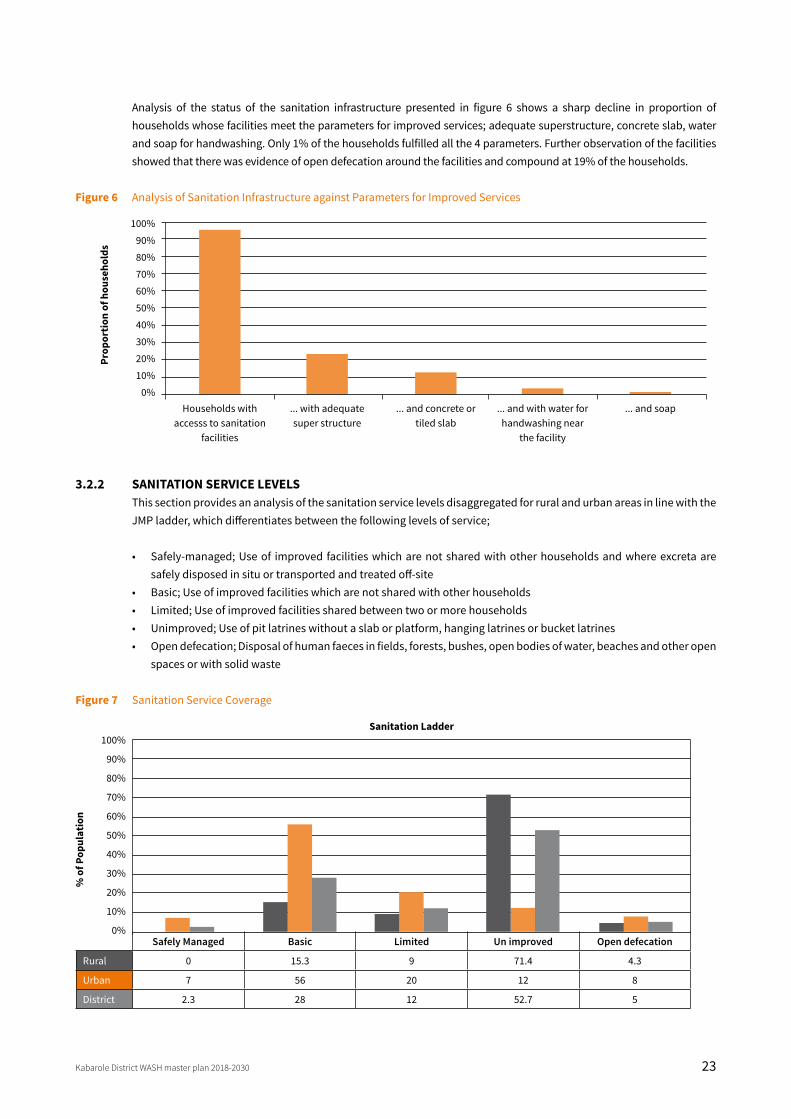
Analysis of the status of the sanitation infrastructure presented in figure 6 shows a sharp decline in proportion of households whose facilities meet the parameters for improved services; adequate superstructure, concrete slab, water and soap for handwashing. Only 1% of the households fulfilled all the 4 parameters. Further observation of the facilities showed that there was evidence of open defecation around the facilities and compound at 19% of the households.
Figure 6 Analysis of Sanitation Infrastructure against Parameters for Improved Services
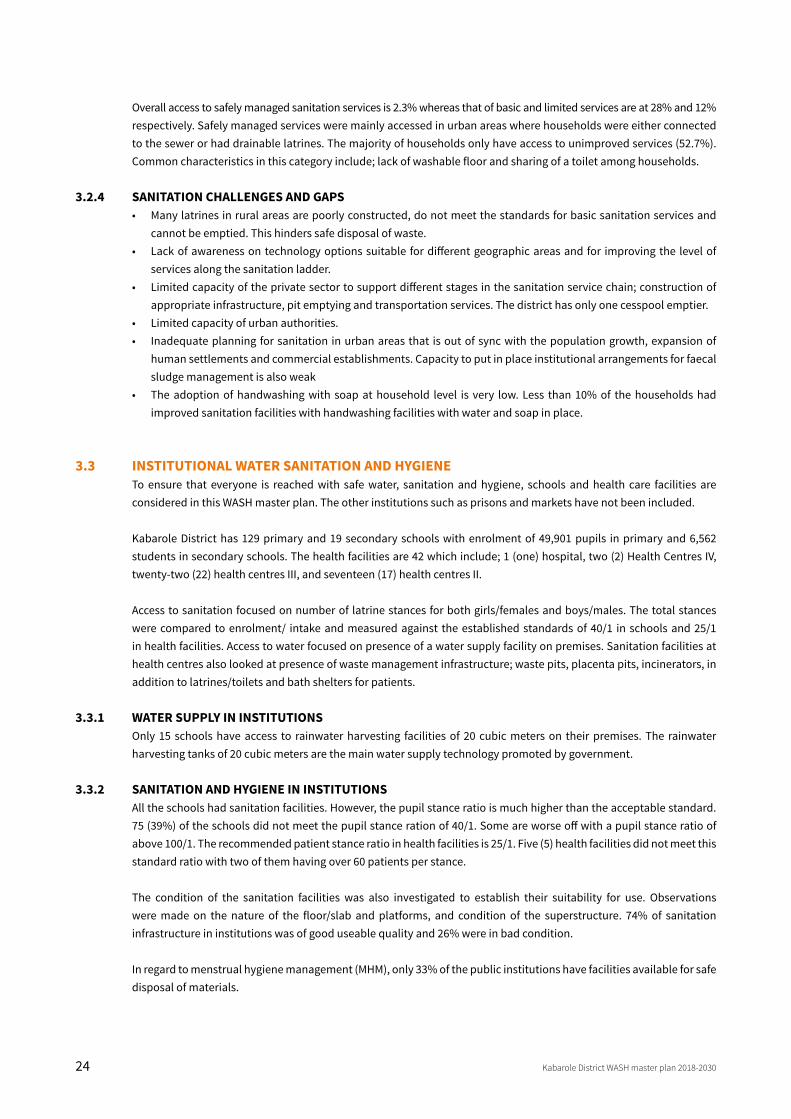
3.2.2 SANITATION SERVICE LEVELS This section provides an analysis of the sanitation service levels disaggregated for rural and urban areas in line with the JMP ladder, which differentiates between the following levels of service;
• Safely-managed; Use of improved facilities which are not shared with other households and where excreta are safely disposed in situ or transported and treated off-site
• Basic; Use of improved facilities which are not shared with other households• Limited; Use of improved facilities shared between two or more households• Unimproved; Use of pit latrines without a slab or platform, hanging latrines or bucket latrines• Open defecation; Disposal of human faeces in fields, forests, bushes, open bodies of water, beaches and other open
spaces or with solid waste
Figure 7 Sanitation Service Coverage
100%90%80%70%60%50%40%30%20%10%
0%
Prop
ortio
n of
hou
seho
lds
Households with accesss to sanitation
facilities
... with adequate super structure
... and concrete or tiled slab
... and with water for handwashing near
the facility
... and soap
Safely Managed Basic Limited Un improved Open defecation
Rural 0 15.3 9 71.4 4.3
Urban 7 56 20 12 8
District 2.3 28 12 52.7 5
% o
f Pop
ulat
ion
Sanitation Ladder100%
90%
80%
70%
60%
50%
40%
30%
20%
10%
0%
24 Kabarole District WASH master plan 2018-2030
Overall access to safely managed sanitation services is 2.3% whereas that of basic and limited services are at 28% and 12% respectively. Safely managed services were mainly accessed in urban areas where households were either connected to the sewer or had drainable latrines. The majority of households only have access to unimproved services (52.7%). Common characteristics in this category include; lack of washable floor and sharing of a toilet among households.
3.2.4 SANITATION CHALLENGES AND GAPS• Many latrines in rural areas are poorly constructed, do not meet the standards for basic sanitation services and
cannot be emptied. This hinders safe disposal of waste. • Lack of awareness on technology options suitable for different geographic areas and for improving the level of
services along the sanitation ladder.• Limited capacity of the private sector to support different stages in the sanitation service chain; construction of
appropriate infrastructure, pit emptying and transportation services. The district has only one cesspool emptier.• Limited capacity of urban authorities. • Inadequate planning for sanitation in urban areas that is out of sync with the population growth, expansion of
human settlements and commercial establishments. Capacity to put in place institutional arrangements for faecal sludge management is also weak
• The adoption of handwashing with soap at household level is very low. Less than 10% of the households had improved sanitation facilities with handwashing facilities with water and soap in place.
3.3 INSTITUTIONAL WATER SANITATION AND HYGIENETo ensure that everyone is reached with safe water, sanitation and hygiene, schools and health care facilities are considered in this WASH master plan. The other institutions such as prisons and markets have not been included.
Kabarole District has 129 primary and 19 secondary schools with enrolment of 49,901 pupils in primary and 6,562 students in secondary schools. The health facilities are 42 which include; 1 (one) hospital, two (2) Health Centres IV, twenty-two (22) health centres III, and seventeen (17) health centres II.
Access to sanitation focused on number of latrine stances for both girls/females and boys/males. The total stances were compared to enrolment/ intake and measured against the established standards of 40/1 in schools and 25/1 in health facilities. Access to water focused on presence of a water supply facility on premises. Sanitation facilities at health centres also looked at presence of waste management infrastructure; waste pits, placenta pits, incinerators, in addition to latrines/toilets and bath shelters for patients.
3.3.1 WATER SUPPLY IN INSTITUTIONSOnly 15 schools have access to rainwater harvesting facilities of 20 cubic meters on their premises. The rainwater harvesting tanks of 20 cubic meters are the main water supply technology promoted by government.
3.3.2 SANITATION AND HYGIENE IN INSTITUTIONSAll the schools had sanitation facilities. However, the pupil stance ratio is much higher than the acceptable standard. 75 (39%) of the schools did not meet the pupil stance ration of 40/1. Some are worse off with a pupil stance ratio of above 100/1. The recommended patient stance ratio in health facilities is 25/1. Five (5) health facilities did not meet this standard ratio with two of them having over 60 patients per stance.
The condition of the sanitation facilities was also investigated to establish their suitability for use. Observations were made on the nature of the floor/slab and platforms, and condition of the superstructure. 74% of sanitation infrastructure in institutions was of good useable quality and 26% were in bad condition. In regard to menstrual hygiene management (MHM), only 33% of the public institutions have facilities available for safe disposal of materials.
Kabarole District WASH master plan 2018-2030 25
3.3.3 INSTITUTIONAL WASH CHALLENGES AND GAPSThe challenges identified include;• Lack of access to basic water services in some schools and health centres.• Majority of the schools lack separate WASH rooms for girls and facilities for safe disposal of menstrual pads.• Lack of functional handwashing facilities at schools.• Non-functional water facilities especially rainwater harvesting tanks.
3.4 WATER RESOURCES MANAGEMENTKabarole is fairly well endowed with water resources including surface water (crater lakes, rivers, streams and wetlands) and ground water, and has adequate rainfall. The district’s freshwater resources are vital for sustaining life and the environment.
The current state of water resources in the district can be described “as adequate” (NWRA, 2013). However, some water resources management challenges that have been noted in the district include;
• Rapid population growth – increasing demand for water.• Increased demands for water for agricultural production, domestic water supply, and industry.• Degradation of water resources due to urbanization, industrialization, poor land use practices.• Faecal contamination of drinking water points.
The major threats to the Mpanga Catchment which is part of Kabarole District, include; increasing human population and weak governance of the natural resources, unsustainable land use practices (deforestation, agriculture), river bank and wetland degradation; siltation of water bodies, pollution, both at commercial and community levels, deteriorating quality and quantity of lake and river water, weak institutional capacity for water resources management and weak or lack of sound governance for water resources management, especially at the sub-catchment level.
According to the Mpanga Catchment Management Plan (2015), the unsustainable water abstraction through gravity flow schemes undertaken without proper hydrological survey and studies is posing a threat to the rivers downstream - decreasing stream flow. Besides these threats, there are cross-cutting issues namely; climate change and variability, high illiteracy rate, rampant poverty and disease that are posing additional threats to the catchment. Some of the interventions carried out by the Albert Water Management Zone (AWMZ), Protos and HEWASA are aimed at addressing some of the issues in the Mpanga Catchment.
The AWMZ has been carrying out restoration activities in Mpanga Catchment and training stakeholder groups and beneficiary community members in soil and water conservation measures in the upper catchment especially in Nyakitokoli village. Nursery bed preparations for both local and improved tree varieties and afforestation in the middle catchment are taking place. Conservation activities and demarcation of a wetland system through restocking with fish in the lower Mpanga Catchment is being conducted as well.
Another emerging issue of attention is climate change. Climate change impacts have the potential to undermine and even undo progress made in improving the socio-economic well-being of citizens. The Joint Technical Review (JTR, 2012) and Water Sector Working Group (WESWG) agreed that 3% of infrastructure budgets should be allocated to catchment and source protection. This is not yet being enforced within Kabarole District. There is therefore a need to encourage and enforce the water use efficiency techniques and practices in the district. Mitigation of climate change impacts and possible adaptation measures are aspects the WASH master plan will have to contend with. Additionally, the lack of water abstraction permits for almost all the piped water supply schemes in the district and non-compliance with the permit conditions, especially the requirement for installation of measuring and control devices, remain the main cause of illegal water abstraction for commercial/industrial use.
26 Kabarole District WASH master plan 2018-2030
3.4.1 WRM CHALLENGES AND GAPS• Increasing human population and weak governance of natural resources.• Unsustainable land use practices (deforestation, agriculture), river bank and wetland degradation, and siltation of
water bodies. • Deteriorating quality and quantity of lake and river water due to pollution from commercial (chemical contamination
from tea growing) and domestic activities (faecal contamination).• Weak institutional capacity for water resources management and lack of sound governance for water resources
management, especially at the sub-catchment level.
3.5 GOVERNANCE: CAPACITY AND PERFORMANCE OF SERVICE PROVIDERS
National Level The Water and Environment sector consists of two sub-sectors; the Water & Sanitation (WSS) sub-sector and the Environment & Natural Resources (ENR) sub-sector. The WSS sub-sector comprises water resources management, rural water supply and sanitation, urban water supply and sanitation, and water for production.
The Ministry of Water and Environment is the apex sector body and responsible for policy development, planning and coordination. Its mission is: “To promote and ensure the rational and sustainable utilization, development and effective management of water and environment resources for socio-economic development of the country”. The Ministry also has the overall responsibility for setting national policies and standards, managing and regulating water resources and determining priorities for water development and management. It also monitors and evaluates sector development programmes to keep track of their performance, efficiency and effectiveness in service delivery.
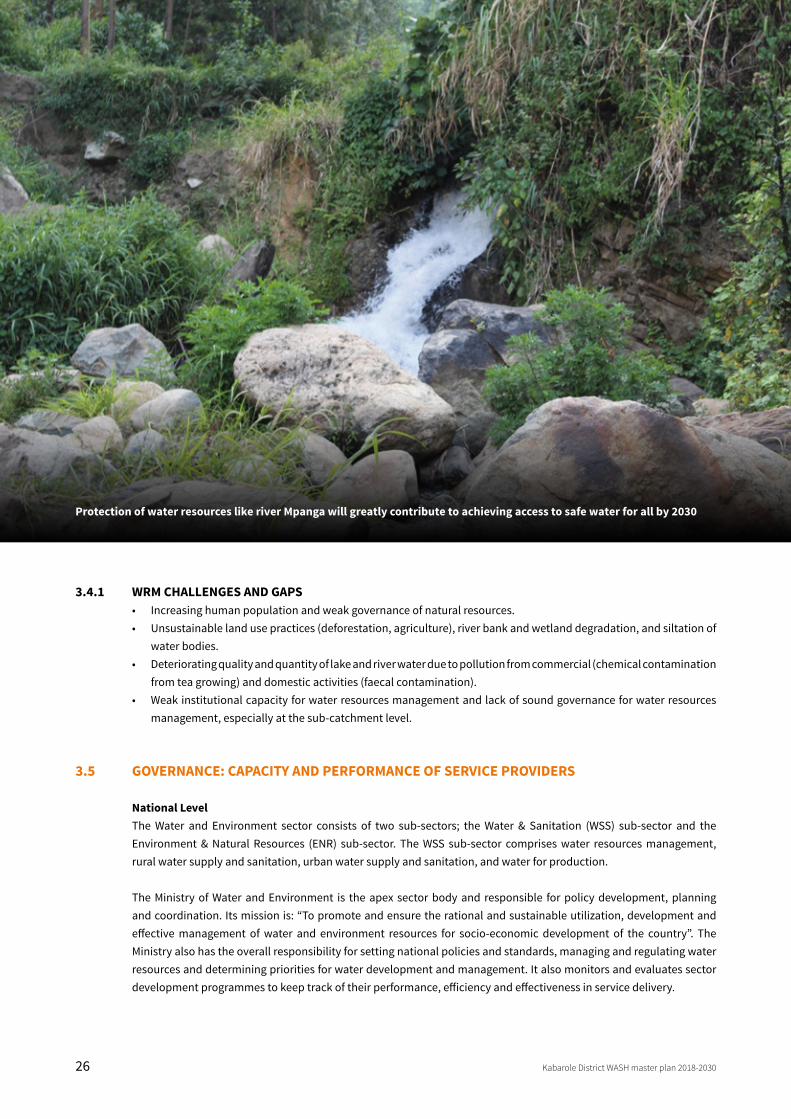
Protection of water resources like river Mpanga will greatly contribute to achieving access to safe water for all by 2030
Kabarole District WASH master plan 2018-2030 27
Government has developed and implemented policies and an institutional framework that provides clarity and separation of functional roles and responsibilities. Within this structure, service provision and management are undertaken at the lowest appropriate level and procurement has been devolved to district level, accompanied by regular audits, capacity building, follow-up monitoring and enforcement of findings, and feedback for learning lessons. At the district level Local Governments (Districts, Sub Counties, Municipalities and Town Councils) are empowered by the Local Governments Act (2000) to provide water services and manage the Environment and Natural Resource base.
The key local government WASH institutions or structures include the District Water Office (DWO) that manages water and sanitation development and oversees the operation and maintenance of existing water supplies and the District Water and Sanitation Coordination Committees (DWSCCs) comprised of administrative and political leaders, technocrats and NGO/CBO representatives at district level. The DWSCC co-ordinates planning and implementation of water and sanitation activities, reviews all district work plans and budgets for water and sanitation and advises the district council through the Sectoral Committee.
Institutional Capacity and Support FunctionsOverall, the institutional arrangements for rural water supply in Kabarole are well developed including the definition of roles for both the service authority and service provider (score 8/10). The service authority is in place with clearly defined roles, and responsibilities, however, the human resource capacity is not adequate to fulfil the role of direct support to service providers and community mobilization activities. Three (3) of the five (5) staff positions of the district office are filled by substantive officers. The District Water Office has an annual plan and budget endorsed by the District Council and receives regular backup support from the Technical Support Unit 6 of the Ministry of Water and Environment. Less support is available for service providers on a regular basis, and community-level service providers (WSCs) reported having infrequent contact with district authorities (ONA report, 2017). The district has budget allocations for providing direct support to WSCs but can only provide technical support to less than 40% of service providers. Data on service provider performance is collected annually and used to update the information system. CSOs such as IRC, HEWASA and JESE have been critical in supporting the district to fulfil this function.
Asset Inventory and Maintenance Plan The WASH asset management functions are only partially filled in the district. Data on physical state of the assets is not consistently updated. The planning for asset management is not consistent and Capital Maintenance Expenditure projections are only estimates. The Water Source Inventory has not been updated fully in the last two or so years, looking primarily at the physical state of the assets. Asset Management Plans (AMPs) could be developed for each water supply system. The other area that needs improvement is Asset Audit and Improvement mechanisms. This could be addressed by the service authorities within the district or through support obtained from the regulations unit of MWE.
Monitoring System The data from the monitoring system is used to some extent at district level. The data guides planning for unserved areas. However, data is not analysed for use at service provider level and besides the district annually collects and updates data following the set performance indicators. There is inconsistency in the data at district and national level. This compromises reliability of the data.
Water Resources ManagementWater source protection guidelines developed by the Ministry of Water and Environment in 2013 have not yet been adopted by service providers at district and sub-county levels. Most of the service provides and/or authorities develop and expand the water and sanitation supply infrastructure without taking into account water resource availability and variability, including vulnerability to extreme events, as well as impact on receiving water bodies due to disposal of faecal sludge and wastewater. Generally, the expansion of water supply infrastructure does not take into account resource availability.
28 Kabarole District WASH master plan 2018-2030
Coordination of Stakeholders at District Level Kabarole District has a number of platforms that provide opportunity for coordination and facilitation of learning among stakeholders. The platforms include; the District Water and Sanitation Coordination Committee, the Bi-annual Sanitation and Hygiene Coordination Meetings, and the Rwenzori WASH Alliance (Rwenzori Regional Learning Forum). The different WASH stakeholders in the district are well coordinated and collaborate on joint implementation of WASH and IWRM interventions.
Planning and Budgeting at the District LevelKabarole has district level WASH plans that are split between water and sanitation. The work plans are prepared annually. The district has a five year development plan that guides investment in different sectors. The district has also adopted an investment planning tool developed in 2016 to guide planning for universal access to WASH services taking into account the Capital Investments and Maintenance Expenditure and Direct Support costs required to reach everyone with WASH services by 2030. The tool was one of the key resources for development of this master plan.
3.6 DISTRICT WASH FINANCINGThe Water and Environment Sector has historically received funding at a level of less than 1% of GDP. With this level of funding, the Sector has not been able to make adequate progress towards its targets for resource protection and service provision. The limited resource envelope coupled with a population growth rate of 3.05% per year has hindered significant progress in access to safe water which has stagnated at 65% - 67% over the last five years8.
District Water & Sanitation Development Conditional Grant for Rural WaterThe main financing mechanism from government for WASH services in rural areas at the district level is through the Water and Sanitation Conditional Grant. The grant has two budget lines; a development and a non-wage recurrent budget line.
Development budget line; A minimum of 80% of the sector development budget line is allocated to capital - infrastructure, facilities and equipment as well as maintenance of district specific access and O&M needs. Such facilities include: water sources/points, public toilets and sewerage disposal. Districts can use part of the sector development grant for office construction and other administrative investments upon requesting and authorization by MWE. Overall, a maximum of 15% of the Sector Development Budget can be allocated to rehabilitation of major repair of water sources at both the sub-county and district levels and up to 5% of the value of sector infrastructure investments (Development Grant) can be allocated to investment servicing costs, including feasibility studies, procurement and monitoring costs.Non-wage recurrent budget line; The software activities are allocated up to 50%, supervision, monitoring and DWO operations up to 14%, coordination up to 26% and a flexibility of 10% is allowed at the discretion of the district.
District Sanitation & Hygiene Conditional Grant (DSHCG) Kabarole District over the last four (4) years has been accessing UGX 22 million from the DSHCG, to support sanitation and hygiene improvement in two (2) selected sub-counties, targeting 25 villages annually.
District Environment & Natural Resource (Wetlands) Conditional GrantThis grant is disbursed to the Natural Resources Department of Kabarole District annually and it’s aimed at funding protection of natural resources, including forests and wetlands. Over the last five (5) years, Kabarole has been receiving UGX 6,012,207 annually.
8 Access here is based on sector definition of % of population with 1 km (rural), 500 meters (urban) of an improved water facility
Kabarole District WASH master plan 2018-2030 29
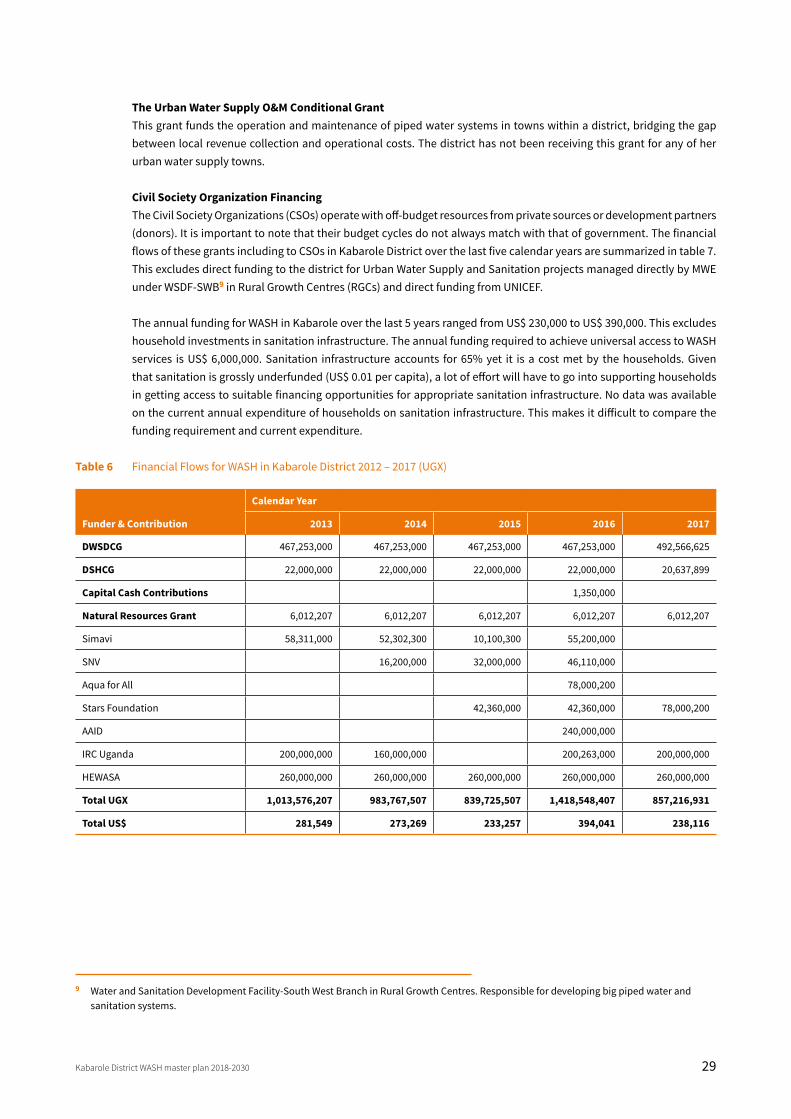
The Urban Water Supply O&M Conditional GrantThis grant funds the operation and maintenance of piped water systems in towns within a district, bridging the gap between local revenue collection and operational costs. The district has not been receiving this grant for any of her urban water supply towns.
Civil Society Organization FinancingThe Civil Society Organizations (CSOs) operate with off-budget resources from private sources or development partners (donors). It is important to note that their budget cycles do not always match with that of government. The financial flows of these grants including to CSOs in Kabarole District over the last five calendar years are summarized in table 7. This excludes direct funding to the district for Urban Water Supply and Sanitation projects managed directly by MWE under WSDF-SWB9 in Rural Growth Centres (RGCs) and direct funding from UNICEF.
The annual funding for WASH in Kabarole over the last 5 years ranged from US$ 230,000 to US$ 390,000. This excludes household investments in sanitation infrastructure. The annual funding required to achieve universal access to WASH services is US$ 6,000,000. Sanitation infrastructure accounts for 65% yet it is a cost met by the households. Given that sanitation is grossly underfunded (US$ 0.01 per capita), a lot of effort will have to go into supporting households in getting access to suitable financing opportunities for appropriate sanitation infrastructure. No data was available on the current annual expenditure of households on sanitation infrastructure. This makes it difficult to compare the funding requirement and current expenditure.
Table 6 Financial Flows for WASH in Kabarole District 2012 – 2017 (UGX)
Funder & Contribution
Calendar Year
2013 2014 2015 2016 2017
DWSDCG 467,253,000 467,253,000 467,253,000 467,253,000 492,566,625
DSHCG 22,000,000 22,000,000 22,000,000 22,000,000 20,637,899
Capital Cash Contributions 1,350,000
Natural Resources Grant 6,012,207 6,012,207 6,012,207 6,012,207 6,012,207
Simavi 58,311,000 52,302,300 10,100,300 55,200,000
SNV 16,200,000 32,000,000 46,110,000
Aqua for All 78,000,200
Stars Foundation 42,360,000 42,360,000 78,000,200
AAID 240,000,000
IRC Uganda 200,000,000 160,000,000 200,263,000 200,000,000
HEWASA 260,000,000 260,000,000 260,000,000 260,000,000 260,000,000
Total UGX 1,013,576,207 983,767,507 839,725,507 1,418,548,407 857,216,931
Total US$ 281,549 273,269 233,257 394,041 238,116
9 Water and Sanitation Development Facility-South West Branch in Rural Growth Centres. Responsible for developing big piped water and sanitation systems.
3.7 RESOURCE MOBILIZATION FOR THE MASTER PLANKabarole District will have to increase its annual expenditure on WASH serves to more than 10 times the current level of spending to ensure universal access to WASH services by 2030. The following strategies have been adopted to increase financing for WASH services;• Establishment of a resource mobilization committee to support fundraising efforts for the master plan. The
committee will be composed of six (6) members including; Chief Administrative Officer, Planner, DWO, TSU, CSO representative (HEWASA), and the District Secretary for Works. The committee will have annual resource mobilization targets that will guide their work.
• Development of joint proposals with CSOs on implementation of specific WASH projects. • Map the big private sector players/commercial consumers of water in the district and develop business cases for
collaboration on improving access to WASH services and sustaining water resources.• Allocate proportion of locally raised revenue and Discretionary Development Grant towards financing of WASH
interventions at sub-county level.• Liaise with financial institutions to develop loan products for investing in increasing access to WASH services. The
products will support artisans in acquiring tools and equipment, while households will have an opportunity to improve or acquire appropriate sanitation infrastructure.
3.8 EQUITY AND INCLUSION ISSUES
The baseline survey (2017) on status of WASH services showed that 46 out of the 365 villages in Kabarole have never had access to improved water services within their geographic boundaries. It is recommended in this WASH master plan that the district local government and all development partners prioritize these communities when investing in new water supply facilities in line with the presidential directive on ensuring that each village is served with a water supply facility.
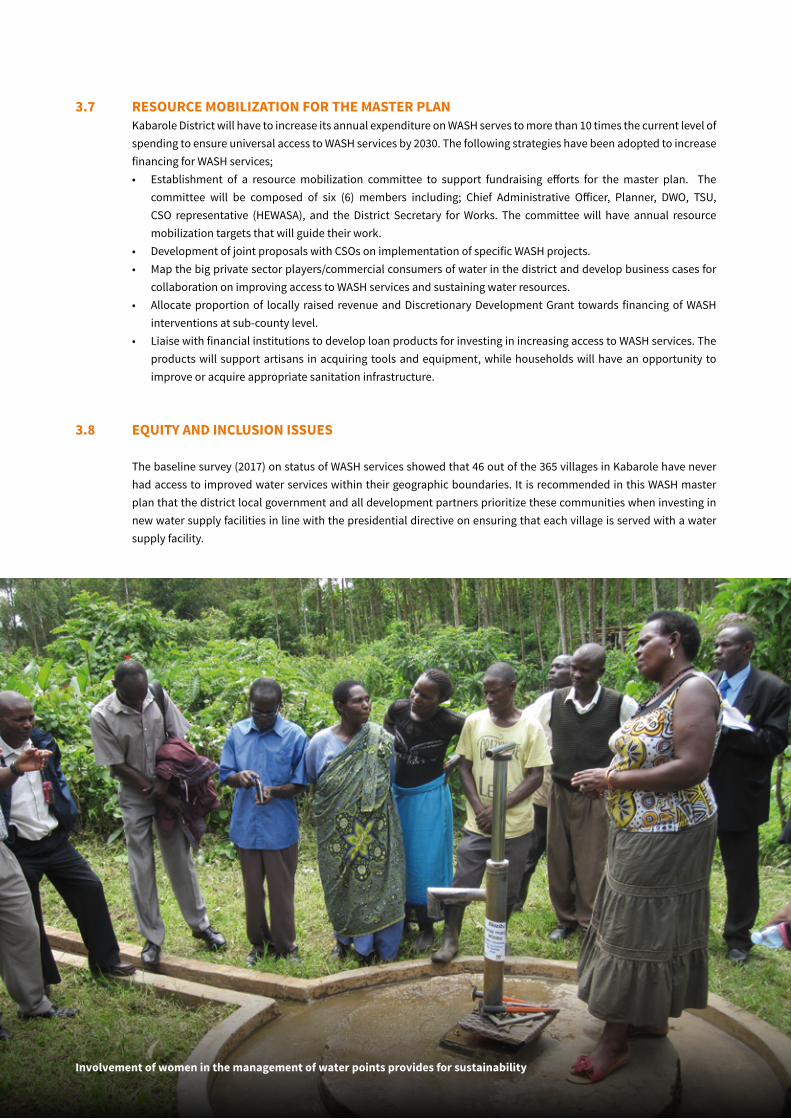
Involvement of women in the management of water points provides for sustainability
Kabarole District WASH master plan 2018-2030 31
4.0 INTRODUCTIONThis chapter presents the population projections for the period 2018 – 2020 and implications for addressing the WASH needs of the district. It deduces the targets for WASH from the current baseline to the medium (2021) and long term (2030) as per the following thematic areas: water; sanitation, WASH in institutions, and IWRM. The strategic actions to meet the targets as well as the risk and mitigation measures are also presented.
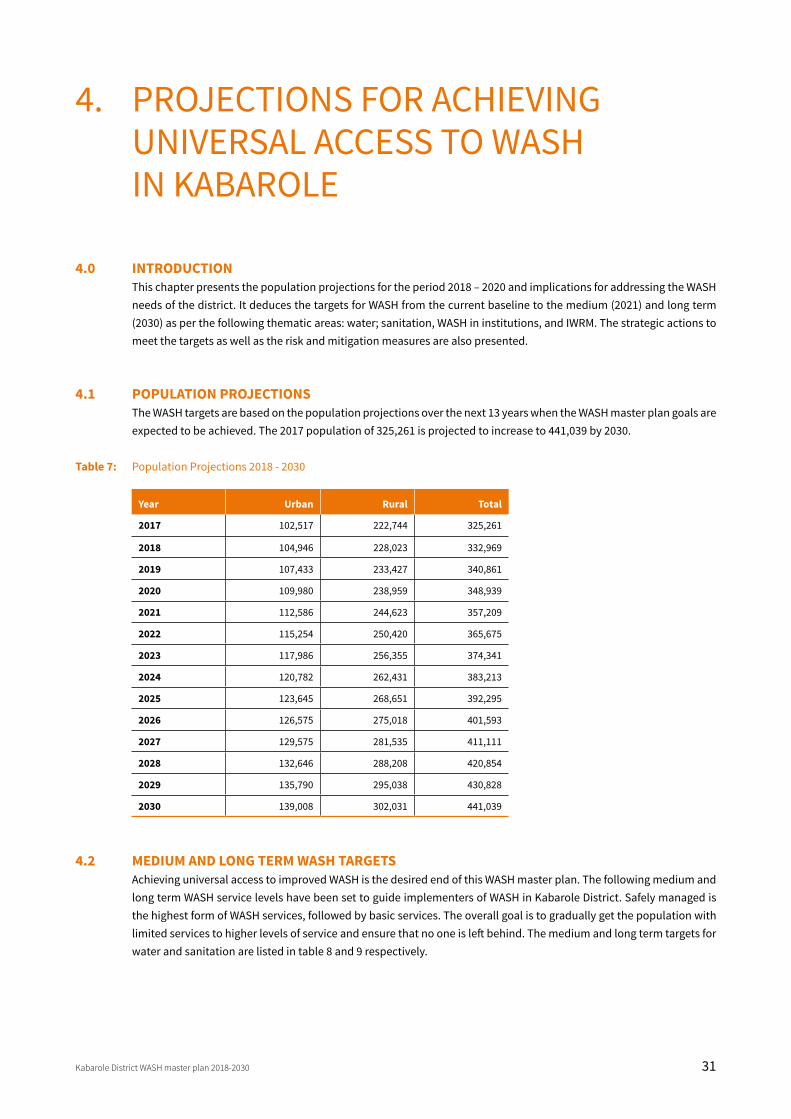
4.1 POPULATION PROJECTIONSThe WASH targets are based on the population projections over the next 13 years when the WASH master plan goals are expected to be achieved. The 2017 population of 325,261 is projected to increase to 441,039 by 2030.
Table 7: Population Projections 2018 - 2030
4.2 MEDIUM AND LONG TERM WASH TARGETSAchieving universal access to improved WASH is the desired end of this WASH master plan. The following medium and long term WASH service levels have been set to guide implementers of WASH in Kabarole District. Safely managed is the highest form of WASH services, followed by basic services. The overall goal is to gradually get the population with limited services to higher levels of service and ensure that no one is left behind. The medium and long term targets for water and sanitation are listed in table 8 and 9 respectively.
4. PROJECTIONS FOR ACHIEVING UNIVERSAL ACCESS TO WASH IN KABAROLE
Year Urban Rural Total
2017 102,517 222,744 325,261
2018 104,946 228,023 332,969
2019 107,433 233,427 340,861
2020 109,980 238,959 348,939
2021 112,586 244,623 357,209
2022 115,254 250,420 365,675
2023 117,986 256,355 374,341
2024 120,782 262,431 383,213
2025 123,645 268,651 392,295
2026 126,575 275,018 401,593
2027 129,575 281,535 411,111
2028 132,646 288,208 420,854
2029 135,790 295,038 430,828
2030 139,008 302,031 441,039
32 Kabarole District WASH master plan 2018-2030
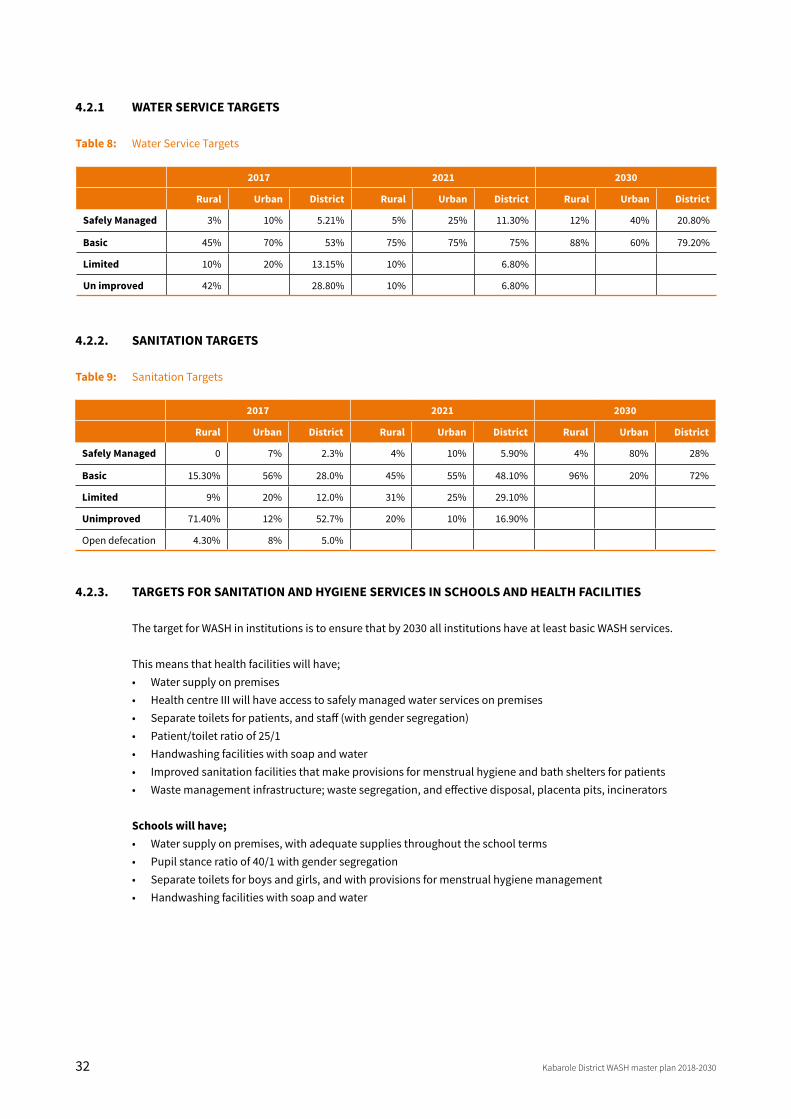
4.2.1 WATER SERVICE TARGETS
Table 8: Water Service Targets
4.2.2. SANITATION TARGETS
Table 9: Sanitation Targets
4.2.3. TARGETS FOR SANITATION AND HYGIENE SERVICES IN SCHOOLS AND HEALTH FACILITIES
The target for WASH in institutions is to ensure that by 2030 all institutions have at least basic WASH services.
This means that health facilities will have;• Water supply on premises• Health centre III will have access to safely managed water services on premises• Separate toilets for patients, and staff (with gender segregation)• Patient/toilet ratio of 25/1 • Handwashing facilities with soap and water• Improved sanitation facilities that make provisions for menstrual hygiene and bath shelters for patients• Waste management infrastructure; waste segregation, and effective disposal, placenta pits, incinerators
Schools will have;• Water supply on premises, with adequate supplies throughout the school terms • Pupil stance ratio of 40/1 with gender segregation • Separate toilets for boys and girls, and with provisions for menstrual hygiene management• Handwashing facilities with soap and water
2017 2021 2030
Rural Urban District Rural Urban District Rural Urban District
Safely Managed 3% 10% 5.21% 5% 25% 11.30% 12% 40% 20.80%
Basic 45% 70% 53% 75% 75% 75% 88% 60% 79.20%
Limited 10% 20% 13.15% 10% 6.80%
Un improved 42% 28.80% 10% 6.80%
2017 2021 2030
Rural Urban District Rural Urban District Rural Urban District
Safely Managed 0 7% 2.3% 4% 10% 5.90% 4% 80% 28%
Basic 15.30% 56% 28.0% 45% 55% 48.10% 96% 20% 72%
Limited 9% 20% 12.0% 31% 25% 29.10%
Unimproved 71.40% 12% 52.7% 20% 10% 16.90%
Open defecation 4.30% 8% 5.0%
Kabarole District WASH master plan 2018-2030 33
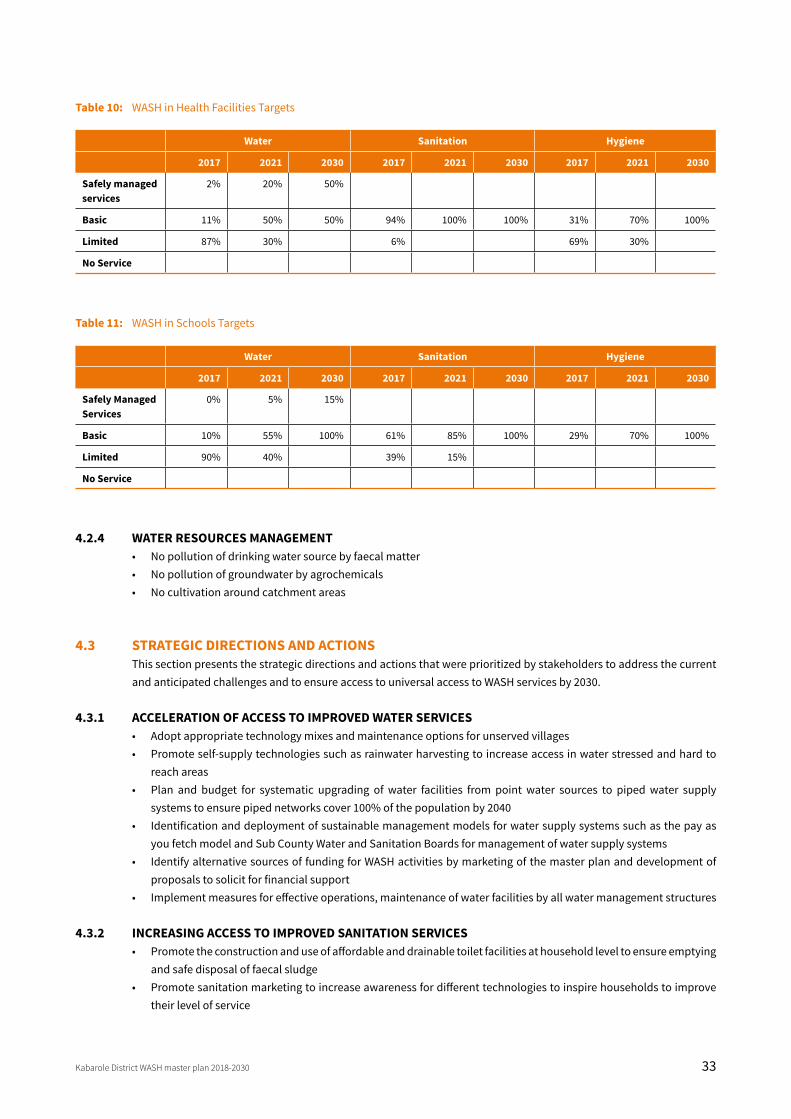
Table 10: WASH in Health Facilities Targets
Table 11: WASH in Schools Targets
4.2.4 WATER RESOURCES MANAGEMENT• No pollution of drinking water source by faecal matter• No pollution of groundwater by agrochemicals• No cultivation around catchment areas
4.3 STRATEGIC DIRECTIONS AND ACTIONSThis section presents the strategic directions and actions that were prioritized by stakeholders to address the current and anticipated challenges and to ensure access to universal access to WASH services by 2030.
4.3.1 ACCELERATION OF ACCESS TO IMPROVED WATER SERVICES• Adopt appropriate technology mixes and maintenance options for unserved villages• Promote self-supply technologies such as rainwater harvesting to increase access in water stressed and hard to
reach areas• Plan and budget for systematic upgrading of water facilities from point water sources to piped water supply
systems to ensure piped networks cover 100% of the population by 2040• Identification and deployment of sustainable management models for water supply systems such as the pay as
you fetch model and Sub County Water and Sanitation Boards for management of water supply systems• Identify alternative sources of funding for WASH activities by marketing of the master plan and development of
proposals to solicit for financial support• Implement measures for effective operations, maintenance of water facilities by all water management structures
4.3.2 INCREASING ACCESS TO IMPROVED SANITATION SERVICES • Promote the construction and use of affordable and drainable toilet facilities at household level to ensure emptying
and safe disposal of faecal sludge• Promote sanitation marketing to increase awareness for different technologies to inspire households to improve
their level of service
Water Sanitation Hygiene
2017 2021 2030 2017 2021 2030 2017 2021 2030
Safely managed services
2% 20% 50%
Basic 11% 50% 50% 94% 100% 100% 31% 70% 100%
Limited 87% 30% 6% 69% 30%
No Service
Water Sanitation Hygiene
2017 2021 2030 2017 2021 2030 2017 2021 2030
Safely Managed Services
0% 5% 15%
Basic 10% 55% 100% 61% 85% 100% 29% 70% 100%
Limited 90% 40% 39% 15%
No Service
34 Kabarole District WASH master plan 2018-2030
• Build the capacity of private sector in provision of sanitation services for example emptying and transportation of faecal sludge
• Rollout implementation of sanitation plans in all emerging small towns• Gazette and establish a site for treatment and safe disposal of faecal sludge to cater for the rapid population growth
and urbanization needs• Promote home improvement campaigns• Review, gazette and enforce district by-laws on sanitation• Incorporate hygiene education in all water and sanitation delivery programmes
4.3.3 INCREASING ACCESS TO IMPROVED WASH SERVICES IN SCHOOLS AND HEALTH FACILITIES• Provide safely managed water services to all health centres III• Provide basic water services to all health centres II• Provide safely managed water services to all schools in urban areas• Provide basic water services to all schools in rural areas• Promote the construction and use of drainable toilet facilities at schools and health facilities to ensure emptying
and safe disposal of faecal sludge• Provide handwashing facilities to all schools and health facilities • To ensure sanitation facilities in schools have provisions for menstrual hygiene management
4.3.4 WATER RESOURCE MANAGEMENT• To support catchment conservation through the promotion of sustainable practices such as; appropriate forest
management, sustainable agricultural and land use management and conserve fragile ecosystems• To ensure water source protection by addressing both point and non-point water pollution sources and ensuring
improved waste disposal• To improve compliance and law enforcement through monitoring of surface and ground water resources,
developing and implementing effluent discharge control plans• To ensure stakeholder sensitization, capacity building and institutional development through community
awareness in environmental management issues, revival and set up of new institutional structures for effective implementation
• To promote a rights-based approach to catchment management by promoting gender mainstreaming in water resources management and supporting the inclusion of vulnerable communities in all planning processes
4.3.5 CROSS-CUTTING ISSUESThe proposed strategic actions will be implemented in line with the existing national policy framework on gender mainstreaming, environmental management, and inclusive development.
Coordination and collaboration with other sectors such as education, health, community development and agriculture will be strengthened through the District Water and Sanitation Coordination Committee, Mpanga Catchment Management Committee and other multi-stakeholder forums at district and regional level.
4.4 RISKS AND MITIGATION This section presents the risks that could hinder implementation of the master plan, the likelihood of their occurrence and the corresponding mitigation measures to minimize them. It also analyzes the extent to which a risk is likely.
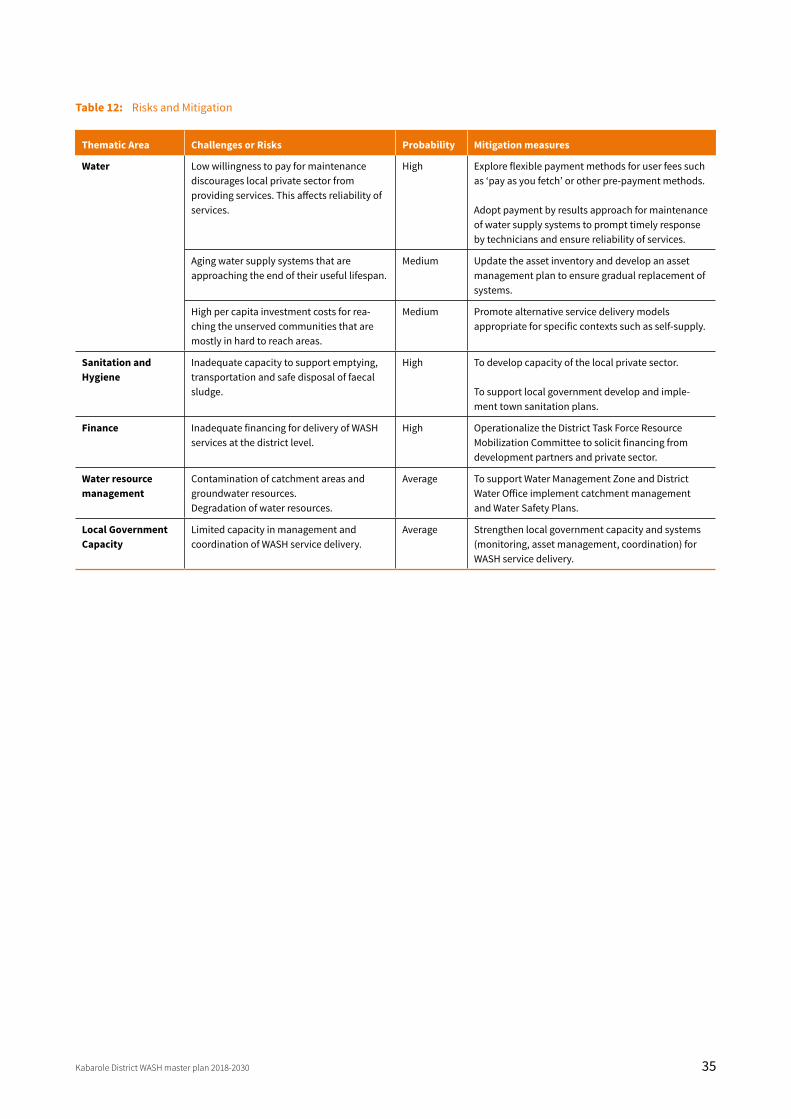
Kabarole District WASH master plan 2018-2030 35
Table 12: Risks and Mitigation
Thematic Area Challenges or Risks Probability Mitigation measures
Water Low willingness to pay for maintenance discourages local private sector from providing services. This affects reliability of services.
High Explore flexible payment methods for user fees such as ‘pay as you fetch’ or other pre-payment methods.
Adopt payment by results approach for maintenance of water supply systems to prompt timely response by technicians and ensure reliability of services.
Aging water supply systems that are approaching the end of their useful lifespan.
Medium Update the asset inventory and develop an asset management plan to ensure gradual replacement of systems.
High per capita investment costs for rea-ching the unserved communities that are mostly in hard to reach areas.
Medium Promote alternative service delivery models appropriate for specific contexts such as self-supply.
Sanitation and Hygiene
Inadequate capacity to support emptying, transportation and safe disposal of faecal sludge.
High To develop capacity of the local private sector.
To support local government develop and imple-ment town sanitation plans.
Finance Inadequate financing for delivery of WASH services at the district level.
High Operationalize the District Task Force Resource Mobilization Committee to solicit financing from development partners and private sector.
Water resource management
Contamination of catchment areas and groundwater resources.Degradation of water resources.
Average To support Water Management Zone and District Water Office implement catchment management and Water Safety Plans.
Local Government Capacity
Limited capacity in management and coordination of WASH service delivery.
Average Strengthen local government capacity and systems (monitoring, asset management, coordination) for WASH service delivery.
36 Kabarole District WASH master plan 2018-2030
This chapter presents the roles of different actors in implementation of the master plan.
5.1 DISTRICT ACTORSThe strategic actions in this master plan will be integrated with the existing five year District Development Plans (DDP) for implementation. The consolidated costed plans could be extracted on an annual basis whereby implementation activities as contained in the master plan will be extracted and harmonized with the annual work plans. The financial flows to the district in a particular financial year should be taken into account when doing this.
The District Executive Committee (DEC) will be the top political organ in the district for the overall oversight and implementation of the master plan. The Chief Administrative Officer (CAO) will be the head of the technical team which consists of; District Environment Office, Health Department, District Community Development Office, Planning Unit and District Water Office mandated to carry out the implementation process. The office of the CAO and Planning Unit will ensure that the master plan is aligned with the district’s five year Development Plan. The consolidated costed plans for water and sanitation will be extracted on an annual basis and harmonized with the district annual plan. The CAO will ensure that the plan is financed and the required partnerships established to facilitate its implementation. The CAO will work with a resource mobilization team comprising of the District Planner, Water Officer, Secretary of Finance, Health Inspector, and CSO representatives among others to attract additional resources outside the traditional district budgets.
Representatives of religious institutions were instrumental in the process of development of the master plan. These will continue to reach out to communities to support behaviour change campaigns associated with sanitation and hygiene improvement. The institutions will also be allies for resource mobilization of resources from their constituencies.
Civil Society Organizations (CSOs include; NGOs, CBOs and their respective networks). CSOs will be responsible for mobilizing off-budget resources to directly support implementation, monitoring and learning interventions. They will also provide support in promotion and dissemination of the plan within and outside the district through their regional coordinator to attract relevant partners. Kabarole has a functional coordination platform (District Water and Sanitation Coordination Committee) that will be responsible for coordinating activities of NGOs and CBOs, and aligning them to priorities. Private sector, these include Hand Pump Mechanic Associations and artisans involved in operation and maintenance of water and sanitation services, commercial banks (PostBank, HOFKAM) with loan products for WASH services, and large scale water consumers such as tea production companies.
5.2 REGIONAL AND NATIONAL GOVERNMENT ACTORSThe following regional level institutions will be involved in implementation of the plan;• Ministry of Water and Environment – Technical Support Unit 6: Provide direct support to the District Water Office• Ministry of Water and Environment – Albert Water Management Zone: Technical support in catchment protection,
and water quality surveillance • Mid-Western Umbrella for Water and Sanitation: Provide technical support on operation and maintenance for
piped water supply systems in small towns• Catchment Management Organization - Coordinate implementation of Water Resource Management interventions• Rwenzori Regional Learning Forum – Promote learning and information exchange on emerging lessons from
implementation of the plan
5. PARTNERSHIPS AND IMPLEMENTATION OF THE WASH MASTER PLAN
Kabarole District WASH master plan 2018-2030 37
5.3 DEVELOPMENT PARTNERS AND NGOSThe district will work closely with partners such as indigenous and international NGOs, multilateral agencies such as UNICEF to mobilize resources and support implementation of the master plan. The Resource Mobilization Sub Committee of the District WASH Task Team will also ensure that new partners are on board during the implementation of the plan. A list of existing partners is presented below;
IRC is an international think-and-do tank that works with governments, NGOs, businesses and people around the world to find long-term solutions to the global crisis in water, sanitation and hygiene services and integrated water resources management (IWRM) in developing countries.
Health through Water and Sanitation (HEWASA) is an NGO under the Catholic Diocese of Fort Portal that works to improve access to water, sanitation and hygiene in communities, schools and health facilities. It is also the coordinator for WASH NGOs in the Rwenzori region under the Uganda Water and Sanitation NGO Network (UWASNET).
Joint Effort to Save the Environment (JESE) is an NGO started in 1993. It works to improve rural communities through improved agricultural production, Natural Resources Management, and improving access to WASH services.
Protos is a development cooperation NGO campaigning for better water management in developing countries and in Belgium. Protos supports local NGOs, farmers and user organizations, local authorities and regional government services in developing adequate processes to achieve sustainable water management. Protos is the leading champion for IWRM in the Rwenzori region and the broader WASH sector in Uganda.
SNV is an international NGO that works with local partners (indigenous organizations, local governments) to equip communities, businesses and organizations with the tools, knowledge and connections they need to increase their incomes and gain access to basic services – empowering them to break the cycle of poverty and guide their own development. UNICEF is a United Nations Agency that works to save children’s lives, to defend their rights, and to help them fulfil their potential. UNICEF provides direct financial support to districts to increase access to WASH services for children.
5.4. IMPLEMENTATION OF THE WASH MASTER PLAN
5.4.1 MANAGEMENT STRUCTURE AND OPERATIONALIZATION The WASH master plan is multi-sectoral and cross-cutting intended to bring on board all the stakeholders involved in WASH service provision and IWRM. The resources required for implementation are also shared between various players provided they are linked to WASH service delivery in Kabarole District. The District Local Government leadership will provide overarching leadership to the management, resourcing and implementation of the WASH master plan. Technical guidance from the District Water Office, and District Planner is important to keep the stakeholders on the correct path stipulated by the master plan.
38 Kabarole District WASH master plan 2018-2030
6.1 INTRODUCTIONA survey of “Ugandans’ experiences and opinions on affordable access to clean and safe water” which Twaweza East Africa published in June 2018 turned up interesting findings in the context of WASH.10 Two of the main findings from the study, based on a nationally representative sample, are particularly noteworthy: (i) More citizens said that their access to water was getting worse and (ii) Half of the population was dissatisfied with local government provision of water services.11
Recognizing that there is often a gap between reality and perception, this integrated Communication, Advocacy, Networking, and Knowledge Management Strategy for the Kabarole District WASH master plan, will act as a pulse check on citizens’ information and impressions about the implementation and impact of the master plan; and on their awareness and understanding of WASH issues, developments, and improvements in Kabarole District.
It is anticipated that the master plan will enable Kabarole District to secure adequate and sustained funding for WASH. Accordingly, there is need to make a “business case” for WASH as this will help to attract and generate resources beyond the traditional government budgetary allocations.
Kabarole District prides itself as Uganda’s foremost tourist destination, with tremendous economic prospects for the population in the district. WASH services are essential as a key driver for economic growth and for improving the quality of people’s lives. Likewise, water resources management practices are critical for their contribution to nature conservation and to the district’s appeal as a destination for domestic and international tourists. Through the WASH master plan, Kabarole District has the opportunity to brand and market itself as Uganda’s pre-eminent tourist destination on the premise of its WASH standards.
6.2 GOALThe goal of the Communication Strategy12 is to build interest in, maintain popular support for, and catalyse the implementation of the Kabarole District WASH master plan by enabling two major outcomes:
1. Endorsement of the master plan as a district-level framework for planning, marketing, coordinating investments, and implementing the vision and policy objectives for WASH in Kabarole District.
2. Adoption of knowledge, attitudes, practices, and behaviours that will secure the buy-in of all beneficiaries and stakeholders and advance the WASH priorities for Kabarole District.
6.3 OBJECTIVES AND ACTIVITIESThe Communication strategy will propagate stronger and sustained understanding, approval, and adoption of the vision and objectives of the Kabarole District WASH master plan by focusing on four primary objectives and related sets of activities.
6. COMMUNICATION, ADVOCACY AND NETWORKS
10 https://www.twaweza.org/uploads/files/SzW_Ug_r3_WASH%20_Final.pdf 11 Sauti za Wananchi, Round 3, 15 January and 2 February 2018 (https://www.twaweza.org/uploads/files/SzW_Ug_r3_WASH%20_Final.pdf)12 Short for Communication, Advocacy, Networking, and Knowledge Management Plan.
Kabarole District WASH master plan 2018-2030 39
Communication objective:To raise the visibility, profile, and perception of Kabarole District and its partners as champions for efficient delivery of WASH services; and to amplify the impact, results, and benefits of the interventions reflected in the WASH master plan targets for 2030.
Activities:1. Raise awareness of and build citizen confidence in the Kabarole District WASH master plan and its mission of
universal access to WASH by 2030.
2. Facilitate regular two-way communication and feedback between the implementers of the WASH master plan and the citizens of Kabarole District as its beneficiaries.
3. Keep the WASH community of practice, stakeholders, and citizens abreast of important and unfolding issues and developments in the WASH sector in Kabarole District and in the national and international spheres.
4. Showcase the results, outcomes, and impacts of the Kabarole District WASH master plan and the local government’s efforts to achieve universal access to WASH by 2030.
5. Identify, package, and disseminate compelling WASH data and evidence that will alert policy makers, decision makers, duty bearers, political leaders, and influencers to the scale of the WASH challenge and the impact of interventions in Kabarole District.
6. Monitor the implementation of the master plan and regularly disseminate information about progress towards the set targets.
Advocacy objective:To promote Kabarole District as a success story in the delivery of WASH services; and to influence decision makers to stay the course and to replicate and scale up the Kabarole model for delivering as well as expanding access to and uptake of WASH services.
Activities:1. Demonstrate the relationship between poverty and WASH by using compelling data to influence policy and
convince decision makers about the need for increased investment in improved access to WASH.
1. Showcase successful WASH interventions to demonstrate the potential and opportunities for scaling up and replicating those that hold the most promise for achieving the objectives of the WASH master plan.
2. Demonstrate the economic benefits of and gains from improvements in WASH service delivery and investments in WASH infrastructure especially for underserved populations and communities in Kabarole District.
3. Mobilize WASH champions to support and drive the campaign to raise funds for the WASH master plan from the central and local governments, private and non-profit sectors, and development partners.
Networking objective:To mobilize all stakeholders to get engaged with the WASH sector and issues; and to motivate them to take accountability for the policies, measures, and initiatives undertaken to improve the standards, coverage, utilization, and financing of WASH services, infrastructure, and investments in Kabarole District.
40 Kabarole District WASH master plan 2018-2030
Activities:1. Nurture and support a community of practice of WASH practitioners to deepen local engagement with the vision
and policy objectives of the WASH master plan.
2. Engage stakeholders and representatives of WASH service users through regular outreach, information sharing, and dialogue to establish and address their needs, interests, and concerns.
3. Mobilize and engage with CSOs and other non-state organizations to participate in efforts to promote necessary changes in WASH policies and associated knowledge, social norms, and practices in Kabarole District.
4. Collaborate with CSOs and development agencies to consolidate and sustain the gains attained in implementing the WASH master plan and to accelerate the momentum for future success.
5. Convene the WASH community of practice to share research and experiences from implementation and enable the process of building the capacities of practitioners and stakeholders.
Knowledge management objective:To generate, capture, store, process, distribute, and connect stakeholders to knowledge products and services; and to support the creation, collection, organization, and dissemination of the Kabarole WASH sector experiences so as to share the lessons learnt for continuous improvement of interventions. Activities:1. Improve access to WASH knowledge in Kabarole District by providing high-quality, relevant, user-friendly, and
timely knowledge and information products and services.
2. Facilitate learning and application of WASH knowledge by providing guidance and opportunities to share information, data, and evidence from implementation of the master plan.
3. Develop and manage the Kabarole District WASH knowledge resources to foster continuous professional
development for WASH practitioners and to nurture informed public debate about the sector.
4. Create and package information into knowledge products such as policy briefs, technical briefing notes, factsheets, impact/human interest stories, project profiles, best practice summaries, and lessons learnt.
5. Develop robust and functional information management platforms and tools hosted on the district web portal. The platform will grant controlled access to information sources stored in shared repositories.
6. Create opportunities to share and learn from the best practices and create incentives for knowledge sharing.
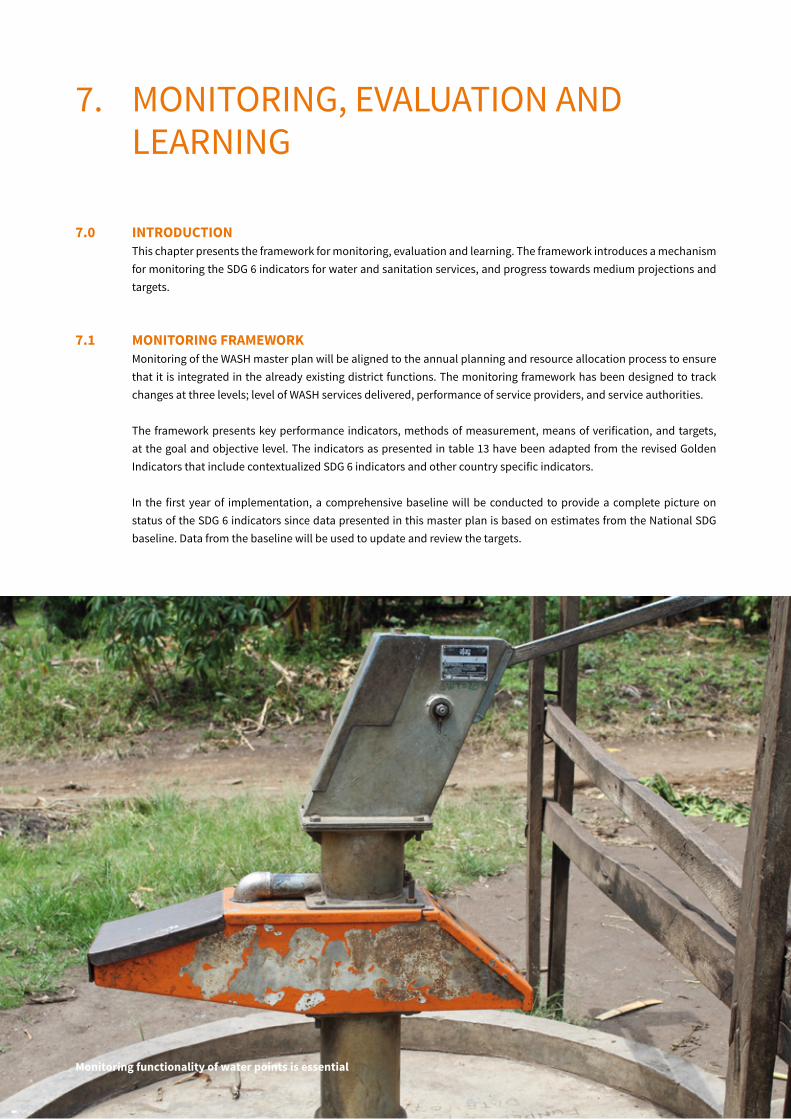
7.0 INTRODUCTIONThis chapter presents the framework for monitoring, evaluation and learning. The framework introduces a mechanism for monitoring the SDG 6 indicators for water and sanitation services, and progress towards medium projections and targets.
7.1 MONITORING FRAMEWORKMonitoring of the WASH master plan will be aligned to the annual planning and resource allocation process to ensure that it is integrated in the already existing district functions. The monitoring framework has been designed to track changes at three levels; level of WASH services delivered, performance of service providers, and service authorities.
The framework presents key performance indicators, methods of measurement, means of verification, and targets, at the goal and objective level. The indicators as presented in table 13 have been adapted from the revised Golden Indicators that include contextualized SDG 6 indicators and other country specific indicators.
In the first year of implementation, a comprehensive baseline will be conducted to provide a complete picture on status of the SDG 6 indicators since data presented in this master plan is based on estimates from the National SDG baseline. Data from the baseline will be used to update and review the targets.
7. MONITORING, EVALUATION AND LEARNING
Monitoring functionality of water points is essential
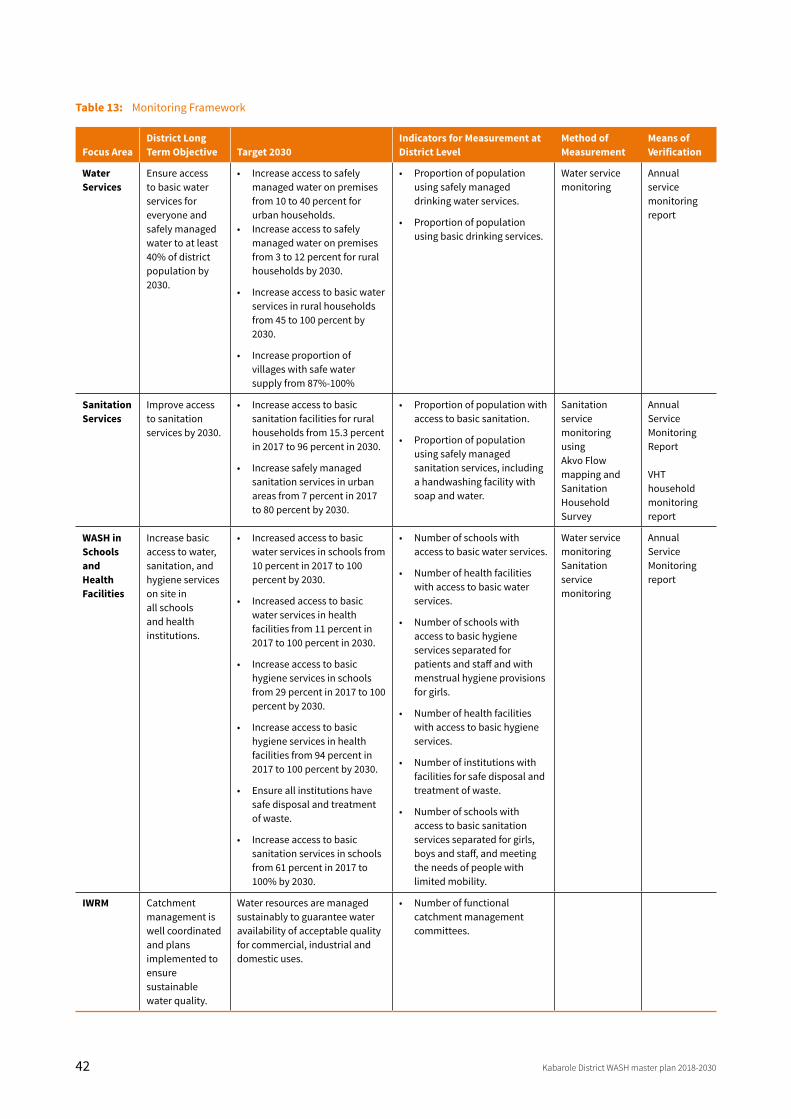
42 Kabarole District WASH master plan 2018-2030
Table 13: Monitoring Framework
Focus AreaDistrict Long Term Objective Target 2030
Indicators for Measurement at District Level
Method of Measurement
Means of Verification
Water Services
Ensure access to basic water services for everyone and safely managed water to at least 40% of district population by 2030.
• Increase access to safely managed water on premises from 10 to 40 percent for urban households.
• Increase access to safely managed water on premises from 3 to 12 percent for rural households by 2030.
• Increase access to basic water services in rural households from 45 to 100 percent by 2030.
• Increase proportion of villages with safe water supply from 87%-100%
• Proportion of population using safely managed drinking water services.
• Proportion of population using basic drinking services.
Water servicemonitoring
Annual service monitoring report
Sanitation Services
Improve access to sanitation services by 2030.
• Increase access to basic sanitation facilities for rural households from 15.3 percent in 2017 to 96 percent in 2030.
• Increase safely managed sanitation services in urban areas from 7 percent in 2017 to 80 percent by 2030.
• Proportion of population with access to basic sanitation.
• Proportion of population using safely managed sanitation services, including a handwashing facility with soap and water.
Sanitation servicemonitoring usingAkvo Flow mapping and Sanitation Household Survey
Annual Service Monitoring Report
VHT household monitoring report
WASH in Schoolsand HealthFacilities
Increase basic access to water,sanitation, and hygiene serviceson site in all schools and health institutions.
• Increased access to basic water services in schools from 10 percent in 2017 to 100 percent by 2030.
• Increased access to basic water services in health facilities from 11 percent in 2017 to 100 percent in 2030.
• Increase access to basic hygiene services in schools from 29 percent in 2017 to 100 percent by 2030.
• Increase access to basic hygiene services in health facilities from 94 percent in 2017 to 100 percent by 2030.
• Ensure all institutions have safe disposal and treatment of waste.
• Increase access to basic sanitation services in schools from 61 percent in 2017 to 100% by 2030.
• Number of schools with access to basic water services.
• Number of health facilities with access to basic water services.
• Number of schools with access to basic hygiene services separated for patients and staff and with menstrual hygiene provisions for girls.
• Number of health facilities with access to basic hygiene services.
• Number of institutions with facilities for safe disposal and treatment of waste.
• Number of schools with access to basic sanitation services separated for girls, boys and staff, and meeting the needs of people with limited mobility.
Water servicemonitoringSanitation servicemonitoring
Annual Service Monitoring report
IWRM Catchment management is well coordinated and plans implemented toensure sustainable water quality.
Water resources are managed sustainably to guarantee water availability of acceptable quality for commercial, industrial anddomestic uses.
• Number of functional catchment management committees.
Kabarole District WASH master plan 2018-2030 43
7.2 REPORTING The District Water and Sanitation Coordination Committee will be the main entity that will monitor the implementation of the master plan on an annual basis and will coordinate actions of different stakeholders. The committee will be responsible for submitting progress reports to the District Executive Committee which will oversee implementation of the plan.
7.3 EVALUATIONA series of mid-term evaluations will be conducted during implementation of the master plan. The first evaluation will be conducted in 2021 to review; implementation strategies, take stock of emerging lessons and progress towards achievement of mid-term targets. This will be followed by another review in 2026 to concretize lessons learnt, successes, failures, and adapt strategies to fast track implementation of the plan. A summative evaluation will then be conducted in 2030 to review overall progress against the targets.
7.4 LEARNING SHARING AND ADAPTIVE CAPACITYLearning and knowledge management will be mainstreamed during the implementation of the master plan. District WASH stakeholders will have the opportunity to share lessons, apply different experiments on delivering and managing WASH services, and adapt implementation strategies. The annual service monitoring exercises will be used to generate evidence on the level of services provided, and lessons from applying different strategies. A series of platforms from district to national level will be used to facilitate learning and information exchange. These include;
• District Water and Sanitation Coordination Committee will coordinate district stakeholders, take stock of emerging lessons, challenges, and opportunities on quarterly basis.
• Rwenzori Regional Learning Forum will be used to share experiences at regional level with actors from 12 districts under the jurisdiction of the Technical Support Unit 6.
• Joint Water and Environment Sector Review Meeting will be used to share experiences with WASH stakeholders at national level. The platform will mainly be used to flag common issues from the regional level, rally support for adapting policies, and resource allocation envelopes.
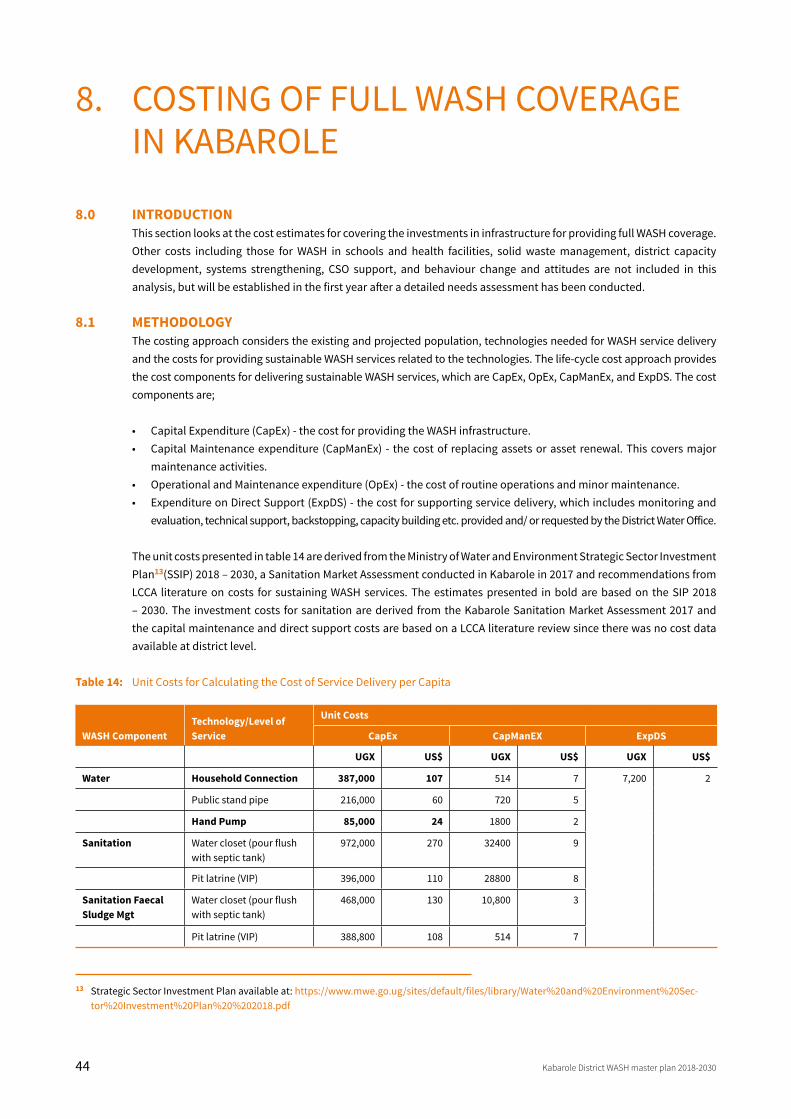
44 Kabarole District WASH master plan 2018-2030
8.0 INTRODUCTIONThis section looks at the cost estimates for covering the investments in infrastructure for providing full WASH coverage. Other costs including those for WASH in schools and health facilities, solid waste management, district capacity development, systems strengthening, CSO support, and behaviour change and attitudes are not included in this analysis, but will be established in the first year after a detailed needs assessment has been conducted.
8.1 METHODOLOGYThe costing approach considers the existing and projected population, technologies needed for WASH service delivery and the costs for providing sustainable WASH services related to the technologies. The life-cycle cost approach provides the cost components for delivering sustainable WASH services, which are CapEx, OpEx, CapManEx, and ExpDS. The cost components are;
• Capital Expenditure (CapEx) - the cost for providing the WASH infrastructure.• Capital Maintenance expenditure (CapManEx) - the cost of replacing assets or asset renewal. This covers major
maintenance activities.• Operational and Maintenance expenditure (OpEx) - the cost of routine operations and minor maintenance.• Expenditure on Direct Support (ExpDS) - the cost for supporting service delivery, which includes monitoring and
evaluation, technical support, backstopping, capacity building etc. provided and/ or requested by the District Water Office.
The unit costs presented in table 14 are derived from the Ministry of Water and Environment Strategic Sector Investment Plan13(SSIP) 2018 – 2030, a Sanitation Market Assessment conducted in Kabarole in 2017 and recommendations from LCCA literature on costs for sustaining WASH services. The estimates presented in bold are based on the SIP 2018 – 2030. The investment costs for sanitation are derived from the Kabarole Sanitation Market Assessment 2017 and the capital maintenance and direct support costs are based on a LCCA literature review since there was no cost data available at district level.
Table 14: Unit Costs for Calculating the Cost of Service Delivery per Capita
8. COSTING OF FULL WASH COVERAGE IN KABAROLE
13 Strategic Sector Investment Plan available at: https://www.mwe.go.ug/sites/default/files/library/Water%20and%20Environment%20Sec-tor%20Investment%20Plan%20%202018.pdf
WASH ComponentTechnology/Level of Service
Unit Costs
CapEx CapManEX ExpDS
UGX US$ UGX US$ UGX US$
Water Household Connection 387,000 107 514 7 7,200 2
Public stand pipe 216,000 60 720 5
Hand Pump 85,000 24 1800 2
Sanitation Water closet (pour flush with septic tank)
972,000 270 32400 9
Pit latrine (VIP) 396,000 110 28800 8
Sanitation Faecal Sludge Mgt
Water closet (pour flush with septic tank)
468,000 130 10,800 3
Pit latrine (VIP) 388,800 108 514 7
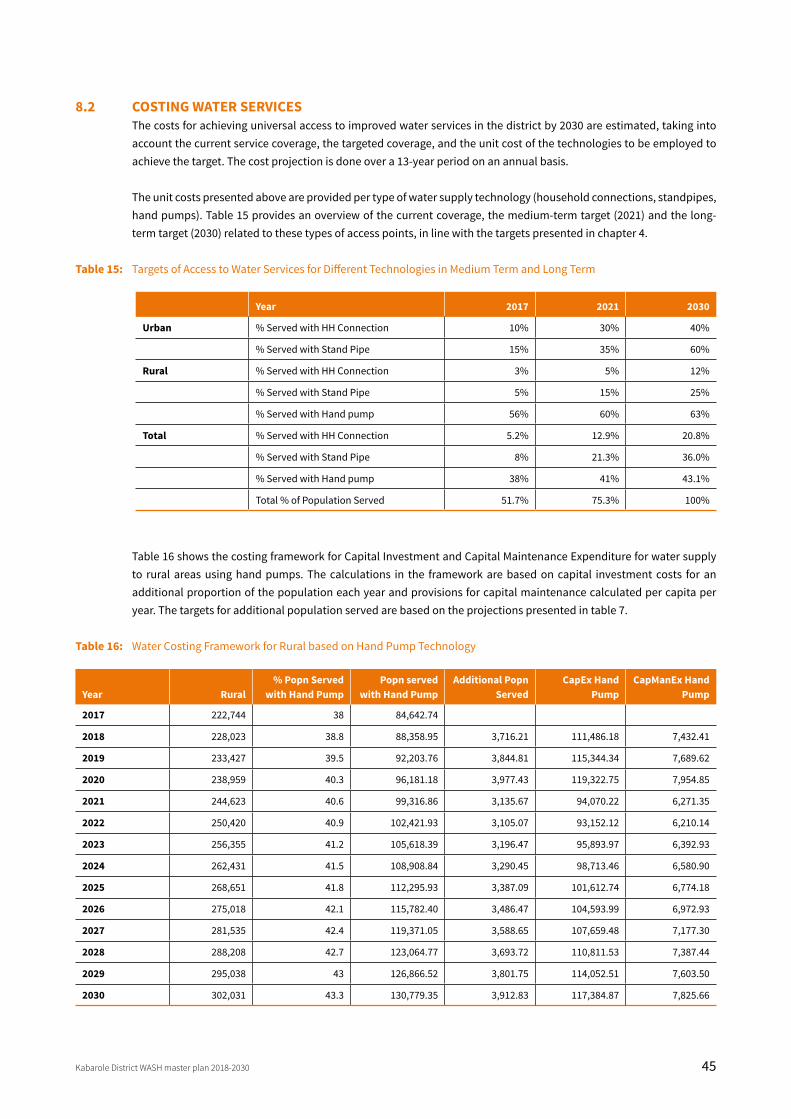
Kabarole District WASH master plan 2018-2030 45
8.2 COSTING WATER SERVICESThe costs for achieving universal access to improved water services in the district by 2030 are estimated, taking into account the current service coverage, the targeted coverage, and the unit cost of the technologies to be employed to achieve the target. The cost projection is done over a 13-year period on an annual basis.
The unit costs presented above are provided per type of water supply technology (household connections, standpipes, hand pumps). Table 15 provides an overview of the current coverage, the medium-term target (2021) and the long-term target (2030) related to these types of access points, in line with the targets presented in chapter 4.
Table 15: Targets of Access to Water Services for Different Technologies in Medium Term and Long Term
Table 16 shows the costing framework for Capital Investment and Capital Maintenance Expenditure for water supply to rural areas using hand pumps. The calculations in the framework are based on capital investment costs for an additional proportion of the population each year and provisions for capital maintenance calculated per capita per year. The targets for additional population served are based on the projections presented in table 7.
Table 16: Water Costing Framework for Rural based on Hand Pump Technology
Year 2017 2021 2030
Urban % Served with HH Connection 10% 30% 40%
% Served with Stand Pipe 15% 35% 60%
Rural % Served with HH Connection 3% 5% 12%
% Served with Stand Pipe 5% 15% 25%
% Served with Hand pump 56% 60% 63%
Total % Served with HH Connection 5.2% 12.9% 20.8%
% Served with Stand Pipe 8% 21.3% 36.0%
% Served with Hand pump 38% 41% 43.1%
Total % of Population Served 51.7% 75.3% 100%
Year Rural% Popn Served
with Hand PumpPopn served
with Hand PumpAdditional Popn
ServedCapEx Hand
PumpCapManEx Hand
Pump
2017 222,744 38 84,642.74
2018 228,023 38.8 88,358.95 3,716.21 111,486.18 7,432.41
2019 233,427 39.5 92,203.76 3,844.81 115,344.34 7,689.62
2020 238,959 40.3 96,181.18 3,977.43 119,322.75 7,954.85
2021 244,623 40.6 99,316.86 3,135.67 94,070.22 6,271.35
2022 250,420 40.9 102,421.93 3,105.07 93,152.12 6,210.14
2023 256,355 41.2 105,618.39 3,196.47 95,893.97 6,392.93
2024 262,431 41.5 108,908.84 3,290.45 98,713.46 6,580.90
2025 268,651 41.8 112,295.93 3,387.09 101,612.74 6,774.18
2026 275,018 42.1 115,782.40 3,486.47 104,593.99 6,972.93
2027 281,535 42.4 119,371.05 3,588.65 107,659.48 7,177.30
2028 288,208 42.7 123,064.77 3,693.72 110,811.53 7,387.44
2029 295,038 43 126,866.52 3,801.75 114,052.51 7,603.50
2030 302,031 43.3 130,779.35 3,912.83 117,384.87 7,825.66
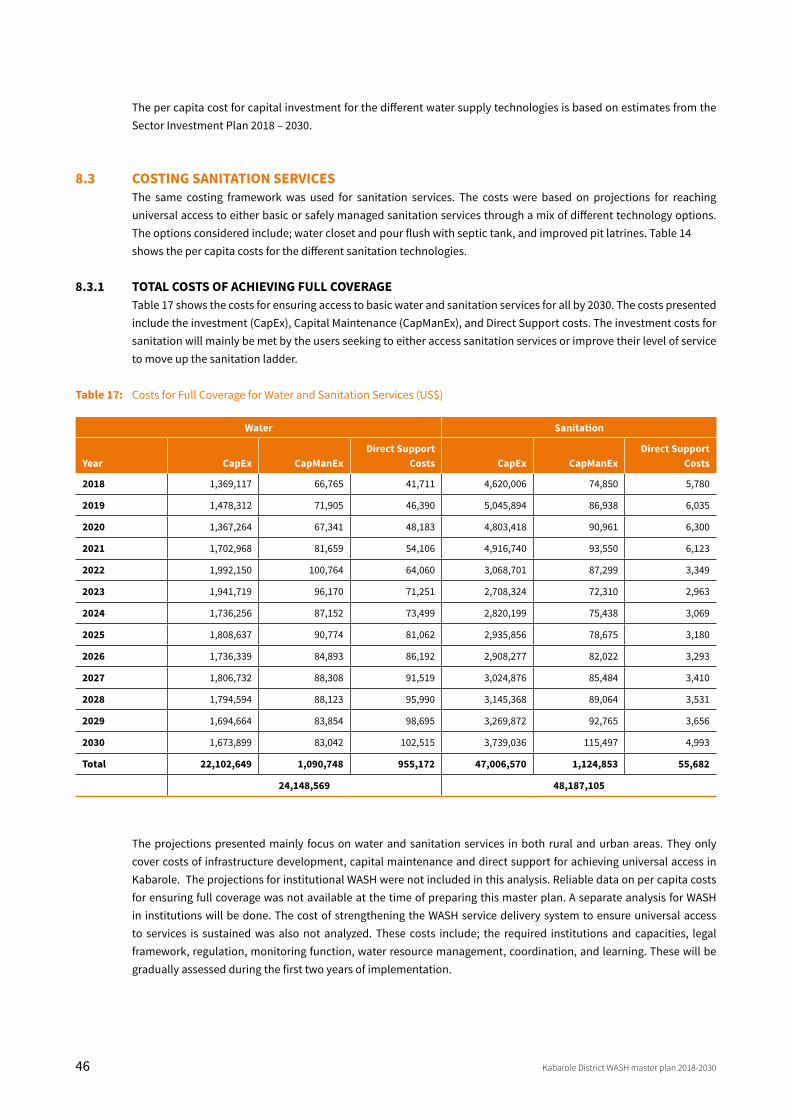
46 Kabarole District WASH master plan 2018-2030
The per capita cost for capital investment for the different water supply technologies is based on estimates from the Sector Investment Plan 2018 – 2030.
8.3 COSTING SANITATION SERVICESThe same costing framework was used for sanitation services. The costs were based on projections for reaching universal access to either basic or safely managed sanitation services through a mix of different technology options. The options considered include; water closet and pour flush with septic tank, and improved pit latrines. Table 14 shows the per capita costs for the different sanitation technologies.
8.3.1 TOTAL COSTS OF ACHIEVING FULL COVERAGETable 17 shows the costs for ensuring access to basic water and sanitation services for all by 2030. The costs presented include the investment (CapEx), Capital Maintenance (CapManEx), and Direct Support costs. The investment costs for sanitation will mainly be met by the users seeking to either access sanitation services or improve their level of service to move up the sanitation ladder.
Table 17: Costs for Full Coverage for Water and Sanitation Services (US$)
The projections presented mainly focus on water and sanitation services in both rural and urban areas. They only cover costs of infrastructure development, capital maintenance and direct support for achieving universal access in Kabarole. The projections for institutional WASH were not included in this analysis. Reliable data on per capita costs for ensuring full coverage was not available at the time of preparing this master plan. A separate analysis for WASH in institutions will be done. The cost of strengthening the WASH service delivery system to ensure universal access to services is sustained was also not analyzed. These costs include; the required institutions and capacities, legal framework, regulation, monitoring function, water resource management, coordination, and learning. These will be gradually assessed during the first two years of implementation.
Water Sanitation
Year CapEx CapManExDirect Support
Costs CapEx CapManExDirect Support
Costs
2018 1,369,117 66,765 41,711 4,620,006 74,850 5,780
2019 1,478,312 71,905 46,390 5,045,894 86,938 6,035
2020 1,367,264 67,341 48,183 4,803,418 90,961 6,300
2021 1,702,968 81,659 54,106 4,916,740 93,550 6,123
2022 1,992,150 100,764 64,060 3,068,701 87,299 3,349
2023 1,941,719 96,170 71,251 2,708,324 72,310 2,963
2024 1,736,256 87,152 73,499 2,820,199 75,438 3,069
2025 1,808,637 90,774 81,062 2,935,856 78,675 3,180
2026 1,736,339 84,893 86,192 2,908,277 82,022 3,293
2027 1,806,732 88,308 91,519 3,024,876 85,484 3,410
2028 1,794,594 88,123 95,990 3,145,368 89,064 3,531
2029 1,694,664 83,854 98,695 3,269,872 92,765 3,656
2030 1,673,899 83,042 102,515 3,739,036 115,497 4,993
Total 22,102,649 1,090,748 955,172 47,006,570 1,124,853 55,682
24,148,569 48,187,105
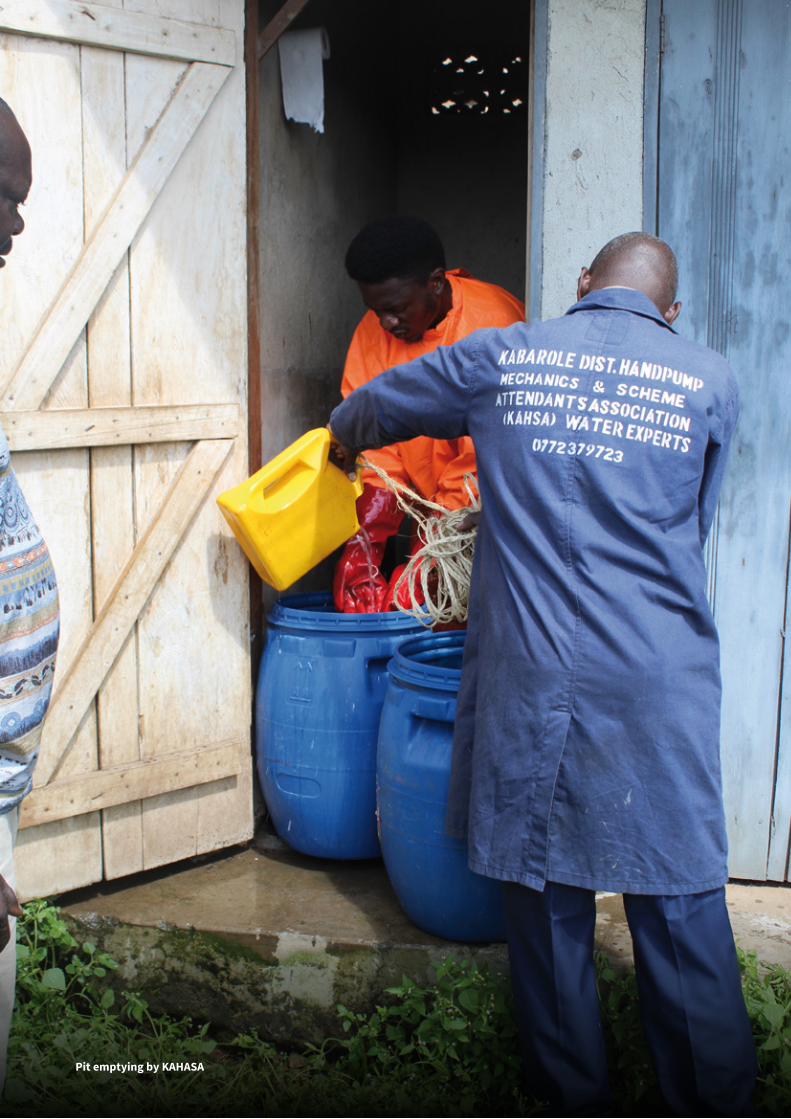
Kabarole District WASH master plan 2018-2030 47Pit emptying by KAHASA
48 Kabarole District WASH master plan 2018-2030
Government of Uganda–Development Partners Joint Technical Review of the Water and Sanitation Sector, (JTR), 2012. Agreed Minutes.
Government of Uganda (2015). Second National Development Plan 2015/16 – 2019/20. Kampala, Uganda
Anecho S., Makune, R., Munyana, S. (2017). Sanitation Market Assessment for Kabarole, Sanitation Solutions Group, Kampala, Uganda
Kabarole District Local Government (2015). Kabarole District Development Plan 2015/16 – 2019/20. Fort Portal, Uganda
Kabarole District Local Government (2016). Kabarole District WASH Investment Plan for Universal Access to WASH Services 2016 – 2030. Fort Portal, Uganda
Lockwood, H., Nabunnya Mulumba, J., Henry, L. (2018). Sustainable WASH Systems Learning Partnership: Context Analysis Uganda. IRC. Kampala, Uganda. Accessed 15 January 2019 < https://www.ircwash.org/sites/default/files/sustainable_wash_systems_learning_partnership_-_context_analysis_uganda.pdf>
Ministry of Water and Environment (2017). Government of Uganda –Water and Environment Sector Performance Report 2018. Kampala, Uganda. Accessed 15 January 2019 < https://www.mwe.go.ug/sites/default/files/library/SPR%202018%20%20FINAL.pdf >
Ministry of Water and Environment MWE (2013). Government of Uganda – National Water Resources Assessment Report. Kampala, Uganda
Strzepek, K., Boehlert,B., Willwerth,J,. (2018), Strategic Investment Plan for Water and Environment Sector, Uganda (2018 -2030). Kampala, Uganda. Accessed 15 January 2019 < https://www.mwe.go.ug/sites/default/files/library/Water%20and%20Environment%20Sector%20Investment%20Plan%20%202018.pdf >
Fonseca, C., Francey, R., Batchelor, C., McIntyre, P., Klutse, A., Komives, K., Moriarty, M., Naafs, A., Nyarko, K., Pezon, C., Potter, A., Reddy, R., and Senahalatha, M. (2011) Briefing Note 1a, Life Cycle Costs Approach – Costing Sustainable Services, WASHCost. IRC International Water and Sanitation Centre. The Hague, the Netherlands. Accessed 15 January 2019 < https://www.ircwash.org/sites/default/files/briefing_note_1a_-_life-cycle_cost_approach.pdf >
Smits, S., Verhoeven, J. Moriarty, P, Fonseca, C. Lockwood, H. 2011. Arrangements and cost of providing support to rural water service providers. WASHCost paper 5. IRC. The Hague, the Netherlands. Accessed 15 January 2019 < https://www.ircwash.org/sites/default/files/working_paper_5_-_arrangements_and_cost_of_providing_support_to_rural_water_service_providers_analyses.pdf >
REFERENCES
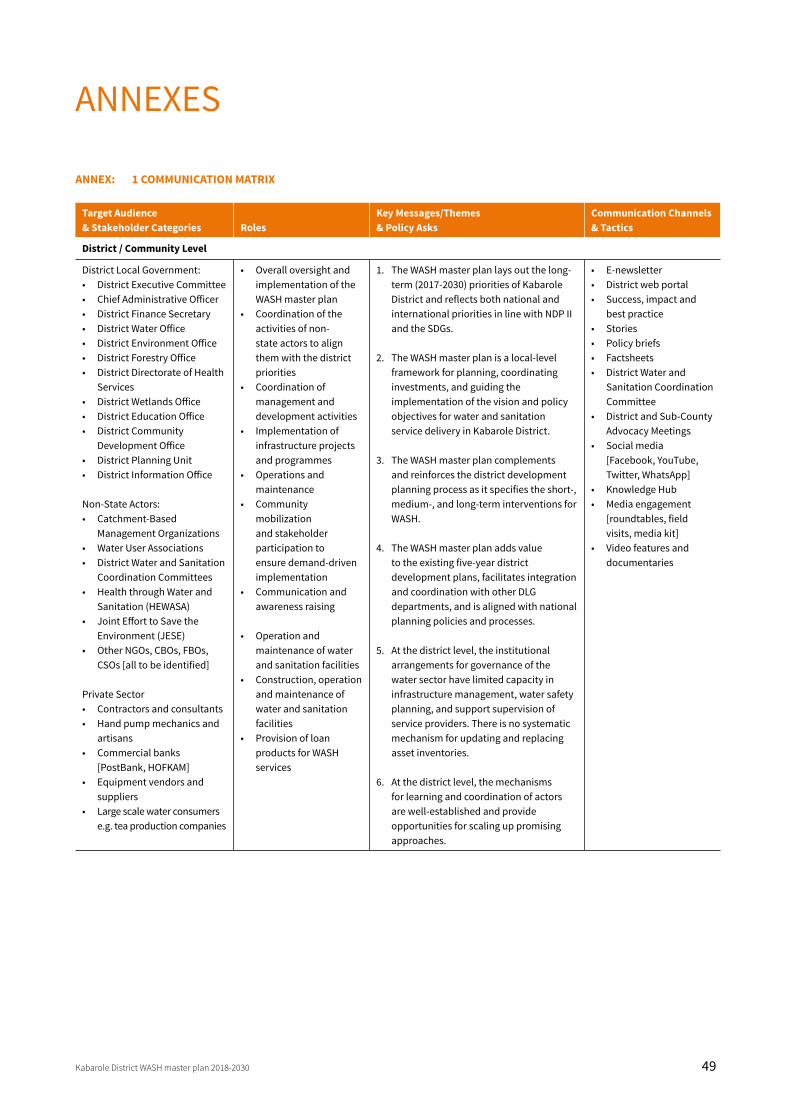
Kabarole District WASH master plan 2018-2030 49
ANNEX: 1 COMMUNICATION MATRIX
ANNEXES
Target Audience & Stakeholder Categories Roles
Key Messages/Themes & Policy Asks
Communication Channels & Tactics
District / Community Level
District Local Government:• District Executive Committee• Chief Administrative Officer• District Finance Secretary• District Water Office • District Environment Office • District Forestry Office • District Directorate of Health
Services• District Wetlands Office• District Education Office• District Community
Development Office• District Planning Unit• District Information Office
Non-State Actors: • Catchment-Based
Management Organizations• Water User Associations• District Water and Sanitation
Coordination Committees• Health through Water and
Sanitation (HEWASA)• Joint Effort to Save the
Environment (JESE)• Other NGOs, CBOs, FBOs,
CSOs [all to be identified]
Private Sector• Contractors and consultants • Hand pump mechanics and
artisans• Commercial banks
[PostBank, HOFKAM]• Equipment vendors and
suppliers• Large scale water consumers
e.g. tea production companies
• Overall oversight and implementation of the WASH master plan
• Coordination of the activities of non-state actors to align them with the district priorities
• Coordination of management and development activities
• Implementation of infrastructure projects and programmes
• Operations and maintenance
• Community mobilization and stakeholder participation to ensure demand-driven implementation
• Communication and awareness raising
• Operation and maintenance of water and sanitation facilities
• Construction, operation and maintenance of water and sanitation facilities
• Provision of loan products for WASH services
1. The WASH master plan lays out the long-term (2017-2030) priorities of Kabarole District and reflects both national and international priorities in line with NDP II and the SDGs.
2. The WASH master plan is a local-level framework for planning, coordinating investments, and guiding the implementation of the vision and policy objectives for water and sanitation service delivery in Kabarole District.
3. The WASH master plan complements and reinforces the district development planning process as it specifies the short-, medium-, and long-term interventions for WASH.
4. The WASH master plan adds value to the existing five-year district development plans, facilitates integration and coordination with other DLG departments, and is aligned with national planning policies and processes.
5. At the district level, the institutional arrangements for governance of the water sector have limited capacity in infrastructure management, water safety planning, and support supervision of service providers. There is no systematic mechanism for updating and replacing asset inventories.
6. At the district level, the mechanisms for learning and coordination of actors are well-established and provide opportunities for scaling up promising approaches.
• E-newsletter• District web portal • Success, impact and
best practice• Stories• Policy briefs• Factsheets• District Water and
Sanitation Coordination Committee
• District and Sub-County Advocacy Meetings
• Social media [Facebook, YouTube, Twitter, WhatsApp]
• Knowledge Hub• Media engagement
[roundtables, field visits, media kit]
• Video features and documentaries
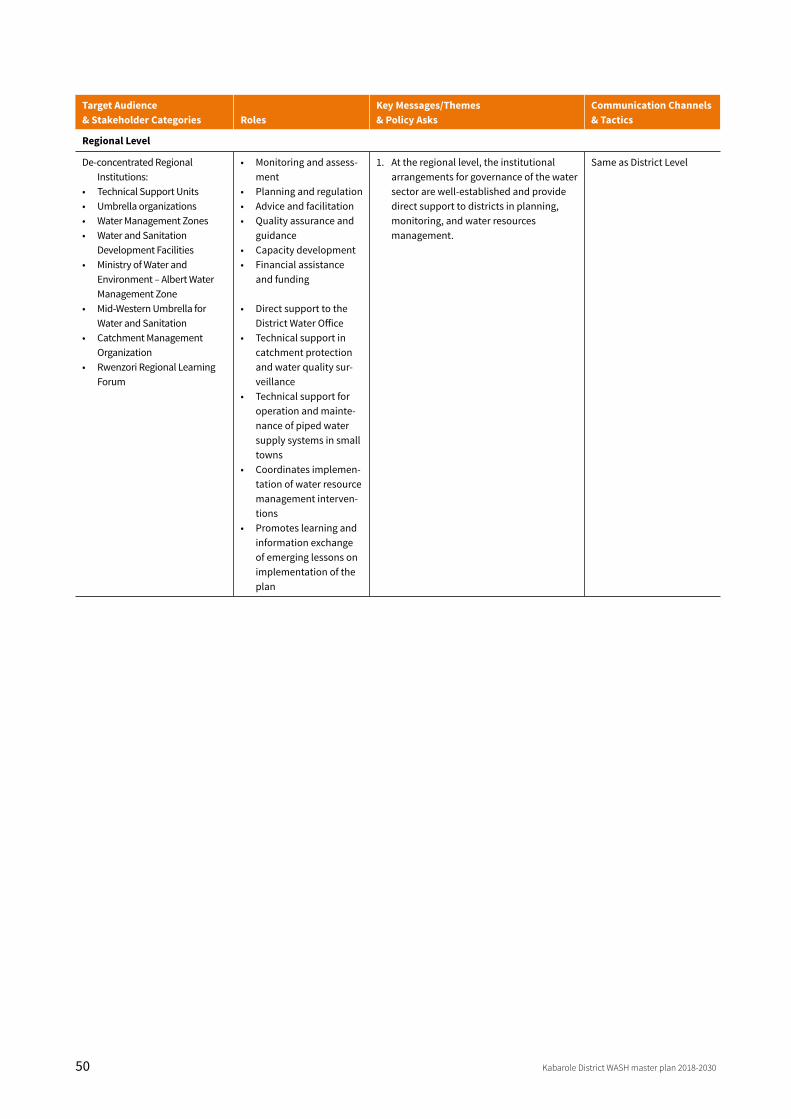
50 Kabarole District WASH master plan 2018-2030
Target Audience & Stakeholder Categories Roles
Key Messages/Themes & Policy Asks
Communication Channels & Tactics
Regional Level
De-concentrated Regional Institutions:
• Technical Support Units• Umbrella organizations• Water Management Zones• Water and Sanitation
Development Facilities• Ministry of Water and
Environment – Albert Water Management Zone
• Mid-Western Umbrella for Water and Sanitation
• Catchment Management Organization
• Rwenzori Regional Learning Forum
• Monitoring and assess-ment
• Planning and regulation• Advice and facilitation• Quality assurance and
guidance• Capacity development• Financial assistance
and funding
• Direct support to the District Water Office
• Technical support in catchment protection and water quality sur-veillance
• Technical support for operation and mainte-nance of piped water supply systems in small towns
• Coordinates implemen-tation of water resource management interven-tions
• Promotes learning and information exchange of emerging lessons on implementation of the plan
1. At the regional level, the institutional arrangements for governance of the water sector are well-established and provide direct support to districts in planning, monitoring, and water resources management.
Same as District Level
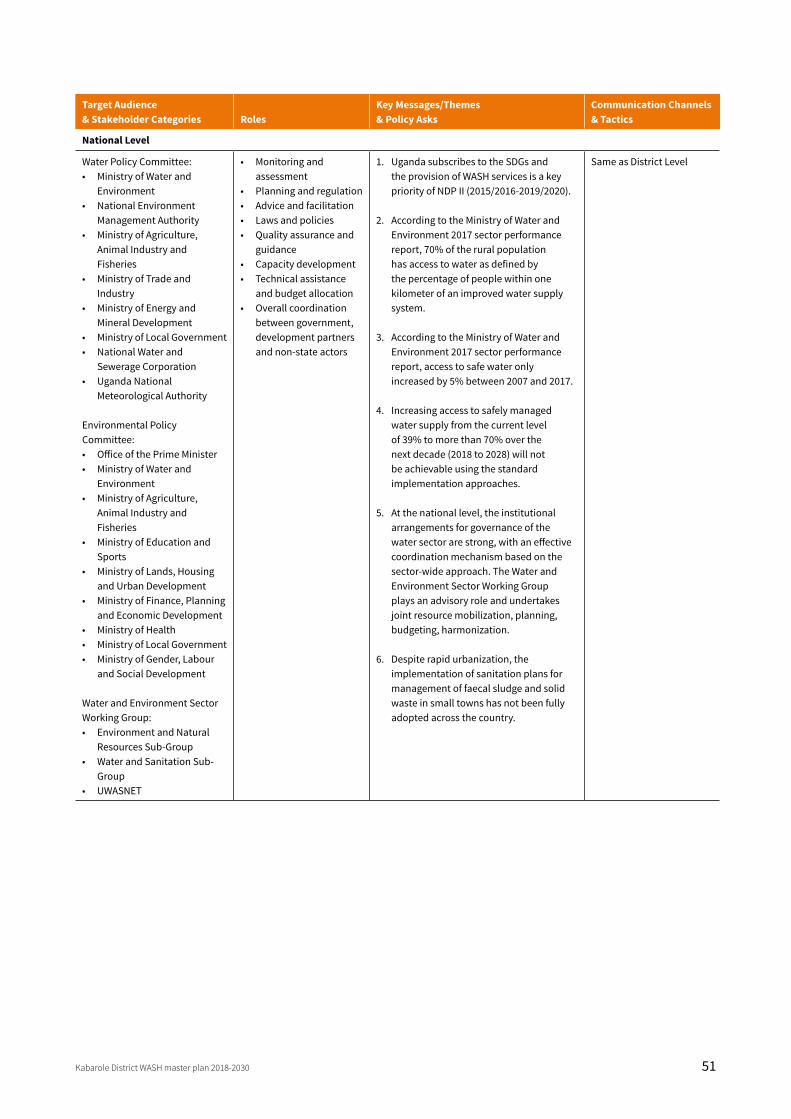
Kabarole District WASH master plan 2018-2030 51
Target Audience & Stakeholder Categories Roles
Key Messages/Themes & Policy Asks
Communication Channels & Tactics
National Level
Water Policy Committee:• Ministry of Water and
Environment• National Environment
Management Authority• Ministry of Agriculture,
Animal Industry and Fisheries
• Ministry of Trade and Industry
• Ministry of Energy and Mineral Development
• Ministry of Local Government• National Water and
Sewerage Corporation• Uganda National
Meteorological Authority
Environmental Policy Committee:• Office of the Prime Minister• Ministry of Water and
Environment• Ministry of Agriculture,
Animal Industry and Fisheries
• Ministry of Education and Sports
• Ministry of Lands, Housing and Urban Development
• Ministry of Finance, Planning and Economic Development
• Ministry of Health• Ministry of Local Government• Ministry of Gender, Labour
and Social Development
Water and Environment Sector Working Group:• Environment and Natural
Resources Sub-Group• Water and Sanitation Sub-
Group• UWASNET
• Monitoring and assessment
• Planning and regulation• Advice and facilitation• Laws and policies• Quality assurance and
guidance• Capacity development• Technical assistance
and budget allocation• Overall coordination
between government, development partners and non-state actors
1. Uganda subscribes to the SDGs and the provision of WASH services is a key priority of NDP II (2015/2016-2019/2020).
2. According to the Ministry of Water and Environment 2017 sector performance report, 70% of the rural population has access to water as defined by the percentage of people within one kilometer of an improved water supply system.
3. According to the Ministry of Water and Environment 2017 sector performance report, access to safe water only increased by 5% between 2007 and 2017.
4. Increasing access to safely managed water supply from the current level of 39% to more than 70% over the next decade (2018 to 2028) will not be achievable using the standard implementation approaches.
5. At the national level, the institutional arrangements for governance of the water sector are strong, with an effective coordination mechanism based on the sector-wide approach. The Water and Environment Sector Working Group plays an advisory role and undertakes joint resource mobilization, planning, budgeting, harmonization.
6. Despite rapid urbanization, the implementation of sanitation plans for management of faecal sludge and solid waste in small towns has not been fully adopted across the country.
Same as District Level
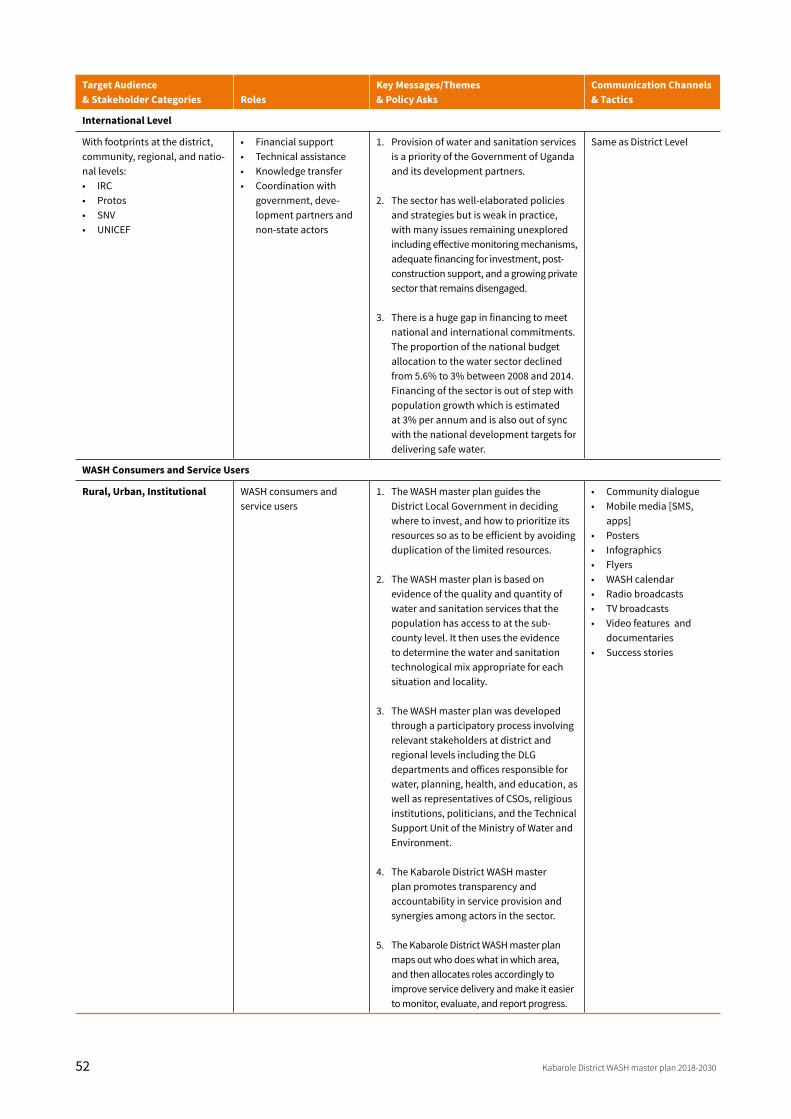
52 Kabarole District WASH master plan 2018-2030
Target Audience & Stakeholder Categories Roles
Key Messages/Themes & Policy Asks
Communication Channels & Tactics
International Level
With footprints at the district, community, regional, and natio-nal levels:• IRC• Protos• SNV• UNICEF
• Financial support• Technical assistance• Knowledge transfer• Coordination with
government, deve-lopment partners and non-state actors
1. Provision of water and sanitation services is a priority of the Government of Uganda and its development partners.
2. The sector has well-elaborated policies and strategies but is weak in practice, with many issues remaining unexplored including effective monitoring mechanisms, adequate financing for investment, post-construction support, and a growing private sector that remains disengaged.
3. There is a huge gap in financing to meet national and international commitments. The proportion of the national budget allocation to the water sector declined from 5.6% to 3% between 2008 and 2014. Financing of the sector is out of step with population growth which is estimated at 3% per annum and is also out of sync with the national development targets for delivering safe water.
Same as District Level
WASH Consumers and Service Users
Rural, Urban, Institutional WASH consumers and service users
1. The WASH master plan guides the District Local Government in deciding where to invest, and how to prioritize its resources so as to be efficient by avoiding duplication of the limited resources.
2. The WASH master plan is based on evidence of the quality and quantity of water and sanitation services that the population has access to at the sub-county level. It then uses the evidence to determine the water and sanitation technological mix appropriate for each situation and locality.
3. The WASH master plan was developed through a participatory process involving relevant stakeholders at district and regional levels including the DLG departments and offices responsible for water, planning, health, and education, as well as representatives of CSOs, religious institutions, politicians, and the Technical Support Unit of the Ministry of Water and Environment.
4. The Kabarole District WASH master plan promotes transparency and accountability in service provision and synergies among actors in the sector.
5. The Kabarole District WASH master plan maps out who does what in which area, and then allocates roles accordingly to improve service delivery and make it easier to monitor, evaluate, and report progress.
• Community dialogue • Mobile media [SMS,
apps]• Posters• Infographics• Flyers• WASH calendar• Radio broadcasts• TV broadcasts• Video features and
documentaries• Success stories
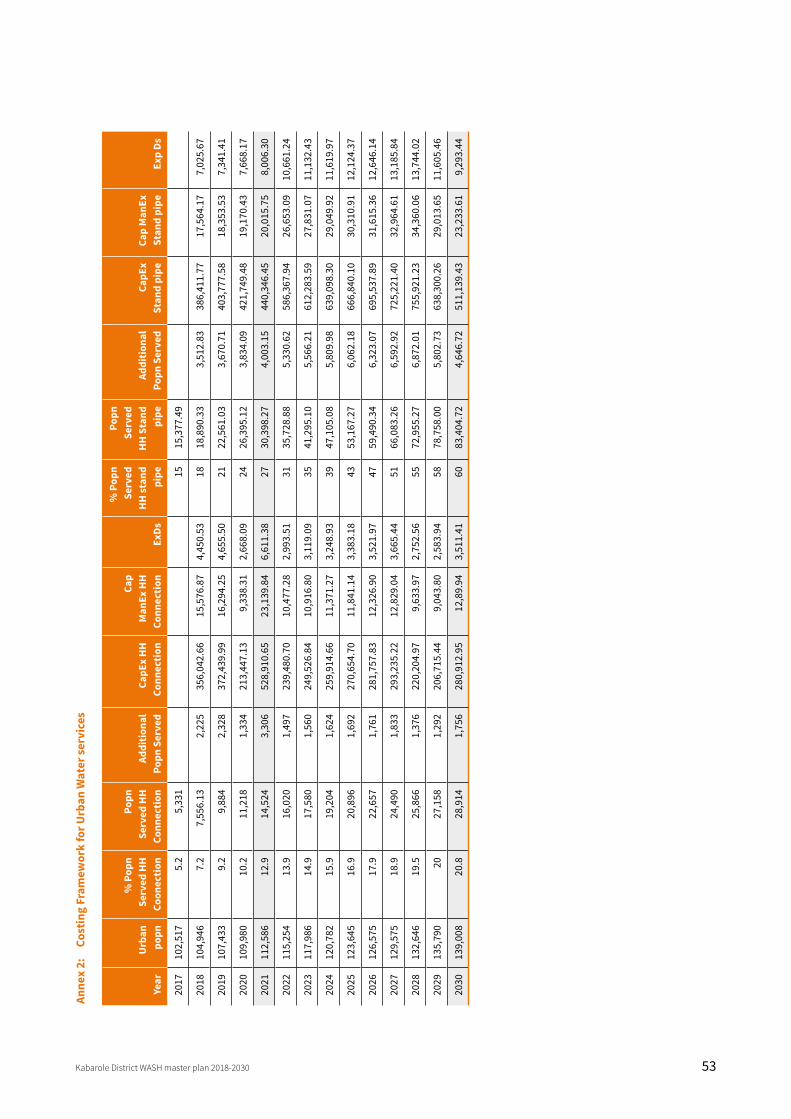
Kabarole District WASH master plan 2018-2030 53
Anne
x 2:
Co
stin
g Fr
amew
ork
for U
rban
Wat
er se
rvic
es
Year
Urb
an
popn
% P
opn
Serv
ed H
H
Coon
ectio
n
Popn
Se
rved
HH
Co
nnec
tion
Addi
tiona
l Po
pn S
erve
dCa
pEx
HH
Co
nnec
tion
Cap
Man
Ex H
H
Conn
ectio
nEx
Ds
% P
opn
Serv
ed
HH
stan
d pi
pe
Popn
Se
rved
H
H S
tand
pi
peAd
ditio
nal
Popn
Ser
ved
CapE
x St
and
pipe
Cap
Man
Ex
Stan
d pi
peEx
p Ds
2017
102,
517
5.2
5,33
115
15,3
77.4
9
2018
104,
946
7.2
7,55
6.13
2,22
535
6,04
2.66
15,5
76.8
74,
450.
5318
18,8
90.3
33,
512.
8338
6,41
1.77
17,5
64.1
77,
025.
67
2019
107,
433
9.2
9,88
42,
328
372,
439.
9916
,294
.25
4,65
5.50
2122
,561
.03
3,67
0.71
403,
777.
5818
,353
.53
7,34
1.41
2020
109,
980
10.2
11,2
181,
334
213,
447.
139,
338.
312,
668.
0924
26,3
95.1
23,
834.
0942
1,74
9.48
19,1
70.4
37,
668.
17
2021
112,
586
12.9
14,5
243,
306
528,
910.
6523
,139
.84
6,61
1.38
2730
,398
.27
4,00
3.15
440,
346.
4520
,015
.75
8,00
6.30
2022
115,
254
13.9
16,0
201,
497
239,
480.
7010
,477
.28
2,99
3.51
3135
,728
.88
5,33
0.62
586,
367.
9426
,653
.09
10,6
61.2
4
2023
117,
986
14.9
17,5
801,
560
249,
526.
8410
,916
.80
3,11
9.09
3541
,295
.10
5,56
6.21
612,
283.
5927
,831
.07
11,1
32.4
3
2024
120,
782
15.9
19,2
041,
624
259,
914.
6611
,371
.27
3,24
8.93
3947
,105
.08
5,80
9.98
639,
098.
3029
,049
.92
11,6
19.9
7
2025
123,
645
16.9
20,8
961,
692
270,
654.
7011
,841
.14
3,38
3.18
4353
,167
.27
6,06
2.18
666,
840.
1030
,310
.91
12,1
24.3
7
2026
126,
575
17.9
22,6
571,
761
281,
757.
8312
,326
.90
3,52
1.97
4759
,490
.34
6,32
3.07
695,
537.
8931
,615
.36
12,6
46.1
4
2027
129,
575
18.9
24,4
901,
833
293,
235.
2212
,829
.04
3,66
5.44
5166
,083
.26
6,59
2.92
725,
221.
4032
,964
.61
13,1
85.8
4
2028
132,
646
19.5
25,8
661,
376
220,
204.
979,
633.
972,
752.
5655
72,9
55.2
76,
872.
0175
5,92
1.23
34,3
60.0
613
,744
.02
2029
135,
790
2027
,158
1,29
220
6,71
5.44
9,04
3.80
2,58
3.94
5878
,758
.00
5,80
2.73
638,
300.
2629
,013
.65
11,6
05.4
6
2030
139,
008
20.8
28,9
141,
756
280,
912.
9512
,89.
943,
511.
4160
83,4
04.7
24,
646.
7251
1,13
9.43
23,2
33.6
19,
293.
44
Kabarole District Local Government
Supported by