K. Public Service Commission cases/2010-00443/20111212...Kentucky Public Service Commission Staff...
65
Steven L. Beshear Governor Leonard K. Peters Secretary Energy and Environment Cabinet Commonwealth of Kentucky Public Service Commission 21 1 Sower Blvd P 0. Box 61 5 Frankfort, Kentucky 40602-061 5 Telephone: (502) 564-3940 Fax. (502) 564-3460 psc ky gov David L. Armstrong Chairman James Gardner Vice-Chainnan Charles R. Borders Commissioner December 12,2011 PARTIES OF RECORD Re: Case No. 2010-00443 Enclosed please find a memorandum that has been filed in the record of the above referenced case for issuance of the Commission Staffs Report on Big Rivers Electric Corporation’s 201 0 Integrated Resource Plan. Any comments regarding the Staff Report’s content should be submitted to the Commission within five days of receipt of this letter. Questions regarding this Staff Report should be directed to Jeff Shaw of the Commission Staff at 502/564-3940, ext. 237. n Enclosure KentuckyUnbridledSpirit.com An Equal Opportunity Employer M/F/D
Transcript of K. Public Service Commission cases/2010-00443/20111212...Kentucky Public Service Commission Staff...

Steven L. Beshear Governor
Leonard K. Peters Secretary Energy and Environment Cabinet
Commonwealth of Kentucky Public Service Commission
21 1 Sower Blvd P 0. Box 61 5
Frankfort, Kentucky 40602-061 5 Telephone: (502) 564-3940
Fax. (502) 564-3460 psc ky gov
David L. Armstrong Chairman
James Gardner Vice-C hai nnan
Charles R. Borders Commissioner
December 12,2011
PARTIES OF RECORD
Re: Case No. 2010-00443
Enclosed please find a memorandum that has been filed in the record of the above referenced case for issuance of the Commission Staffs Report on Big Rivers Electric Corporation’s 201 0 Integrated Resource Plan. Any comments regarding the Staff Report’s content should be submitted to the Commission within five days of receipt of this letter. Questions regarding this Staff Report should be directed to Jeff Shaw of the Commission Staff at 502/564-3940, ext. 237. n
Enclosure
Kentucky Un bridledSpirit.com An Equal Opportunity Employer M/F/D

Steven L. Beshear Governor
Commonwealth of Kentucky Leonard K. Peters Secretary Public Service Commission Energy and Environment Cabinet 21 1 Sower Blvd.
P.O. Box 61 5 Frankfort, Kentucky 40602-061 5
Telephone: (502) 564-3940 Fax: (502) 564-3460
psc.ky gov
TO:
FROM:
DATE:
SUBJECT:
MEMORANDUM
KENTUCKY PUBLIC SERVICE COMMISSION
Main Case File - Case No. 2010-00443
Jeff Shaw, Division of Financial Analysis
November 28,201 1
Commission Staffs Report on the 201 0 Integrated Resource Plan of Big Rivers Electric Corporation
David L. Armstrong Chairman
James Gardner Vice-chairman
Charles R. Borders Commissioner
Pursuant to 807 KAR 5058, the Commission Staff has prepared its report on the 2010 Integrated Resource Plan of Big Rivers Electric Corporation. The report, attached to this memorandum, is being filed in the record of this case. The filing of this report constitutes the final substantive action in Case No. 201 0-00443. Final administrative action in the case will be an Order which will close the case and remove it from the Commission’s docket. Such an Order will be issued in the near future.
Attachment
KentuckylJnbridledSpirit.com An Equal Opportunity Employer MIFID

Kentucky Public Service Commission
Staff Report On the
201 0 Integrated Resource Plan
of Big Rivers Electric Corporation
Case No. 2010-00443
December 201 1

SECTION I
INTRODUCTION
Administrative Regulation 807 KAR 5058, promulgated in 1990 and amended in
1995 by the Kentucky Public Service Commission (“Commission”), established an
integrated resource planning (“IRP”) process that provides for regular review by the
Commission Staff (“Staff”) of the long-range resource plans of the Commonwealth’s six
major jurisdictional electric utilities. The goal of the Commission in establishing the IRP
process was to ensure that all reasonable options for the future supply of electricity
were being examined and pursued and that ratepayers were being provided a reliable
supply of electricity at the lowest possible cost.
Big Rivers Electric Corporation (“Big Rivers”) submitted its 2010 IRP to the
Commission on November 15, 2010.‘ The IRP includes Big Rivers’ plan for meeting its
customers’ electricity requirements for the period 201 1-2025. Big Rivers is a generation
and transmission cooperative headquartered in Henderson, Kentucky. It provides all of
the power requirements of three distribution cooperatives, which provide service in 22
counties located in western Kentucky. These member cooperatives, Jackson Purchase
Energy Corporation (“JPEC”), Kenergy Corp., and Meade County Rural Electric
Cooperative, serve primarily residential customers, which account for nearly 90 percent
of their approximately 113,000 customers. While the majority of customers on the Big
Rivers’ system are residential, the majority of its load is industrial, with the most unusual
feature being its service to two aluminum smelters, which can have a combined peak in
excess of 800 MW and which can consume over 7,000,000 MWh annually.
’ GDS Associates, Inc. (“GDS”), an outside consulting firm, performed much of the work involved in preparing Big Rivers’ 2010 IRP.
2

Big Rivers owns and operates 1,444 MW of generating capacity at four
generating stations: Reid, Coleman, Green, and Wilson. It has an additional 207 MW
available from Henderson Municipal Power & Light (“HMP&L”) and 178 MW from the
Southeastern Power Administration (“SEPA). The total capacity available to Big Rivers
is approximately 1,839 MW.2
In 201 0, Big Rivers received Commission approval to transfer functional control
of its transmission system to the Midwest Independent Transmission System Operator,
Inc. (“Midwest ISO”).3 The Midwest IS0 directs the dispatch of Big Rivers’ generation
resources and determines reserves required to maintain resource adequacy within the
Midwest ISO’s multi-state footprint. Big Rivers’ 1,262-mile transmission system consists
primarily of 69-kV and 161-kV lines, but also includes relatively small lengths of 138-kV
and 345-kV line.
The purpose of this report is to review and evaluate Big Rivers’ IRP in
accordance with 807 KAR 5058, Section 12(3), which requires Staff to issue a report
summarizing its review of each IRP filing made with the Commission and make
suggestions and recommendations to be considered in future IRP filings. The Staff
recognizes that resource planning is a dynamic ongoing process. Thus, this review is
designed to offer suggestions and recommendations to Big Rivers on how to improve its
resource plan in the future.
Specifically, the Staffs goals are to ensure that:
o All resource options are adequately and fairly evaluated;
The available capacity is currently reduced by 93 MW, to 1,746, due to force majeure conditions on the SEPA system and limitations on Big Rivers’ Reid Unit 1.
Case No. 2010-00043, Application of Big Rivers Electric Corporation for Approval to Transfer Functional Control of its Transmission System to Midwest Independent Transmission System Operator, Inc. (Ky. PSC Nov. 1 , 201 0).
3

0 Critical data, assumptions and methodologies for all aspects of the plan
are adequately documented and are reasonable; and
o The report includes an incremental component, noting any significant
changes from Big Rivers’ most recent IRP filed in 2002. Big Rivers submitted an IRP in
2005 but, due to activities associated with the unwind of the 1998 lease arrangement
under which Big Rivers’ generating facilities were leased to and operated by the E.ON
U.S. subsidiary, Western Kentucky Energy Corp., the Commission granted Big Rivers’
request to dismiss the proceeding docketed to review the 2005 IRP.4 As a condition of
the Commission’s approval of the transaction to unwind the 1998 lease, Big Rivers was
required to file a new IRP in November 2010.
In the current IRP, Big Rivers states that its primary planning goal is to provide
for its customers’ electricity needs over the next 15 years through a mix of supply and
demand-side options, at the lowest reasonable cost. To meet this goal, Big Rivers
identified the following planning objectives:
Maintain a current and reliable load forecast;
Consider expanding Demand-Side Management (“DSM”) programs;
Identify potential supply side resources and DSM programs;
Provide competitively priced power to its members;
Maximize reliability while minimizing costs, risks and environmental impacts;
Maintain adequate planning reserve margins; and
Provide assistance to its member cooperatives regarding new technologies,
mapping and planning, safety training and programs, economic development
and customer support.
Big Rivers’ winter peak load is expected to increase from 1,476 MW in 2008 to
1,595 MW in 2023, reflecting a growth rate of 0.5 percent per year. Its summer peak
Case No. 2005-00485, The 2005 Integrated Resource Plan of Big Rivers Electric Corporation (Ky. PSC Aug. 5, 2009).
4
load is expected to increase from 1,475 MW to 1,578 MW over the same period, also
reflecting a growth rate of 0.5 percent. Energy requirements are projected to increase
from 10,747,493 MWh in 2008 to 11,214,923 MWh in 2023, which reflects an annual
growth rate of 0.4 p e r ~ e n t . ~
Big Rivers’ IRP was developed based on a minimum reserve margin criterion of
14 percent. Based on DSM programs it plans to launch in 201 1, Big Rivers expects to
save a cumulative 49,160 MWh by 2025, with a 14 MW reduction in winter peak
demand and a 10 MW reduction in summer peak demand. Big Rivers’ base case
resource plan includes the addition of 50 MW of peaking capacity in 2022, most likely in
the form of a gas-fired combustion turbine, in order to maintain a planning reserve
margin of 14 percent. Big Rivers noted that, if its planning reserve margin were reduced
to 12 percent, no capacity additions would be needed over the 15-year planning horizon
of the IRP.
The remainder of this report is organized as follows:
0 Section 2, Load Forecasting, reviews Big Rivers’ projected load growth
and load forecasting methodology.
0 Section 3, Demand-Side Management, summarizes Big Rivers’ evaluation
of DSM opportunities.
0 Section 4, Supply-side Resource Assessment, focuses on supply
resources available to meet Big Rivers’ load requirements and environmental
com p I iance planning .
0 Section 5, Integration and Plan Optimization, discusses Big Rivers’ overall
assessment of supply-side and demand-side options and their integration into an overall
resource plan.
Big Rivers’ IRP Plan Summary, page 5-8, Table 5-1. These demand and energy requirements include the smelter loads, which were not included in Big Rivers’ detailed load forecasts - see Section 2 of this report.
5

SECTION 2
LOAD FORECASTING
INTRODUCTION
Big Rivers provides wholesale power to three member distribution cooperatives
that provide retail service to customers in 22 western Kentucky counties. Within this 22-
county service area, 89 percent of the customer accounts are residential accounts. Big
Rivers’ forecasts of energy consumption for the major customer classes were
developed using both short-term and long-term econometric models, statistically
adjusted end-use (“SAE”) models, exponential smoothing and historical trending. GDS
developed the forecasting assumptions which were then discussed with Big Rivers’
management.
The economic outlook for the base case forecast was based upon data gathered
from Woods & Poole Economics, NPA Data Services, and the University of Louisville.
Additional historical data was collected from the Rural Utilities Service (“RUS”) Form 7,
the U.S. Bureau of Labor Statistics, Moody’s Economy.com, the U.S. Department of
Energy/Energy Information Administration (“DOE/EIA”), the U.S. Census Bureau, and
the National Oceanic and Atmospheric Administration.‘ RUS accepts a 20-year
historical period as the basis for normal weather and Big Rivers adopted this practice for
its weather normalization.’ Weather data was gathered from Paducah, Kentucky and
Evansville, Indiana weather stations. For the 2008-2023 period, Big Rivers’ service
‘ Big Rivers’ Load Forecast 2009, pages 2 and 13.
Response to Staffs Second Data Request, Item 31 .a, page 1 of 3.
6

territory population is projected to grow at the annual compound rate of 0.2 percent.’
Similarly, households and employment are projected to increase at an average rate of
0.5 percent annually, real household income at an average of 0.4 percent annually,
gross regional output at an average annual rate of 1.1 percent, and retail sales at an
average annual rate of 1.3 percent. Real electricity prices for the residential and small
commercial customers are projected to increase at an average annual rate between 0.5
and 0.9 percent annually. Natural gas and liquid propane are the primary alternatives to
electricity and these prices are projected to decrease slightly over the 2008-2023
p e r i ~ d . ~
Because the Big Rivers distribution cooperatives serve retail customers across
multiple portions of Kentucky counties, weighting factors were developed to represent
each distribution cooperative’s market share (proportion of county households served)
of each county served. The county weight is equal to the number of residential
customers served divided by the total number of households in the county.” Each of
Big Rivers’ distribution cooperatives supplied customer class data including the number
of customers by class, kWh sales by class, class sales revenue, total system peak
demand and rural system peak demand. Each member cooperative also provided final
forecasts of energy sales and peak demand for every direct-serve and large commercial
’ This planning period reflects that Big Rivers’ load forecast was prepared in early 2009, before it regained control of its generating facilities under the unwind transaction and before it again assumed responsibility for serving the aluminum smelters’ loads.
Big Rivers’ Load Forecast 2009, pages 15-17, and Response to Staffs First Data Request, Item 20. Real electricity prices were not projected for large commercial and industrial direct-serve customers. It was assumed that real electricity prices for these customers would not change significantly over the forecast horizon.
lo - Id., page 14, and Response to Staffs First Data Request, Item 18.
7

customer, defined as customers whose energy consumption is greater than or equal to
1 MW. Big Rivers also conducted a Residential End-Use and Energy Efficiency Survey
in 2007. The survey documented the type and number of appliances used in homes.
The data is the basis for calculating electric market shares and was input into the
residential energy forecast model.
SHORT-TERM FORECAST1 NG MODELS
The short-term forecast projects both monthly energy and demand requirements
over the 2009-2010 periods. SAE and econometric models were developed for each
member system to forecast monthly sales for the residential and small commercial
customer classes. Short-term residential use per customer forecasts are a function of
a time trend, and heating and cooling degree days. The heating and cooling degree
day variables are expressed on a monthly billing cycle basis and are the averages of
the current and previous month’s values. The short-term residential customer growth
forecast is a function of recent year customer trends.12
Similarly, short-term small cammercial use per customer forecasts are a function
of a time trend and heating and cooling degree days. Theoretically, total employment
and the number of households are the best predictors of short-term small commercial
customer growth. In practice, basing the small commercial customer forecasts on a
customer trend variable yielded better results. Short-term energy sales are a product of
I’ Response to Staffs First Data Request, Item 22.b. and c., pages 3-4 of 5.
l2 - Id., item 22, pages 1-2, and Response to Staffs Second Data Request, Item 29.
8

energy use per customer and the number of customer^.'^ Energy sales for the large
commercial class were developed for each consumer by its member cooperative’s
management based on historic trends, operating characteristics and information
provided by each individual consumer. Forecasts of public lighting are based on
historical trends. Rural system energy sales are obtained by subtracting direct-serve
customer sales from total system energy saIes.l4 Final monthly and annual energy
sales forecasts are based upon regression outputs that have been calibrated to the
2008 base year. For the residential and small commercial models, the calibration factor
applied to initial forecast values is equal to the actual 2008 base year value divided by
the model estimate for 2008.15
For each of Big Rivers’ member systems, rural system demand represents the
highest 60-minute rural system level of demand during the month. Rural system peak
demand for Big Rivers represents the highest rural system level demand during the
month. Member systems’ peaks are not necessarily coincident with Big Rivers’ rural
system peak. Big Rivers’ average coincidence factor is calculated as its rural system
peak divided by the sum of the member systems’ rural system peaks. From 2001
through 2008, Big Rivers’ average coincidence factor was 99.2 percent in the summer
and 99.1 percent in the winter. Forecasts of Big Rivers’ rural system peak demand
l 3 - Id.
l4 Big Rivers’ Load Forecast 2009, Section 5.1, page 19.
Response to Staffs First Data Request, Item 22, page 2 of 5.
9
were divided by the respective coincidence factors to produce forecasts of its non-
coincident peak rural system peak demand for the summer and winter seasons.16
LONG-TERM FORECASTING MODELS
Long-term energy and peak demand forecasts are obtained using econometric
and SAE models and historical trends. Aggregate sales forecasts were developed for
each of Big Rivers’ three member cooperatives. The energy forecasts for the 2011-
2023 long term forecasts are based upon results from the long-term models which have
been calibrated to the results from the short-term models. Each member cooperative’s
long-term model was calibrated by applying the projected growth rate from each
respective long-term model to projected values from the short-term model from the prior
year.17
SAE models were used to forecast residential energy use per customer.
Econometric models were used to project the number of residential and small
commercial customers and energy sales for the small commercial class. Projections for
the large commercial class (including direct-serve customers) were based on informed
judgment, historical trends and information provided by individual customers.18 Street
lighting, irrigation and public buildings forecasts were based on historical trends. Total
energy sales are based on a bottoms-up approach with projections developed at the
customer class level and then summed across classes. Also, econometric models were
l6 Big Rivers’ Load Forecast 2009, Section 5.2, pages 19-20 and Response to Staffs First Data Request, Item 22.d.’ pages 4-5 of 5.
l 7 Response to Staffs Second Data Request, Item 31 .a., page 2 of 3.
l8 The real price of electricity was not a factor in the long-range forecasts of this customer class as it was for the Residential and Small Commercial classes. See Response to Staffs First Data Request, Item 20, page 1 I
10

used to forecast rural system coincident peak. Peak demand forecasts were developed
at the total system and rural system levels.1g
Big Rivers’ rural system load requirements reflect the load requirements of the
member cooperatives. Distribution losses are factored into each member system’s
sales. However, member system energy sales do not include the large industrial direct
serve customers. Over the historical period 1995-2008, rural system load grew from
1,665 GWH to 2,400 GWH, which represents an average annual increase of 3.4
percent. Over the 2008-2023 period, rural system load is projected to grow from 2,400
GWH to 2,955 GWH, representing an average annual increase of 1.5 percent.20
Big Rivers’ total system load requirements over the period 1993-2008 reflect a
significant decline in the large industrial direct-serve customer load, declining from
8,689 GWH in 1993 to 3,340.3 GWH in 2008.21 Over the 2008-2023 period, total native
load requirements, excluding the smelter loads, are projected to grow from 3,370.5
GWH to 3,936.3 GWH, which represents an average annual increase of 1 . I percent.22
Residential Energv Sales
The residential class accounts for roughly 64 percent of rural system energy
sales. The long-term residential use per customer model for each of the member
cooperatives specifies the relationship between energy use and three index variables
representing a base level of consumption, and heating and cooling consumption.
Big Rivers’ Load Forecast 2009, Section 6.1 , pages 21-22.
20 _-I Id Appendix C, page C-5.
21 This reflects the fact that the base loads of the two aluminum smelters were not supplied by Big Rivers from 1998 through 2008.
22 Big Rivers’ Load Forecast 2009, page C-I.
11

Residential energy sales are forecasted using two models: 1) the projected number of
residential customers, and 2) the projected usage per customer. Total projected sales
are the product of projected use per customer and the projected number of customers.
The energy use per customer is a function of household income, electricity prices,
weather (heating and cooling degree days), electric market share (heating, cooling and
water heating), appliance efficiencies, home size and home thermal efficiency. For
each member system, the use model may also contain a lagged dependent variable,
binary variables and autoregressive parameters to correct for serial ~orrelation.’~
Specifically, the residential end-use model reflects average monthly residential
consumption as a function of three index variables: space heating (“SHlndex”), air
conditioning (“AClndex”) and base load appliances (“Baselndex”). SHlndex is a
function of the market share of electric space heating devices, average device
efficiency, effective size of home envelope (to gauge home heat loss), home thermal
heat loss characteristics, real retail electric price, household income, and heating
degree days. Similarly, AClndex is a function of market share of air conditioning
devices, average device efficiency, effective size of home envelope (to gauge home
heat gain), home thermal heat gain characteristics, real retail electric price, household
income, and cooling degree days. Baselndex is constructed to capture the general
trend in appliance saturation levels of water heaters, refrigerators, separate freezers,
electric ranges and ovens, electric clothes washers and driers, dishwashers, television
23 -1 Id Section 6.2.1, pages 22-23, and Response to Staffs First Data Request, Item 23.
12

sets, and lighting. Baselndex is also a function of the price of electricity, household
income, and household size.24
From 1993 to 2008, Big Rivers’ residential energy sales grew from 1,052 GWH to
1,529.5 GWH, which represents an average annual growth rate of 3.0 percent. Over
the short-term 2008-201 3 forecast period, Big Rivers’ residential energy sales are
projected to grow from 1,529.5 GWH to 1,610.4 GWH, which represents an average
annual growth rate of 1.0 percent. Over the long-term 2008-2023 period, residential
energy sales are projected to grow from 1,529.5 GWH to 1,860.8 GWH, which
represents an annual average growth rate of 1.3 percent.25
Commercial Energy Sales
This customer group contains all commercial and industrial customers that are
not direct-serve customers and accounts for approximately 31 percent of rural system
energy sales. Econometric models were developed for each member cooperative to
forecast sales for customers with peak demand below 1,000 kW. For this group, energy
sales are a function of historical monthly sales, the ratio of real retail sales to
employment, heating degree days and cooling degree days. The number of customers
forecast is a function of the historical number of consumers and employment. For each
member system, the use model may also contain a lagged dependent variable, binary
variables and autoregressive parameters to correct for serial correlation.26
24 - Id., Section 8.3, pages 33-35.
25 -1 Id Appendix C, page C-9.
26 Id., Section 6.2.2, page 23, and Response to First Staff Data Request, Item 23, page 2 oi3.
13

For those customers with peak demand greater than 1,000 kW, energy sales
projections were derived for each individual customer based upon historical trends and
input from the local member cooperative regarding anticipated changes in customer
operations. The number of customers in this class is not expected to grow over the
forecast period.
From 1995 through 2008, Big Rivers’ small commercial energy sales grew from
448.8 GHW to 749.6 GHW, which represents an average annual growth rate of 5.1
percent. Over the short-term forecast period 2008-201 3, Big Rivers’ small commercial
energy sales are projected to increase from 749.6 GWH to 788.3 GWH, which
represents an average annual growth rate of 1.0 percent. Over the longer term period
2008-2023, small commercial sales are projected to grow from 749.6 GWH to 946.4
GWH, an average annual growth rate of 1.6 percent.27
Direct-Serve Customer Energy Sales
Over the historical period 1995-2008, Big Rivers’ direct-serve large industrial
load declined significantly. In 1995, this customer class purchased 7,150.8 GWH. By
2008, this sales load declined to 933.6 GWH.28 Large industrial direct-serve customers’
energy sales are projected to remain flat over the forecast periods. In 2008, energy
sales were 933.6 GWH. Excluding the aluminum smelters, energy sales to this class
are forecast to hold constant at 950.5 GWH from 2009-2023.29
27 - 9 Id Appendix C, page C-IO.
28 See Footnote No. 21.
*’ Big Rivers’ Load Forecast 2009, Page C-I 1.
14

All Other Internal Energy Sales
This category is made up of public street lighting and irrigation sales. For street
lighting over the historical period 1993-2008, this customer class has shown slow,
steady growth from 2.4 GWH to 3.3 GWH, which represents an average annual growth
rate of 2.4 percent. Over the short-term forecast period 2008-2013, street lighting
energy sales are projected to grow from 3.3 GWH to 3.6 GWH, which represents an
average annual growth rate of 1.7 percent. Over the long-term period 2008-2023,
energy sales are projected to grow from 3.3 GWH to 4.1 GWH, which represents an
average annual growth rate of 1.5 percent.30 Irrigation sales are an insignificant part of
Big Rivers’ system load. Irrigation sales are projected to hold constant at 179 MWHa3’
Member cooperative system distribution losses are factored into each system’s
sales forecast. Transmission losses are accounted for separately and are projected to
be 0.78 percent annually over the forecast period.
SEASONAL PEAK DEMAND
Big Rivers forecasts rural system coincident peak, rural system non-coincident
peak, and total system non-coincident peak. Coincident peak demand is maximum
simultaneous load of all rural substations on the Big Rivers system. Rural system non-
coincident peak demand is the sum of the highest rural system substation demand in a
given month.
Regression models were developed at the total system level to forecast seasonal
rural system coincident peak. Peak demand is a function of historical trends, energy
30 Id page C-12.
31 - Id., page C-13.
15

requirements and extreme temperatures. As a test of reasonableness of the peak
demand forecast, projected load factors were computed using the energy and demand
forecasts and then compared to historical trends. For projected rural system non-
coincident peak, a historical coincidence factor was applied to the projected rural
system coincident peak. Historically, Big River’s coincident summer peak demand has
been slightly larger than its winter peak. However, Big Rivers has recently experienced
a larger winter peak and that is expected to continue over the forecast period.
Over the historical period 1995-2008, both summer and winter peak demand
mirror the loss of large industrial load. In 1995, summer peak load was 1,166 MW and
winter peak was 1,080 MW. In 2008, peak demand had fallen to 616.3 MW in the
summer and 618.7 MW in the winter. Over the 2008-2023 period, Big Rivers’ winter
coincident peak is slightly larger that its summer peak. By 2023, the summer peak
demand is forecast to grow to 734.1 MW, which represents an average annual growth
rate of 1.2 percent. Similarly, the 2023 winter peak is expected to grow to 745.8 MW,
which represents an average annual growth rate of I .3 percent.
RANGE FORECASTS
32 33
Big Rivers’ base case forecasts reflect expected economic growth and average
weather conditions. Four high and low long-term range forecasts were developed in an
effort to address uncertainty surrounding these factors: base case economics with mild
weather, base case economics with extreme weather, optimistic
expected weather and pessimistic economics with expected weather.
economics with
Energy sales for
32 I_ Id., pages C-2 and 3.
33 None of the demand forecasts include the smelter loads. The smelter loads were added at a later date. See Section 1 of the Staff Report, pages 4-5.
16

the large commercial customers, including direct-serve customers, public, street and
highway lighting, and irrigation sales were assumed to be non-weather sensitive.34
WEATHER SCENARIOS
Big Rivers used the individual member cooperative energy sales models for the
residential and small commercial classes for its uncertainty analysis. Either extreme or
mild weather (in terms of heating and cooling degree days) was used in place of normal
weather. The large commercial and industrial direct-serve customers, public, street and
highway lighting, and irrigation customers are assumed to be non-weather sensitive.
In the base case, Big Rivers’ total system load is projected to grow from 3,340.3
GWH in 2008 to 3,936.3 GWH in 2023, which represents an average annual growth rate
of 1.1 percent. Under extreme weather conditions, total system energy sales are
projected to increase to 4,051.4 GWH by 2023 representing an average annual growth
rate of 1.3 percent. Under mild weather conditions, total system requirements increase
to 3,842.2 GWH in 2023 representing an average annual growth rate of 0.9 percent.35
Big Rivers’ summer coincident peak base case demand increases from 616.3
MW in 2008 to 734.1 MW in 2023 representing an average annual growth rate of 1.2
percent. By 2023, under extreme weather conditions, summer coincident peak grows to
776 MW representing an average annual growth rate of 1.5 percent. Similarly, under
mild weather conditions, by 2023, summer coincident peak demand grows to 696.6 MW
representing an average annual growth rate of 0.8 percent.36
34 Big Rivers’ Load Forecast 2009, Section 7.1 .I , page 25.
35 - Id., Appendix C, page C-I.
36 - Id., page C-2.
17

In the base case, Big Rivers’ total system winter coincident peak is projected to
grow from 618.7 MW in 2008 to 745.8 MW in 2023 representing an average annual
growth rate of 1.3 percent. By 2023, under extreme weather conditions, the winter
coincident peak grows to 813.3 MW representing an average annual growth rate of 1.8
percent. Similarly, under mild weather conditions, the coincident peak grows to 688.6
MW representing an average annual growth rate of 0.7 percent.37
ECONOMIC SCENARIOS
National event economic drivers are not figured into Big Rivers’ economic
scenario forecasts. Big Rivers’ high and low economic forecasts are the sum of the
individual member system energy sales forecasts. Projected growth rates in local
household income, population, number of households, employment, gross regional
product, and retail sales were adjusted up (optimistic) or down (pessimistic) to account
for local economic events within the service territ01-y.~~
Again in the base case, Big Rivers’ total system load is projected to grow from
3,340.3 GWH in 2008 to 3,936.3 GWH in 2023, which represents an average annual
growth rate of 1 .I percent. Under optimistic economic conditions, total system energy
sales are projected to increase to 4,279.5 GWH by 2023 representing an average
annual growth rate of 1.7 percent. Under pessimistic economic conditions, total system
37 - Id., page C-3.
38 Model simulations were not run. However, the base case represents economic assumptions that Big Rivers thought most likely to occur and represents a 5050 probability forecast. The four scenarios were based in large part on extreme values that have occurred over the last 20 years. The weather and economic scenarios are assumed to closely resemble a 90 percent bandwidth around the base case. Big Rivers’ Load Forecast 2009, Section 7.2 and Response to Staffs First Data Request, Item 26.
18

requirements increase to 3,742.9 GWH in 2023 representing an average annual growth
rate of 0.8 per~ent.~’
Big Rivers’ summer coincident peak base case demand increases from 616.3
MW in 2008 to 734.1 MW in 2023 representing an average annual growth rate of 1.2
percent. By 2023, under optimistic economic conditions, summer coincident peak
grows to 798.2 MW representing an average annual growth rate of 1.7 percent.
Similarly, under pessimistic conditions, by 2023, summer coincident peak demand
grows to 698.1 MW representing an average annual growth rate of 0.8 percent4’
In the base case, Big Rivers’ total system winter coincident peak is projected to
grow from 618.7 MW in 2008 to 745.8 MW in 2023 representing an average annual
growth rate of 1.3 percent. By 2023, under optimistic economic conditions, the winter
coincident peak grows to 81 0.8 MW representing an average annual growth rate of 1.8
percent. Similarly, under pessimistic economic conditions, the coincident peak grows to
709.2 MW representing an average annual growth rate of 0.9 per~ent.~‘
SIGNIFICANT CHANGES
Even though Big Rives has not filed an IRP with the Commission in many years,
it completes a load forecast every two years. Its prior load forecast was completed in
2007. Big Rivers’ 2009 load forecast projects lower growth rates across all customer
classifications than its 2007 load forecast. Rural system energy requirements are
projected to grow at an annual rate of 1.5 percent in the 2009 forecast versus 2.1
39 Big Rivers’ Load Forecast 2009, Appendix C, page C-I .
40 - Id., page C-2.
41 - Id., page C-3.
19

percent in the 2007 forecast. Similarly, rural system peak demand is projected to grow
at an annual rate of 1.4 percent versus 2.2 percent. Residential energy sales grow at
the annual rate of 1.4 percent in the 2009 forecast versus 2.0 percent in the 2007
forecast. Small commercial energy sales grow at the annual rate of 1.6 percent (2009)
versus 2.4 percent (2007). The decline in growth rates is largely the result of the
economic downturn experienced since 2008.
DISCUSSION OF REASONABLENESS, OBSERVATIONS & RECOMMENDATIONS
Staff makes the following observations of Big Rivers’ forecasting in its 2010 IRP
and recommendations for its next IRP filing.
Observations
Big Rivers has not accounted for pending Environmental Protection Agency
(“EPA) air and water quality rules in its load forecasts. Neither has Big Rivers explicitly
accounted for any DSM programs in its load forecasts.42 Big Rivers is clearly aware of
the pending regulations and has thought through what must be done in order to meet
new standards.43 However, this awareness and planning has not carried over to its load
forecasting. Big Rivers states that the load forecast is updated every two years and will
account for the new EPA regulations as they become established. Also, it argues that it
42 Big Rivers states that, when its load forecast was prepared in early 2009, no new DSM programs were due to be implemented by any of its member cooperatives. Any existing DSM and energy efficiency programs were already reflected in the energy sales data. The effects of any new programs would be accounted for in post-modeling forecasts. See Response to Staffs First Data Request, Item 21 .e., page 2 of 3.
43 Responses to Staffs First Data Request, Item 19, and Staffs Second Data Request, Items 20 and 27.
20

does not know the impact of pending EPA regulations on electricity prices, other than
that consumption will be negatively affected if prices rise.44
Big Rivers has experienced large declines in the demand for electricity in the
past and is well aware of the price sensitivity of its direct-serve customers and other
large customers. One purpose of a long-range load forecast’s sensitivity analysis is to
investigate how a utility will be affected by adverse conditions and then to plan
accordingly. The EPA has been openly working on implementing new air and water
quality regulations for some time. It seems short-sighted to update the load forecast
biennially only and to not attempt to incorporate the effects of these new regulations, the
effects of which could have serious impacts on Big Rivers’ regional economy and on Big
Rivers’ service territory specifically. Waiting until events are known tends to defeat the
purpose of prudent risk analysis and planning.
Big Rivers’ base case load forecast appears to be reasonable. Section 8 of the
2009 load forecast contains a good general description of its forecast methodology.
The results of the specific regression runs and additional information regarding the
methodology were also provided through data requests. However, the explanations do
not always provide a level of detail sufficient to thoroughly understand the basis of
underlying modeling assumptions and how model variables were constructed. For
example, three indices were constructed and used in the SAE models. The indices are
independent variables in the SAE regression equations and incorporate information
from a variety of sources. Big Rivers did not provide a clear explanation of how the
indices were constructed. Therefore, it is unclear how changes to underlying variables
44 Response to Staffs First Data Request, Items 19 and 21.
21

in each index could affect the index value which, in turn, could affect the resulting
coefficients in the regression equation.
Big Rivers’ sensitivity analysis models two extreme weather scenarios and two
extreme economic scenarios. In the absence of EPA actions, the sensitivity analysis
appears reasonable. However, the basis for the underlying assumptions was not clearly
explained.
Recommendations
o Big Rivers should present and discuss its specific models and
equations with greater specificity. Underlying assumptions and
modeling variables need to be explained clearly and concisely with as
much detail as possible.
Big Rivers should consider updating its load forecasts annually.
Big Rivers should explicitly account for future DSM and energy
efficiency programs in its load forecasts.
Big Rivers should include pending EPA regulations and any other
regulations that could potentially have major impacts upon its regional
and service territory economies in its sensitivity analysis.
Big Rivers should run forecast simulations in its sensitivity analysis in
order to gain a better understanding of the probability of occurrence
o
o
o
o
for the various scenarios, including the potential closure of one or
both of the aluminum smelters on its system.
22
SECTION 3
DEMAND-SIDE MANAGEMENT
INTRODUCTION
This section discusses the DSM portion of Big Rivers’ IRP. Historically, Big
Rivers and its three member distribution cooperatives have provided DSM programs
that are primarily educational in nature, the exception being the distribution of Compact
Fluorescent Lights (“CFLs”) to the three member cooperatives’ retail customers. In
conjunction with this IRP, Big Rivers elected to evaluate several new DSM programs
which were selected based on the results of a DSM Potential Report (“Report”)
prepared for Big Rivers by GDS.45 The programs are based on the results of the energy
efficiency savings potential analysis contained in the Report, the possible widespread
application of the measures identified, and a review of energy efficiency programs
currently offered by other electric cooperatives, investor-owned electric utilities, and
energy efficiency organizations located in or around Kentucky.
EXISTING DSM PROGRAMS
Big Rivers identified 11 programs that are currently offered to its member
cooperatives’ retail customers. Following are the existing activities and programs which
are intended to educate and inform the customers of available energy efficiency
opportunities.
1. Distribution cooperative websites;
2. Marketing and promotion;
3. Home energy efficiency expo;
4. Distribution of DOEIEPA “Home Efficiency Tips” booklet;
45 Big Rivers hired GDS in December 2009 to perform a potential study of energy efficiency, demand response and demand-side management measures.
23

5.
6.
7.
8.
9.
IO.
11.
CFL distribution;
Energy use assessments;
Renewable energy from Domtar, Inc. (“Domtar”);
JPEC and Big Rivers facility lighting upgrade;
Energy savings analysis to industrial and large commercial members;
Construction of high performance schools; and
Combined heat and power project for reliability support and backup power at
Domtar.
Due to their largely informational and/or educational nature, the IRP did not include load
impacts, tables, or benefitkost analyses of existing programs; however, descriptions of
the existing programs were provided.
PROGRAM DESCRIPTIONS
Following is a brief description of each of the existing DSM programs:
Distribution Cooperative Websites
Each of the distribution cooperative websites provides easy-to-use Home Energy
Suites with adjustable inputs specific to a home, which allows customers to compare
current energy use to estimated energy use resulting from various improvements in
efficiency.
Marketinq and Promotion
This program focuses on energy efficiency education and advertising efforts
promoting Touchstone Energy Homes and the use of Energy Star appliances and
lighting, insulation, and high efficiency HVAC.
Home Energy Efficiencv Expo
Each of the member cooperatives hosts residential energy efficiency expos that
provide education and outreach to customers focusing on energy efficiency in the home.
24

Distribution of DOE/EPA Booklets
The member cooperatives have provided thousands of DOE/EPA “Home
Efficiency Tips” booklets to new and existing customers that visit the cooperatives’
offices.
representatives.
CFL Distribution
They have also used this information for training their customer service
CFLs are distributed to customers of the distribution member cooperatives who
visit their offices or attend their annual meetings. To date, approximately 709,000 CFL
bulbs have been provided to retail customers at no cost.
Energy Use Assessments
Energy Use Assessments are provided to commercial and industrial customers
through energy audits and education programs that help customers identify simple and
low-cost efficiency measures.
Renewable Energv from Domtar
Big Rivers offers renewable energy to its member cooperatives and their
customers from an Energy Star Combined Heat and Power ((CHP’’) project operated by
Domtar which generates electricity using wood chips that are waste by-products of the
paper manufacturing process.
Facilitv Lighting Upgrade
JPEC and Big Rivers upgraded their facility lighting to high efficiency electronic
ballasts and fluorescent lighting.
25

Industrial and Commercial Energv Savings Analyses
Big Rivers provides energy savings analyses to industrial and large commercial
members by combining efforts with its member systems, DOE, and the University of
Louisville’s Kentucky Pollution Prevention Center.
Construction of Hiqh Performance Schools
Big Rivers provides support to member system school districts to promote the
construction of high performance (high efficiency) schools. The Hancock County school
district renovated three older schools with a focus on energy efficiency and completed a
new high performance school in 2006. The Meade County school district completed a
new high performance school in 2006 as well.
Combined Heat and Power Proiect at Domtar
Big Rivers provided assistance to develop and continues to provide reliability
support and backup power for the Domtar combined heat and power project in Hancock
County. The 50 MW renewable generator produces electricity from waste wood chips
produced in the process of manufacturing paper. The project won the 2005 Energy Star
CHP award for efficiency.
ANALYSIS OF NEW DSM PROGRAMS
The Report evaluated over 40 residential energy efficiency programs or
measures and more than 80 commercial and industrial energy efficiency programs or
measures. The list of energy efficiency measures examined was developed based on
review of the measures and programs included in other technical potential studies in
Kentucky and similar climate regions, as well as other energy efficiency technical
potential studies that have been conducted throughout the country. The set of energy
26

efficiency programs or measures considered was pre-screened to only include those
measures that are currently commercially available.
The Report was developed by GDS using customized residential and
commercial/industrial (“C&l”) sector level potential assessment computer models and
company-specific cost-effectiveness criteria including the most recent Big Rivers
avoided cost projections for electricity. Measure saturation data was primarily obtained
from the 2007 Big Rivers End-Use and Energy Efficiency Survey for residential
customers and the 2003 EIA Commercial Building Consumption Survey. The results of
the analysis provided detailed information on energy efficiency measures that would be
the most cost-effective and that have the greatest potential kWh and kW savings.
The energy efficiency measures selected for consideration in the Report were
evaluated using the traditional “California Tests.”46 To determine the cost-effectiveness
of energy efficiency measures, the Report primarily used the Total Resource Cost
YTRC”) test. The TRC test evaluates the net cost of a measure as a resource option
based on the measure’s total costs, including those of participants, the utility, and non-
participants. Only cost-effective DSM measures were chosen for implernentati~n!~
46 California Public Utilities Commission and “Standard Practice Manual for Economic Analysis
California Energy of Demand-Side
Commission, Management
Programs”, Document Number P400-87-006, December 1987. The standard tests are the Utility Test, the Participant Test, the Ratepayer Impact Measure, and the Total Resource Cost test.
47 The Report stated that “[tlhe authors of this report emphasize that only energy efficiency measures that cost less than new power supply resource are considered to be cost effective.” In response to Item 32 of Staff‘s Second Data Request, this was clarified to state that “[tlhe authors of this report emphasize that only energy efficiency measures that cost less than the avoided capital and operating costs of power supply resource are considered to be cost effective.”
27

However, some marginally cost-effective energy efficiency measures were not chosen
for implementation.
The Report identified four different types of efficiency potential: technical,
economic, achievable, and program. Technical and economic efficiency potential
provide a theoretical upper boundary for energy savings while achievable and program
efficiency potential attempt to estimate what may realistically be achieved, when it can
be captured, and the cost to do so. Ultimately, the Report utilized program efficiency
potential as the target for its DSM programs based on a specific amount of funding. Big
Rivers’ funding for DSM programs in 201 1 will be $1 million, with that amount increasing
2.5 percent per year through 2020.4s Total resources required by Big Rivers and its
three member-owners to implement the final DSM plan resulting from the pilot programs
currently underway will be determined through the evaluation of those pilot projects!’
Total energy savings for 2011 are projected to be 3,767 MWH with cumulative
savings reaching 49,160 MWH in 2025. The winter peak demand savings is projected
to be 916 kW in the first year with cumulative savings reaching almost 14 MW in 2025.
The summer peak demand savings is 623 kW in the first year with cumulative savings
reaching over 10 MW in 2025.
The report included a demand response analysis. With the value associated with
avoided generation and transmission capacity currently being low due to Big Rivers and
the Midwest IS0 being long on capacity, the demand response programs evaluated
48 One million dollars was chosen as the expenditure level as that amount approximates one percent of annual revenue from the rural customer class, the class to which the programs will apply. See Response to Staffs First Data Request, Item 28.a.
49 Response to Staffs Second Data Request, Item 21.
28

were not cost-effective under the TRC test. Therefore, Big Rivers chose not to pursue a
formal demand response program at this time.
NEW PROGRAM DESCRIPTIONS
Big Rivers identified seven new DSM programs to consider in conjunction with its
IRP consisting of five residential and two commercial and industrial programs. Big
Rivers' member distribution cooperatives have agreed to offer these programs to their
customers.50 Following is a brief description of these new DSM programs:
I. Residential Efficient Lighting Program - this program is designed to
encourage residential customers to install high efficiency bulbs in their homes, replacing
incandescent bulbs.
2. Residential Efficient Products Program - this program provides financial
incentives and market support via retailers to increase the market share and sales of
efficient home appliances.
3. Residential Advanced Technologies Program - this program is designed
to promote the purchase of efficient products with significant energy savings potential
that are currently available in the market place but continue to have low market
saturation.
4. Residential Weatherization Program - this program is designed to
encourage residential customers to upgrade and install energy efficient building shell
measures in homes that are inadequately insulated or weatherized.
-____
50 Response to Staff's First Data Request, Item 3.a.
29

5. Residential New Construction Program - the objective of this program is
to support energy efficient design and installation of energy efficient appliances during
the construction of new residences.
6. C&l Prescriptive Lighting Program - this program is designed to
encourage commercial and industrial customers to install high efficiency lighting
technologies in their businesses to replace inefficient technologies.
7. C&l Prescriptive HVAC Program - this program is designed to encourage
customers to install energy efficient HVAC equipment.
Big Rivers did not incorporate the impact of new DSM programs into its load
forecast, nor did it explicitly factor environmental costs into its DSM e~aluation.~’
However, the impacts of existing programs are captured indirectly due to the use of
historical data in the residential and small commercial energy models used by Big
Rivers’ in developing its forecasts for those customer groups.
The inclusion of environmental costs, when known, into the DSM evaluation may
make marginal programs more cost-effective and/or feasible. Also, given Big Rivers’
reliance on off-system sales to achieve its required margins, including the opportunity
costs of lost off-system sales in its evaluation, may improve the cost-effectiveness of
DSM programs in the future.
- DISC USS I ON 0 F REASONABLE N ESS
Staff recognizes the effort Big Rivers and its member cooperatives have made
in developing the new DSM programs and is generally encouraged with the breadth and
scope of Big Rivers’ DSM analysis. Staff believes that the Report provided a sound
- Id., Item 21 .e.
30
basis for evaluating proposed energy efficiency programs and their cost-effectiveness
and that developing the analysis in conjunction with its three member distribution
cooperatives should aid in making Big Rivers’ DSM programs successful.
Staff believes that Big Rivers should be aggressive in pursuing the new DSM
programs in order to achieve the targets set in the IRP and that emphasis should be
placed on educating potential DSM customers and marketing the programs. Staff
believes that marginally cost-effective programs should be reviewed in light of any
changes in environmental or other major costs and that the ability of DSM to increase
Big Rivers’ ability to make off-system sales should be considered in all future DSM
analyses. Staff also believes that opportunities for demand-response should continue
to be explored by Big Rivers.
The expectation that utilities such as Big Rivers, which rely heavily on coal-fired
generation, will incur significant cost increases due to stricter environmental regulations
is an additional factor that Big Rivers should consider in its future analysis of DSM and
energy efficiency opportunities. While it presently lags behind the other major electric
utilities under the Commission’s jurisdiction in DSM programs, Staff believes Big Rivers’
present circumstances (having control of its generation and not having a pressing need
for additional generating capacity in the near-term) offer Big Rivers an opportunity to
make reasoned and well-informed decisions on DSM. Squandering this opportunity
should not be acceptable to Big Rivers, its members-owners or the retail customers of
those member-owners.
31

RECOMMENDATIONS
The last Big Rivers IRP evaluated by Staff was filed in case 2002-00428.52
Two of the Staffs report in that case contained four recommendations on DSM.
recommendations, which dealt with developing a net metering pilot program and a
Green power program, have been rendered moot since the issuance of that report. Big
Rivers’ member cooperatives have implemented net metering tariffs and Big Rivers and
its member cooperatives all have renewable energy resource service tariffs which
permit customers to purchase Green power.
A third Staff recommendation in that case was for Big Rivers to evaluate DSM
programs that provide increased efficiency for all customers. The programs included in
the current IRP have addressed that recommendation. A fourth recommendation was
for Big Rivers to inform Staff of the status of a high efficiency heating incentive program
Big Rivers was pursuing at the time of its 2002 IRP. It is Staffs understanding that Big
Rivers chose not to pursue that particular program. For this IRP, Staff makes the
following recommendations:
o Big Rivers should include environmental costs in future DSM evaluations
and evaluate DSM as an environmental compliance option in addition to a
resource option.
Big Rivers should aggressively pursue its new DSM programs in order to
achieve the results projected in the IRP.
o
52 Case No. 2002-00428, The 2002 Integrated Resource Plan of Big Rivers Electric Corporation (Ky. PSC Apr. 12, 2004).
32

o Big Rivers should evaluate the feasibility of bundling measures that are
marginally cost-effective into programs.
Big Rivers should take into consideration in future DSM analyses how its
off-system sales can be affected by demand and energy reductions
achieved through DSM programs.
Big Rivers should include the impact of tax credits (if available) in future
DS M evaluations.
Big Rivers should continue to monitor opportunities for demand response.
o
o
o
o As an education tool, Big Rivers should consider developing a DSM
education program for middle school students.
33

SECTION 4
SUPPLY-SIDE RESOURCE ASSESSMENT
-- INTRODUCTION
This section summarizes, reviews, and comments on Big Rivers’ evaluation of
It also includes discussion on various existing and future supply-side resources.
aspects of Big Rivers’ environmental compliance planning.
Existing Capacity
Big Rivers is a generation and transmission utility providing wholesale electric
service to its three member-owner distribution cooperatives. Even though 90 percent of
its accounts are residential, Big Rivers’ energy load is “lumpy,’’ as two aluminum
smelters purchase 69 percent of the power. Residential customers represent 15
percent of sales, with seven percent of its sales to small commercial customers and
nine percent sold to large commercial and industrial customers.53
Big Rivers has access to 1,829 MW of total generating capacity,54 yet, due to
constraints discussed later, the current total capacity is limited to 1,736 MW. Big Rivers
owns and operates 1,444 MW of predominately coal-fired generation and has an
additional 207 MW available from two coal-fired units owned by HMP&L which are
operated by Big Rivers. An additional 178 MW are available from two hydro-electric
power plants operated by SEPA.
Big Rivers’ Reid Unit 1, with a maximum capacity of 65 MW, has been configured
to burn coal or gas; however, the gas line to the unit is not in service. This reduces the
53 Plan Summary, Section 5-1 including Figure 5.1.
54 - Id., Section 5-1.
34
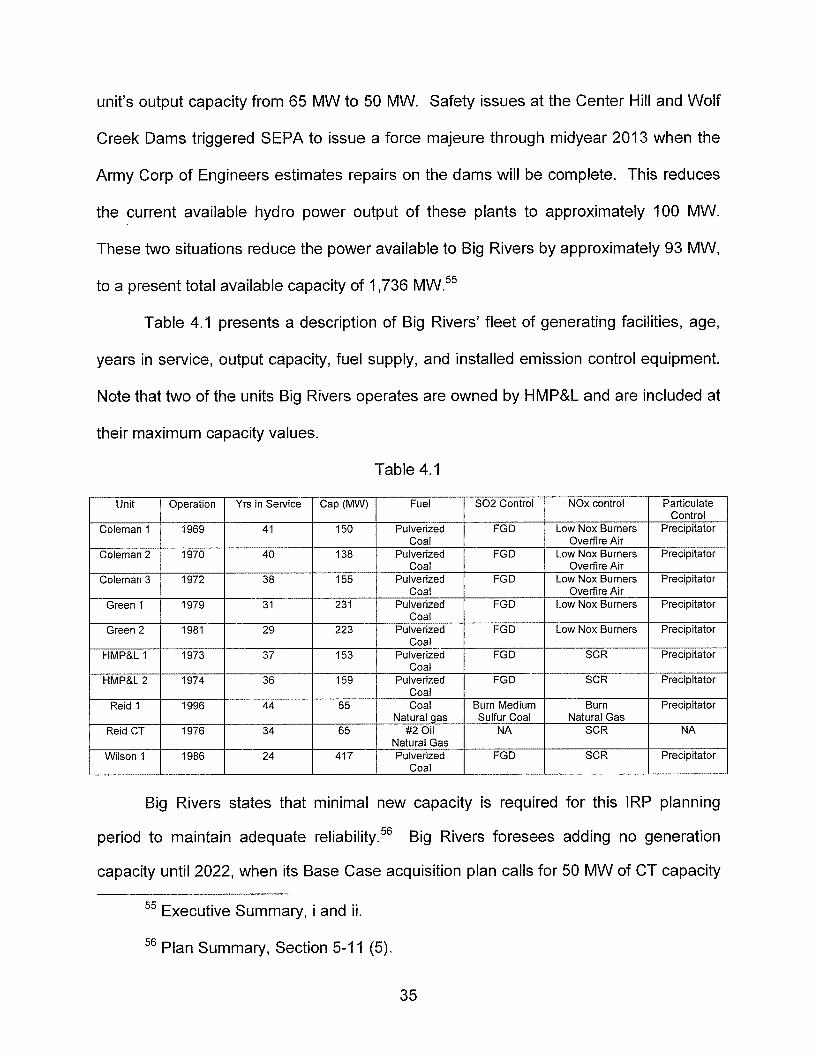
unit’s output capacity from 65 MW to 50 MW. Safety issues at the Center Hill and Wolf
Unit Operation Yrs in Service Cap (MW) Fuel
Coleman 1 1969 41 150 Pulverized Coal
Coleman 2 1970 40 138 Pulverized Coal
Coleman 3 1972 38 155 Pulverized Coal
Green 1 1979 31 231 Pulverized Coal
Green 2 1981 29 223 Pulverized Coal
HMP&L 1 1973 37 153 Pulverized Coal
HMP&L 2 1974 36 159 Pulverized Coal
Reid 1 1996 44 65 Coal Natural gas
Reid CT 1976 34 65 #2 Oil Natural Gas
Wilson 1 1986 24 417 Pulverized
Creek Dams triggered SEPA to issue a force majeure through midyear 2013 when the
SO2 Control NOx control Particulate
FG D Low Nox Burners Precipitator
FGD Low Nox Burners Precipitator
FG D Low Nox Burners Precipitator
FGD Low Nox Burners Precipitator
FG D Low Nox Burners Precipitator
FG D SCR Precipitator
FGD SCR Precipitator
Burn Medium Burn Precipitator
NA SCR NA
FG D SCR Precipitator
Control
Overfire Air
Overfire Air
Overfire Air
Sulfur Coal Natural Gas
Army Corp of Engineers estimates repairs on the dams will be complete. This reduces
Coal
the current available hydro power output of these plants to approximately 100 MW.
1
These two situations reduce the power available to Big Rivers by approximately 93 MW,
to a present total available capacity of 1,736 MW.55
Table 4.1 presents a description of Big Rivers’ fleet of generating facilities, age,
years in service, output capacity, fuel supply, and installed emission control equipment.
Note that two of the units Big Rivers operates are owned by HMP&L and are included at
their maximum capacity values.
Table 4.1
Big Rivers states that minimal new capacity is required for this IRP planning
period to maintain adequate re l iab i l i t~ .~~ Big Rivers foresees adding no generation
capacity until 2022, when its Base Case acquisition plan calls for 50 MW of CT capacity
55 Executive Summary, i and ii.
56 Plan Summary, Section 5-1 1 (5).
35

to maintain a planning reserve margin of 14 percent. However, if Big Rivers were to
System Peak Energy Efficiency Owned SEPA Maximum Total Capacity Capacity
Year Demand (MW) Programs (MW) Capacity (MW) Capacity (MW) (MW) Surplus (MW) 201 1 1,498 (1.00) 1,632 100 1,732 235
2012 1,504 (2 07) 1,626 100 1,726 223
201 3 1,510 (3.19) 1,544 178 1,722 21 5
2014 1,517 (4.21) 1,616 178 1,794 28 1
201 5 1,525 (5.26) 1,616 178 1,794 274
2016 1,533 (6 33) 1,616 178 1,794 267
201 7 1,542 (7.41) 1,616 178 1,794 259
2018 1,551 (8.35) 1,616 178 1,794 251
201 9 1,560 (9.34) 1,616 178 1,794 243
2020 1,568 (IO 28) 1,616 178 1,794 236
2021 1,578 (11.21) 1,616 178 1,794 228
2022 1,587 (12.05) 1,666 178 1,844 270
2023 1,595 (12.90) 1,666 178 1,844 262
2024 1,604 (1 3.76) 1,666 178 1,844 254
I 2025 I 1,613 1 (1464) I 1,666 I 178 I 1,844 I 246
reduce its reserve margin to 12 percent, no capacity additions are needed during the 15
I
year period of the IRP. Further, Big Rivers, as a member of the Midwest ISO, has
access to the Midwest IS0 energy market, and other markets, to acquire and sell power
as needed. 57
Table 4.2 includes Big Rivers' projected capacity and peak demand
Energy and peak demand requirements are projected to increase at average
compound rates of 0.4 percent and 0.5 percent, respectively, per year, from 2011 to
2025, reaching 1,613 MW winter peak demand as shown below. The relatively low
57 - Id., Section 5-3 at 5-9.
58 __. Id., Section 5-4, Table 5.2 at 5-10.
36

growth rates are greatly influenced by the two aluminum smelters, whose combined
load is projected to remain level at 850 MW throughout the forecast horizon. Peak
demand is projected to increase by approximately 8 MW per year from 201 0 to 2025. 59
The forecast is influenced by the large commercial and industrial class, which
represents nearly two-thirds of total system peak demand and energy requirements.
The growth in the residential class is influenced by increases in the number of
households, which is projected to increase 0.5 percent per year through 2025. Growth
in the number of small commercial customers is driven by employment, which is also
projected to increase at an average rate of 0.5 percent per year.60
Big Rivers’ projected peak demand and energy requirements can be seen in
Table 4.3.61
Year Tatal energy requirements (MWh) Winter Peak Demand (MW)
201 1 10,729,241 1,498 2012 10,782,940 1,504
2014 10,827,941 1,517 201 5 10,867,352 1,525 2016 10,926,611 1,533 201 7 10,951,812 1,542 201 8 10,996,403 1,551
2020 11,101,517 1,568 202 1 1 1,127,454 1,578 2022 11,171,403 1,587 2023 11,214,923 1,595 2024 11,278,601 1,604
2013 10,793,126 1,510
2019 11,041,551 1,560
2025 11,323,317 1,613
Table 4.3
Summer Peak Demand (MW)
1,485 1,491 1,497 1,503 1,511 1,519 1,527 1,536 1,544 1,552 1,561 1,569 1,578 1,586 1,595
59 - Id., Section 5-3 at 5-7’.
6o - Id., Section 5-3 at 5-8.
- . d l Id Section 5-3, Table 5.1 at 5-8.
37’

Reliabilitv Criteria
A reserve margin is the amount of capacity in excess of that required to meet the
projected peak load. A reserve margin is necessary to reduce the risks that are posed
by forced outages, transmission constraints, load forecast deviations, or other
unforeseen events that prevent a utility from being able to meet its load requirements.
Big Rivers has performed no reserve margin studies in the past 10 years62 and,
as a Midwest IS0 member, intends to stay within that organization’s resource adequacy
guidelines and not perform a study before its next IRP.63 Its reserve requirements are in
the Midwest IS0 Business Practices Manual (“BPM”) and are not Big Rivers-specific,
yet apply equally to all Midwest IS0 members. The BPM reserve margin pertaining to
Big Rivers is 4.5 percent and it proposes to take advantage of the efficiencies that come
with collective Independent System Operator member~h ip .~~ Further, Big Rivers does
not anticipate any system reliability issues as it meets the proposed EPA reg~ la t ions .~~
Big Rivers states that it has seen little change in the first few months of its
integration into the Midwest IS0 and is uncertain how its units will be dispatched or how
its generation efficiency will be affected.66 Even though the Midwest IS0 provides for
an exception to its margin requirement if a state establishes its own reserve margin,67
62 Response to Staff‘s Second Data Request, Item 5(a).
63 - Id., Item 5(b).
64 - Id.
Response to the Attorney General’s (“AG”) Data Request, Item 15.
66 Response to Staffs Second Data Request, Item 6.
67 - Id., Item 4.
38

Big Rivers believes that if it were mandated by this Commission to maintain a reserve
margin above the reserve margin required by the Midwest IS0 the result would be
increased costs which would place Big Rivers and its excess power at an economic
disadvantage relative to other Midwest IS0 members.68
One of Big Rivers’ planning objectives is to “[mleet North American Electric
Reliability Corporation (“NERC”) guidelines and requirements.” In NERC’s 2009 Long-
Term Reliability Assessment, a 15 percent reserve margin was identified as the target
for predominately thermal system^.^' This target reserve margin is not based on a
specific study for Big Rivers; however, Big Rivers stated that it determined it wise to use
the NERC 15 percent value, as neither the Commission nor the Southeastern Electric
Reliability Corporation require a specific reserve margin.70 While Big Rivers used a 15
percent reserve margin target, a minimum acceptable margin of 14 percent was utilized
in the modeling process to show that actual annual margins could vary above and below
the target during the term of the IRP.7‘
Supply-side Resources
Big Rivers canceled its power purchase agreement with LG&E Energy Marketing
(“LEM”) in the Unwind Transaction and regained control of its generating assets in
2009. From 1997 through 2009, the Big Rivers and HMP&L generating units were
operated by subsidiaries of E.ON U.S., LLC. Except for the power from SEPA, Big
68 Response to Staffs Second Data Request, Item 5(b).
69 Plan Summary, Section 8-2.
70 Response to Staffs Second Data Request, Item 2(a).
71 - 1 Id Item 2(b).
39

Rivers’ power requirements were provided through its purchased power agreement with
LEM. Big Rivers was required to file an IRP with the Commission by November 15,
2010 as a result of the Unwind. Big Rivers engaged GDS to prepare the IRP while
relying on its own employees and its three member-owned cooperatives for
Big Rivers’ resource assessment was developed using the Strategist Integrated
Planning System (“SIPS”). The model, which is licensed to GDS by Ventyx, utilizes
specific Big Rivers inputs to compare and develop least-cost expansion plans. Potential
resource additions are compared and the lowest-cost portfolio is chosen.73
The production simulation and expansion planning analysis was conducted for
the Base Case which includes (1) the Base Load and Energy Forecast, (2) Energy
Efficiency (“EE”) Programs included in the $1 million annual EE expenditure case, (3)
base fuel price projections, and (4) base market price projections as a source of energy
p u rc h ases . 74
During the distinct SIPS model runs, internal sensitivities for resource
assessment were adjusted by GDS. Adjustments included those to (1) high load and
energy projections, (2) fuel cost variances, (3) the enactment of Renewable Portfolio
benchmarks, (4) environmental regulation uncertainties, and (5) Midwest IS0 resource
adequacy guidelines. These individual model adjustments to the Big Rivers system
provided GDS scenarios for maximizing available resources. 75
72 Plan Summary, Section 4-2 at 4-1
73 A I Id Section 5-2 at 5-4 and 5-5.
74 -1 Id Section 5-5.
75 - Id., Section 5-2 at 5-5 and 5-6.
40

In addition to changing the sensitivities, GDS developed a list of potential
resource additions for evaluation. The options modeled include renewable supply-side
options, traditional supply side options, and energy efficiency initiatives. The list
includes: (1) Biomass; (2) Landfill Gas; (3) Wind; (4) Photovoltaic; (5) Coal bed
Methane; (6) Nuclear; (7) Coal; (8) Gas-fired Combined Cycle; (9) Gas-fired
Combustion Turbine; and (IO) an Energy Efficiency Portfolio.76 In Kentucky, nuclear is
not an option as it is prohibited by state law.77
Big Rivers and GDS reviewed the output from the model and chose the
assortment of expansion units necessary to achieve the lowest cost while meeting the
planning reserve margin criteria.78 Also, if Big Rivers were to switch fuels due to EPA
regulations, such switching could trigger an EPA "New Source Review"79 and affect Big
Rivers' Title V permit under the 1990 Clean Air Act amendments.8"
Assessment of Non-Utilitv Generation - Cogeneration, Renewables, 2nd Other Sources
1. Cogeneration
Big Rivers' IRP includes capacity and energy from its members' SEPA
allocations and notes that it contains no other renewable resources, cogeneration or
non-utility sources in the plan.81 In performing resource analysis for this IRP as it
76 _ _ L I Id Section 5-4 at 5-10.
77 _.__ Id., Section 8-25.
78 - Id., Section 5-2 at 5-5.
79 Response to AG's Data Request, Item. 17.
'"Id -7 Item. 4.
Plan Summary, Section 8-3(d) at 8-8.
41

relates to cogeneration, Big Rivers scrutinized characteristics such as capital
requirements, resource availability, fuel-requirements, and non-fuel operating costs and
determined that, if cogenerated power could be offered to it at a price-point comparable
to either self-supply or purchase power, it would be considered.82
2. Renewables
Big Rivers has a renewable tariff on file with the Commission83 and makes
Energy Star certified renewable power available to its three member cooperatives,
which in turn offer that power to their members. The certified power is generated from
burning waste products in a paper manufacturing process.
Big Rivers' least-cost Renewable Portfolio Standard ("RPS") sensitivity case was
also developed using SIPS. Big Rivers used the base load and energy forecast and
base market price projections and addressed uncertainties using a sensitivity case
approach. The base case assumptions were used for all variables with the exceptions
of a 15 percent RPS by 2015, 20 percent RPS by 2020, and 25 percent RPS by 2025.
The specific energy sources modeled include 80 percent wind, 15 percent biomass, and
5 percent photovoltaic sources.84
SEPA provides hydro-electric power to Big Rivers, yet the amount of power is
currently constrained due to safety issues at the Wolf Creek and Center Hill Dams near
Jamestown, Kentucky and Lancaster, Tennessee. The Army Corps of Engineers
82 Response to Staffs Second Data Request, Item 8.
83 Big Rivers 2009 Load forecast, Section 2.4, Power Supply at 10-1 1.
84 Plan Summary, Section 8, page 8-1.
42

anticipates repairing the dams in mid-year 2013.85 Big Rivers does not foresee having
to pay a higher cost for the power as a renewable resource under future EPA rulings, as
the rates for the SEPA power are cost-based.86 Table 4.4 shows the expected SEPA
Year SEPA Capacity (MW)
201 1 i 00
201 2 100
201 3 100
2014 178
201 5 178
201 6 178
201 7 178
201 8 178
201 9 178
2020 178
2021 178
2022 178
2023 178
2024 178
2025 178
~
capacity and energy that will be available to Big Rivers.87
SEPA Energy (MWh)
301,930
301,930
292,889
267,000
267,000
267,000
267,000
267,000
267,000
267,000
267,000
267,000
267,000
267,000
267,000
Table 4.4
3. Other Non-Utility Sources
Big Rivers offers energy from SEPA and certified Energy Star power from the
Domtar paper mill as the only non-utility power sources.
85 Executive Summary at i and ii.
86 Response to AG’s Data Request, Item 3.
87 Plan Summary, Section 8-3(d) at 8-9, Table 8.5.
43

C o m p, I i a n ce P la n n in 9
Since last filing its IRP in 2005, Big Rivers has stayed abreast of environmental
regulations and its plants have remained in compliance. Table 4.1 shown earlier in this
section identifies the state of Big Rivers’ seven coal-fired generating units and one
combustion turbine unit, along with the two HMP&L coal-fired units.
At the time Big Rivers filed this IRP with the Commission, the EPA had proposed
but not finalized new regulations which will have enormous impact on generation
facilities and fuel sources, particularly coal. As the guidelines are preliminary and still
evolving, Big Rivers did not specifically address the EPA’s proposed findings for this
IRP filing88 and will not take any firm action on the proposed EPA regulations until the
rules are
Big Rivers finds it prudent to wait for final EPA rules before making a host of
decisions which impact its generation fleet. Some of those decisions involve multi-
million dollar plant retrofits, purchasing or not purchasing allotments, changing fuel
supplies, or retiring coal-fired power plants. Big Rivers finds it fundamental to have firm
costs in hand versus projections. Concurrently, if all generating companies retire plants
and decide to buy power on the open market, it is probable that the cost for purchased
power will rise. If all coal-fired plants are reconfigured to burn natural gas, then fuel
costs will change.
Big Rivers has investigated and is participating in the current studies surrounding
COa. It is a partner in a consortium headed by the University of Kentucky Center for
88 Response to AG’s Data Request, Items 9 and I O .
89 - Id., item 8.
44

Applied Energy Research that is studying carbon redu~tion.~’ The Carbon Management
Research Group is looking for ways to reduce and manage CO2 in coal-fired generating
plants. For this IRP, Big Rivers did not include a C02 compliance plang’ due to the
uncertainties surrounding actions of the EPA and other actions Congress may take as it
reins in C02 emissions.
At the time Big Rivers filed this IRP, the EPA had finalized its agency’s
endangerment finding utilizing the Clean Air Act to regulate green house gases on
automobiles, yet had not finalized rules on power produ~tion.~’
The EPA is mandated to have final rules in place by November 2011 to regulate
hazardous air pollutants. The Maximum Available Control Technology rules are to be
published in early 2012 and the EPA will expect compliance within three years for many
airborne noxious pollutants, including mercury.93 If the rules mandate compliance on a
plant-by-plant basis, as opposed to a fleet basis, each of Big Rivers’ coal-fired units
could require additional equipment.
The Clean Air Interstate Rule was overturned and remanded in 2008, but the
courts temporarily kept its regulations in place as the EPA reworked it for compliance.
As a substitute, in 2010, the EPA released the Clean Air Transport Rule (“CATR”)
designed to address the deterioration of air quality downwind from emitting sources.94
Plan Summary, Section 8-5(f) at 8-25
- Id., at 8-26.
92 A I Id at 8-25.
93 - Id., Section 8-26.
94 EPA finalized these rules on July 6, 201 1 and renamed them CSAPR.
90
45

CATR is to become effective in January 2012 and will address SO;! and NOX emissions.
At this time, Big Rivers’ fleet is in complianceg5 and has surplus allowances as it
currently has scrubbers on all of its generating units, with the exception of Reid Unit 1
and the Reid combustion turbine. When the proposed rules and associated allowances
are finalized, Big Rivers will determine if its generating facilities meet the compliance
standards or if they require modification. Big Rivers has proactively investigated several
scenarios to satisfy the rules and anticipates possibly shutting down the coal-fired Reid
Unit 1 and further reducing generation at one or more coal-fired units in its generation
fleet.96 Further, if Big Rivers is not allocated adequate allowances, it will determine
whether it is more efficient to purchase allowances or retrofit its generating units with
additional emission controls.97
If the proposed CATR rules are put into place as currently proposed, Big Rivers
would reduce generation or purchase allowance allotments, if the allowances are
affordable. Big Rivers assumes that it will have four years to design, permit, and
construct the systems necessary to meet new compliance standards. In the interim,
Big Rivers is secure that it will remain in compliance with the current rules.98
Plan Summary, Section 8-28. 95
Response to Staffs Second Data Request, Item 27. These actions will allow Big Rivers the flexibility to meet the 2012 CATR NOX allocations.
97 Plan Summary, Section 8-27.
98 Response to Staffs First Data Request, Item 15.
46

Table 4.5 contains the proposed allowances for the Big Rivers fleet.”
Resource 2012 so2 Annual NOx
Allocation (Tons) Allocation (Tons)
Coleman 1 624 1,646
Coleman 2 854 1,671
Coleman 3 1,003 1,713
Green 1 1,774 1,530
Green 2 1,352 1,505
Reid 1 1,136 734
Reid GT 1 0 0
DB Wilson 8,195 697
HMP&L Henderson 2-1 1,647 293
HMP&L Henderson 2-2 2,750 305
Table 4.5
Ozone Season NOx
Allocations (Tons) SO;! Allocation (Tons)
704 1,569
71 5 1,569
733 7,621
595 1,018
585 1,027
585 1,872
0 0
305 7,866
114 959
118 997
2014 and Beyond
Big Rivers used SIPS to also model its Environmental Compliance sensitivity
case. It used base case assumptions for all variables with the exception of a proposed
carbon reduction cost enacted in 2015. It further reduced by 1 percent the capacity at
the R.D. Green Units 1 and 2 and the K.C. Coleman Units 1, 2, and 3 so that Selective
Catalytic Reduction units (“SCRs”) could be added. loo
Generator Efficiency Improvements
Big Rivers’ objective as a generation and transmission cooperative is to provide
reliable power to its three member-owners at the lowest possible cost. In today’s
environment, it is imperative that Big Rivers operate its generation units safely and
reliably and with the highest efficiency. Each year, Big Rivers publishes a rolling four-
” Plan Summary, Section 8-27, Table 8.22.
loo - Id., Section 8, Page 8-1.
47
year production work plan which includes unit- and plant-specific operation and
maintenance strategy. The plan sets explicit benchmarks for a number of plant-specific
operations.”’
To further improve its efficiency, after closing on the Unwind, Big Rivers created
a new position - Manager of Production Service - with the primary responsibility of
developing a standardized performance improvement plan and monitoring the heat rate
of Big Rivers’ coal-fired generating plants. Big Rivers also hired Black and Veatch, an
engineering consultant firm, to measure generator performance in connection with each
planned outage to ensure that the expected performance improvement is being
achieved. In addition, Black and Veatch has been engaged to monitor and seek higher
performance for the HMP&L and Big Rivers units before and after each unforced
outage.”’ Big Rivers plans to increase its ongoing plant maintenance and inspection
process and to overhaul its entire turbine fleet during the period covered by this IRP in
order that it may maintain the highest turbine cycle effi~iency.‘”~
Coal-fired utilities rank performance and efficiency using the Equivalent Forced
Outage Rate (“EFOR”).1”4 This NERC based standard allows one utility to compare its
plants to another utility’s plants through EFOR values. To illustrate its efficiency and
reliability, Big Rivers states that its EFOR was 3.7 percent in 2009, which compares to
Response to Staffs Second Data Request, Item 1 (a).
-7 Id Item l(c).
I O 4 EFOR is the time (as a percentage) a generator is unexpectedly out of service. The more time out of service, the larger the EFOR.
48

the 6.9 percent industry average.lo5 Big Rivers can also use other common industry
standards such as Equivalent Availability Factor (i1EAF”)106 and net Capacity Factor
(“NCF ) 91 107 for comparisons with utilities and energy companies considered its peers.
Big Rivers completed a benchmarking study in 201 1, and its units performed well
above the median for all the units in the study. The performance statistics for the units
are shown in Table 4.6.Io8
Table 4.6
Performance Statistic through September 2101 0
Big Rivers Unit Peer Group
EFOR 4.37% (lower is better) EFOR 6.47%
EAF 89.02% (higher is better) EAF 86.65%
NCF 81.05% (higher is better) NCF 70.57%
The performances of Big Rivers’ generating units, based on the same measures,
from the closing of the Unwind Transaction though the end of calendar year 2010 are
shown on the following page in Table 4.7.”’
lo5 Executive Summary, ii.
The percent of time a generator is available for service.
An indicator of a generator’s energy production.
Response to Staffs Second Data Request, Item l(d).
log - Id.
49

Table 4.7
Big Rivers Generatina Units Performance Statistic
July - Dec 2009 Full Year 2010
EFOR 3.71% EFOR 3.58%
EAF 85.90% EAF 93.65%
NCF 73.74% NCF 84.02%
Big Rivers realizes that generation outage planning is important to its reliability
plan. These planned outages allow Big Rivers to pull a generating unit from service to
perform work on pre-determined specific components. Maintenance of the coal-fired
generating units is vital to this process and helps avoid forced outages which require
that a unit be removed from service unexpectedly and immediately. Big Rivers has
created a maintenance schedule for its generating units.'"
In its 2011 general rate case,"' Big Rivers informed the Commission that it had
postponed maintenance on several of its generating facilities in 2010 and 201 1 so that it
could meet loan covenants.'" It further stated that it will complete all of its deferred and
scheduled maintenance by the end of 2012 if it receives the rates it requested; but, that
if the rates received are not adequate, it will be forced to reduce scheduled outages and
the ensuing maintenan~e."~
' l o Response to Staffs Second Data Request, Item l(e).
' I ' Case No. 2011-00036, Application of Big River Electric Corporation For a General Adjustment of Rates (Ky. PSC Nov. 17, 201 1).
'I2 - Id., Exhibit 48, page 4.
'I3 Id., page 6. .___
50
Transmission
Big Rivers’ transmission system is designed to adequately supply capacity for
reliable transport of generating resources to its member cooperatives and third parties
by way of its Open Access Transmission Tariff.’I4 Big Rivers owns and operates a
transmission system containing 1,262 miles of transmission line and 80 substations.’ l5
Big Rivers is constantly looking to improve and upgrade its transmission system.
From 2005 through 2010, it placed in service 17 miles of 69kV load-serving
transmission which was necessary to connect six new delivery point substations to its
member systems. Big Rivers also reconductored approximately 27 miles of 161 kV line
and 25 miles of 69kV line that allowed the lines to carry higher current levels.’16
Big Rivers also completed transmission projects for interconnection or
import/export capability. The 345 kV “Wilson to Coleman” Extra-High Voltage line
allowed interconnection with Kentucky Utilities Company at the new Davies County EHV
substation. This transmission line addition increases Big Rivers’ capacity for off-system
sales.”7 Big Rivers does not anticipate the acceleration of any transmission projects
being constructed to meet current or anticipated EPA regulations.”’
Big Rivers recently joined the Midwest IS0 and participates as a transmission
owner in the Midwest ISO’s Midwest Transmission Expansion Plan (“MTEP”) process.
’I4 Plan Summary, Section 5-1 at 5-3.
Executive Summary, ii.
’I6 Plan Summary, Section 6 at 6-3.
‘I7 _.__ Id., Section 6-3.
’I8 Response to AG’s Data Request, Item 19.
51
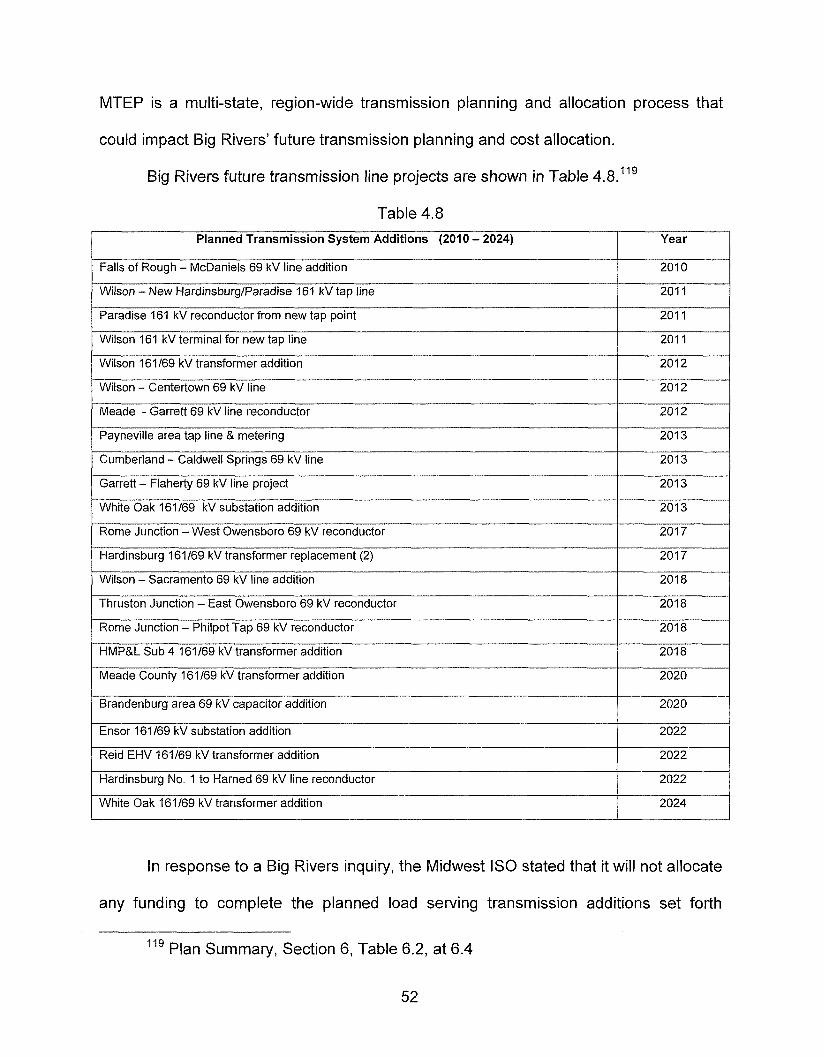
MTEP is a multi-state, region-wide transmission planning and allocation process that
Planned Transmission System Additions (201 0 - 2024)
Falls of Rough - McDaniels 69 kV line addition
could impact Big Rivers’ future transmission planning and cost allocation.
Year
201 0
Big Rivers future transmission line projects are shown in Table 4.8.”’
Wilson - New Hardinsburg/Paradise 161 kV tap line
Table 4.8
201 1
Paradise 161 kV reconductor from new tap point
Wilson 161 kV terminal for new tap line
Wilson 161169 kV transformer addition
Wilson - Centertown 69 kV line
201 1
201 1
2012
201 2
Meade - Garrett 69 kV line reconductor 2012
Payneville area tap line & metering 2 0 1 3
Cumberland - Caldwell Springs 69 kV line
Garrett - Flaherty 69 kV line project
201 3
201 3
White Oak 161/69 kV substation addition
Rome Junction - West Owensboro 69 kV reconductor
Hardinsburg 161/69 kV transformer replacement (2)
Wilson - Sacramento 69 kV line addition
Thruston Junction - East Owensboro 69 kV reconductor
Rome Junction - Philpot Tap 69 kV reconductor
201 3
2017
201 7
2018
201 8
201 8
HMP&L Sub 4 161/69 kV transformer addition
Meade County 161/69 kV transformer addition
201 8
2020
In response to a Big Rivers inquiry, the Midwest IS0 stated that it will not allocate
any funding to complete the planned load serving transmission additions set forth
Brandenburg area 69 kV capacitor addition
”’ Plan Summary, Section 6, Table 6.2, at 6.4
52
2020
Ensor 161169 kV SlJbStatiOn addition
Reid EHV 161/69 kV transformer addition
Hardinsburg No. 1 to Harned 69 kV line reconductor
White Oak 161/69 kV transformer addition
2022
2022
2022
2024
above.’*” MTEP has specific guidelines and criteria for transmission selected for cost
allocation and most of the above projects are required for native load serving functions.
Distribution Svstem
Big Rivers is a Generation and Transmission Cooperative providing energy to
three distribution cooperatives, owning no distribution facilities.
Discussion of Reasonableness
The Staff considers Big Rivers’ supply-side resource assessment reasonable
considering the fact that during the 15-year period covered by this IRP, Big Rivers can
maintain a 12 percent reserve margin without additional supply-side resources. There
are, however, several issues that the Staff finds Big Rivers should address in greater
detail in its next IRP. The Staff recommendations are set forth below:
RECOMMENDATIONS
_I_ Reserve Marqin
Staff recommends that Big Rivers perform a utility-specific reserve margin study.
As Big Rivers notes in response to a Staff information request, it has not performed a
reserve margin study in the past 10 years. With two direct-serve customers that
account for 69 percent of its power sales, Big Rivers is unique among Kentucky’s
jurisdictional generators. In addition, Big Rivers has undergone several significant
changes since 2009. It has completed the unwind transaction, which returned 1,444
MW of generation to Big Rivers’ control. In addition, pursuant to the Commission’s
authorization, Big Rivers has joined the Midwest ISO, which now controls the dispatch
of Big Rivers’ generating units. The Midwest IS0 also requires that Big Rivers maintain
12” Response to AG’s Data Request, Item 18.
53
a reserve margin (currently 4.5 percent) that differs somewhat from the traditional
reserve margin used for Kentucky planning purposes (currently 14 percent) with which
the Staff is familiar. Therefore, even though Big Rivers has demonstrated that it can
maintain a 12 percent reserve margin throughout the period of this IRP, Staff believes
that it is important that Big Rivers pedorm a utility-specific reserve margin study.
Renewable Generation and Distributed Generation
Big Rivers should continue to include consideration of renewable generation in its
modeling and provide an in-depth discussion of its consideration of renewable power in
its next IRP. Big Rivers should also consider and discuss the consideration given to
distributed generation in the resource plan.
Generation Efficiency
Section 8(2) of 807 KAR 5058 requires the utilities to describe and discuss all
options considered for inclusion in the plan, including improvements to and more
efficient utilization of existing utility generation, transmission and distribution facilities. In
addition, the Commission, in its August 25, 2009 Order in Administrative Case No.
2007-00300, specifically notes this requirement and directed the ". . . jurisdictional
generators to focus greater research into cost-effective generation efficiency initiatives
and to include a full, detailed discussion of such efforts in subsequent IRPs in
accord an ce with Section 8 (2) (a) I "I 21
Big Rivers did not initially provide the required discussion and, for all practical
purposes, it failed to comply with the requirement of the IRP regulation and the specific
12' Case No. 2007-00300, Consideration of the Requirements of the Federal Energy Policy Act of 2005 Regarding Fuel Sources and Fossil Fuel Generation Efficiency, (Ky. PSC Aug. 25, 2009) at 23.
54

directive of the Commission in Administrative Case No. 2007-00300. The brief general
discussion summarized earlier in this report was only provided in response to questions
in Staffs Second Information Request.
Big Rivers, in its response, generally explained that it had created a new
manager position with the primary responsibility of addressing generation performance
improvement and monitoring heat rate, had employed an engineering consultant to
assist in monitoring performance, had reviewed a third-party benchmarking study,
referenced its performance statistics, and developed maintenance schedules for its
generating units. It did not, however, provide any detailed discussion of work
undertaken or the actual improvement for any of its generating units.
Given Big Rivers’ statement in the Unwind case regarding unit efficiency and
performance, Staff is concerned that Big Rivers has deferred some maintenance in both
2010 and 2011. The fact that Big Rivers recognized that the deferral may have a
negative impact on generation reliability but failed to divulge this information in its IRP
raises the concern of the Staff to a much higher degree.
In its next IRP, Big Rivers should provide a detailed discussion of the specific
generation efficiency improvement activities it has undertaken. The absence of such a
discussion could potentially result in Big Rivers’ next IRP being found not in compliance
with the Commission’s IRP regulation.
Com p I iance Planning
Section 8(5)(f) of 807 KAR 5:058 requires the utilities to include a description and
discussion of actions to be undertaken during the fifteen (15) years covered by the plan
to meet the requirements of the Clean Air Act amendments of 1990, and how these
55

actions affect the utility's resource assessment. The EPA has proposed new
regulations which, as previously stated, Big Rivers did not specifically address in this
IRP. However, even though Big Rivers has not developed a final compliance strategy,
as Staff notes in the Compliance Planning Section, Big Rivers has given preliminary
consideration to the impact of the new regulations.
In a March 30, 201 1 letter, following Big Rivers' October 2010 presentation of the
potential impact of the new regulations, the Commission's Executive Director expressed
the need to continue discussion of related issues.'22 In a response dated April 14,
201 I , Big Rivers stated that it did not plan to construct new generation as a result of the
proposed regulations but that modifications to existing environmental permits may be
needed depending upon the final regulations. In addition, Big Rivers noted that it
intended to engage an outside firm to review its existing control equipment, and to
develop a comprehensive list of options and a plan to achieve compliance with the
currently proposed reg~1ations.l~~
As with any significant action or expenditure, the Staff recognizes the need to
take a reasoned approach to address the proposed regulations. The Staff notes that
Big Rivers is approaching compliance planning cautiously because all regulations are
not yet final and because of the financial impact of any actions Big Rivers may take.
However, we believe a balance must be struck between being cautious and being
122 Letter of Executive Director to Mark Bailey, President and CEO, Big Rivers, March 30, 201 1.
123 Letter of Mark Bailey to Jeff DeRouen, Executive Director, Kentucky Public Service Commission, April 14, 201 1.
56

proactive; if it is overly cautious, Big Rivers may not have the ability to consider all
options and develop the most cost-effective compliance strategy.
Staff believes that Big Rivers’ decision to employ an outside firm to provide
expertise in developing a compliance strategy is appropriate. Staff does, however, have
concerns regarding compliance planning that relate to the timeliness of Big Rivers’
planning decisions and the comprehensive nature of its planning.
As stated earlier in this report, Big Rivers is waiting for final EPA rules before
making a number of planning decisions. As it states, if the CATR rules are put into
place as proposed, Big Rivers assumes that it will have four years to comply. However,
if the EPA remains firm with the short timeframe to comply with MACT rules, the need
for rapid deployment will escalate the construction cost. Therefore, as stated above,
Staff believes it is appropriate that Big Rivers balance caution with the need to move
more expeditiously to preserve the broadest menu of options to address its compliance.
Staff also takes this opportunity to reinforce the Commission’s expectation that
‘I. I . environmental planning be performed on a comprehensive basis, taking into
account not only existing and pending regulations, but also those reasonably anticipated
to be enacted. Comprehensive planning is absolutely essential to ensure that
compliance measures proposed to be implemented in the near and mid term will not be
rendered ineffective and useless long before they reach the end of their useful lives.
Only by demonstrating this degree of comprehensive planning can the Commission
57

perform its statutory duties to determine that new facilities are needed and that rates are
fair, just, and rea~onable. ” ’~~
A complete discussion of Big Rivers’ compliance actions and plans relating to
current and pending environmental regulations should be included in its next IRP.
124 Letter of Executive Director to Mark Bailey, President and CEO, March 30, 201 1.
58

SECTION 5
INTEGRATION AND PLAN OPTlMlZATlON
The final step in the IRP process is the integration of supply-side and demand-
side options to achieve an optimal resource plan. This section discusses the integration
process and the resulting Big Rivers plan.
PLANNING GOALS AND OBJECTIVES
Big Rivers’ stated that the primary planning goal in its 2011 IRP was to reliably
provide for its customers’ electricity needs over the 15-year planning horizon with an
appropriate mix of supply-side and demand-side resources at the lowest reasonable
cost.
0
0
0
0
0
0
0
0
To meet its goal, Big Rivers established the following planning objectives:
Maintain a current and reliable load forecast
Consider expanding its DSM programs
Identify potential new supply-side resources and DSM programs
Provide competitively priced power to its members
Maintain adequate planning reserve margins
Maximize reliability while minimizing costs, risks and environmental impacts
Meet NERC guidelines and requirements
Provide assistance to its member cooperatives regarding new technologies,
mapping and planning, safety training and programs, economic development,
and customer support
__. THE INTEGRATION PROCESS
A resource assessment and acquisition plan was developed based on minimizing
expected costs over the 201 1-2025 planning horizon. For modeling purposes, Big
Rivers used the Strategist Integrated Planning System, which provides the ability to
compare combinations of potential resource additions in order to determine the portfolio
59

necessary to achieve the planning reserve margin criteria at the lowest cost.125 Big
Rivers’ existing generating resources, which were modeled using the Strategist GAF
module, were dispatched against its 2010 load and energy forecast.126 Changes in a
number of variables were addressed by conducting the production simulation and
expansion planning analysis for a Base Case and several sensitivity cases.
Base Case and Sensitivitv Cases
The Base Case included: the base load and energy forecast; new DSM
programs included in the $1 million energy efficiency plan; base fuel price projections;
and base market price projections. Big Rivers also developed the following sensitivity
cases:
1. High fuel price case - uses base case assumptions except for a 20 percent
increase in fuel prices and market prices.
2. High load case - uses base case assumptions except for a high load and
energy requirements forecast.
3. Renewable portfolio case - uses base case assumptions except for:
a) RPS requirements of:
1) 15 percent of total energy from renewable resources by 201 5.
2) 20 percent of total energy from renewable resources by 2020.
3) 25 percent of total energy from renewable resources by 2025.
Specific renewable resources as sources of energy:
1) 80 percent of RPS energy generated by wind projects.
2) 15 percent of RPS energy generated by biomass projects.
3) 5 percent of RPS energy generated by photovoltaic projects.
b)
125 As discussed in the Supply-side section of this report, relying on the 15 percent target reserve margin contained in NERC’s 2009 Long-Term Reliability Assessment, Big Rivers used a 14 percent minimum acceptable reserve margin for modeling purposes.
126 As discussed in the Load Forecast section of this report, for the 2008-2023 planning horizon, Big Rivers forecasts its energy and peak demand requirements to increase at annual growth rates of 0.4 percent and 0.5 percent, respectively.
60
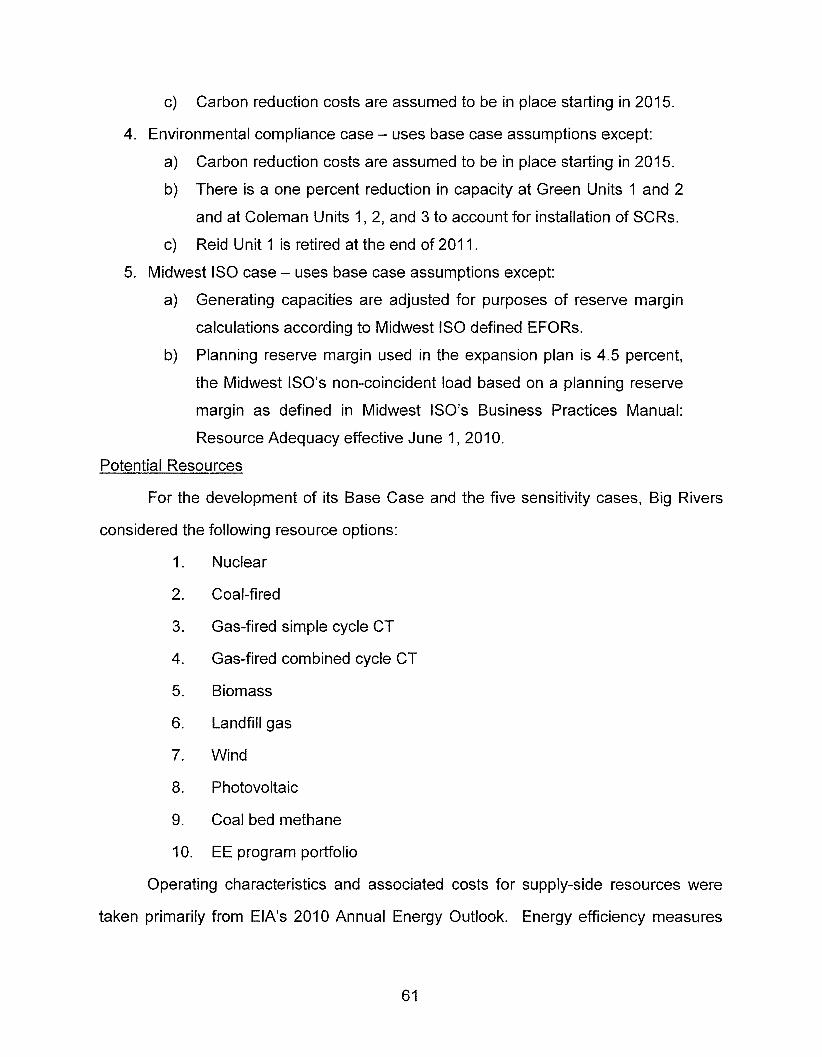
c) Carbon reduction costs are assumed to be in place starting in 2015.
4. Environmental compliance case - uses base case assumptions except:
a) Carbon reduction costs are assumed to be in place starting in 2015.
b) There is a one percent reduction in capacity at Green Units 1 and 2
and at Coleman Units 1, 2, and 3 to account for installation of SCRs.
Reid Unit 1 is retired at the end of 201 1. c) 5. Midwest IS0 case - uses base case assumptions except:
a) Generating capacities are adjusted for purposes of reserve margin
calculations according to Midwest IS0 defined EFORs.
Planning reserve margin used in the expansion plan is 4.5 percent,
the Midwest ISO’s non-coincident load based on a planning reserve
margin as defined in Midwest ISO’s Business Practices Manual:
Resource Adequacy effective June 1,201 0.
b)
Potential Resources
For the development of its Base Case and the five sensitivity cases, Big Rivers
considered the following resource options:
1.
2.
3.
4.
5.
6.
7.
8.
9.
I O .
Nuclear
Coal-fired
Gas-fired simple cycle CT
Gas-fired combined cycle CT
Biomass
Landfill gas
Wind
Photovoltaic
Coal bed methane
EE program portfolio
Operating characteristics and associated costs for supply-side resources were
taken primarily from EIA’s 201 0 Annual Energy Outlook. Energy efficiency measures
61

were screened using GDS’s BenefitKOst Screening Model, an analysis tool designed to
evaluate costs, benefits, and risks of DSM programs and services. Measures were
restricted to those that are currently commercially available.
Base Case and Sensitivitv Case Results
Big Rivers’ Base Case optimal expansion plan includes the addition of a 50 MW
CT in 2022, which is necessary in order to maintain a 14 percent planning reserve
margin. The high fuel and Midwest IS0 cases’ resulting plans also include a 50 MW CT
late in the 15-year planning horizon period. The high load and environmental cases
have between 50 and 65 MW of capacity added in the first three years of the planning
period with 50 MW of capacity also added 10 years into the planning period. The RPS
case calls for the addition of more than 1,000 MW of renewable resources in blocks that
correspond with the years 2015, 2020 and 2025 shown in the assumptions for the case.
Overall, all cases except the RPS case include a 50 MW CT as a resource addition.
Overall Integration
With a 2010 planning reserve margin in excess of 18 percent and with low growth
forecast for peak demand, at this time, Big Rivers has little need for new DSM programs
from a capacity perspective. As its new DSM programs are being started as small-scale
pilots, it was not necessary that Big Rivers perform a Net Present Value analysis of its
optimal expansion plan to determine whether the plan was lower cost with or without the
new DSM programs included. In that sense, Big Rivers’ optimal plan does not reflect
the integration of supply-side and demand-side resources, based on producing the
lowest cost plan, which it typically performed within the IRP process.
62

DISCUSSION OF REASONABLENESS
There were no recommendations regarding integration issues in Staffs report on
Big Rivers’ 2002 IRP. Accordingly, this report contains no discussion of the response
thereto by Big Rivers.
-- RECOMMENDATIONS
While Staff is generally satisfied with Big Rivers’ IRP and the information
contained therein, it believes there are a number of areas in which Big Rivers can make
improvements in future IRP filings. Those improvements, which are in addition to the
improvements recommended in Sections 2, 3, and 4 of this report, are as follows:
o Big Rivers’ next IRP should include a more comprehensive assessment of
alternative resources considered and environmental compliance strategies.
o Big Rivers should be more proactive in considering potential environmental
regulations and more explicitly addressing them in future IRP filings.
In future IRPs, Big Rivers should develop an optimal expansion plan based
on the integration of supply-side and demand-side resources to produce
the lowest cost plan.
o
63


![005014916 00443€¦ · FLOOD Laurence [397] 1 July Administration of the Estate of Laurence Flood late of Mayfield Kilmeao.ue Naas County Kildare Farmer who died 16 January 1910](https://static.fdocuments.us/doc/165x107/5f1fb5ac31df1a6f46661c0a/005014916-flood-laurence-397-1-july-administration-of-the-estate-of-laurence-flood.jpg)


![Florida Star. (Titusville, Florida) 1901-01-18 [p ].ufdcimages.uflib.ufl.edu/UF/00/07/59/01/00455/00443.pdf · 2009. 4. 23. · Crosby cottages necessary Election Sunday Sunday bearing](https://static.fdocuments.us/doc/165x107/6112aa58d7b041743d7c03df/florida-star-titusville-florida-1901-01-18-p-2009-4-23-crosby-cottages.jpg)