Juvenile Salmonids in the Duwamish Estuary, · PDF fileJUVENILE SALMONIDS IN THE DUWAMISH...
50
-. 14 Distribution and Food Habits of , Juvenile Salmonids in the Duwamish Estuary, Washington, 1980 United States Department of the Interior U. S. Fish and Wildlife Service \ Fisheries Assistance Office Olympia, Washington IJt~t'4 11 ov' )C , __-- , a Ir 0 _
Transcript of Juvenile Salmonids in the Duwamish Estuary, · PDF fileJUVENILE SALMONIDS IN THE DUWAMISH...

-. 14
Distribution and Food Habits of, Juvenile Salmonids in the Duwamish Estuary,
Washington, 1980
United States Department of the Interior
U. S. Fish and Wildlife Service \Fisheries Assistance Office
Olympia, Washington
IJt~t'4 11 ov' )C
, __-- ,
a Ir
0 _
I7
SECURITY CLASSIFICATION OF THIS5 PAGE (WMan Dae Bilterid _________________
REPOR DOCMENTAION AGEEAD INSTRUCTIONSREPOT DO MENTTIONPAGEBEFORE COMPLETING FORM1. REPONT NUMBER {GOVT CCE5SI*N NO. 3. RECIPIENIT'S CATALOG NUMBER
4. TITLE (ad ab4*i) S. TYPE OF REPORT & PERI0O COVERED
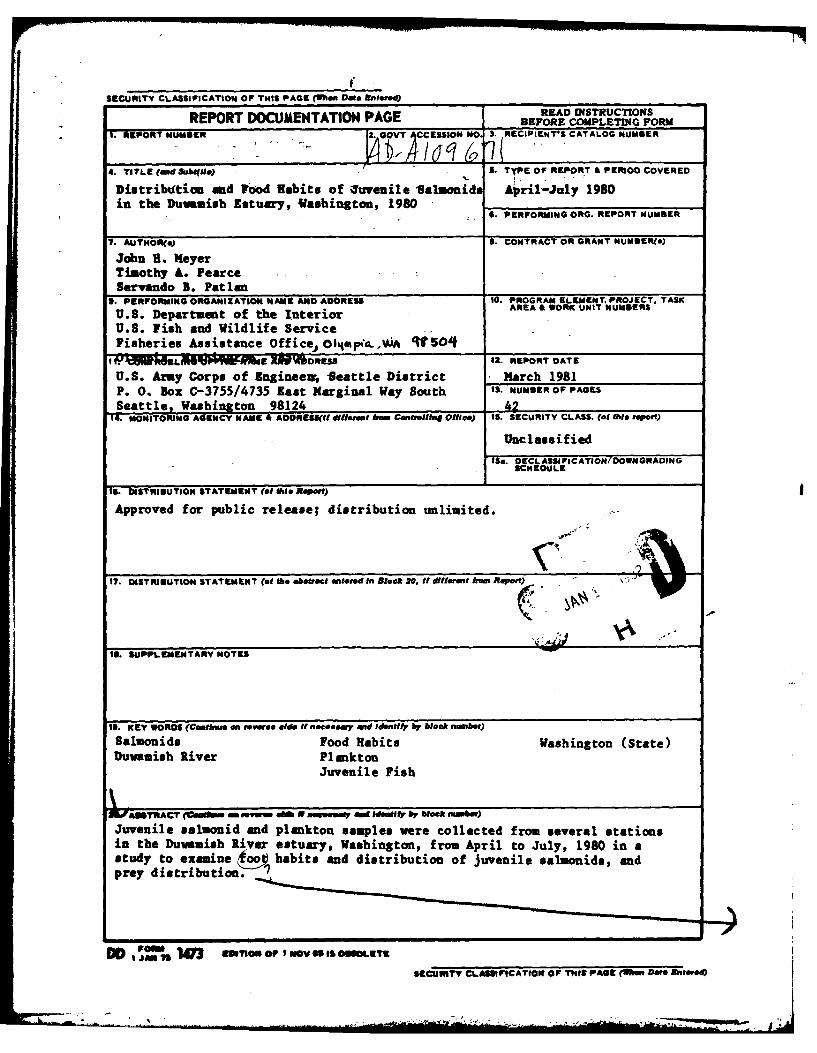
Distribudtion and Food Habits of Iuvenile S3aluoids Ajiril-July 1980in the Dumamish Estuary, Washington, 1980 ____
S. PERFORMING ORG. REPORT NUMBER
7. AUTOR~s)S. CONTRACT OR GRANT NUMUER(s)
9. PERFORMING ORGANIZATION NAME AND ^DORES" 10. PROGRAM ELEMENT. PROJECT, TASK
U.S. Department of the Interior AREAS WORK UNIT NUMBERS
U.S. Fish and Wildlife ServiceFisheries Assistance Office, 01oi, if W5014
I JWfL1GI W XMW60RESS 42. REPORT DATE
U.S. Army Corps of Enginee,Seattle District March 1981P. 0. Box C-3755/4735 East Marginal Way South IS. NUMBER OF PAGES
Seattle, Washington 98124 42IT.- 'MONITORING AGENCY NAME 4 AOURESS(U differet bass C'drellh6a Officip) Is- SECURITY CLASS. (oi adsl report)
Unclassified
1S.. OECL ASSI lC ATION/ DOWNGRADINGSCHEDULE
IS. DISTRIBUTION STATEMENT (of this Rhpmt)
Approved for public release; distribution unlimited.
17. DISTRIBUTION STATEMENT (of thme abstract eteed In Block I0 t drffreut from RQPWQt
18. SUPPLEMENTARY NOTES
19. KEY WORDS (Cofnha n reverse side IH necessary md Idenly~ byf block combor)
Saluonids Food Habits Washington (State)Duvamish River Plankton
Juvenile Fish
X&WAWRACr (Clotho mu es oM nweesey an ~d~fy by block nmber)
Juvenile salmonid and plankton samples were collected from several stationsin the Duwamish River estuary, Washington, from April to July, 1980 in astudy to examine oo habits and distribution of juvenile salmonids, andprey distribution.
DO , 13 m-n@* or s nov a is OBSOLETE
SECURITY CLASSIFICATION OF TIS PAGE (liken D-0a Entered

SEOUNTYV Q.ASUSCA?)IC OF Tugs PA555MM Do" 011MN
Chinook (Oncorhyunchus tshamytcha), chum (0. keta) and coho salmon (0.kisutch) and steslhead (Salmo ipirdneri) and cutthroat trout (S. clarki) arethe salmonid species which ye found present in the Duwamish estuary.Juvenile sabmmiidb -octurred in greatest numbers from aid-April to ear!yJfie. Chun were oriented toward shoreline areas while other speciesutilized near and offshore areas. Chinook tended to move inshore at night,although they tended to move offshore with increasing size. Few cutthroatwere encountered.
Much of the salmon diets were composed of dipteran insects (particularlyChironomidae) and gamarid amphipods (particularly Corophium salmonis, C.spinicorne and logamarus confervicolus). Calanoid and harpacticoidcopepods were important to some salmon. Steelhead trout diets consistedlargely of the mysid Neomysis mercedis. In general, epibenthic crustaceanswere consumed more at nighttime in the nearshore estuary zone by smallersized predators in the earlier months of the study. Pelagic crustaceans andinsects were consUmed more during the daytime, otfshore by larger predatorsin later months. Predation of juvenile fish occurred primarily during theday, near shore by larger sized predator;(1
Ipibenthic plankton organisms which are imlortant in salmonid diets wereabundant in areas of sand and silt and among gradually sloping riprap whichcontains much sand and gravel. The pelagic zone and an area of steeplysloping riprap shaded from direct sunlight by a concrete apron had loverabundances of organisms important in salmonid diets.
secuRIrY CLASIFICATION OF THIS PAGt(S.e, Dae Bnt*,.0

UNITED STATES DEPARTMENT OF THE INTERIORFisheries Assistance Office
U. S.' Fish and Wildlife Service
,-Olympia, Washington
DISTRIBUTION AND FOOD HABITS OF
JUVENILE SALMONIDS IN THE DUWAMISH ESTUARY
WASHINGTON, 1980
March 1981
Prepared for
Seattle District
U. S. Army Corps of Engineers
by
John H. Meyer .0Fishery Management Biologist
Timothy A. PearceBiological Technician
Servando B. Patlan
Im

ACKNOWLEDGMENTS
Completion of this study resulted from the efforts of the entire OlympiaFisheries Assistance Office staff. Special thanks are extended to RichardComstock who provided invaluable counsel on study design and statisticaland computer analyses. The following staff members assembled and designedequipment and spent long hours in the field: Steve Hager, Steve Dilley,Phil Wampler, Charles Hamstreet, Alton Chung and Dori Cahn. Michelle
:* LaGory and Chris Gurnard designed the report cover and prepared graphics,* respectively.
We would also like to acknowledge the contribution of Charles Simenstadof the University of Washington, Fisheries Research Institute. We areespecially grateful for his assistance in the use of several computerprograms which he and others developed for use in analyzing fish foodhabits.
The fish stomachs and plankton samples were analyzed primarily by CascadiaResearch Collective in Olympia, to whom we are grateful.
Thanks are also extended to Gloria Maender who did her usual fine work onmaps and figures.
Finally, we want to express our appreciation to who expendedconsiderable effort in typing this report to our standards.
Acesion ForNTIS C.A&I
Ell
cr-ISPL( ,
I ., / olv aA
ABSTRACT
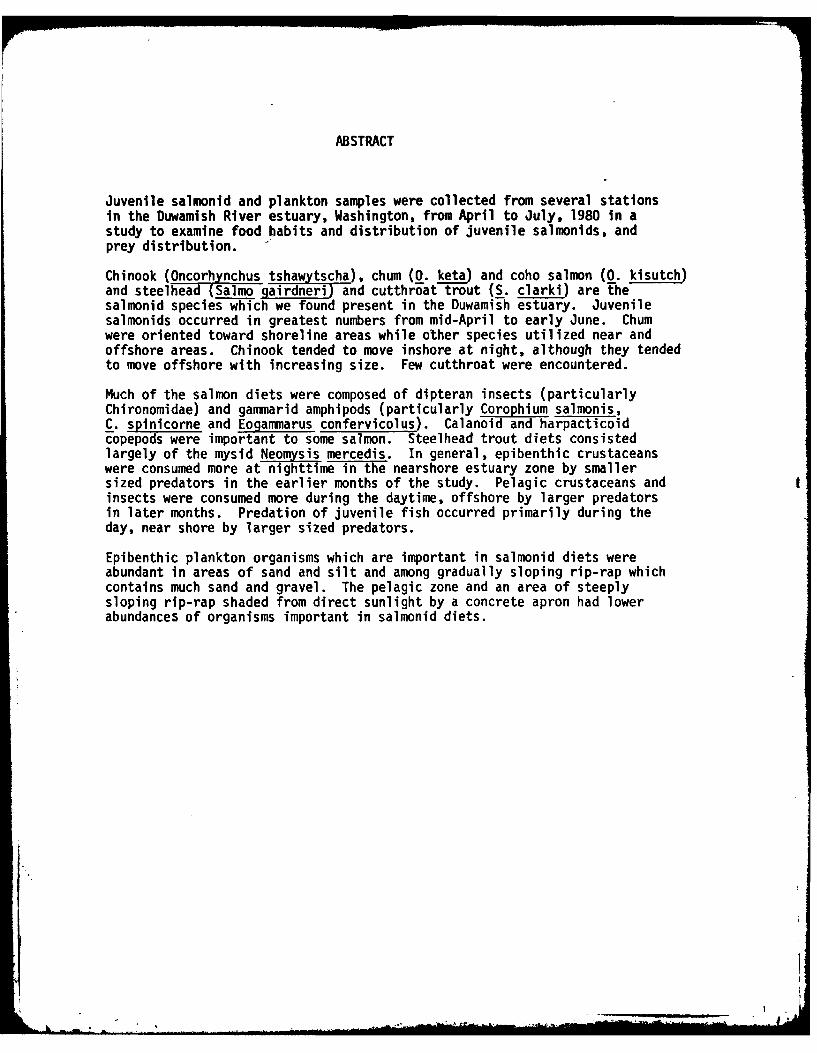
Juvenile salmonid and plankton samples were collected from several stationsin the Duwamish River estuary, Washington, from April to July, 1980 in astudy to examine food habits and distribution of juvenile salmonids, andprey distribution.
Chinook (Oncorhynchus tshawytscha), chum (0. keta) and coho salmon (0. kisutch)and steelhead (Salmo gairdneri) and cutthroat trout (S. clarki) are thesalmonid species which we found present in the Duwamish estuary. Juvenilesalmonids occurred in greatest numbers from mid-April to early June. Chumwere oriented toward shoreline areas while other species utilized near andoffshore areas. Chinook tended to move inshore at night, although they tendedto move offshore with increasing size. Few cutthroat were encountered.
Much of the salmon diets were composed of dipteran insects (particularlyChironomidae) and gammarid amphipods (particularly Corophium salmonis,C. spinicorne and Eogammarus confervicolus). Calanold and harpacticoidcopepods were important to some salmon. Steelhead trout diets consistedlargely of the mysid Neomysis mercedis. In general, epibenthic crustaceanswere consumed more at nighttime in the nearshore estuary zone by smallersized predators in the earlier months of the study. Pelagic crustaceans andinsects were consumed more during the daytime, offshore by larger predatorsin later months. Predation of juvenile fish occurred primarily during theday, near shore by larger sized predators.
Epibenthic plankton organisms which are important in salmonid diets wereabundant in areas of sand and silt and among gradually sloping rip-rap whichcontains much sand and gravel. The pelagic zone and an area of steeplysloping rip-rap shaded from direct sunlight by a concrete apron had lowerabundances of organisms important in salmonid diets.
_________

TABLE OF CONTENTS
E g
ABSTRACT................. . . ... . .... .. .. .. .. . ...
INTRODUCTION............. . ... .. .. .. .. .. ... 1
METHOD AND MATERIALS ................... 3
RESULTS AND DISCUSSION. .... ........ ........ )
Fish Distribution .. ....... ............ 11
Food Habits .. ....... ........ ...... 23
Chinook. .. ...... ......... ..... 23
Coho .. ...... ......... ....... 26
Chum . . . . . . . . . . . 2L
Steelhead .. .. ..... ..... ..... .. 30
Prey Availability. ... ......... ....... 32
SUMMARY AND CONCLUSIONS .. ... ........ ....... 35
Fish Distribution. ... ........ ........ 35
Food Habits .. .. ...... ........ ...... 36
Prey Availability. ... ........ ......... 36
LITERATURE CITED .. ...... ........ ....... 38
APPENDIX. ... ......... ........ ...... 40

LIST OF FIGURES
Fj iure...No.. Pa e
I Lower Duwamish River study area and sampling
stations ........ .......................... 4
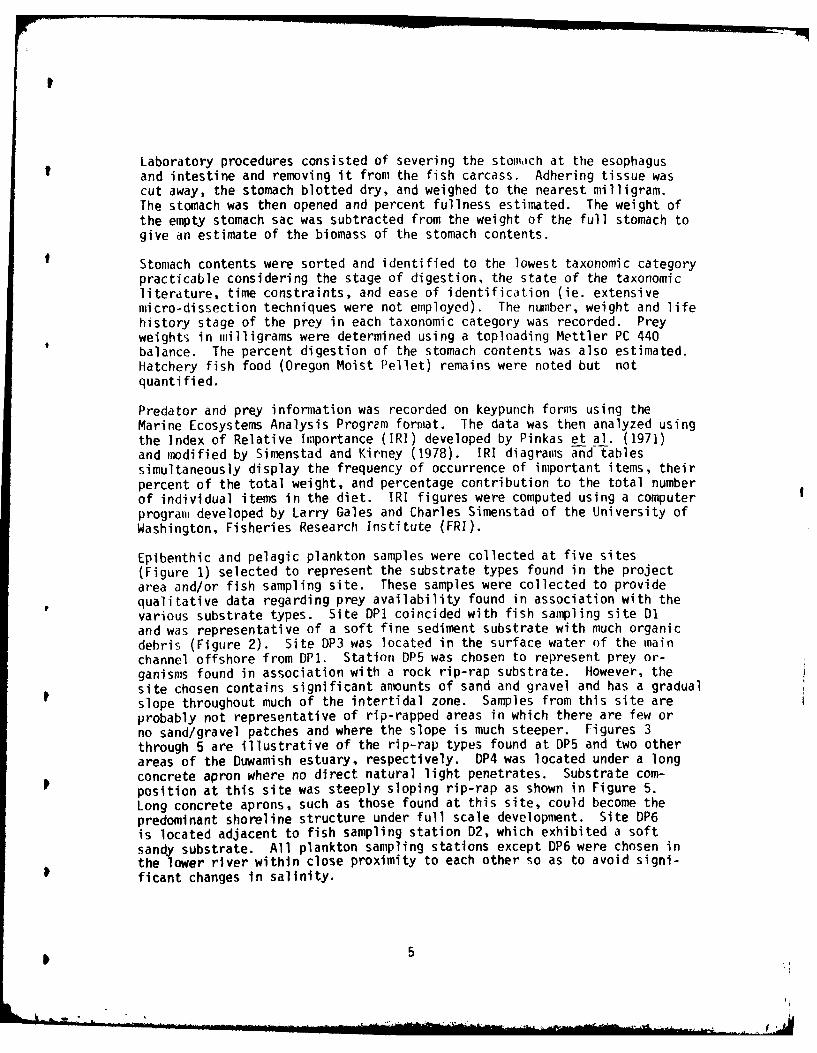
2 Substrate typical of plankton pump sample site DPI . 6
3 Plankton pump sample site [P5 ...... ............. 7
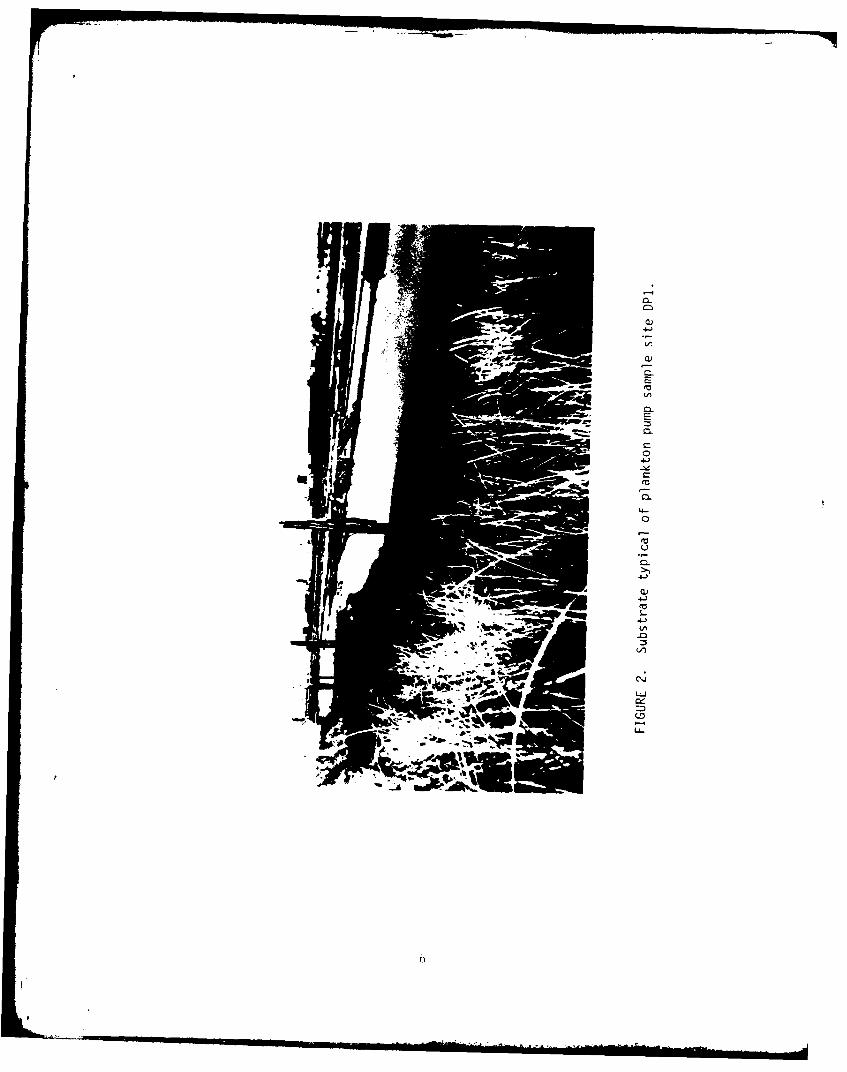
4 Rip-rap typical of much of the Duwamish estuary. ..
5 Rip-rap similar to that found at plankton pump sample
site DP4 ........ .......................... 9
6 Mean weekl.y catch of juvenile chum per beach seineset in the lower Duwamish River during April - July,1980 .......... ......................... 13
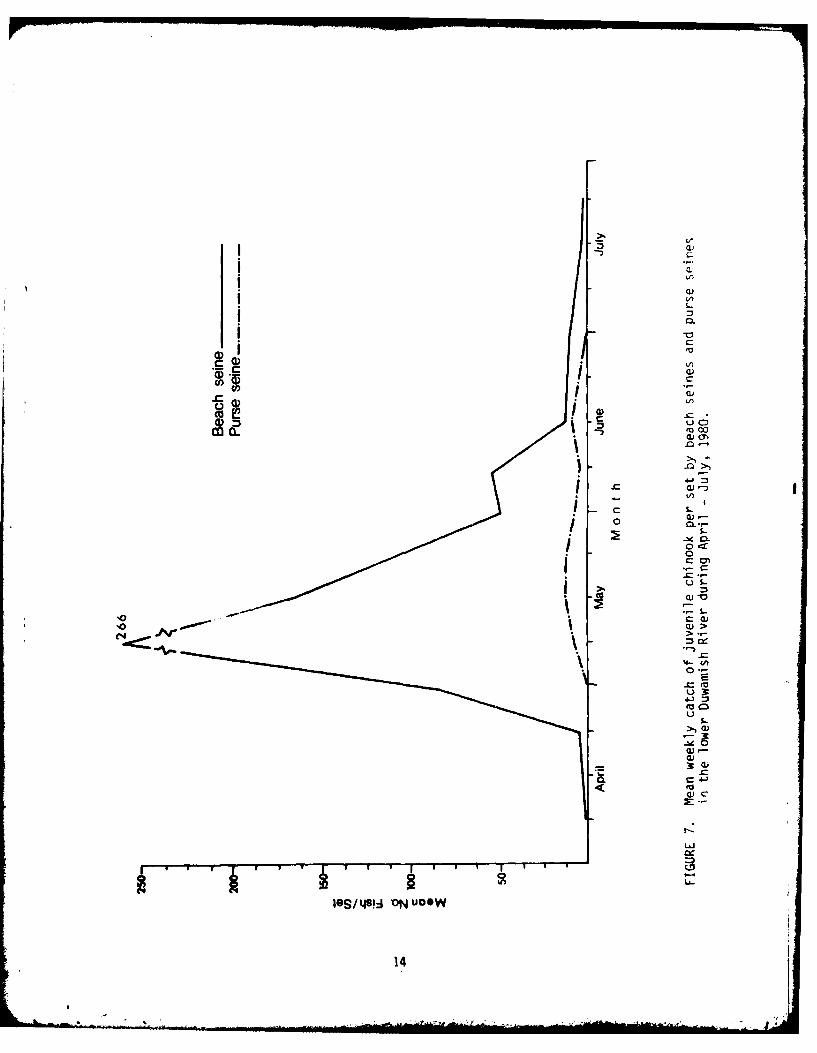
7 Mean weekly catch of juvenile chinook per set by beachseines and purse seines in the lower Duwamish Riverduring April - July, 1980 .... ............... .. 14
8 Mean weekly catch of juvenile coho per set by beachseines and purse seines in the lower Duwamish Riverduring April - July, 1980 .... ............... .. 15
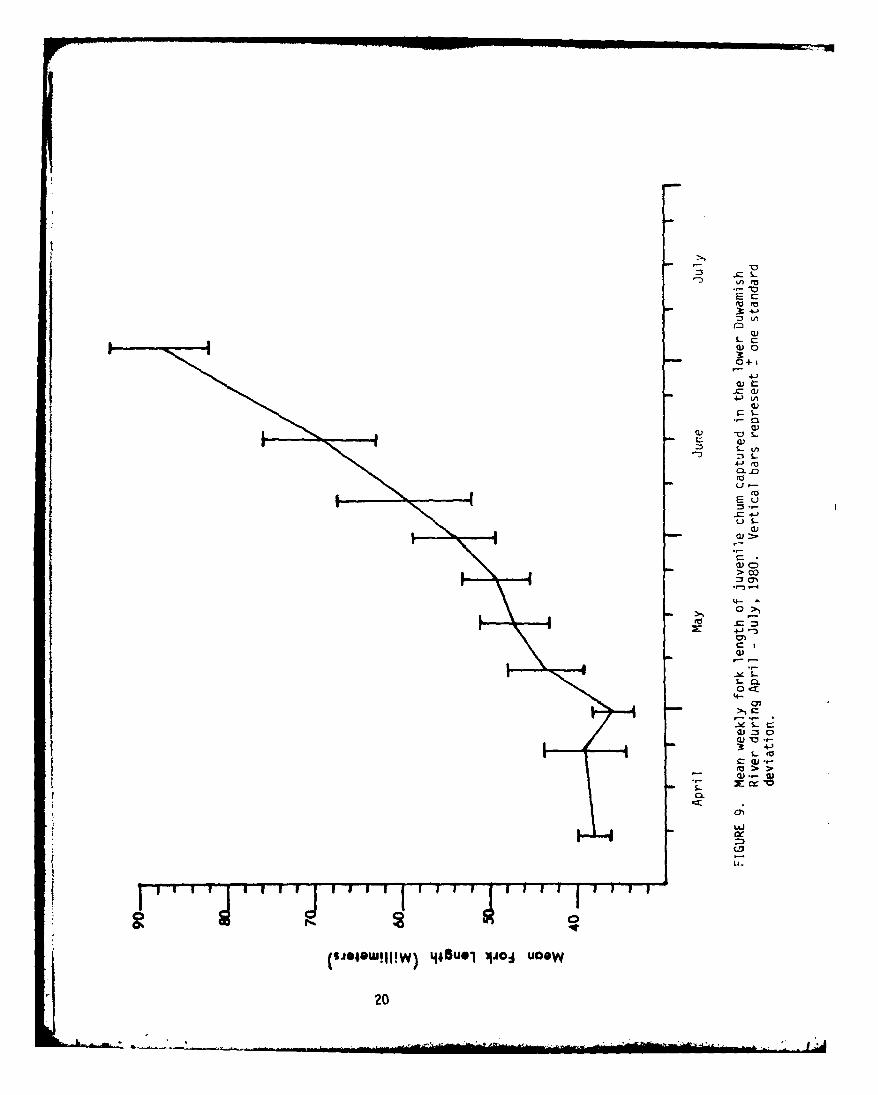
9 Mean weekly fork length of juvenile chum captured inthe lower Duwamish River during April - July, 1980 . . 2(
10 Mean weekly fork length of juvenile chinook capturedin the lower Duwamish River during April - July, 1980. 21
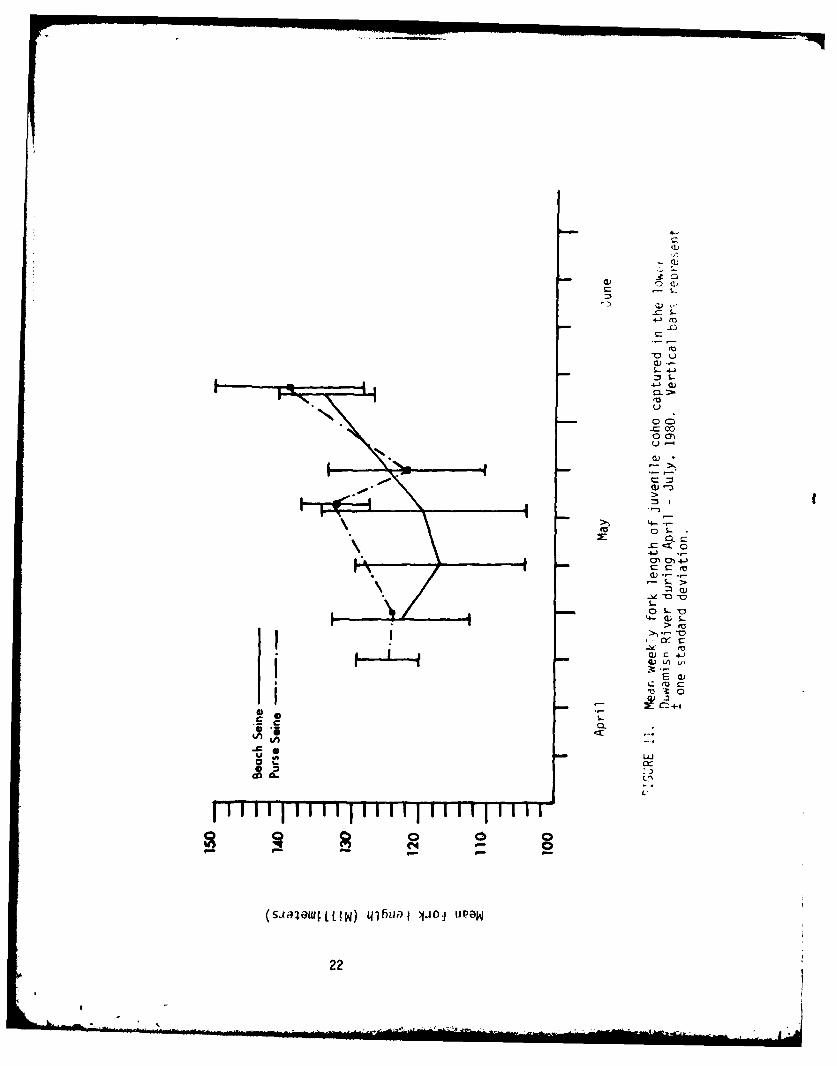
1i Mean weekly fork length of juvenile coho captured inthe lower Duwamish River during April - July, 1980 . . 22
12 IRI diagram and table showing major prey of juvenilechinook in the lower Duwamish River, April - July,1980 ........ ......................... ... 24
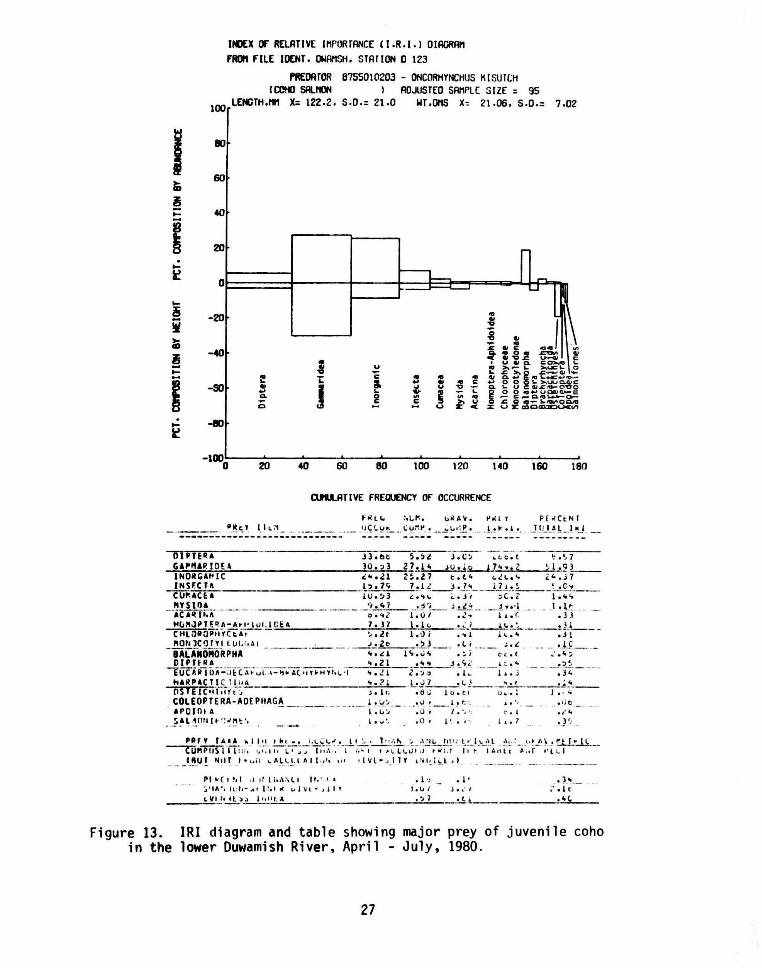
13 IRI diagram and t ble showing major prey of juvenilecoho in the lower Duwamish River, April July, 1980 . 27
14 IRI diagram and table showing major prey of juvenilechum in the lower Duwamish River, April - July, 1980 . 29
15 IRI diagram and table showing major prey of juvenilesteelhead in the lower Duwamish River, April - July,1980 ........ ......................... ... 31
iv
LIST OF TABLES
Table No. Page
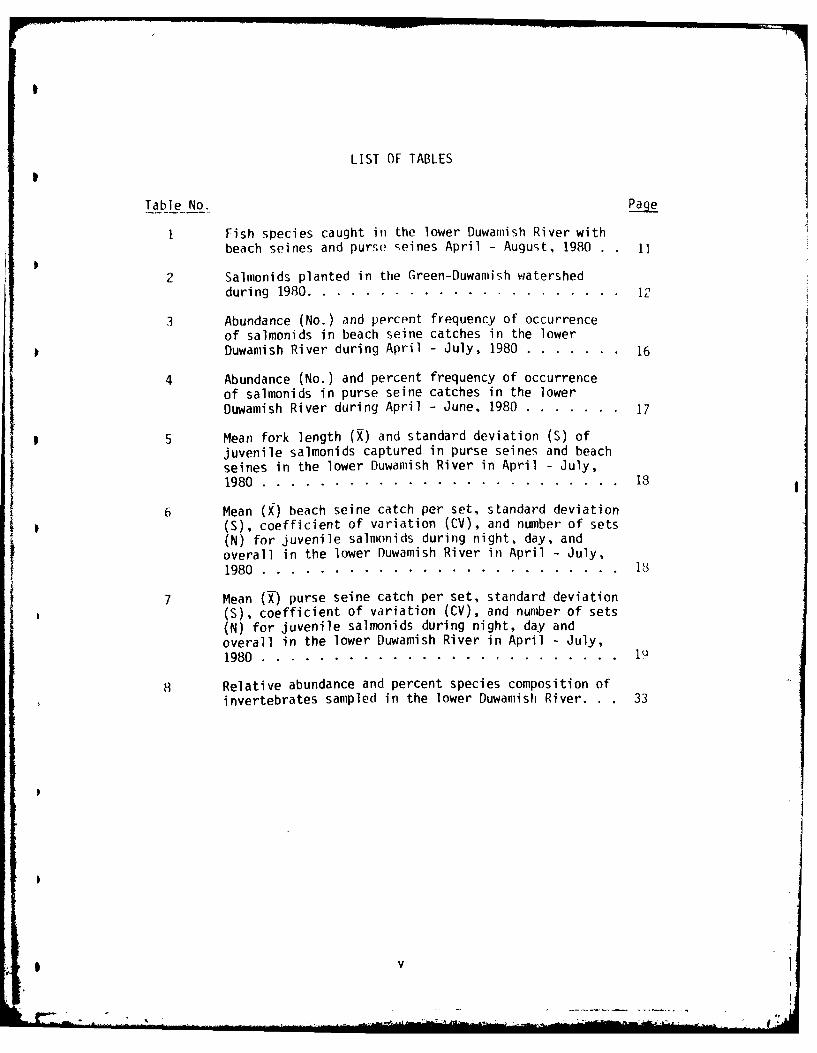
1 Fish species caught in the lower Duwamish River with
beach seines and purse ,eines April - August, 1980 . .
2 Salmonids planted in the Green-Duwamish watershedduring 1980 ......... ...................... 12
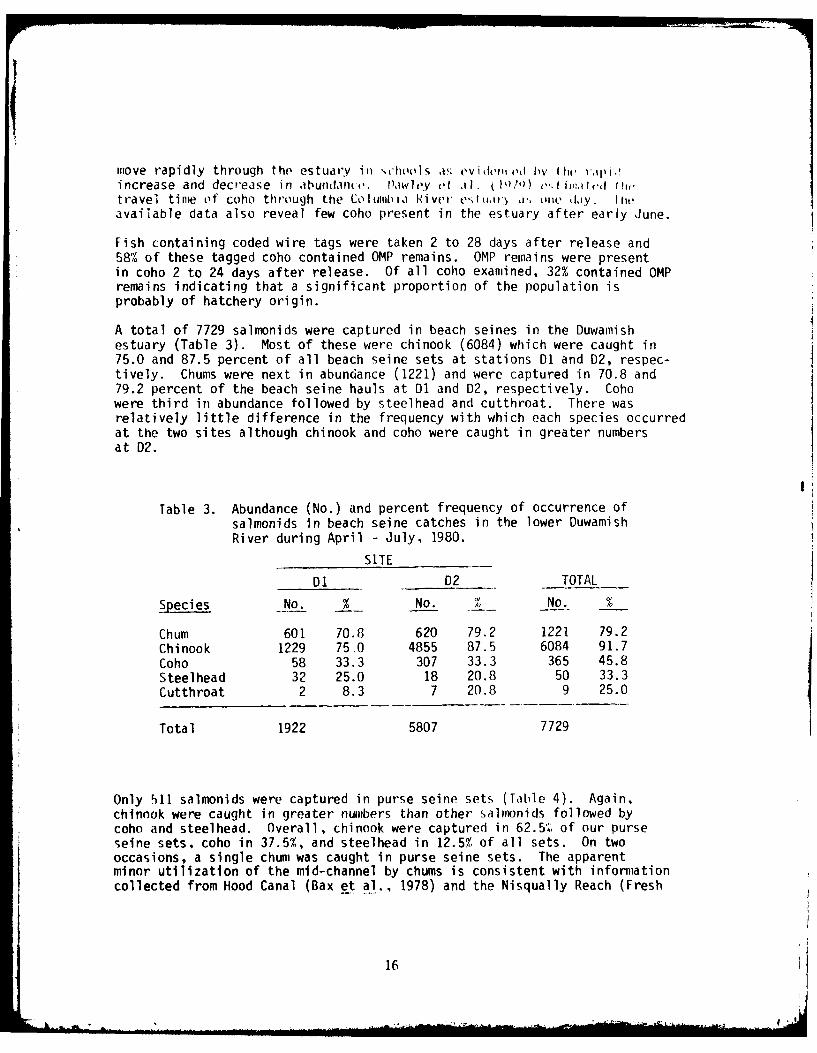
3 Abundance (No.) and percent frequency of occurrenceof salmonids in beach seine catches in the lowerDuwamish River during April - July, 1980 ......... ... 16
4 Abundance (No.) and percent frequency of occurrenceof salmonids in purse seine catches in the lowerDuwamish River during April - June, 1980 ......... ... 17
5 Mean fork length (X) and standard deviation (S) ofjuvenile salmonids captured in purse seines and beachseines in the lower Duwamish River in April - July,1980 ........ ......................... ... 18
6 Mean (X) beach seine catch per set, standard deviation* (S), coefficient of variation (CV), and number of sets
(N) for juvenile salmonids during night, day, andoverall in the lower Duwamish River in April - July,
1980 .......... ... ...................... 18
7 Mean (X) purse seine catch per set, standard deviation(S), coefficient of variation (CV), and number of sets(N) for juvenile salmonids during night, day andoverall in the lower Duwamish River in April - July,1980 ......... ......................... 1
8 Relative abundance and percent species composition of
invertebrates sampled in the lower Duwamish River. . . 33
v,
S V
I.

INTRODUCT ION
The Seattle District, Corps of Engineers has reactivated study of theDuwamish Navigation Improvement Project at the request of the Port ofSeattle and the City of Seattle. The proposed project would deepen andwiden the existing navigation channel in the lower Duwanish River toaccommodate larger ships and reduce ndvigational hazards. Deepening andwidening of the existing channel coupled with anticipated industrialdevelopment will result in changes in the substrate characteristicsamount of shallow water habitat and water quality characteristics in theproject area. These changes could in turn impact the fishery resourcesutilizing this estuary. In February, 1980, resource protection agenciesreviewing this project requested additional baseline biological informationneeded to assess environmental impacts. Three basic questions were askedregarding juvenile salmonids in the project area; 1) what is their distri-bution, 2) what do they eat, and 3) what is the availability of foodresfiurces?
The ;reen-Duwamish River contains fall chinook, coho and chum salmon plussteelflead and cutthroat trout. Recent estimates by the Washington Departmentof Fisheries (WDF) indicate that Gteen River fall chinook are one of thelargest naturally spawning stocks of this species in Puget Sound (Ames andPhinney, 1977). Present plans of WDF require management of commercialfisheries to allow for full escapemevit needed to meet natural spawningrequirements of fall chinook. Coho and steelhead smolts are heavily plantedin the Green River drainage and commercial and sport fisheries target onthese hatchery stocks. The number of chum salmon returning to the GreenRiver is depressed and probably far below historic levels. Johnson (1973)nctes that Green River chum have "virtually disappeared in recent years".Reasons for the decline are unclear but probably involve over-fishing,habitat degradation, arid, possibly, predation by introduced stocks ofsalmonids. Native Green River chum remain at a very low level. Managementand restoration efforts for this species are currently directed towardrebuilding a naturally spawning run.
Environmental impacts resulting from the Duwamish Navigation ImprovementProject will probably occur primarily in the estuary and lower river (betweenriver mile 0 and 5.0). A recent body of literature has begun to reveal therole of estuaries in the early life history of salmonids. Studies by Reimers(1971), Mason (1974), Dunford (1975), Sibert et al. (1977), Congleton (1978),and Healey (1979), have documented juvenile salmonid residence and feedingin estuaries, particularly by chinook and chum. Important prey duringestuarine residence are epibenthic invertebrates and aquatic insects. Resi-dency in the estuary is variable but can extend up to several months for
chinook. Other studies have documented use of intertidal and shallow shore-line areas by salmonids after leaving the area of the river mouth. Thereappears to be a gradual offshore movement and an associated shift in dietfrom primarily epibenthic invertebrates in nearshore shallow waters topelagic organisms (Fresh et al., 1979; Bax et al., 1978; Simenstad and Kinney,
1-- - I ,
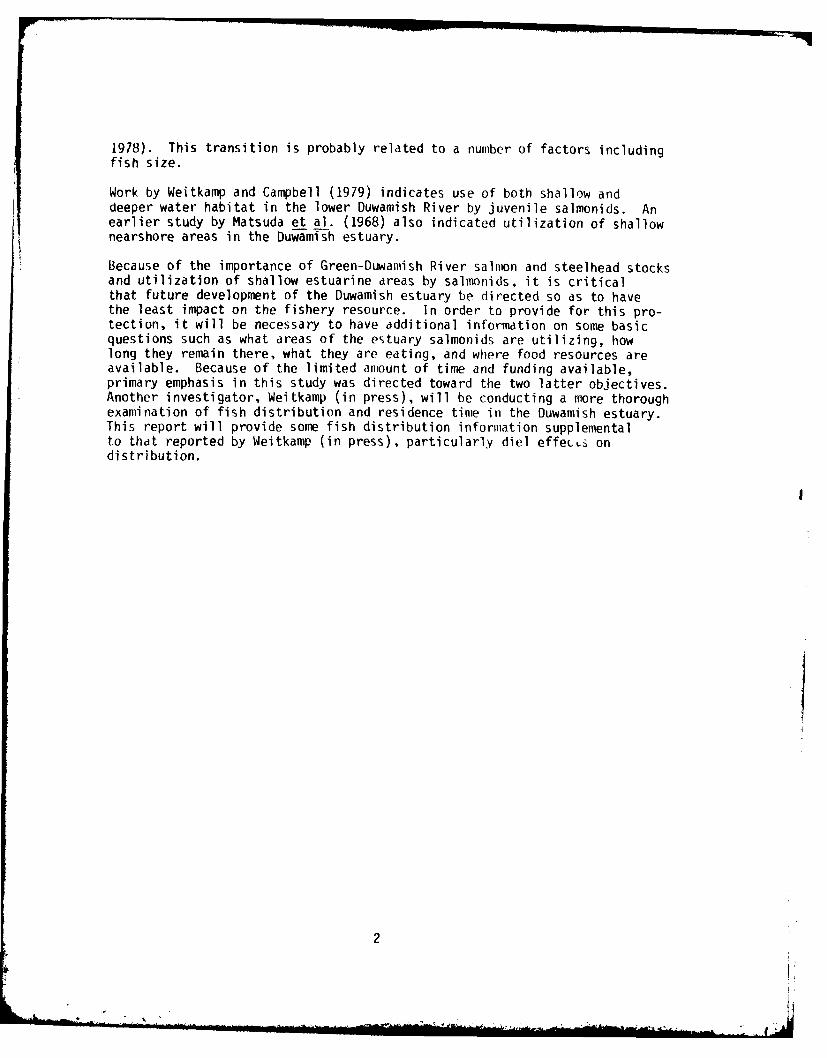
1978). This transition is probably related to a number of factors includingfish size.
Work by Weitkamp and Campbell (1979) indicates use of both shallow anddeeper water habitat in the lower Duwamish River by juvenile salmonids. Anearlier study by Matsuda et al. (1968) also indicated utilization of shallownearshore areas in the Duwamish estuary.
Because of the importance of Green-Duwamish River salmon and steelhead stocksand utilization of shallow estuarine areas by salmonids, it is criticalthat future development of the Duwamish estuary be directed so as to havethe least impact on the fishery resource. In order to provide for this pro-tection, it will be necessary to have additional information on some basicquestions such as what areas of the estuary salmonids are utilizing, howlong they remain there, what they are eating, and where food resources areavailable. Because of the limited amount of time and funding available,primary emphasis in this study was directed toward the two latter objectives.Another investigator, Weitkamp (in press), will be conducting a more thoroughexamination of fish distribution and residence time in the Duwamish estuary.This report will provide some fish distribution information supplementalto thdt reported by Weitkamp (in press), particularly diel effectL ondistribution.
I2I

METHODS ~NO M~TERI~LS
Fish and plankton samples were coll ec t e d a t s ites be t ... Jeen r i ver mil es one and four in the lower Duwamish River from early April t o la t e July, 1980. Daily catches are prese nted in the appendix. Fi s h santpling was conducted by beach and purse seining. The beilch seine measured 30.S me ters (m) (100 feet) in length and 3.0111 (10 feet ) in depth. Me sh s i ze was 6 millime ters (nm) (1/4 inch) in the wings and 5 mm (3/ 16 i nch) in the cente r panel . Beach seine sampling was limited to the few a r eas with d smoot h bo ttom. The purse seine was 61 . 0 m (200 feet) long, 2.1 m (7 feet) deep in the body, and 4.6 m (15 feet) deep at l he bunt. Mes h size measured 6 mm ( 1/ 4 inch) throughout the net. Sampling occ~rred along the eas t shore of Kellogg Island and at the intersection of South Kenyon Street and Duwamish River (Figure 1). The Kellogg Island site (01), one of the few r emaining tidal marsh habitats in the Duwamish estuary and Ell~ct t Bay, is characterized by a steep slope at the upper intertidal l evel v1ith il tnure gt·adua l slope below this. The bottom is composed of a thin upper layer of fine silt and mud over compacted sand. There i s little intertidal vege t a tion although some marsh plants grow down i nto the upper intertidal zone. Logs are stored directly offshore from this site. The site at South Kenyon SLn!t:l (02) has a more gradual slope with sand in the upper intertida l zone giving way to silt in the lower portion of the zone . Again, the re i s littlP int.ert.irlal vegetation.
At eilch site . two r eplicate beach se ine se ts we re mc~de in the intertidal zone at or near high s l ack tide. Se ining could not be conducted effectively at low tide s because of numerous s nags . Purse seine sets were made directly offshore from each site in mid-channel well away from any shoreline structure . A complete set of samples was collected at each site during daylight and again after sunset in order to examine diel effects on distribution and food habits. Our sampling schedule was weighted toward the expected period of peak outmigration (mid-April through early June) . During this period, sampling was conducted weekly; at othe r times it occu r r ed bi-weekly .
All juvenile salmonids caught at a particular s ite up t o a maximum of 50 of each species were measured (fork length) to the neares t millimeter and at least 7 were retained for stomach analysis . Those s acrificed f or stomach content analysis were preserved in 10% formalin. The abdominal cavity of individuals larger than 100 rnn was opened to all ovJ rapid entrance of fonnalin slowing the rate of digestion in the stomach. Occas iona lly, potential salmonid predators \<Jere preserved for s tomach analysis . No special effort was made to capture hatchery fish whi ch had been tagged with coded-wire tags and marked by removal of the adipose fin. T~ose fish that were retained were examined for tags. Due to tirne constraints and the l arge numbers of fish caught, stomach analysis was performed on chinook samples taken every other week after May 17, 1980 . All pn~served s pecimens o f other salmonid species were examined.
3

r
(0
L/ 11
/.l
. 0
\ P
to
CLC
cc
.i0,
MAk
E
Laboratory procedures consisted of severing the stoimich at the esophagusand intestine and removing it from the fish carcass. Adhering tissue wascut away, the stomach blotted dry, and weighed to the nearest milligram.The stomach was then opened and percent fullness estimated. The weight ofthe empty stomach sac was subtracted from the weight of the full stomach togive an estimate of the biomass of the stomach contents.
Stomach contents were sorted and identified to the lowest taxonomic categorypracticable considering the stage of digestion, the state of the taxonomicliterdture, time constraints, and ease of identification (ie. extensivemicro-dissection techniques were not employed). The number, weight and lifehistory stage of the prey in each taxonomic category was recorded. Preyweights in milligrams were determined using a toploading Mettler PC 440balance. The percent digestion of the stomach contents was also estimated.Hatchery fish food (Oregon Moist Pellet) remains were noted but notquantified.
Predator and prey information was recorded on keypunch forms using theMarine Ecosystems Analysis Program format. The data was then analyzed usingthe Index of Relative Importance (IRI) developed by Pinkas et al. (1971)and modified by Simenstad and Kirney (1978). IRI diagrams and tables
simultaneously display the frequency of occurrence of important items, theirpercent of the total weight, and percentage contribution to the total numberof individual items in the diet. IRI figures were computed using a computerprogram developed by Larry Gales and Charles Simenstad of the University ofWashington, Fisheries Research Institute (FRI).
Epibenthic and pelagic plankton samples were collected at five sites(Figure 1) selected to represent the substrate types found in the projectarea and/or fish sampling site. These samples were collected to providequalitative data regarding prey availability found in association with thevarious substrate types. Site DPI coincided with fish sampling site D1and was representative of a soft fine sediment substrate with much organicdebris (Figure 2). Site DP3 was located in the surface water of the mainchannel offshore from DPI. Station DP5 was chosen to represent prey or-ganisms found in association with a rock rip-rap substrate. However, the
site chosen contains significant amounts of sand and gravel and has a gradual
slope throughout much of the intertidal zone. Samples from this site areprobably not representative of rip-rapped areas in which there are few or
no sand/gravel patches and where the slope is much steeper. Figures 3
through 5 are illustrative of the rip-rap types found at DP5 and two otherareas of the Duwamish estuary, respectively. DP4 was located under a long
concrete apron where no direct natural light penetrates. Substrate com-position at this site was steeply sloping rip-rap as shown in Figure 5.
Long concrete aprons, such as those found at this site, could become thepredominant shoreline structure under full scale development. Site DP6is located adjacent to fish sampling station D2, which exhibited a soft
sandy substrate. All plankton sampling stations except DP6 were chosen in
the lower river within close proximity to each other so as to avoid signi-ficant changes in salinity.
5
In
c
4---
4-)
4\J
LL-

0U
w4-,
~04-,
.4-,
C-
C-'-
C
-4-'~0*.- C
a.'-4-
~ (I,(/, -I.-)
CC. ~
C. '~
OW0 4-'
4-' e~Ae S-OW'V -~
.- 0C- E
C',
u-I0
U-
4-)
CL

opp
'IT
-4-
LO

samples were collected monthly at or near high slack tide. Two r(Ill icate,samples were collected at approximately one meter ahOVe mewan low water.This tidal level was chosen as a compromise as there is significant tidalzonation among intertidal invertebrates. Smith (1977) examined the dis-tribution of estuarine invertebrates in the Snohomish estuary and foundinsects in the upper portion of the intertidal zone while amphipods werelocated throughout the intertidal zone and subtidally.
Epibenthic and pelagic invertebrates were sampled with a suction pumpsystem similar in design to one developed by FRI (Simenstad and Kinney1978). This type of sampler was used because it could be utilized overvarious substrates and is designed to sample organisms available to sal-monids. The sampling head was attached to a wooden pole and passed along
t the bottom until two hundred liters of water were pumped through two nestedplankton nets of 0.500 iin and 0.209 mm mesh size. Because of the mannerin which the sampling head was passed along the bottom, the area sampledcould not be quantified. Material retained by the plankton nets was washedinto sample jars, labeled and preserved in 10Z formalin. Fifty liters ofwater were pumped through the sampling apparatus at each new site to flushthe system of material from the previous sampling site. The system was notflushed between replicates at the same site. The presence of some benthicorganisms in samples from a pelagic site suggests that 50 liters was notadequate to flush the system thoroughly between sampling sites. However,insufficient flushing does not appear to have significantly affectedresults in most cases. Because it was not possible to sample a known areaof substrate, quantitative comparisons were not made between sampling sitesalthough relative abundances were compared.
Rose bengal stain was added to all samples to dye organisms in order tofacilitate sorting plankton organisms from other debris in the samples.Samples containing large amounts of sand were stirred and decanted several
t times until the supernatant liquid appeared free of suspended material.The sand remaining in two samples after decanting was examined to checkthe efficiency of the decanting process, and no organisms were found. Thedecanted material was passed through a piece of 0.1 n mesh plankton netcloth to remove excess liquid. The material retained by the cloth was sub-divided iF necessary and examined under a dissecting microscope. Organismswere sorted from debris in the sample and were identified, enumerated andweighed to the nearest milligram.
10
RESULTS AND DISCUSSION
Fish Distribution
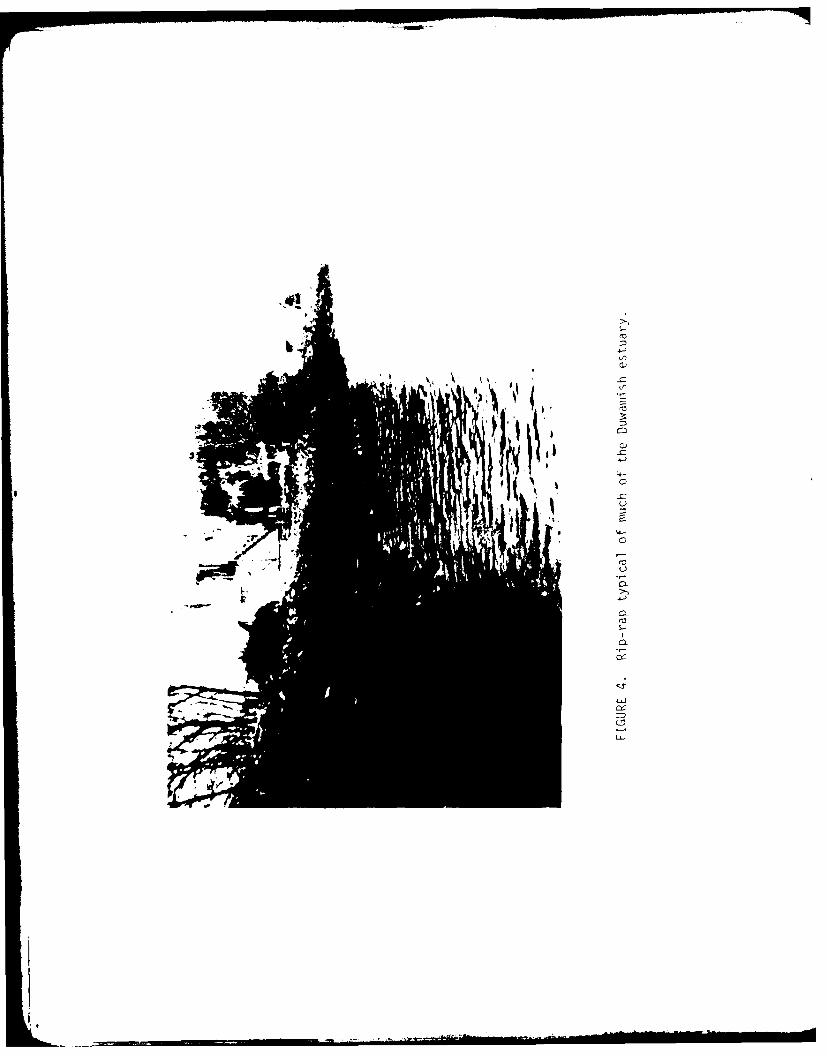
Twenty-one species of fish were captured during beach seine and purseseine sampling (Table 1). Species composition was similar to that reportedby Weitkamp and Campbell (1979) and Matsuda et al. (1968). Juvenile chumand chinook salmon, snake pricklebacks, shiner perch and staghorn sculpinswere the most prevalent species caught in beach seines. Juvenile chinookand coho salmon and herring were the most commonly caught species in purseseines.
Weekly mean salmonid catches are listed in Appendix A.
Table 1. Fish species caught in the lower Duwamish River withbeach seines and purse seines April - August, 1980.
Common Name Scientific Name
Western brook lamprey Lampetra richardsoniPacific herring C arnus pallasiPink salmon Oncorhynchus gorbuschaChum salmon Oncorhynchus ketaCoho salmon Oncorhynchus kisutchChinook salmon Oncorhynchus tshawytschaCutthroat trout Salmo clarkiSteelhead (Rainbow trout) Salmo gairdneriDolly Varden Salvelinus malmaSurf smelt Hypomesus pretiosusLargescale sucker Catostomus macrocheilusPacific cod Gadus macrocephalusPacific tomcod Microqadus proximusWalleye pollock Tfera ra chalcogranmmaThree spine stickleback Gasterosteus aculeatusPacific staqhorn sculpin Leptocottus armatus.Shiner perch ma -taster ata
Pile Perch Rhacochilus vaccaSnake prickleback Lumpenus sagittaPacific sandlance Ammodytes he-pterusStarry flounder Platicht!v s-te-aus
Two peaks in chum abundance were noted (Figure 6). The first, in lateApril, occurred prior to any plants of hatchery chum in the system (Table 2).The second peak occurred in mid-May, shortly after the Muckleshoot Tribereleased 750,000 chum fry in Crisp Creek, a tributary to the Green River.Bostick (1955) reported a peak in his chum catches in the Duwamish estuaryon May 6 and Weitkamp and Campbell (1979) found chum peaking in late April.We found chum present from early April through early July.
III
.ii
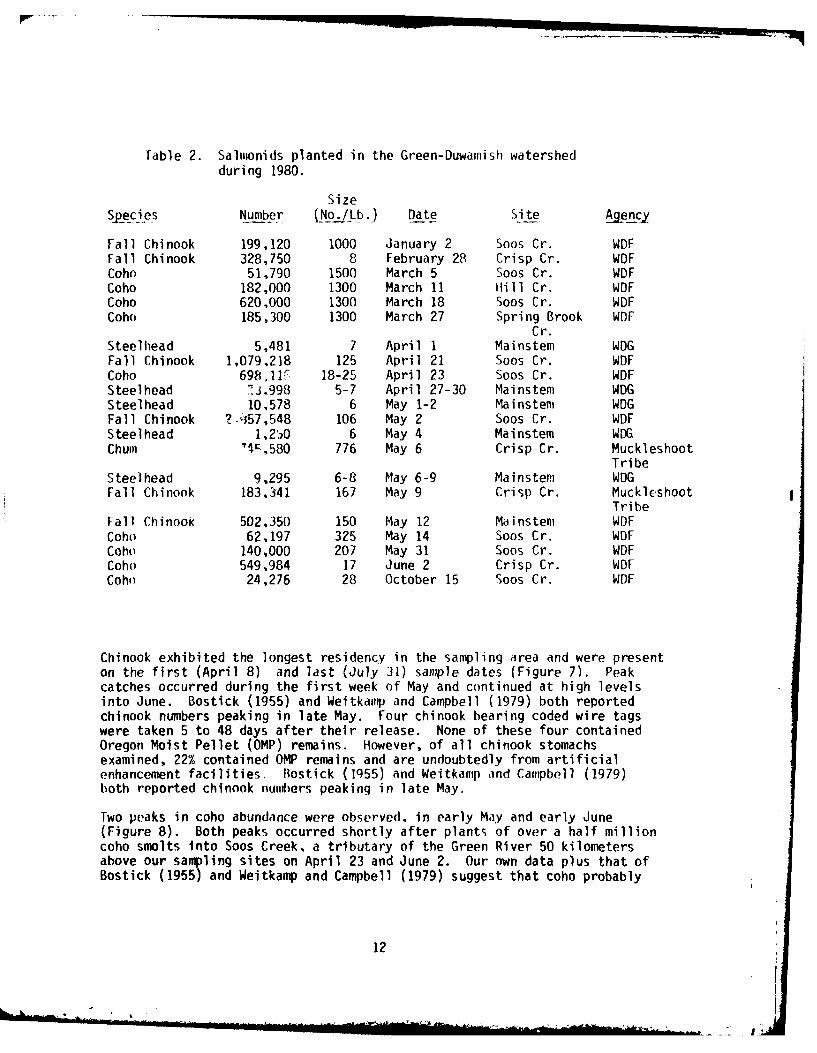
Table 2. Salmonids planted in the Green-Duwamish watershedduring 1980.
SizeSPecies Number No./ Lb.) Date Site Aenc
Fall Chinook 199,120 1000 January 2 Soos Cr. WDFFall Chinook 328,750 8 February 28 Crisp Cr. WDFCoho 51,790 1500 March 5 Soos Cr. WDFCoho 182,000 1300 March 11 Hill Cr. WDFCoho 620,000 1300 March 18 Soos Cr. WDFCoho 185,300 1300 March 27 Spring Brook WDF
Cr.Steelhead 5,481 7 April 1 Mainstem WDGFall Chinook 1,079,218 125 April 21 Soos Cr. WDFCoho 698,11. 18-25 April 23 Soos Cr. WDFSteelhead '.J998 5-7 April 27-30 Mainstem WDGSteelhead 10,578 6 May 1-2 Mainstem WDGFall Chinook ? -57,548 106 May 2 Soos Cr. WDFSteelhead 1,2'30 6 May 4 Mainstem WDGChum 'I,580 776 May 6 Crisp Cr. Muckleshoot
TribeSteelhead 9,295 6-8 May 6-9 Mainstem WDGFall Chinook 183,341 167 May 9 Crisp Cr. MucklE-shoot
TribeFall ChinooK 502,350 150 May 12 Mainstem WDFCoh) 62,197 325 May 14 Soos Cr. WDFCoho 140,000 207 May 31 Soos Cr. WDFCoho 549,984 17 June 2 Crisp Cr. WDFCoho 24,276 28 October 15 Soos Cr. WDF
Chinook exhibited the longest residency in the sampling area and were presenton the first (April 8) and last (July 31) sample dates (Figure 7). Peakcatches occurred during the first week of May and continued at high levelsinto June. Bostick (1955) and Weitkamp and Campbell (1979) both reportedchinook numbers peaking in late May. Four chinook bearing coded wire tagswere taken 5 to 48 days after their release. None of these four containedOregon Moist Pellet (OMP) remains. However, of all chinook stomachsexamined, 22% contained OMP remains and are undoubtedly from artificialenhancement facilities. Bostick (1q55) and Weitkamp and Campbell (1979)both reported chinook numbers peaking in late May.
Two peaks in coho abundance were observed, in early May and early June(Figure 8). Both peaks occurred shortly after plant- of over a half millioncoho smolts into Soos Creek, a tributary of the Green River 50 kilometersabove our sampling sites on April 23 and June 2. Our own data plus that ofBostick (1955) and Weitkamp and Campbell (1979) suggest that coho probably
12
- fIJ.

.75
0
4,
41 O,
)
CLC>)
ix
a.
WS/49:1 'O UD-o
13o
LA
~~V)
fl4-OJ) d
- (A
1 0)10 >
4- -
( U
03-
LA-
49S/4s!:i 'ON UDOW
14

~ ....... .. ir
t;;
i c 0 • ~
25
A
li
; ; ; ; ; ; I ; ; i i
M
o n
t h
~ ~----------
~ s
eirl
e-·-
·-·-
·-·-
·-
June
Ju
ly
FIGU
RE 8
. M
ean
wee
kly
catc
h of
juv
enil
e co
ho p
er s
et b
y be
ach
sein
es a
nd p
urse
sei
nes
in
the
low
er D
uwam
ish
Riv
er d
urin
g A
pril
-
July
, 19
80.
I
move rapidly through the estuary il ',h,l s &; ('Vi dotli(,d Ily I te ),tpilincrease and decrease in abundan( . ),awley et ai. (1)0,0) o.1 in It ,t li.travel time of coho through the C olumbi a River e,wi ,,, a imit' daly. I htavailable data also reveal few coho present in the estuary after early June.
Fish containing coded wire tags were taken 2 to 28 days after release and58% of these tagged coho contained OMP remains. OMP remains were presentin coho 2 to 24 days after release. Of all coho examined, 32% contained OMPremains indicating that a significant proportion of the population isprobably of hatchery origin.
A total of 7729 salmonids were captured in beach seines in the Duwamishestuary (Table 3). Most of these were chinook (6084) which were caught in75.0 and 87.5 percent of all beach seine sets at stations D1 and D2, respec-tively. Chums were next in abundance (1221) and were captured in 70.8 and79.2 percent of the beach seine hauls at D1 and D2, respectively. Cohowere third in abundance followed by steelhead and cutthroat. There wasrelatively little difference in the frequency with which each species occurredat the two sites although chinook and coho were caught in greater numbersat D2.
Table 3. Abundance (No.) and percent frequency of occurrence ofsalmonids in beach seine catches in the lower DuwamishRiver during April - July, 1980.
SITE
DI D2 TOTAL
Species No. % No. % No. %
Chum 601 70.8 620 79.2 1221 79.2Chinook 1229 75.0 4855 87.5 6084 91.7Coho 58 33.3 307 33.3 365 45.8Steelhead 32 25.0 18 20.8 50 33.3Cutthroat 2 8.3 7 20.8 9 25.0
Total 1922 5807 7729
Only 511 salmonids were captured in purse seine sets (Table 4). Again,chinook were caught in greater numbers than other salmonids followed bycoho and steelhead. Overall, chinook were captured in 62.5%; of our purseseine sets, coho in 37.5%, and steelhead in 12.5% of all sets. On twooccasions, a single chum was caught in purse seine sets. The apparentminor utilization of the mid-channel by chums is consistent with informationcollected from Hood Canal (Bax et al., 1978) and the Nisqually Reach (Fresh
16
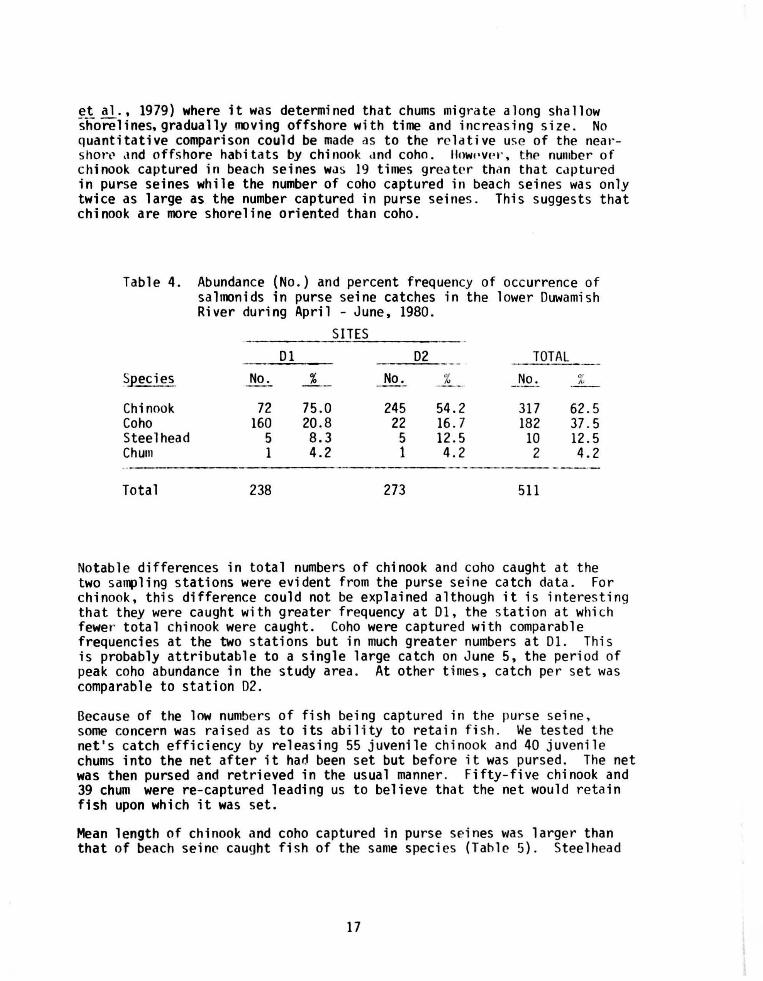
et al . , 1979) where it was determined that chums migra te along shallow shorelines,gradually moving offshore with time and increasing s i ze . No quantitative comparison could be made as to the relative use of the neat·shor·p ,tnd offshore habitats by chi nook <1nd coho . lh)WPVet·. the number of chinook captured in beach seines Wil s 19 times greater than that captured in purse seines while the number of coho captured in beach seines was only twice as large as the number captured in purse seines. This suggests that chinook are more shoreline oriented than coho .
Table 4. Abundance (No.) and percent frequency of occurrence of salmonids in purse seine catches i n the lower Duwami sh River during April - June, 1980.
SITES 01 02 TOTAL
S_pecies No . _%_ No. % No . %
Chinook 72 75.0 245 54.2 317 62.5 Coho 160 20.8 22 16. 7 182 37 . 5 Steel head 5 8.3 5 12. 5 10 12. 5 Chum 1 4.2 1 4.2 2 4.2
---------Total 238 273 511
Notable differences in total numbers of chinook and coho caught at the two sampling stations were evident from the purse seine catch data. For chinook, this difference could not be explained although it is interesting that they were caught with greater frequency at Dl, the s tation at which fewer· total chinook were caught . Coho were captured with comparable frequencies at the two stations but in much greater numbers at Dl. Thi s is probably attributable to a single large catch on June 5, the peri od of peak coho abundance in the study area. At other t imes, catch per set was comparable to station 02.
Because of the low numbers of fish being captured in the purse seine , some concern was raised as to its ability to retain fi sh. We tested the net's catch efficiency by releasing 55 juvenile chinook and 40 juvenil e chums into the net after it harl been set but before it was pursed . The net was then pursed and retrieved in the usual manner. Fifty-five chinook and 39 chum were re-captured leading us to believe that the net would retain fish upon which it was set.
Mean length of chinook and coho captured in purse seines was larger than that of beach seine caught fish of the san~ speci es (Table 5) . Steelhead
17

exhibited the opposite pattern with beach seine caught f·ish having a greater mean length . The statistical significance of these differences was tested with a two-way analysis of variance (ANOVA). The ANOVA test indicated that the differences between weekly mean lengths of chinook caught in beach seines and purse seines was significant at the 0.001 level. Differences in mean length between coho and steelhead were not significantly different according to the ANOVA. This analysis indicates greater utilization of offshore areas by chinook with increasing size.
Table 5. Mean fork length (X) and standard deviation {S) of juvenile salmonids captured in purse seines and beach seines in the lower Duwamish River in Apri 1 - July, 1980.
Species
Chinook Coho Steel head
Beach Seine
x s
76.7 129.0 183.6
9. 56 14.05 32.67
Purse Seine -------------
x s ---82.8
134.1 159.3
12.83 14.84 29.70
Average catch per beach seine set of juvenile chums was greatest during daylight hours while mean catches of chinook and steelhead appeared to be greatest during the hours of darkness (Table 6). Magnitude of beach seine catches of coho showed little difference between daylight and darkness.
Table 6. Mean (X) beach seine catch per set, standard deviation (S), coefficient of variation (CV), and number of sets (N) for juvenile salmonids during night, day, and overall in the lower Duwamish River in April - July, 1980.
Day Night Overa 11
x s cv N x s cv N x s cv N ~pecies ... _ ------- - ·- . -- ----- ---- · - -- --- ·~-- --- ·· - ------ - - -- -·----
Chum 15.24 33.41 219% 59 8.94 17.81 199'~ 36 12. 85 28.63 223% 95 Chinook 43.36 77.53 179% 59 97.94 204.52 208% 36 64.04 142.43 222% 95 Coho 3.90 15.85 406% 59 3.75 11.06 295% 36 3.84 14.22 370% 95 Steel head 0.07 0.25 357% 59 1.28 3.62 283% 36 0.53 2.31 438% 95
18

Differences in mean catch per set were not statistically significant exceptfor steelhead. This is probably attributable to the high variability amongcatches as evidenced by large standard deviations. Average purse seinecatches of chinook, coho and steelhead were hioher during daylight hoursthan at night but were not statistically significant (Table 7).
Table 7. Mean (x) purse seine catch per set, standard deviation (S),coefficient of variation (CV), and number of set, (N) forjuvenile salmonids during night, day and overall in thelower Duwamish River in April - July, 1980.
Day Night Overall
Species X S CV N IS CV N X X CV N
Chinook 6.58 15.73 239% 40 1.93 2.49 129% 28 4.66 12.38 266% 68Coho 4.38 23.05 526% 40 0.29 0.60 207% 28 2.69 17.80 662- 68Steelhead 0.18 0.77 428% 40 0.11 0.31 2827, 28 0.15 0.62 4131, 68
Further examination of diel distribution was investigated using chi-squareanaly,;is. Comparisons were made between the ratio of the average catch perset during daylight to the average catch at night for beach seines andpurse seines. The diel ratio of beach seine and purse seine chinook catcheswere significantly different at the 0.005 level. Coho and steelhead dielratios were not significant although they also exhibited approximately thesame pattern of larger nighttime beach seine catches and larger daytime purseseine catches. These results indicate a possible inshore movement at nightby chinook, coho, and steelhead with a shift in the other direction duringdaylight hours.
fresh et al. (1979) utilized coefficients of variation (Coefficient ofVariation ) V) (Standard Deviation/Mean) X 100%) to examine diel school iogbehavior of juvenile salmonids in the Nisqually reach. They found increasedschooling during the (day as evidenced by larger CV values compared to those(:alculdted for nighttime catches. We also utilized this statistic andfound a similar schooling pattern except for chinook. In this study, beachseine catches of chinook exhibited higher CV values at night than duringthe day (Tables 6 and 7).
Length data for chum, chinook and coho showed an increasing trend in thesize of fish captured during the course of this study (Figures 9-11, respec-tively). Chum revealed the greatest increase in mean length. These increasesmay be attributable to growth while residing in the study area or inmigrationof larger fish from upstream areas. Without mark/recapture data it isdifficult to determine which of these factors is causing the observedincreases in size.
19
I-
EC
4J
4-)
>00
4
4JC
CL
*- 12
OtJ
2L0co
CD
446u~l 04 uEu

C
) 0-
4-)-o S-
0
CC
4-1
S-
C:CUm r-
CL:W
0)
C.4)
I- -AL
'1)
4-
0)
rS-
CL>
0 CU0)
> t
C U
3:
0) -+II
4-.,'AG -tU
w u 0
q~~fivol 4.40 4J
22., .

Food Habi ts
Food habits of juvenile salmonids varied over time, size of predator, andaiong sampling stations. Two hundred fifty-two chum, 305 chinook, 97 coho,49 steelhead and 4 cutthroat stomachs were analyzed. Very few empty stomachswere noted and a wide variety of prey items were identified. Variability insalmonid diets was investigated by comparing the influence of the followingfactors: day versus night feeding, shallow littoral versus mid-channel zone,lower salinity upstream station versus more saline downstream station, sizeof predator, and month.
We consider it unlikely that fish consumed food at one station or in oneestuary zone and then were caught at another station or zone. Elliot (1972)found the rate of digestion in brown trout to vary with food type andwater temperature, but in general over 50% of stomach contents were digestedafter several hours. It would be possible for a fish to move from anearshore to an offshore site in several hours, but it would not be likelyfor a fish to move from the upstream to the downstream station in thisamount of time. Furthermore, some of the prey items found in the fishstomachs suggest that the fish had been feeding where they were caught.For instance, crab zoea, which are marine and pelagic, were found almostexclusively in chinook and coho taken offshore (in purse seines) at themore saline downstream station.
Chinook. Gammaridean amphipods, calanoid copepods, and dipteran flies areprey categories which seem to be important in the diets of juvenile chinooksalmot from the Duwamish River estuary (Figure 12). Of the gammarids,
ium salmonis, and C. _ oinicorne were consumed by 41, of the chinook.Eo2 mmarus confervicolus was also a iajor contributor to juvenile chinookdiets. Most of the dipteran flies are aquatic; the midge family Chironomidaewas found in 37% of the chinook and is the most important dipteran eaten,while the biting midge family Hleleidae (also known a,, Ceratopogonidae) isof less importance. lhe adult stage of chironomids was consumed mostfrequently while the pupa stage of heleids was more important in chinookdiets than adults or larvae. Calanoids were found in 21% of chinookStomachs.
In examining diel differences in chinook feeding behavior, we found thatganmnaridean amphilpods, particularly Corop _hjum salmonis, were consumed moreat nighttime than in the day. Corophiun salmonis conipri',ed 32% of thetotal Index of Relitive Importance (-IRT) at night and 6;' in the day. Calanoidcopepods were eaten during the day and at night but primarily at dusk.Chironomid flies made a greater contribution to chinook diets in the day-time than at night, comprising 30% of the total IRI in the day and only 11%at night.
23
1 ,I.

Chinook feeding in the nearshore shallow littoral zone (sampled by beachseine) tended to eat more epibenthic prey, particularly gannaridean amphipodsand especially C. salmonis. Purse seine caught chinook ate more pelagicprey. Corophium salmonis, which are epibenthic, made up 14% of the totalIRI for chinook f-eeding near shore, and less than ]Y in those feeding off-shore. Planktonic crab zoea (juveniles), particularly in the pea crabfamily Pinnotheridae, occurred almost exclusively in chinook caught off-shore contributing 18% of the IRI of those caught in purse seirnes andless than 1% in beach seined chinook. A very small amount of predation
shore zone.
Marine species of prey tended to be more important in the diets of chinookfeeding at station D1 than D2. Gammaridean amphipods, particularly C.salmonis, and brachyura crab zoea, largely Pinnotheridae, are marinecrustaceans which were eaten primarily by fish collected at the downstreamstation. Corophium salmonis made up 26% of the total IRI at station DIand I% at D2. Brachyurans made up 12% of the total IRI at D and 2"' at.D2. It is curious that calanoid copepods, which are generally marine,were consumed in largest numbers at the upstream station. Calanoid,, madeup 51% of the total IRI upstream and 15% downstream. Chironomid flieswere consumed more at the upstream site, comprising 19% of the total IRIat D2 and 7% at DI, while heleid flies made up 5% of the total IRI at thedownstream site and were essentially absent from fish stomachs at theupstream site.
There was a slight trend for smaller chinook to consume more epibenthicprey while larger chinook ate more pelagic food, Gamiaridean amphipods,particularly Corophium species, contributed 44% of the total IRI to dietsof small chinook 60 to 69 mm long, becoming less important to largerchinook (205 of total IRI in chinook 90 to 99 mm long and 6% in chinook100 to 109 mm). Harpacticoid copepods (epibenthic in habitat), particularlyin the family Cletodidae, were inportant to smaller chinook from 40 to69 nun long as were chironomid flies. Chironomid,, decreaed in importarce,'; pr I'lator s i r, incr,,'veld, from 59% o f the total IRI ir (hin'ok '0 to
!') jimi long, to 15'.', La IRI in CIhi nook /0 to 79 iiii. cadhtI m (l el .(pelagic in habitat) were important to larger chinook 70 to 99 mm long,making up 34 to 47%1 of the total IRI. The largest chinook we sampled,100 to 109 nmm long, consumed non-salmonid juvenile fish and the pelagiclarvacean 0ikopjeura, which made up 31% and 36% of the total IRI, respec-tively. These results suggest that smaller chinook are feeding in shallownearshore areas while larger chinook make greater use of the mid-channel.
Monthly differences in chinook diets are related to differences in sizeof the chinook, since fish size increased with time, although monthly diettrends are not as clear cut as diet trends by predator size. Gammarideanamphipods were most important early in the year in April (66% total IRI),but were also important in June (31% total IRI), and of some importance inJuly (19% total IRI). Calanoid copepods were of primary importance laterin the year in July (45% total IRI), although they were also important inMay (25% total IRI).
25 1k*4 INWG h3B MLf .- WOT FIlU

Coho. Gammaridean amphipods and insects were found to be important preyof juvenile coho in the Duwamish River estuary (Figure 13). Small rocksor sand grains were also found in appreciable quantities in coho stomachs.Of the gammarids, Coroghium salmonis was the most important species incoho diets, comprising 32% of the total IRI, although Eogammarus confervicoluswas also an important contributor to the diet (9% of the total IRIT. Ofthe insects, the most important were adults and larvae of the aquatic midgefamily Chironomidae which contributed 13% of the total IRI. There was asmall amount of predation on juvenile fishes (3% of the total IRI). However,only one out of 97, or 1% of the coho, had preyed on chum salmon.
In examining diel differences in coho food habits, we found that moreinsects were eaten in the daytime. Some crustaceans, such as the mysidNeomysis mercedis and the cumacean Cumella were eaten exclusively at night(1972 and 9% of the total nighttime IRI, respectively). The gammarideanamphipod Eogammarus confervicolus was eaten primarily at dawn, while thegammarid Corophium salmonis was quite important to coho diets both day andnight (31% total IRI in day, 43% total IRI at night). Predation on juvenilefish including chum occurred during the day.
Coho feeding nearshore consumed epibenthic crustaceans while those feedingoffshore ate more insects. Gammarids were found almost exclusively infish that had been feeding nearshore. Corophium salmonis contributed 33%of the total IRI in beach seine caught coho, and was absent from cohotaken by purse seine. Eogammarus confervicolus comprised 9% of the totallRI in beach seined coho and 2% in purse seined coho. Juvenile fish,including chum salmon, made up 4% of the total IRI in diets of coho takennearshore by beach seine but were absent in fish feeding offshore.
Marine crustaceans were inore impcrtdnt in the diets of coho from the moresaline downstream station (DI), while freshwater species and insects wereconsumed in greater quantities at the upstream station (D2). Of thegammaridean amphipods, which comprised 90% of the total IRI at station D1,Corophium salmonis contributed 61% of the total IRI at station D1, comparedto 4. at D2, and Eoajarus confervicolus made up 27 ','. of the total IRI atstation D and was essentially absent Tron coho at station D2. Thecumacean Cumella sp. was also consumed by coho only at the downstreamstation, comprising 3". of the total IRI. Insects, including the dipteranfamily Chironomidae, were found almost exclusively in coho from the upstreamstation (35% total IRI at D2 compared to 1% at DI). Predation on juvenilefish including chum occurred primarily at station D2.
There was a ten(lvt(;y for smaller coho to consume epihenthic crustaceanswhile those of a larger size tended to eat aquatic and terrestrial insects.[he gaimmaridean amphi pod Corohiui 'almonis made up 21 to 64, of the totalIRI tor coho 90 to 129 1nin long. Foulimmmarus, conferv 'i c .ol u was less importantto smaller coho but did contribute 14','' of the total IRI to those between110 and 129 nmm. Cumella cumaceans were also consumed by coho less than129 mm long, comprising 2 to 3% of the total IRI. The mysid Neomsis mercedis,larger than Cumella, made up 2 to 3.X of the total IRI for coho 110 to 150 nun
26
,
I lD ~ .... -I . .... ~
.... e i lD
~ ....
I .: ~
llllEX Of RELATIVE IMPORTANCE II .R .1. I OIFIORA11 f'ROtt f'ILE !DENT. IJWAtffiH, STAll ON 0 123
f'REOfHOR 8755010203 - ONCORHYNCHUS Ill SUI l'H ICCttO Sfl.MON I ADJUSTED SAMPLE SIZE = 95
100 LENGTH.Mn X: 122.2. S.Q.: 21.0 WT.OMS X= 21.06. 5.0.: 7.02
110
60
40
20
0
-20
-40
i -so J -110
-100 0 20 40 60 80 tOO 120 140 160 180
CliU..ATlVE fREQUENCY Of OCCURRENCE
f~L~ ~~~ . b~ AW, '~ L J Pf• Ct NI •_!t;. ' · 1_1 L~- _ _______ __ ___ -' ~~t~~--- ~\!:-~~_ , _ _,;_t.r'.!. __ .!..!~ ._. _ _._ .. .JJW LJ •_I _ _
01 ji fE iiA J l, M-5~J. C 7 · • c e. t ~~::-:. •,:-c7:;---GAI'IIAP.ID£A 1o.:o1 z1.1~ JU.l R p~~. z ~ ~.~_3 __ JNOitGAt•IC L•.ll 2~.Z7 t. t4 c..~ '-•" i4 .j7 JNSF.CU 1:>.7«; 7.U :; .7~ ll"~ ~ . c., CU;,ACEA -·_lu,:.3 , :-~~--~.j-;------,c·.-.---w-<;--
IIYSIDA -~2-lo_J __ __ •2'!_ J~-- -~-!d. ___ _ .).~!; ___ _ - ACAI!JI.A· - --- Oo't l 1,1)( ol• l!o C. ,J) t4J.I'IJPH~A-A>t• lut . l!:Ea 7.17 lol c.. -'-"-'---•-~.!..l.--- ---!1.4 __ _ CHLOI::JPttYCtAt ~ .lt 1,\J i .~1 h.~ ,Jl
_ IIO!!_!C.Q_!.! _II.(JI, ;,At ----- ---· ------'~_z_., __ ill __ , l i - - - - J.~ _ __ •• ,j_C _ __ _ IALANOMOR PHA ... ~ 1 , .. , I).. • ~ i 0 L . t : • .. '
D!!.! ~~~ -·· ·----- - ··-----·---· --~---..!~~ !...c..~ --~ ~ ~~ --- __ _._?_1, __ _ _ EUCI.IJOA- ;I~[ A•vi--•-"•AC•of~Hllo \." 1 .,, 21 2 . ~~ ,1 . !,, j ,)4
hAI!PACTI C ll i•A .,,7 1 J,J J . l .' ~.r .~~ hSTEtc•tt-;11·;~ ; ,lr; .-;~ t .---o ... ! J. , ~---COLEOPTERA-AOEPIIAGA 1 . ~:.. __ __ _ ,.., !_l,r:c •· '• . , ,Jc
· aPOIOIA - --- ---- --- -- - l ,t.:. , Q, 7 , ·, -, c .l .r ~
L • ..,•. tO, l'. I 1 '. 1 '. 7
'''~-~ • .1 ~·.! . .!...!.!_:_~~~~ .. _ _J_t_l~!!!__'!_ '~~L.!!.!··: J:..!:...l_~_,!~l . !~~· : __ l· ~~j _. ~..li...---rD"PIJSIIl ::: , t~ • O II• L.'~"' 1• •·\ . , l t, \. f tl' l L\....JI ~J tW I.t l• r: IAcqt , :,f •' L L. I __ _ c_~u ~ ~·•! .• ", .. i, "'"-~-L~'-" 1 t.,,, ,,, • 1 vl ~ .)_111 · ··· ~ ~ • ~l , 1 ---· __ ____ _
rt ~t( r~.l da:· li •• \ ~ ll ,,,., . :i'IA',Il~t.- .. t{:.tfl( L-l'Wt ... ,lll
----=-•..:.Vt h H. )~~~t. A
• 1 ·:
'·" ' .I·
j. ~ t
_ .}_~_
: ·' c .~c.
Figure 13. IRI diagram and table showing major prey of juvenile coho in the lower Duwamish River. April - July, 1980 .
27

long. The aquatic chironomid flies contributed 15 to 30% of the totalIRI for fish 110 to 150 mm long. Other insects such as terrestrial homop-terans,including aphids and psyllids,made up 417A' of the total IRI forlarger fish 130 to 150 n long. Juvenile fish including chum salmon werepreyed upon by coho les than 129 mm in length.
Crustaceans were eaten y coho earlier in the season in April and May (36to 78','. total IRI), while insects became more important in June (75%,, totalIRI). The gaimnaridean, amphipods Corophium salmonis and Eogamniarusconfervicolus were eaten in large numbers on-y e-a-rly in the season inAKpril a-n--M (33 and 49% total IRI, respectively). Predation on juvenilefish by coho occurred in May. Chironomid flies made up 43%# of the totalIRI in June, and other insects,including terrestrial aphids,comprised32% of the total TRI for coho in June.
Chum. Juvenile chums preyed upon dipteran insects, particularlychi-ronomids, harpacticoid copepocs, gaimmaridean amphipods (primarilyCrophiuin sp.), and calanoid copepods (Figure 14). Chironomids wereconsumed by 61% of all chums examined, harpacticoids by 41K, aphids by26%, Corophium salmonis by 20%, and calanoid copepods by 12%. However,calanoids contributed 54% of all prey items enumerated and 40% of thetotal prey biomass.
The only notable differences in the stomach contents of chums caught atnight and during the day was the occurrence of calanoids. At night,calanoids comprised 31% of the total IRI,while they contributed 0.02;during the day.
An examination of chum diets by size of the fish revealed some definitedifferences. Small chums preyed heavily on insects and epibenthic crus-taceans. At 30 to 39 nm fork length, chironomids contributed 85% of thetotal IRI with harpacticoids making up 10% of the IRI. Calanoids con-tributed little to the diet. Chironomids and harpacticoids continued tobe important with increasing predator size, but contributed less to thetotal IRI. At 50 to 59 mm, numbers of gammnaridean amphipods, particularlyCorophium salmonis, became more significant occurring in 28% of the fish,contributing 13% of the IRI. Large chum, 70 nn and above,preyed extensivelyon calanoids (IRI = 86 to 98%) and very little on insects.
The pattern of monthly prey preferences appears to be similar and relatedto thit exhibited by increasing predator size. This is to he expected asthe mean length of chums increased over the course of th, study. Again,chironomids and harpacticoids were important in Apri I and May, becominginsignificant or absent in July. The Heleidae became important in May(IRI -, 13%). The gammaridean amphipods were prominent in May and June whenCorophium salmonis made up 20% of the IRI. The calanoids increased inimportance from April (IRI = 0.OE%) to July (IRI = 99%) when all the chumssampled had consumed them. However, it should be pointed out that ourJuly sample was relatively small and all chums taken during this monthwere caught at night. As stated earlier, diel food habits indicatedgreater utilization of calanoids at night.
28

INDEX OF RELATIVE IfPORTRNCE (I .R. I -) OIGRRFROM FILE [OENT. OkWAMS. SrArION 0 123
PREOATOR 0755010 0M" - OtCf1HYNCHIJS Kf r#4c ,I11 SA.MON I 141,1|15|I | S0 MILE ;[I/ ;'!-I
ENw ,Pr'im x- S1.7. G.0.-0 17.1 wr. '; x= t.'. ... 4.511
1o.
4-
-20
k!
-40 CL IC j ....C ~G
-30040 .,r, , v.., C t :
-1E0
IW 50 100 ISO 200 250 300 350
CIIKLTIVE FREQUENCY OF OCCURRENCE
FKt,; NLM, 6 kAV. 0 -t: T ParRCEINT
PREY 11lc L uP.". ,.. L?2. I.9(.1. ILIAL Iki
-------------- ---- ---- ------ -----
' O][TERA ?UQ ., L 7. 0 - ! 11;.C4. 4".% . *7 . 1.
H"RPACTIC I)JA 41.4 14 .2ig J?c.2 1.03GAM Iq [UL
, ,. 4 .*. V, ,. IC r, 1? . 1 .40
H01"OPT P A-Alh I DL 6 Lt A ') .- _1. 1.7L _L.2 1.5O
P 1 Y -- =0 1 .>4 .6b 1.1:4 ; . .7bN EM&TOCE RA 14.7;p .105 .%t, ZL, , I. ,(I
NO1GANIC i . '..2
u 1.¢. ' ... 1 .CU "CL ! 12.18 .11, .0? ..e 1
" O40SOPHI!LODEA kL.Jt .31 1.0-I l .J .27COLLR EfWllt!L... . .. 111. :1 .1' . ... 4.1 .06
OLGO1CIIA. A 4..,7 ... .24 ., .10
COLLi PIE, - I ..37L I I., I)I.A. . . -., . 1 -_ .? _ . _ -.
EALANOMORPHA -L .. "". .. . .AC;AJA a..&. 11. o?1 *' *1
NYIIEmIPTE A .. . _ .L 3.2. 4.,
r , ostIE jt. ,..Is i~.,) I.. A:. ,L ,.al'. *~.L tI,tII lL t D I ': i.1..I. .1.1: D'L.I
PEt .Ni . LI r.AL,.L I;,:l. ,L , ., * .,
I 4 A VI -I l L .L ,, L I.' 0.. U II I
Figure 14. IRI diagram and table showing major prey of juvenile chumin the lower Duwamish River, April - July, 1980.
29
.. . S + + l II . . . . . .. . . . . .- .
. . nl r l m
+
i 1 In l +

Changes in diet related to predator s;ize and season could not be separatedfrom one another. It is not known if the observed differences were attri-butable to the increasing size of the predator and, therefore, a change inpreference or, if they result from seasonal changes in the abundance andavailability of prey.
Some differences in chum food habits between stations D1 and D2 were notedwhich, again, are probably related to differences in salinity. Chironomidswere very important at D2 contributing 501 of the total IRI and only 142.'
at Dl. On the other hand, Corophium salmonis contributed 21% of the totalIRI at D1 and only 3% at D2. However, the heleids were very important atD1 (35% of the IRI) but were not even eaten at D2.
Steelhead. Steelhead food habits were less diverse than other salmonidspecies and consisted primarily of epibenthic invertebrates, insects, andjuvenile fish (Figure 15). Neonsis mercedis dominated the overall dietoccurring in 38% of our fish samppes and contributing 66,,' of the IRI.Insects and gammarid amphipods (principally [oganriarus confervicolus) alsomade significant contributions to the diet. Juvenile fish includingsalmonids occurred at lower frequencies but made substantial contributionsto the gravimetric composition of the diet. A surprising amount of sticks,rocks, plant parts, etc, were found in the stomach contents.
When our data were broken down into groups of steelhead caught during theday and at night, N. mercedis increased even further in importance in fishcaught after dark comprising 93% of the IRI. Other prey items contributedlittle to the nighttime samples. Steelhead caught during the day did noteven contain N. mercedis. Juvenile fish were the dominant prey itemsduring the day.
The steelhead samples were divided into two size categories based uponpredator size. Steelhead under 200 mma preyed extensively on insects,N. mercedis, and gammaridean amphipods (Corophium spinicorne, C. salmonis,and Eo.jammarus confervicolus). Fish larger than 200 mm preyed on N. mercedisand juvenile fish. Ten steelhead over 200 nmn were examined and had consumed5 juvenile salmonids (3 chinook and 2 chum) plus 3 unidentified juvenilefish.
Beach seine caught steelhead contained 15 recognizable prey categories(does not include inorganic material and plant parts). They preyed prin-cipally on N mercedis, E2oganarus confervicolus, and juvenile fish.The prey spectrum of purse seine caught steelhead was much lower in diversitybeing comprised of 6 prey groups. Principal prey items were juvenile fishand insects.
Food habits of juvenile steelhead captured at the upstream and downstreamstations did not appear to exhibit significant differences.
Only four cutthroat trout were captured during our study and little canhe said about their food habits. However, they hav been identified in the
30

lt«X Of RELATIVE llf'ORTANCE I I oR o I o I OIAGARM FRIJ1 FILE IOCNT. OWfi!SH. SIATWN U l l.:J
I'REOATUK 8o.':i!>ll lii.JU;~ - SRU1ll :JRttli'Nflll lfffiiNIIOW TROUT I fiOoJU5TfO ::fltl'uo ::tlf = 411
100 LO«HH.M )(: 18lo7, $o0o~ 3"1oS WT.!;ftS X: 0
/II OU~ •• SoUo: !>7o:l4
I 110
110 rD !
40 ....
I 20
..: ~
0
.... i!i -20 w rD !
-40
....
I -60
..: ~
-80
-1000 20 40
.. .. u .. ... c
110 80 100 120
CUI.UITIYE FREQUENCY OF DCCl.IIRENCE
140 160
t l( c. \4 ·•l.t.. G~A\t. r',.:,.. ftA: L r. "T
---0 - _ _ o. ~!.l.t_!__L'l '! _______ ___ _;.,5:_~ ~~-- i_<l~l!..!-~...t!~.-< ·!L-.1...·--·'J•J.AL.l~J--
-.r;~n,------ ----------lT;;;"t--J~-r~--;,,-.t::"t" --~:~~:;;c---
•~oRcA~tc ~~.b7 ~.z1 ~.& 7 •• ~ .• 1.~J liisUT~ a.~ ~ ~ .~, i:-;-J- ---;:·;:-;----y,_;,r;...,:---GA"MA"Inf~ I Zo J\J IO,;J'Y lol o J~ u ,•, ~." 7 TIICtlPfl ~' A ·-- --- - O :Jf -· 2.h j --·-;~•- / -:, ~ t ·-- · · ---: ., j---F l A ru · L l l • •· ~: 1.. •J , J J . 1 , 7 'J _ • • .: t- 1 I • ,. • t l
--..n~:)r'ft;k&-,\rl t iiJt . (Ut.\ :,, 2 :, leJ~ e\. L t· . \ •. H. (HLtlfl f: .-~tYCt -'t :.J,~ ;., (, l., .1! l~• '• , •, 7
--rrn·t~ A- ··-- ·· a • .:;; 1 • 1 ~ .·~r--~: x----.l ll ___ _ DICUTYLt1.•0
:0 ao\.. o .. ! , J!J 7__ .I'• ,~ .• • 7 3
C?STt:Jrufh'f• :;- tt, J.i .,,t ·~ L-.. •J t.'•'- ';.' , .;. 1 SAL"10fltF ..! <o! ~'"'l. . ...,; ,.7 :.. ~).Ht fJ '••' ( .: -:
--sci"~'"L'••~ ., .... . t·-'- ·~•t .. f L,7.'i ··-- ·- ·- · '- ~ i,--- -;b:;-- - ~ .<.J t · .• ; . -. ~~ MCtt •lC !JfYL ; l . t, '-.;\1 4 , 1/ .. , ., ;: ),,.1 h . • ~,. J, .. 'l,
--n-T~IPT. .,t:\· ··-·- ------- -----T.: · - ~T; .... ----;,-c·-· -" ·,- ;~ ; .. -1---'00t~1l.t. · - ·- ·· ·- ·-· l! .. c.. ·"' " ~· ,j :, · . • :· • . "1
P~tY rA' ·' .. il•· ~P~'oJ• . ,(. ( " ' ·(, I I t : .. \t. ',; ;. :. u ' · l.ll .. I lfol 1\f,,} \ , .,.1.\lf' : 111 1( - -- t '"· ]:-U111J\11a .... .1 : o lhl t.~ _, l t tl\ •• l ,.,, ,, • L L .... .; l ~' .-~""':-' )l · l l •' l•lt Vol • f. l,; l .
__ C_d!f..!..~~~ ..!.~ -~~~L_l_ L! ~_I 1 ... ·• . .'; ! .-':.!. ~_•_:' ,o_&_L• _lii "J.'-_UL. _. __ __ ---·---- ·- _ _ 0 __ _
P'ltl~'l ~ • • l,..tJ I'I l ~ o o\ ', l , t 1 t l l. ..
SHAr. ra ,, , -,., tr .. . " I · & 'v•,. . 1 '' F~ t: •l'l t" I. ( ,, ,,t A
. .. J, L ., .r.-
· '•' ! • •• . ,
• 4 I
Figure 15. IRI diagram and table showing major prey of juvenile steelhead in the lower Duwamish River, April - July, 1980.
31

literature as potential salmonid predators (Fresh and Cardwell, 1979). Ofthe four cutthroat examined, one had preyed upon four juvenile fish. Noneof the fish consumed were identified as salmonids.
Eight Pacific staghorn sculpin, another potential salmomid predator, hadtheir stomachs examined. Again, while they did contain juvenile fish, nonewere identified as salmonids.
P ry. Avai I abi it
Epibenthic, benthic, and pelagic invertebrates captured with the planktonpump have been classified into 32 taxonomic groups (Table 8). Abundanceof the various groups was highly variable between sampling periods. Thehigh variability and lack of representative samples int April and May didnot allow direct quantitative comparisonc. or estimates of mnnthly abundance.However, some trends are apparent.
laxoriowic richness was somewhat unifform among the varioum; sampling stations.This mity be partly attributable to contamination ol the sampler from previousstations. Of the 32 taxonomic groups identified in our samples, the rip-rapsite (IDP5) and the upper river site (DP6) yielded representatives from 24and 22 of these groups, respectively. Samples from the other sites containedbetween 17 and 19 taxonomic groups.
The Kellogg Island site (DPi) exhibited very high numbers of epibenthic andbenthic organisms. Hlarpacticoid copepods were very abundant relative toother sites as were Foraminifera. In his study of the honthic community inthe vicinity of Kellogg Island, Leon (1980) found harpacticoids in highestabundance at stations having fine-grained sediments and particularly thoselocated adjacent to tidal marsh veqetation. Benthic nematodes, polychaetes(primarily Manayunkia aestuarine), and oligochaetes were also quite numerousin the fine organic sediment at this site. lecause these animals occurredin such large numbers, other invertebrates such as Corop ium amphipodscomprised a relatively small percentage of the sample. However, moreC!rophiuim- (primarily C. salmonis) were captured at DPI than at any othersite. Leon (1980) surmised that distribution of Co"oJ~hiUI_1 in the Duwaishestuary was related to sediment type and season. The sediment type preferredappeared to be "moderately oxygenated sediments, avoiding the black anoxicmaterial, but also avoiding the sandy sediment where food is apparently,)parse". Relatively few insects were detected in DPI samples. To e\aminethe diversity of epibenthic taxa in the substrate types found at KelloggIsland, several core samples were collected among the marsh vegetation nearthe mean high water mark. These samples contained high numbers of Heleidae.
Samples from the main channel (DF3) contained very few organisms relativeto other sites. The Presence of bottom oriented species in these samplesprobably resulted from animals not flushed from the sampler followingsampling in shallow littoral areas. As expected, pelagic organisms dominated
32
II

to C- 0* ON3 u
,A ~ 001C I I I CAl4) CD~00 0 --0 C00C0CJQ£.4j .00 to J NI ) C I-4S-
o -C -r- -.d Ln Cj 0.
CI~O LJa 0
0
on L ca.4 ()+ U I o
1 * 4D~ C4i. MDC ~ 9 7 ll ~-4 C4-4 -4.- 4
-0 -4
Q.) 0 + d+ a00g 1 1 00 1 00 0 0 0 0
go C - ----- - _ _ _ _ _
0
9a C: m
U- 0.0
41 0 o C3l *l .0 U m0 0 0 0 CV) CDm%00r14 -
I-
TOC La ~cb o I a a a I a alfl0
10 (A ----
0)
43M
up c0.- 4j 0~
M 0 -0 "0 00 = 0Li 0 000 4 0 0 0) 0U 0Of Af V= O4 0 06I
M ,M4 01 S.0 0N 0 c ~0 - -4- tV0 a4 =--( .4 .- 4
oo Ui 4AjoO' 00 0 c)- 0 11 ci > =M cSLA - c1-0 ) 00-c oUXC )1,L - O-. U WU c 3 L L
£03 __ _ _33

OP3 samples, particularly calanoid copepods. Calanoids comprised 65.1"Of the animals collected at this site. Barnacle nauplii (larva) andcyclopoid copepods were also abundant in the main channel.
Station DP4, located under the concrete apron, also contained very feworganisms. Calanoids again dominated samples at this site. The only otherinvertebrates occurring in appreciable quantities were mysids which com-prised 17.5% of our samples. Smaller numbers of polychaetes and gammarideanamphipods (Eoganmiarus confervicolus) were also present.
Epibenthic, benthic and pelagic organisms occurred in samples from the rip-rap site (DP%). Most abundant were polychaetes, harpacticoids, foraminiferansand calanoids. Although our sampler did not capture appreciable numbersof insects, DP5 samples contained higher numbers of chironomids than otherstations.
Samples from the upriver site (DP6) contained high numbers of organismsand ranked second to the Kellogg Island site in sheer numbers. DP6 sampleswere numerically dominated by harpacticoid copepods which made up 74.6%of the animals collected at this site. Benthic worms were also quitenumerous. Again, the high numbers of harpacticoids, nematodes andoligochaetes overshadowed other species. Gammaridean amphipods contributedonly 1.4% of the individuals in these samples but ranked just behindKellogg Island samples in abundarce. Mysids and cumaceans were also presentin appreciable quantities relative to other sites. The location of thissite upstream in lower salinity water probably influenced the species com-position and abundance of certain organisms at this station.
Distribution and availability of chironomid adults, pupae and larvae wasof particular interest because of its importance as salmonid prey. Merrittand Cummins (1978) state that chironomids are found in fresh, marine, andbrackish waters. We were not able to identify any chironomids to speciesand were not able to determine which of these groups was being preyed upon.Our plankton pump samples contained low numbers of chironomids exceptat the rip-rap site. Marine chironomids are found in association withalgal vegetation in rocky beaches as well as muddy boitoms (Morley and Ring,1972). In order to better define the distribution of chironomids and otherimportant salmonid prey in the Duwamish estuary, additional invertebratestudies should be conducted. These studies should utilize various samplingtechniques to define invertebrate distribution in relation to tidal height,salinity gradients, bottom composition, algal and marsh vegetation andseason.
34

SUMMARY AND CONCLUSIONS
Fish Distributiont
Juvenile salmonids were found to utilize the lower Duwanish River inappreciable numbers from mid-April through early June. Periods of peakabundance are probably related to releases from artificial enhancementfacilities. Length of residency varies considerably between species withchinook and chum present for the longest period in the study area. Althoughwe do not have residency estimates, these conclusions are collaborated byother studies which have documented chinook and chum rearing in estuarineareas for periods of up to two months (Reimers, 1971; Levy et al., 1979;and Healey, 1979). Coho and steelhead appeared to spend much less timein the estuary, moving through fairly rapidly in schools.
Juvenile salmonids utilized both shallow nearshore and deeper water habitatsof the lower Duwamish River. There are species differences in the use ofthese areas. As expected, chum were highly oriented toward shallowshoreline areas. They were rarely captured in the mid-channel (deep waterhabitat). Juvenile chum orientation toward shallow shorelines has beendocumented in Puget Sound and Hood Canal, Washington by Fresh et al. (1979)and Bax et al. (1978), respectively. However, we did not note thegradual offshore movement with increasing size or time which they reported.This may be due to differences in study area sampling gear, or chum earlylife history strategies.
Chinook were captured frequently in both shallow and deep water habitats.Less can be said about their habitat preference from this study and fromthe existing literature. However, magnitude of beach seine catches relativeto what was taken in purse seines indicates considerable use of shorelineareas. Chinook distribution is also influenced by size. Chinook capturedin purse seines were significantly larger than those caught in beach seinesindicating greater use of shallow shorelines by smaller fish. Chinookalso appeared to move inshore at night.
Coho and steelhead were captured in both shallow and deep water habitats.Little can be said about their preferences although it is likely thatthese relatively large juveniles readily move between habitats.
Mean length of chum and chinook showed definite increases between April andJuly. We could not determine if these increases were due to growth whileresiding in the study area or immigration of fish from upstream areas.Some of the previously cited studies (Reimers, 1971; Levy et al., 1979; andHealey, 1979) have documented appreciable growth in estuarine areas bythese two species.
35
-' . .-

Food Habits
Juvenile salmonids preyed upon epibenthic and pelagic plankton, insects,and, to a small extent, on other fish. Principal prey items varied inimportance for each species between daylight and darkness, nearshore andoffshore habitats, upstream and downstream sites (greater salinity at thedownstream station), predator size and season. In general, epibenthiccrustaceans tended to be more important at night while pelagic crustaceans,insects and, to some extent, juvenile fish were more important to salmoniddiets during the day. Salmonids which were caught nearshore had preyed onepibenthic invertebrates and, to a small extent, on juvenile fish, whilesalmonids caught in mid-channel preyed primarily on pelagic organisms.Marine species were the primary food items at the downstream station whilechironomid flies and freshwater organisms made a greater contribution atthe upstream site. Epibenthic invertebrates and chironomids were moreimportant to smaller sizes of salmonids while larger individuals consumedmore planktonic prey and showed minor predation on juvenile fish. Monthlyfood habits generally paralleled and were related to the food habitsobserved for increasing predator size.
Epibenthic organisms which were consumed in appreciable numbers by salmonare the gammaridean amphipods Corophium salmonis and Eogammarus confervicolusand harpacticoid copepods. Steelhead preyed heavily on the epibenthicmysid Neomysis mercedis. Calanoid copepods are pelagic organisms whichwere important to salmon diets. Chironomid flies are another very importantprey to salmonids. The larvae of these insects would be epibenthic inhabitat, while the adult insects are probably eaten from the water's surface.
PreyAvailability
Availability of salmonid prey over various substrate types was highlyvariable not only between sites but also between sampling dates at thesame site. Although quantitative comparisons were not made, it was evidentthat differences in abundance between sites was quite large.
The two soft bottom sites (DPI and DP6) exhibited extremely high numbersof benthic and epibenthic invertebrates, particularly harpacticoid copepods.Corop_hium amphipods were also found in greatest numbers at these twosites. Insects, while not occurring in large quantities, were present.Samples from the rip-rap site also contained most of the other preyorganisms consumed by salmonids, although in abundances apparently belowthose found at the soft bottom sites.
The mid-channel site (DP3) was low in abundance of all potential salmonidprey except pelagic calanoid copepods. The presence of pelagic stages ofsome juvenile crustaceans was unique to this site. The site located underthe concrete apron was also relatively low in abundance of prey organismsexcept calanoid copepods and mysids. Some gammarid amphipods, such asEogammarus confervicolus, were collected at this site.
36
!J
t/
Finally, the soft fine-grained sedimnent sites would appear to presentthe greatest abundance of preferred prey organisms. The rip-rap sitesampled in this study did exhibit many prey organisms including chironomidflies which were a very important dietary item to chum and small chinook.Rip-rap differing from our rip-rap sample site by not containing moderateamounts of sand and gravel patches probably would not contain significantnumbers of many of the epibenthic invertebrates, particularly harpacticoidcopepods and Corophium amphipods. Areas under concrete aprons where littlenatural light penetrates do not appear to be productive feeding areas.
37
I° I

LITERATURE CITED
Ames, J.A. and D.E. Phinney. 1977. 1977 Puget Sound summer-fall chinookmethodology: Escapement estimates and goals, run size forecasts,and in-season run size updates. State of Wash., Dept. of Fish.,Tech. Rept. No. 29, P. 71.
Bax, N.J., E.O. Salo, B.P. Snyder, C.A.Simenstad, and W.J. Kinney. 1978.Salmonid outmigration studies in Hood Canal. Final Rept., Phase Il,January to July 1977. Univ. of Wash., Fish. Res. Inst., FRI-UW-7819.pp. 128.
Bostick, W.E. 1955. Duwamish River seining studies. In Puget SoundStream Studies, Progress Rept. July - Nov. 1953. Wash. Dept of Fish.
Congleton, J.L. 1978. Feeding patterns of juvenile chum salmon in theSkagit River salt marsh. Fish Food Habits Studies, Proceedings ofthe Second Pacific Northwest Tech. Workshop. Ed. by Lipovosky andSimenstad. p. 141-150.
Dawley, E.M., C.W. Sims, R.D. Ledgerwood, D.R. Miller, F.P. Thrower. 1979.A study to define the migrational characteristics of chinook andcoho salmon and steelhead trout in the Columbia River estuary.Annual Rept. 1978, Project 712. National Marine Fish. Serv.
Dunford, W.E. 1975. Space and food utilization by salmonids in marshhabitats of the Fraser River estuary. M.S. thesis, Univ. of BritishColumbia. p. 81.
Elliott, J.M. 1972. Rates of gastric evacuation in brown trout, Salmotrutta L. Freshwater Biology 2:1-18.
Fresh, K.L. and R. Cardwell. 1979. Salmon-herring predator/competitorinteractions (Phase I). Report to Pacific Northwest Regional Conission.Wash. Dept. of Fish.
Fresh, K.L., D. Rabin, C. Simenstad, E.O. Salo, K. Garrison, and L. Matheson.1979. Fish ecology studies in the Nisqually Reach area of southernPuget Sound, Washington. Univ. of Wash., Fish. Res. Inst. FRI-LU-7904.p. 229.
Healey, M.C. 1979. Detritus and juvenile salmon production in the NanaimoEstuary: 1. Production and feeding rates of juvenile chum salmon.Pacific Biol. Sta., Fish. and Mar. Serv., Dept. of Fish, and theEnvironment, Journal of the Fish. Res. Bd. of Canada 36:488-496.
Johnson, F.C. 1973. Potential interspecific problems between hatcherycoho smolts and juvenile pink and chum salmon. Wash. Dept. Fish.,Management and Research Division, p. 40.
38

Leon, H. 1980. Terminal 107 environmental studies benthic communityimpact study for Terminal 107 (Kellogg Island) and vicinity. Pre-pared for Port of Seattle by Pacific Rim Planners, Inc. p. 98.
Levy, D.A., T.G. Northcote and G.J. Birch. 1979. Juvenile salmon utiliza-tion of tidal channels in the Fraser River estuary, British Columbia.Westwater Res. Ctr., Tech. Rept. No. 23, Nov., 1979. Univ. of B.C.p. 70.
Mason, J.C. 1974. Behavioral ecology of chum salmon fry in a smallestuary. Fish. Res. Bd. of Canada 31(1) p. 83.
Matsuda, R.I., G.W. Isaac, and R.D. Dalseg. 1968. Fishes of the Green-Duwamish River. Water Quality Series No. 4, Municipality ofMetropolitan Seattle. p. 38.
Merritt, R.W. and K.W. Cummins. 1978. An introduction to the aquaticinsects of North America. Kendall/Hunt Publishing Co. p. 441.
Morley, R.L. and R.A. Ring. 1972. The intertidal Chironomidae (Diptera)of British Columbia. II. Life history and population dynamics.Can. Ent. 104:1099-1121.
Pinkds, L., M.S. Oliphant and I.L.K. Iverson. 1971. Food habits ofalbacore, bluefin tuna, and bonita in California waters. Calif.Fish and Game, Fish. Bull. 152:1-105.
Reimers, P.E. 1971. The length of residence of juvenile fall chinooksalmon in Sixes River, Oregon. PH.D. Thesis, Ore. St. Univ. p. 99.
Sibert, J., T.J. Brown, M.C. Healey, B.A. Kask, and R.J. Naimon. 1977.Detritus-based food webs: Exploitation by juvenile chum salmon(Oncorhynchus keta). Science, May 1977, p. 649-650.
Simenstad, C.A. and W.J. Kinney. 1978. Trophic relationships ofoutmigrating chum salmon in Hood Canal, Washington, 1977. Univ. ofWash., Fish. Res. Inst. FRI-UW-781I. p. 75.
Smith, J.E. 1977. A baseline study of invertebrates and of the environ-mental impact of intertidal log rafting on the Snohomish Riverdelta. Univ. of Wash., Cooperative Fish. Res. Unit.
Weitkamp, D.E. In press. 1980 juvenile salmonid study. Prepared for thePort of Seattle by Parametrix, Inc.
Weitkamp, D.E. and R.F. Campbell. 1979. Port of Seattle Terminal 107fisheries study. Draft report, Parametrix, Inc., DocumentNo. 79-1120-034FD.
39

APPENDIX
40
IA
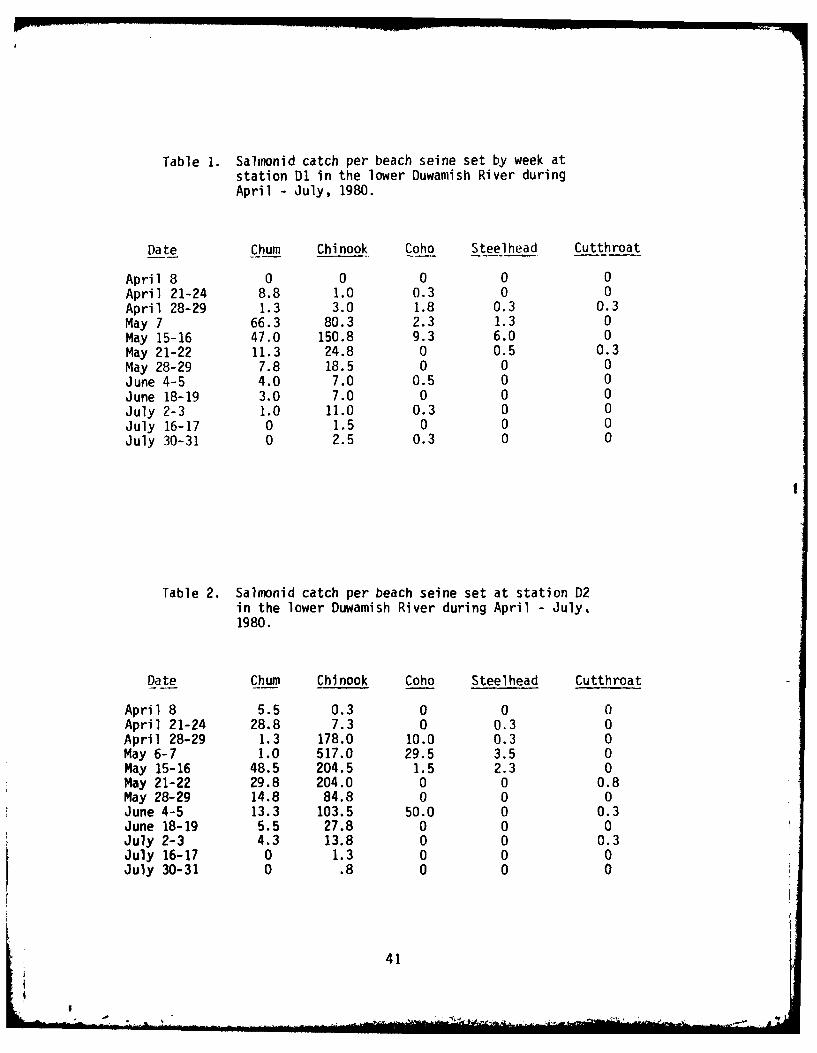
Table 1. Salmonid catch per beach seine set by week atstation D1 in the lower Duwamish River duringApril - July, 1980.
Date Chum Chinook Coho Steelhead Cutthroat
April 8 0 0 0 0 0April 21-24 8.8 1.0 0.3 0 0April 28-29 1.3 3.0 1.8 0.3 0.3May 7 66.3 80.3 2.3 1.3 0May 15-16 47.0 150.8 9.3 6.0 0May 21-22 11.3 24.8 0 0.5 0.3May 28-29 7.8 18.5 0 0 0June 4-5 4.0 7.0 0.5 0 0June 18-19 3.0 7.0 0 0 0July 2-3 1.0 11.0 0.3 0 0July 16-17 0 1.5 0 0 0July 30-31 0 2.5 0.3 0 0
Table 2. Salmonid catch per beach seine set at station D2in the lower Duwamish River during April - July,1980.
Date Chum Chinook Coho Steelhead Cutthroat
April 8 5.5 0.3 0 0 0April 21-24 28.8 7.3 0 0.3 0April 28-29 1.3 178.0 10.0 0.3 0May 6-7 1.0 517.0 29.5 3.5 0May 15-16 48.5 204.5 1.5 2.3 0May 21-22 29.8 204.0 0 0 0.8May 28-29 14.8 84.8 0 0 0June 4-5 13.3 103.5 50.0 0 0.3June 18-19 5.5 27.8 0 0 0July 2-3 4.3 13.8 0 0 0.3July 16-17 0 1.3 0 0 0July 30-31 0 .8 0 0 0
41
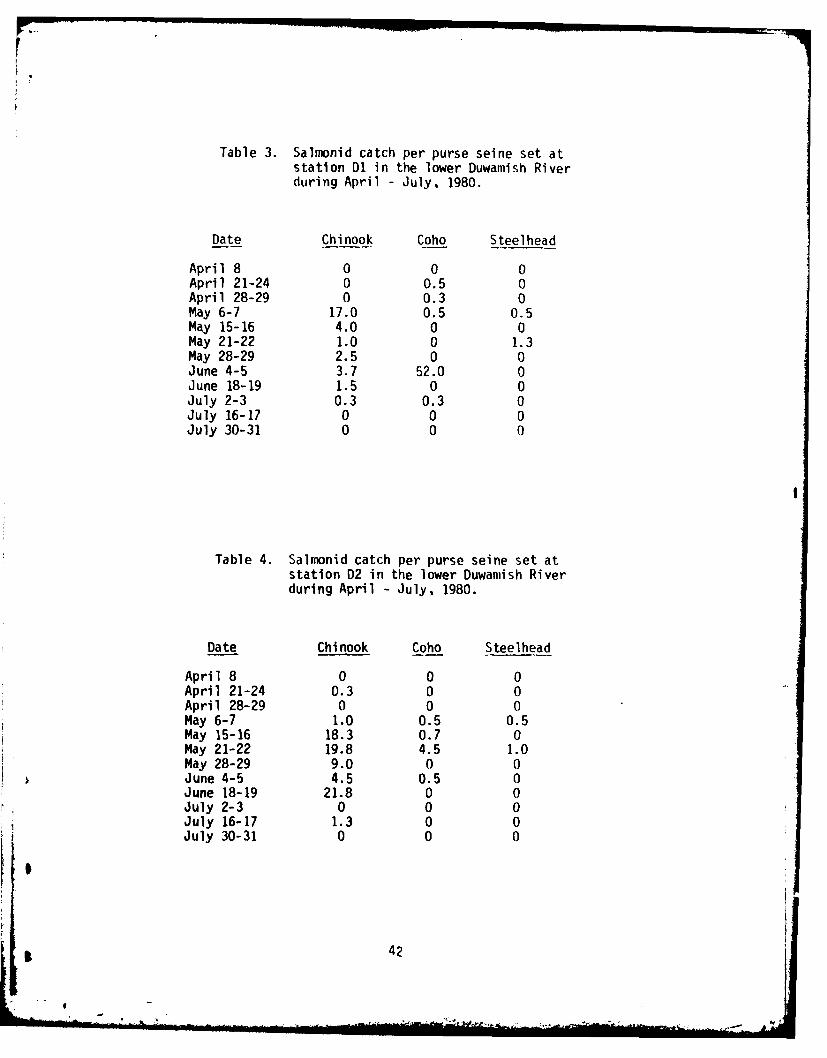
Table 3. Salmonid catch per purse seine set atstation D1 in the lower Duwamnish Riverduring April - July, 1980.
Date Chinook Coho Steel head
April 8 0 0 0April 21-24 0 0.5 0April 28-29 0 0.3 0May 6-7 17.0 0.5 0.5May 15-16 4.0 0 0May 21-22 1.0 0 1.3May 28-29 2.5 0 0June 4-5 3.7 52.0 0June 18-19 1.5 0 0July 2-3 0.3 0.3 0July 16-17 0 0 0July 30-31 0 0 0
Table 4. Salmonid catch per purse seine set atstation D2 in the lower Duwamish Riverduring April - July, 1980.
Date Chinook Coho Steelhead
April 8 0 0 0April 21-24 0.3 0 0April 28-29 0 0 0May 6-7 1.0 0.5 0.5May 15-16 18.3 0.7 0May 21-22 19.8 4.5 1.0May 28-29 9.0 0 0June 4-5 4.5 0.5 0June 18-19 21.8 0 0July 2-3 0 0 0July 16-17 1.3 0 0July 30-31 0 0 0
* 42
S .f- -f