
Juvenile salmon survival through The Dalles Dam spillway ...
91
RELATIVE SURVIVAL OF JUVENILE SALMON PASSING THROUGH THE SPILLWAY AND THE ICE AND TRASH SLUICEWAY OF THE DALLES DAM, 1998 by Earl M. Dawley Lyle G. Gilbreath Randall F. Absolon Benjamin P. Sandford and John W. Ferguson Report of Research by U.S. Army Corps of Engineers Portland District P.O. Box 2946 Portland, OR 97208-2946 Contracts MIPR E96970020, W66QKZ82167243, and W66QKZ83437725 and Fish Ecology Division Northwest Fisheries Science Center National Marine Fisheries Service National Oceanic and Atmospheric Administration 2725 Montlake Boulevard East Seattle, WA 98112-2097 August 2000
Transcript of Juvenile salmon survival through The Dalles Dam spillway ...

RELATIVE SURVIVAL OF JUVENILE SALMON PASSING THROUGH THE SPILLWAY AND THE ICE AND TRASH SLUICEWAY
OF THE DALLES DAM, 1998
by
Earl M. Dawley Lyle G. Gilbreath
Randall F. AbsolonBenjamin P. Sandford
andJohn W. Ferguson
Report of Research
by
U.S. Army Corps of EngineersPortland DistrictP.O. Box 2946
Portland, OR 97208-2946Contracts MIPR E96970020, W66QKZ82167243,
and W66QKZ83437725
and
Fish Ecology DivisionNorthwest Fisheries Science CenterNational Marine Fisheries Service
National Oceanic and Atmospheric Administration2725 Montlake Boulevard East
Seattle, WA 98112-2097
August 2000

ii

EXECUTIVE SUMMARY
High rates of spill are presumed to increase passage survival for juvenile salmonidmigrants, because passage survival through spillways at Columbia and Snake River dams isgenerally higher than through turbines. However, there are two conditions at The Dalles Damthat may decrease spill-passage survival under high spill rates: 1) a short stilling basin combinedwith a shallow tailrace, which results in severe turbulence and lateral currents that may causephysical injury to migrant salmon; and 2) a large proportion of water passed through the spillwaymoves through shallows and islands downstream, and thus may substantially increase predationon salmonids by gulls (Larus spp.) and northern pikeminnow (Ptychocheilus oregonensis).
In 1997, the National Marine Fisheries Service initiated a study at The Dalles Dam toevaluate survival of juvenile Pacific salmon (Oncorhynchus spp.) passed through the spillwaywhen 64% of the river flow was spilled. Results of 1997 tests suggested mortality rates of about13% for coho salmon (O. kisutch) and 8% for subyearling chinook salmon (O. tshawytscha)passing at 64% spill. In 1998, we expanded the research to include assessment of passagesurvival through the spillway at high spill (64% of river flow) and moderate spill (30% of riverflow) and through the ice and trash sluiceway during daytime periods at moderate spill (30% ofriver flow).
Test fish were collected from the juvenile bypass system at the Bonneville Dam SecondPowerhouse, tagged with passive integrated transponder (PIT) tags, and transported to The DallesDam for release. Approximately 64,000 yearling coho salmon were tagged in April and May,and 80,000 subyearling chinook salmon were tagged in June and July. Nearly equal portions(20% each) of these fish were released through the spillway at 64% spill, the spillway at 30%spill, and the sluiceway at 30% spill; about 40% were released in the tailrace as survivalreference groups.
The tailrace groups were released at a site away from turbulence and areas of suspectedpredation and at a time to coincide with passage of treatment groups. The spillway releases weredivided into daytime and nighttime releases and apportioned as equally as possible to fourquadrants of the spillway during spring tests and to three thirds of the spillway during summertests. Spill rates were alternated daily between 30 and 64% of the river flow.
After migrating through the 75-km reservoir below The Dalles Dam, a portion of the testfish passed through the PIT-tag interrogation equipment located in the juvenile fish bypasssystems at Bonneville Dam. About 12.0% of the coho salmon and 4.8% of the subyearlingchinook salmon released at The Dalles Dam were interrogated in bypass systems at BonnevilleDam. An additional 4.9% of coho salmon and 1.1% of subyearling chinook salmon wereinterrogated in the estuary, either at Jones Beach [Columbia River Kilometer (RKm) 75] usingthe PIT-tag detector trawl or at the Caspian tern (Sterna caspia) rookery on Rice Island(RKm 35).

iv
Relative survival for passage at 64% spill was 89% for coho salmon (CI 82-96%) and75% for subyearling chinook salmon (CI 68-83%). These survival rates were substantially lower than survival at 30% spill, where coho salmon survived at 97% (CI 88-107%) and subyearlingchinook salmon at 89% (CI 80-99%). The difference between passage survival at 64% andpassage survival at 30% was insignificant for coho salmon and significant for subyearlingchinook salmon. Relative survival for sluiceway passage was 96% for coho salmon(CI 87-105%) and 89% for subyearling chinook salmon (CI 81-98%), and these rates did notdiffer appreciably from those of spillway passage at 30% spill. Spillway passage survival ofcoho salmon and subyearling chinook salmon appeared to decline through the period of testing.Nighttime passage of subyearling chinook salmon produced substantially higher relative survivalthan daytime passage, but the difference was not significant.
Travel times to Bonneville Dam averaged 1.8 days for both spring and summer migrants,but were consistently less for tailrace reference groups than for spillway groups (0.15 days lessfor coho salmon and 0.08 days less for chinook salmon). Based on radiotelemetry data from1997, we speculated that fish exiting the spillway were delayed during migration past Bridge andBasin Islands on the south side of the river downstream from the dam.
Point estimates of survival were designed to represent passage survival of mixed fishstocks throughout the migration period during daytime (adult) and nighttime (juvenile) spillpatterns, through spillbays across the width of the spillway, and at ambient spill-gate openings,river flows, tailwater elevations, and water temperatures. Variation among survival estimates forindividual releases was high. We compared actual detection data to a simulated binomialdistribution of detection proportions for relative spillway passage survival. Based on thisanalysis, it appeared that variability in relative survival for coho salmon was within the expectedranges, and variability in the observed data for subyearling chinook salmon was somewhatgreater than would be expected in a binomial distribution. However, we believe that thevariation associated with the observed survival estimates was greater than that attributable to abinomial distribution because of the many uncontrolled variables identified above.
Tests of passage distribution homogeneity at Bonneville Dam for correspondingspillway-, sluiceway-, and tailrace-released groups of coho salmon and subyearling chinooksalmon suggested that daily release groups were not mixed on 3 of 50 test dates. For these threegroups, all of which were subyearling chinook salmon groups, spillway-released fish weredelayed about 1 day. However, because of the rapidity with which single groups passedBonneville Dam (average 3 and 2.4 days for 80% passage of spring and summer test fishrespectively), we believe there was no systematic error imparted to the relative survival data dueto temporal changes in dam operations.
Relative survival estimates calculated from PIT-tag detections at Bonneville Dam wereconsistently lower than those calculated from detections at Rice Island; data were combined for analyses. We have deferred evaluation of these differences until multiple years of data areavailable for assessment.

v
From the 2 years of study, results that appear important to operations at The Dalles Damare as follows:
1) Detection rates of fish passing through the spillway at 64% spill were significantly lessthan those of fish released downstream from the dam.
2) Estimated spillway passage survival for juvenile salmon at 64% spill was lower than atother dams and similar to or lower than survival expected for turbine passage at TheDalles Dam (spring flows ranged from 5,099 to 14,929 m3/second (180,000 to527,000 ft3/second) and summer flows ranged from 4,447 to 14,986 m3/second (157,000to 529,000 ft3/second).
3) Estimated relative survival rates for fish passing at 30% spill were substantially higherthan for fish passing at 64% spill.
4) Relative survival for daytime fish passage through the sluiceway at 30% spill was similarto that of daytime fish passage through the spillway at 30% spill (one year of testing).
5) Spillway passage of subyearling chinook salmon during daytime hours with adult spillpatterns produced substantially lower survival than passage during nighttime hours withjuvenile spill patterns.
6) Evaluation of survival in relation to tailwater elevation, spill volume, river flow, andwater temperature indicated poor correlations for both spring and summer tests.
We recommend continued testing of 30 vs. 64% spill rates during spring and summer fishmigrations, followed by testing of a constant rate of spill (less than 64%) with a 24-hour/dayjuvenile fish pattern comparing spillway vs. sluiceway releases. Additionally, recovery andevaluation of PIT tags deposited in estuarine bird rookeries should be continued so as to provideincreased detection numbers, and comparisons of survival rate differences among detection sitesshould also be continued. To maintain sufficient detections at Bonneville Dam SecondPowerhouse, we also recommend minimal use of the sluice chute.
vi
CONTENTS
EXECUTIVE SUMMARY . . . . . . . . . . . . . . . . . . . . . . . . . . . . . . . . . . . . . . . . . . . . . . . . . . . . . iii
INTRODUCTION . . . . . . . . . . . . . . . . . . . . . . . . . . . . . . . . . . . . . . . . . . . . . . . . . . . . . . . . . . . . . 1
METHODS . . . . . . . . . . . . . . . . . . . . . . . . . . . . . . . . . . . . . . . . . . . . . . . . . . . . . . . . . . . . . . . . . . 4Test Conditions . . . . . . . . . . . . . . . . . . . . . . . . . . . . . . . . . . . . . . . . . . . . . . . . . . . . . . . . . 5Release Methods, Locations, and Times . . . . . . . . . . . . . . . . . . . . . . . . . . . . . . . . . . . . . . 5PIT-tag Detections . . . . . . . . . . . . . . . . . . . . . . . . . . . . . . . . . . . . . . . . . . . . . . . . . . . . . . . 8Test Fish . . . . . . . . . . . . . . . . . . . . . . . . . . . . . . . . . . . . . . . . . . . . . . . . . . . . . . . . . . . . . . . 8Data Analyses . . . . . . . . . . . . . . . . . . . . . . . . . . . . . . . . . . . . . . . . . . . . . . . . . . . . . . . . . . 9
RESULTS . . . . . . . . . . . . . . . . . . . . . . . . . . . . . . . . . . . . . . . . . . . . . . . . . . . . . . . . . . . . . . . . . . 12Spring Migration, Coho Salmon . . . . . . . . . . . . . . . . . . . . . . . . . . . . . . . . . . . . . . . . . . . 12
Variability Associated With the Experimental Process . . . . . . . . . . . . . . . . . . . . 16Summer Migration, Subyearling Chinook Salmon . . . . . . . . . . . . . . . . . . . . . . . . . . . . . 28
Survival Estimates . . . . . . . . . . . . . . . . . . . . . . . . . . . . . . . . . . . . . . . . . . . . . . . . 28Variability Associated With the Experimental Process . . . . . . . . . . . . . . . . . . . . 31Comparison with 1997 Results and Trends for Combined Data . . . . . . . . . . . . 36
DISCUSSION . . . . . . . . . . . . . . . . . . . . . . . . . . . . . . . . . . . . . . . . . . . . . . . . . . . . . . . . . . . . . . . 42
RECOMMENDATIONS . . . . . . . . . . . . . . . . . . . . . . . . . . . . . . . . . . . . . . . . . . . . . . . . . . . . . . . 44
ACKNOWLEDGMENTS . . . . . . . . . . . . . . . . . . . . . . . . . . . . . . . . . . . . . . . . . . . . . . . . . . . . . . 45
REFERENCES . . . . . . . . . . . . . . . . . . . . . . . . . . . . . . . . . . . . . . . . . . . . . . . . . . . . . . . . . . . . . . 46
APPENDICES . . . . . . . . . . . . . . . . . . . . . . . . . . . . . . . . . . . . . . . . . . . . . . . . . . . . . . . . . . . . . . . 48Appendix A: Release Numbers, Dates, Times, Locations,
and Conditions for Juvenile Coho and Subyearling Chinook Salmon at The Dalles Dam in 1998 . . . . . . . . . . . . . . . . . . . . . . . . . . . . . . . . . . . . . . . . . 48
Appendix B Statistical Analyses of Pit-Tag Interrogation Data, Fork Length Data, and Passage Condition Data in Relation to Relative Survival for The Dalles Dam Juvenile Passage Survival Study . . . . . . . . . . . . . . . . . . . . . 66
INTRODUCTION
Based on the 1995 National Marine Fisheries Service (NMFS) Biological Opinion, theU.S. Army Corps of Engineers (COE) has selected the spillway as the best passage route forjuvenile salmon (Oncorhynchus spp.) at The Dalles Dam (NMFS 1995). Spill rates wereincreased to 64% of river flow to attain 80% fish passage efficiency (FPE). This high volume ofspill at The Dalles Dam produces levels of total dissolved gas (TDG) which are lower than thoseproduced at other dams with similar spill rates. High volumes of spill at The Dalles Dam during1996 produced levels of TDG which were less than 120% of saturation, the maximum approvedby the state water quality agencies. Because TDG is not a factor that limits use of spill at TheDalles Dam, implementation of other alternatives for increasing FPE, such as the use of surfacecollectors or turbine-intake screens with an upgraded sluiceway or bypass system, were deferredin lieu of increased spill.
However, observations at The Dalles Dam and at the COE Waterways ExperimentStation (WES) model of the dam have raised concerns about passage survival of juvenilesalmonids during high spill. Heavy turbulence, back eddies, and sideways flow in the spillwaystilling basin may cause injury to fish, and water flows passing through the Bridge Islandsdownstream from the dam may cause higher-than-expected mortality due to predation (Fig. 1). Substantial predation by northern pikeminnow (Ptychocheilus oregonensis) and gulls (Larusspp.) is suspected in the reef and islands area, based upon northern pikeminnow abundance andstomach-content evaluations (Hansel et al. 1993, Ward et al. 1995) and upon observations ofsalmonid smolts carried off by gulls (Jones et al. 1997; John Snelling, Oregon CooperativeFisheries Research Unit, Oregon State University, Corvallis OR 97331-1961, Pers. commun.,November 1997). Balloon-tag tests conducted in 1995 (Normandeau Associates et al. 1996)corroborated concerns that heavy turbulence in the spillway stilling basin might cause higher-than-acceptable mortality.
In 1996, we began discussions with the COE on means to test the premise that high spilllevels at The Dalles Dam produce high passage survival of migrating juvenile salmonids. Tagsavailable for a comprehensive assessment of spill passage survival at The Dalles Dam were1) balloon tags, 2) coded-wire tags, and 3) passive integrated transponder (PIT) tags. Balloontags are appropriate to evaluate immediate and direct injury and mortality from shear currentsand high-velocity collisions during dam passage, but not for evaluation of indirect mortality frompredation during passage through the tailrace and downstream reservoir. Coded-wire-tagtechnology provides the ability to effectively evaluate both direct and indirect mortality;however, results are dependent on adult returns, and thus the number of fish necessary for thestudy would be unacceptably large (hundreds of thousands). Therefore, we selected PIT tagsbecause they provided the only method to evaluate both direct and indirect mortality usingfeasible numbers of test fish.

2
Figure 1. Overview of The Dalles Dam and tailrace area. Spillway-, sluiceway-, and reference-group release locations used in the1998 evaluation of relative survival of juvenile coho salmon and subyearling chinook salmon are shown, as well as theposition of the main channel in relation to the shallow island areas downstream from the dam.

3
In 1997, our study objective was to estimate the relative survival of juvenile coho salmon(O. kisutch) and subyearling fall chinook salmon (O. tshawytscha) passing through The DallesDam spillway when 64% of river flow passed through the spillway. Data collected in 1997 from releases of approximately 43,000 coho salmon and 53,000 subyearling chinook salmon suggestedlosses of about 13 and 8% respectively for passage through the spillway when spill volume was64% of river flow (Dawley et al. 1998).
In 1998, we expanded the research to include assessment of passage survival through thespillway at high spill (64% of river flow) and moderate spill (30% of river flow) and through theice and trash sluiceway during periods of moderate spill (30% of river flow). Point estimates ofdam passage survival were calculated for juvenile salmon during the spring and summermigration periods. Estimates were based on PIT-tag detections at downstream sites, anddetection percentages of treatment groups released in front of the spillway or sluiceway werecompared to those of reference groups released downstream from the dam, thus providingrelative survival estimates.

4
METHODS
We captured run-of-the-river juvenile coho and subyearling fall chinook salmon 5 to7 days/week at the Bonneville Dam Second Powerhouse in late April/early May and lateJune/early July, respectively. Some subyearling chinook salmon were captured later in July atMcNary Dam. We PIT tagged 300 to 5,100 fish daily and divided them proportionally amongtreatment and reference groups. Tagged fish were then transported to The Dalles Dam[Columbia River Kilometer (RKm) 308] and held for 1 day before release upstream fromselected spillbays (treatment groups) or in the midstream area of the tailrace (reference groups). Subsequently, PIT-tag detections from the juvenile bypass systems at Bonneville Dam First andSecond Powerhouses (RKm 235), from the Jones Beach PIT-tag trawl (RKm 75), and from theRice Island tern rookery (RKm 35) were used to determine relative survival rates of the treatmentgroups in relation to reference groups.
Generally, juvenile salmon for each day of marking were captured during a 12- to 24-hourperiod from the fish bypass system at Bonneville Dam Second Powerhouse. As migrants passedout of the bypass collection channel, they slid across a dewatering screen onto horizontal barspositioned to separate juvenile salmon from larger fish and debris. Upon separation, juvenile fishand water were directed through a 25-cm (diameter) PIT-tag detector tunnel to a two-way slidegate. The gate passed PIT-tagged fish to the downwell and back to the river, but diverted non-tagged fish through a 20-cm pipe to the juvenile fish sampling room (Dawley et al. 1998). At thesampling room, fish were collected in 91-cm-wide by 5.5-m-long by 86-cm-deep raceways andheld for marking.
In early July, low river flows resulted in minimized operation of the second powerhouseand insufficient collections of subyearling chinook salmon for our tests. Beginning 9 July, withthe appropriate authorizations, we obtained fish for marking from the smolt monitoring facility atMcNary Dam. Fish were collected in early morning hours and immediately transported by truckto Bonneville Dam for marking that day. Ice was used to maintain water temperature duringtransport, and water temperatures in the transport tanker never increased.
Marking commenced at about 0800 hours. After fish were anesthetized, target fish weresorted and electronically scanned for PIT tags. Individual sterile hypodermic syringes with12-gauge needles were used to inject glass-coated, cylindrical tags, 2.1 by 10 mm, into thevisceral cavity of each test fish (Prentice et al. 1990). Fish destined for treatment and referencegroups were tagged in equal portions, and tagging personnel alternated between groups severaltimes daily. Non-target fish and the occasional PIT-tagged target fish (which was not divertedback to the river at the slide gate) were allowed to recover from anesthetic and were then releasedinto the downwell connected to the bypass egress conduit.

5
Tagged treatment and reference groups were placed in 800-L insulated aluminum holdingtanks. After loading a maximum of 1,300 coho salmon (<40 g/L holding density; assuming 23 gaverage fish weight) or 1,600 subyearling chinook salmon (<25 g/L holding density; assuming10.5 g. average fish weight), the containers were maintained with flow-through water at about45 L/minute until transport.
Generally, holding tanks were transported by truck to The Dalles Dam in early evening. During the 1-hour transport, a small amount of oxygen was metered into tanks through air stones. When water temperatures approached 20oC, ice was added to each tank to prevent furtherincreases during transport. At The Dalles Dam, water was distributed to each tank at a rate ofabout 45 L/minute. Fish were generally held until the following morning or the following night,then released. Before release, tanks were inspected for mortalities and loose PIT tags. Tankswere then gently loaded onto trucks, supplied with oxygen, and taken to the sluiceway, spillwayor tailrace.
Test Conditions
Tests were designed to evaluate passage survival at spill levels of 64 and 30% of riverflow alternating daily; however, the spill rates varied + 2% with two exceptions: one test wasconducted at 61% spill, and another at 41% spill (Appendix Tables A1-A4). Passage conditionsthrough each spillbay were different and changed through time in association with changes inriver flow and hour of the day. Spill gate openings varied for each spillbay based on theestablished spill patterns (COE 1997) developed to maximize juvenile salmon survival duringnighttime migration (juvenile spill pattern utilized from 2001 to 0500 hours; wherein spill isgreatest on the north side of the spillway) without disrupting adult fish passage during the day(adult spill pattern utilized from 0500 to 2000 hours; wherein spill is less at 3 or 4 north andsouth end spillbays and crowned in the center bays). For these tests, flow patterns and normaloperation criteria, other than percent of spill, were not altered.
Test fish releases were distributed throughout the duration of the mid-Columbia andSnake River yearling chinook salmon migration. Releases were made at the beginning and peakof the subyearling chinook migration period from above Bonneville Pool, although not at the endof the migration period due to high ambient water temperature. The experimental design calledfor about half the spill-passage test fish to be released during daylight and half during darkness,whereas the sluiceway-passage groups were released exclusively during daylight hours.
Release Methods, Locations, and Times
Daily releases were made during 1- to 4-hour periods from 28 April to 4 June for cohosalmon and from 23 June to 24 July for subyearling chinook salmon. To allow for coincidentalpassage through the river downstream from the dam, sluiceway groups were released first,

6
followed by spillway groups about 15 minutes later, and tailrace (reference) groups after anadditional 10 minutes. Daily releases generally alternated between daylight and dark periodsthroughout both tests. All fish groups were released directly from the containers used for holdingand at an elevation of about 0.5 m above the water surface; sluiceway and spillway groups werelowered by crane, and tailrace groups were released from a boat.
Over the course of testing, spillway-passage groups were released proportionally throughquarters (spring tests) or thirds (summer tests) of the spillway. Daily complements of spillwaygroups were released at one to four locations across the spillway. From containers, fish passedthrough a hose positioned midway between spillbay pier-noses in front of an open spillbay, 5-9 mupstream from the spillbay gate. The hose extended to a depth of 3-4 m, where water velocitiesranged from 0.4 to 1.5 m/second (Fig. 2, Appendix Table A5).
Based on visual observations of dye movements through the WES model, we believe thatfish released at this general location passed through the spillbay opening without contacting thebottom edge of the gate. For both daylight and night releases, the sequence of spillway releasesalternated from north to south, beginning at one end of the spillway. Generally, fish werereleased at one spillbay within each of one or more quarters (spring) or thirds (summer) of thespillway.
For analysis, coho salmon releases were differentiated between north Bays 1-5, middle/north Bays 6-11, middle/south Bays 12-17, and south Bays 18-23; whereas subyearlingchinook salmon releases, because of lower flows and less operation of spillbays at the south endof the spillway, were differentiated between north Bays 1-6, middle Bays 7-12, and south Bays13-23. We intended to release about half of the test fish at night and half during day; however,because of logistical, fish-distribution, and fish-handling problems, there were fewer nighttimereleases (Appendix Tables A6, A7).
Sluiceway groups were released through a hose about 0.5 m under the water surfaceimmediately downstream from the ice and trash sluiceway chain gate at Entrance 1/1 near thewest end of the powerhouse. During normal operation, this gate is one of three open to passsurface-oriented juvenile salmon. Few fish utilize this passage route during the night (BioSonics1997), thus we released all test fish during daylight hours.
Tailrace (reference fish) releases were made from a boat downstream from the dam at theproposed site for the new bypass system outfall (Fig. 1). This site is about 70 m from theWashington shore, about 0.7 km downstream from the spillway, and about 30 m downstreamfrom the Highway-197 bridge in an area of high water velocity. At this location, released fish arethought to generally pass down the north side of the river, away from predator sanctuary areas(Snelling and Mattson 1998).

7
Figure 2. Spillway transverse section at The Dalles Dam, showing depth and location (relative tospillway gates) at which test groups of PIT-tagged juvenile coho salmon andsubyearling chinook salmon were released during 1998.

8
We attempted to make all test fish releases during peak periods of daily passage fornaturally migrating fish. Release times varied, but the mean daylight release time was1122 hours for coho salmon and 1102 hours for subyearling chinook salmon, while the meannighttime release time was 2119 hours for coho salmon and 2234 hours for subyearling chinooksalmon (Appendix Tables A1-A4). The average time from the first to last release for each daywas about 1 hour.
For these relative survival differences to exclusively relate to the effects of dam passage,it is important that treatment and reference groups migrate together (mixed) through the riverdownstream from The Dalles Dam. Differential timing and migration routes through a riverreach could cause differences in predation and PIT-tag detection rates which are not directlyattributable to dam passage.
To attain similar timing for test fish exiting the tailrace, daily treatment and referencegroups were released sequentially in relation to the location and water-particle travel time to thetailrace exit. Unfortunately, the passage route taken by fish through the dam (i.e., powerhouse,sluiceway, proposed new bypass system, or spillway) affects the lateral location of fish groups atthe tailrace exit, and the lateral location of a fish at the tailrace exit in turn affects its passageroute and movement rate through the river downstream (Snelling and Mattson 1998). Therefore,some differences in timing from The Dalles Dam to Bonneville Dam are related to route ofpassage through The Dalles Dam. We believe that these variables affect naturally migrating fishand should be incorporated into measured differences of relative survival. However, differentarrival timing at Bonneville Dam may also affect the comparability of detection rates because oftemporal differences in river flow and Bonneville Dam operations.
PIT-tag Detections
For this study, PIT-tag detections were made at five locations. The majority of tags weredetected in the smolt bypass systems at the first and second powerhouses of Bonneville Damwhile fish were passing unhindered through the dam (described in Dawley et al. 1998). Supplemental detections were made at Jones Beach when fish passed through a trawl equippedwith a PIT-tag detector at the cod-end (Ledgerwood et al. 1997) and at the piscivorous birdcolonies on Rice Island, and gull rookeries upstream from The Dalles Dam, where tags weredeposited and then detected at a later date (Ryan et al. in review).
Test Fish
Juvenile coho salmon were used as test fish to evaluate spill passage survival at TheDalles Dam during the spring migration period. Coho salmon were used as surrogates for springchinook salmon to limit handling impacts to Snake River chinook salmon listed under theEndangered Species Act. Subyearling fall chinook salmon were used as test fish during thesummer migration period.

9
Juvenile coho salmon for these tests were collected at Bonneville Dam. Initially,subyearling chinook salmon were collected at Bonneville Dam, but beginning 9 July, collectionswere made at McNary Dam because reduced operation of the Bonneville Dam SecondPowerhouse precluded collection of sufficient numbers for marking.
Based on previous work, we estimated that at Bonneville Dam, detection rates ofPIT-tagged fish released in The Dalles Dam tailrace would average 16.5% for coho salmon and12.9% for subyearling chinook salmon (Dawley et al. 1997). To obtain the desired sensitivity of8 and 9% detectable difference between treatment and reference groups for coho and subyearlingchinook salmon, respectively, the calculated numbers of fish necessary for release were 66,000coho salmon and 66,000 subyearling chinook salmon (Cochran and Cox 1957). Because oflower-than-expected detection percentages in June and July, we requested and obtainedauthorization from the Fish Passage Advisory Committee and the NMFS Northwest RegionProtected Resources Division to increase the number of PIT-tagged subyearling chinook salmonto 81,000.
Data Analyses
The primary null hypothesis tested was
H0(1): Detection rates of treatment groups released to the spillway at 64% spill, the spillway at30% spill, or the sluiceway do not differ from those of reference groups released to thetailrace of The Dalles Dam.
Secondary null hypotheses, which were not necessarily expected to be rejected with oneyear�s data (because of limited test fish numbers) were as follows:
H0(2): There are no differences in relative survival between treatment groups associated withrelease time, (day or night), lateral release location in the spillway (north to southsegments), and spill gate openings (0.3 - 3.0 m).
H0(3): Relative survival for groups released through the spillway is not correlated with rivervolume, spill volume, tailwater elevation, or water temperature.
H0(4): Relative survival does not differ between small and large fish size at release, wherein thethreshold between small and large is defined as 125 mm for yearling fish and 110 forsubyearling fish.
H0(5): Detection proportions at Bonneville Dam and Rice Island do not differ between treatment
and reference groups.
H0(6): Arrival timing at Bonneville Dam does not differ between treatment and reference groups.

10
H0(7): There is no difference between the observed and expected variability in data.
Detection percentage of daily release groups passing the spillway at 64% spill and 30%spill and passing the sluiceway were compared to those of pooled reference groups (pooled byday) released in the tailrace, and means and 95% confidence intervals for the natural log oftreatment-to-reference proportions were calculated.
Relative survival (detected proportion of spillway or sluiceway released fish divided bythe detected proportion of tailrace-released fish) was calculated in relation to passage variables,which were categorized as follows: date and Julian date; spill percentage, indexed as 1 for 30%and 2 for 64% spill rates; spill pattern, indexed as 1 for daytime (adult spill pattern) and 2 fornighttime (juvenile spill pattern) releases; spillbay location for coho salmon, indexed as 1 fornorth bays (Bays 1-6), 2 for mid-north bays (Bays 7-12), 3 for mid-south bays (Bays 13-17), and4 for south bays (Bays 18-23); spillbay location for chinook salmon, indexed as 1 for north bays(Bays 1-6), 2 for middle bays (Bays 7-12), and 3 for south bays (Bays 13-23); spill-gate openingfor coho salmon, indexed as 1 for openings 0.3-1 m (1-3 ft), 2 for openings 1.2-2.1 m (4-7 ft),and 3 for openings 2.4-3.0 m (8-10 ft); and spill-gate openings for chinook salmon, indexed as1 for openings 0.3-1 m (1-3 ft) and 2 for openings 1.2-3.0 m (4-10 ft).
Calculations were made using analysis of variance of log-transformed detection ratios(treatment/reference). Student's t-test distributions were used to evaluate differences betweensurvival percentages for daytime releases (64 vs. 30% spill for spillway passage and 30% spill forspillway vs. sluiceway passage). Correlation coefficients were calculated for relative survival inrelation to uncontrolled variables of tailwater elevation, river flow, spill flow, and watertemperature. Data from 1997 and 1998 used for this evaluation were pooled by release period toreduce variability.
Relative survival in relation to body size at release was evaluated to provide informationregarding effects of size selections for future research activities where a full range of fish sizesmay not be possible. Fish were divided into two groups representing fish smaller than the sizenecessary for radio transmitter implantation and larger fish. The size thresholds presentlyutilized as minimum for tagging are 125 mm for yearling fish and 110 mm for subyearling fish(Rip Shively, USGS BRD, Columbia River Research Laboratory, Cook WA, 98605, Pers.commun., October 1998).
Student's t-test distributions were used to evaluate relative survival in relation to forklength. Paired t-tests were used for evaluating survival differences separated by site of detection(Rice Island and Bonneville Dam). We tested the assumption of mixing between treatment andreference groups (i.e., homogeneity of passage distributions at the Bonneville Dam PIT-tagdetection sites) with chi-square tests for each release date, using a Monte Carlo approximation ofthe exact method to calculate P-values (Mehta and Patel 1992). Significance was established atP < 0.05.

11
We assessed variability in detection percentages among release groups to determinewhether data were within expected ranges. For this analysis, we simulated a binomialdistribution of detection data based on mean observed detection proportions (i.e., spillway,sluiceway, and tailrace proportions) and on actual release numbers. We compared variability(based on standard deviation and range) in the simulation with variability in the observed data todetermine the expected variability of relative survival for the simulated data with the variabilityof the observed data. One thousand simulations were conducted for each test, and the proportionof simulated standard deviations or ranges greater than those observed constituted a P-value forthe null hypothesis that observed variability was not different from expected variability forbinomially distributed data.

12
RESULTS
Spring Migration, Coho Salmon
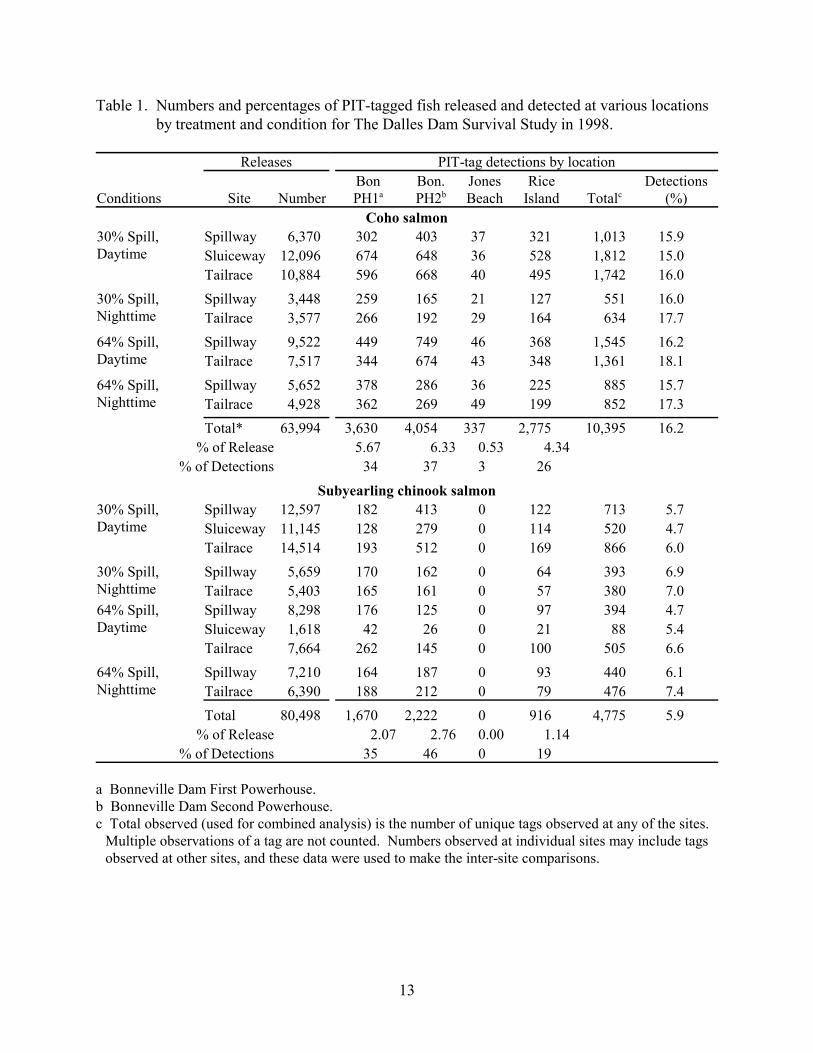
On test days 28 April-4 June during hours of release, river flow ranged from 5,099 to12,946 m3/second (180,000 to 457,000 ft3/second). During hours of release, average spill rangedfrom 1,530 to 3,966 m3/second (54,000 to 140,000 ft3/second) for the 30% spill tests and 3,541 to8,159 m3/second (125,000 to 288,000 ft3/second) for the 64% spill tests (Appendix Tables A1and A2). Of the 63,994 PIT-tagged coho salmon released in this study, 16.2% (10,395 uniquetags) were detected at one or more downstream sites (Table 1, Appendix Table A6). Of the26,906 PIT-tagged coho salmon released as the reference group at a site downstream from theHighway-197 bridge, 17.1% (4,588 unique tags) were detected. Proportions of total PIT tagsdetected were 34% at Bonneville Dam First Powerhouse, 37% at Bonneville Dam SecondPowerhouse, 3% at Jones Beach, and 26% at Rice Island.
The PIT-tag detection data were separated by detection site to evaluate relative survivaldifferences between sites. We found that relative survival for 30% spill groups averaged 9%greater than for 64% spill groups as measured at Bonneville Dam (P = 0.17) and 6% greater asmeasured at Rice Island (P = 0.58). However, the survival estimates from detections atBonneville Dam were lower for both 30 and 64% spill groups (96.5 and 87.9%) than those fromdetections at Rice Island (103.0* and 96.7%, respectively). Statistical analyses of the separateddata are presented in Appendix Table B1.
Paired t-tests of Ln relative survival of daily releases measured at Bonneville Dam FirstPowerhouse vs. Second Powerhouse, Jones Beach, and Rice Island produced probabilities ofP = 0.17, 0.02 and 0.85, respectively. Paired t-tests of Ln relative survivals of daily releasesmeasured at Bonneville Dam Second Powerhouse vs. Jones Beach and Rice Island producedprobabilities of P = 0.21, and 0.05, respectively, and a paired t-test of Ln relative survivals for daily releases detected at Jones Beach vs. Rice Island produced probability of P = 0.06. For allother analyses, we utilized the combined data from all recovery sites.
Survival Estimates
The point estimate (unweighted geometric mean for all release periods) of relativesurvival for spillway-released coho salmon was 88.6% with a 95% confidence interval (CI) of82.1-95.5% at 64% spill and 96.9% (CI 87.6-107.0%) at 30% spill (Table 2). These pointestimates represent passage survival of mixed fish stocks throughout the migration period, duringday and night (adult and juvenile spill patterns), through spillbays across the width of thespillway, and at ambient spill-gate openings, river flows, tailwater elevations, and water
_________________________
* When true survival probabilities are close to 100% or when sampling variability is high, it is possible for survivalprobabilities to exceed 100%. For practical purposes, estimates should be considered equal to 100% in these cases(Steven G. Smith, NMFS, Pers. commun. Nov. 1998).
13
Table 1. Numbers and percentages of PIT-tagged fish released and detected at various locationsby treatment and condition for The Dalles Dam Survival Study in 1998.
Releases PIT-tag detections by location
Conditions Site NumberBonPH1a
Bon.PH2b
JonesBeach
RiceIsland Totalc
Detections(%)
Coho salmon30% Spill, Daytime
Spillway 6,370 302 403 37 321 1,013 15.9Sluiceway 12,096 674 648 36 528 1,812 15.0Tailrace 10,884 596 668 40 495 1,742 16.0
30% Spill,Nighttime
Spillway 3,448 259 165 21 127 551 16.0Tailrace 3,577 266 192 29 164 634 17.7
64% Spill, Daytime
Spillway 9,522 449 749 46 368 1,545 16.2Tailrace 7,517 344 674 43 348 1,361 18.1
64% Spill,Nighttime
Spillway 5,652 378 286 36 225 885 15.7Tailrace 4,928 362 269 49 199 852 17.3
Total* 63,994 3,630 4,054 337 2,775 10,395 16.2% of Release 5.67 6.33 0.53 4.34
% of Detections 34 37 3 26
Subyearling chinook salmon30% Spill, Daytime
Spillway 12,597 182 413 0 122 713 5.7Sluiceway 11,145 128 279 0 114 520 4.7Tailrace 14,514 193 512 0 169 866 6.0
30% Spill,Nighttime
Spillway 5,659 170 162 0 64 393 6.9Tailrace 5,403 165 161 0 57 380 7.0
64% Spill, Daytime
Spillway 8,298 176 125 0 97 394 4.7Sluiceway 1,618 42 26 0 21 88 5.4Tailrace 7,664 262 145 0 100 505 6.6
64% Spill,Nighttime
Spillway 7,210 164 187 0 93 440 6.1Tailrace 6,390 188 212 0 79 476 7.4
Total 80,498 1,670 2,222 0 916 4,775 5.9% of Release 2.07 2.76 0.00 1.14
% of Detections 35 46 0 19
a Bonneville Dam First Powerhouse.b Bonneville Dam Second Powerhouse.c Total observed (used for combined analysis) is the number of unique tags observed at any of the sites.
Multiple observations of a tag are not counted. Numbers observed at individual sites may include tagsobserved at other sites, and these data were used to make the inter-site comparisons.

14
Table 2. Detections of PIT-tagged coho salmon released at The Dalles Dam in 1998, includingrelative survival percentages for daytime and nighttime passage through the spillway at30 and 64% spill and daytime passage through the sluiceway at 30% spill.
H0(1): Detection rates of treatment groups released to the spillway at 64% spill, the spillway at30% spill, or the sluiceway do not differ from those of reference groups released to thetailrace of The Dalles Dam.
Releasedate
Riverconditions
SPILLWAY SLUICEWAY TAILRACE
Bay Gateopening
(ft)Det. no.c
Surv.(%)d
Det.no. Surv. (%)
Detections
kcfsa oC No. Locationb no. (%)
30% Spill, daytime pattern
4/29 196 14 22 S 2 21 111.4 20 104.0 20 19.2
5/1 238 14 2 N 3 51 117.7 33 133.8 29 16.7
5/5 308 15 15 MS 2 95 112.4 99 117.4 84 16.3
5/9 369 14 8 MN 3 110 88.9 111 89.2 128 15.1
5/15 344 14 3 N 3 69 103.5 111 96.6 115 14.2
12 MN 3 70 106.2
5/21 323 14 1 N 3 81 114.3 155 90.3 170 16.2
23 S 2 114 111.4
5/23 286 14 6 N 3 149 84.9 159 73.5 217 20.4
21 S 2 115 72.1
341 90.2 209 17.4
5/27 388 14 17 MS 4 138 81.4 171 99.5 170 16.6
5/29 416 14 66 77.7 149 15.1
5/29 412 14 249 97.5 252 12.7
6/2 400 14 94 97.2 92 19.7
6/3 403 15 203 94.6 107 16.5
Total & Geometric Mean 1,013 99.2 1,812 95.9 1,742 16.5
30% Spill, nighttime pattern
5/7 349 15 1 N 4 102 89.4 283 19.7
15 MS 1 132 95.8
5/13 311 14 8 MN 5 83 90.5 215 18.8
14 MS 2 85 92.5
5/27 388 14 10 MN 6 149 91.6 136 12.2
Total & Geometric Mean 551 91.9 634 16.5
30% Total & Geometric Meane 1,564 96.5 1,812 95.9 2,376 16.5
95% Confidence Interval 87.6 - 107.0 87.4 - 105.4

15
Table 2. Continued.
Releasedate
RiverConditions
SPILLWAY SLUICEWAY TAILRACE
Bay Gateopening
(ft)Det.no.c
Surv.(%)d
Det.no. Surv. (%)
Detections
kcfsa oC No. Locationb no. (%)64% Spill, daytime pattern
4/28 207 14 22 S 3 54 124.7 24 18.05/8 353 15 8 MN 8 174 91.1 195 19.5
23 S 4 144 74.45/10 354 14 2 N 5 170 89.5 192 23.05/14 344 14 12 MN 8 144 82.6 98 17.75/20 315 14 1 N 3 92 96.9 177 17.0
15 MS 7 70 73.85/25 305 14 3 N 2 264 91.6 450 22.3
10 MN 8 230 91.75/26 310 14 17 MS 5 104 91.0 225 11.6
21 S 4 99 86.8Total & Geometric Mean 1,545 89.5 1,361 18.1
64% Spill, nighttime pattern4/30 227 14 2 N 7 30 68.8 44 20.15/6 323 15 1 N 7 150 104.1 207 14.5
15 MS 6 76 102.95/12 324 14 8 MN 10 81 85.0 197 21.5
19 S 2 76 87.95/16 317 14 3 N 9 107 78.5 137 20.9
12 MN 8 114 82.35/27f 388 14 3 N 10 145 90.8 150 13.46/4 411 15 23 S 5 106 92.2 117 19.8Total & Geometric Mean 885 87.4 852 18.1
64% Total & Geometric Meane 2,430 88.6 2,213 18.195% Confidence Interval 82.1 - 95.5
a Mean daily river flow; kcfs = thousand ft3/sec.b Location of spillbay assigned to a position of north, mid-north, mid-south, or south (N, MN, MS, S) for data
analysis: where bays 1-6 = N, 7-12 = MN, 13-17 = MS, and 18-23 = S.c Number or percent of release which was detected at Jones Beach, Bonneville Dam, or Rice Island.d Percent of treatment group detected divided by the percent of tailrace group detected times 100.e Geometric mean for day and night combined; not the same as Appendix Table B1.f Originally classified as 30% spill condition; however, records of dam operations indicate spill was increased to
about 64%, minutes before release was made.

16
temperatures. Survival at 64% spill was significantly different (lower) from survival of referencefish released downstream from the dam, whereas survival at 30% spill was not. Survival at 30%spill was not significantly different from survival at 64% spill (P = 0.38, Appendix Table B1).Relative survival percentages of individual releases ranged from 68.8 to 133.8%.
Numbers of coho salmon test fish were sufficient to assess survival differences betweentreatment groups and reference groups at 30 and 64% spill, but were insufficient to fully evaluatesurvival effects related to other controlled and uncontrolled variables. However, we examinedthe data for survival trends related to other variables. Effects from diel period (spill pattern),spillbay location (bay index), and gate opening (gate index) on relative survival of fish passingthrough the spillway were not significant (P = 0.50, 0.98, and 0.30, respectively; AppendixTables B1, B2, B3), though there did appear to be a trend of decreased survival by date throughthe period of testing (P = 0.19).
The point estimate (geometric mean) of relative survival for sluiceway-released cohosalmon during daylight hours at 30% spill was 96.0% (CI 87.4-105.4%) (Table 2). Sluicewaypassage survival appeared to be no different from daytime spillway passage survival at 30% spill(Table 3). Daytime spillway passage survival at 64% spill was lower than survival at 30% spill,but the difference was not significant (P = 0.13, Table 3, Fig. 3).
Test fish body size at release was evaluated as a variable affecting survival. Weexamined survival of test fish in relation to PIT-tag detection rates for daily release groupsseparated into two fork length categories: 125 mm or less and greater than 125 mm. Detectiondata from Bonneville Dam and Rice Island showed no significant differences by fish size (P =0.42 and 0.53, respectively; Appendix Table B4).
Variability Associated With the Experimental Process
To assess differences of temporal distribution among treatment groups (mixing), wecompared travel times to and daily detection distributions at Bonneville Dam for daily releasegroups. To assess the variability of measured survival percentages, we compared ranges andstandard deviations of the actual data sets for each species to those of simulated binomialdistributions of the data (1,000 simulations).
Travel times--The simplest method to evaluate whether mixing occurred amongtreatment groups was to assess travel time differences between treatment groups released duringthe same time period. Travel times through the 75-km river reach from The Dalles Dam toBonneville Dam averaged about 1.8 days, with 80% detection in 3.0 days (Table 4). Travel timedecreased substantially during the early portion of the test period (28 April-6 May), probablyaffected by physiological status of smolts. River flow also appeared to affect travel time (Fig. 4). Daytime releases averaged 1.9 days and nighttime releases averaged 1.5 days; the difference wasnot significant (P = 0.19). Tailrace-released reference groups arrived at Bonneville Dam slightlyearlier than spillway-released groups (0.15 days) and sluiceway-released groups (0.08 days), butagain, the differences were not significant (P = 0.22 and 0.79, respectively; Table 4).

17
Table 3. Relative survival comparison of coho salmon passing the spillway during the day at 30and 64% spill vs. the sluiceway at The Dalles Dam, 1998.
Releaseday
Spillway at 64%Daytime releases
Spillway at 30%Daytime releases
SluicewayDaytime releases
Rel. surv. Ln Rel. surv. Ln Rel. surv. Ln4/28 1.247 0.2214/29 1.114 0.108 1.040 0.0395/1 1.177 0.163 1.338 0.2915/5 1.124 0.117 1.174 0.1605/8 0.911 -0.0945/8 0.744 -0.2965/9 0.889 -0.118 0.892 -0.1145/10 0.895 -0.1115/14 0.826 -0.1915/15 1.035 0.035 0.966 -0.0345/15 1.062 0.0605/20 0.969 -0.0325/20 0.738 -0.3035/21 1.143 0.133 0.903 -0.1025/21 1.114 0.1085/22 0.849 -0.163 0.735 -0.3085/22 0.721 -0.3275/23 0.902 -0.1035/24 0.916 -0.0885/24 0.917 -0.0875/25 0.910 -0.0945/25 0.868 -0.1425/26 0.814 -0.206 0.995 -0.0055/28 0.777 -0.2535/29 0.975 -0.0256/2 0.972 -0.0296/3 0.946 -0.055Geomean: 0.895 -0.111 0.992 -0.008 0.960 -0.041SE: 0.038 0.042 0.050 0.050 0.041 0.04395% CI: 0.815 0.984 0.887 1.109 0.874 1.054
Ratio: 64% Spillway to 30% Spillway Ratio: 30% Spillway to SluicewayGeomean: 0.903 -0.102 Geomean: 1.034 0.033SE: 0.059 0.066 SE: 0.068 0.06695% CI: 0.787 1.035 95% CI: 0.901 1.185t: -1.56 t: 0.50df: 20 df: 22P: 0.134 P: 0.621

18
6 0
7 0
8 0
9 0
1 0 0
1 1 0
1 2 0
1 3 0
1 4 0
4 /2 5 5 /2 5 /9 5 /1 6 5 /2 3 5 /3 0 6 /6D a te
Rel
ativ
e su
rviv
al (
%)
6 4 % S p i ll 3 0 % S p i ll S lu ic e w a y
L ine a r (6 4 % S p i ll) L ine a r (3 0 % S p i ll) L ine a r (S lu ic e w a y)
Figure 3. Daytime passage survival of coho salmon through the spillway and sluiceway at 30% spill and spillway at 64% spill at TheDalles Dam, 1998.

19
Table 4. Comparison of median travel time in days from The Dalles Dam to Bonneville Dam, for daily treatment groups of cohosalmon, 1998.
Release Sluiceway Spillway Tailrace
Daily groups combined*Treatment groups
combinedRiver flow
(kcfs)Sluiceway
DaysSpillway
DaysTailrace
DaysDate Period n Days n Days n Days n Days
4/28 Day 45 4.39 21 3.62 4.39 3.62 66 4.38 207
4/29 Day 16 2.54 16 3.49 15 3.36 2.54 3.49 3.36 47 3.43 196
4/30 Night 26 2.58 35 2.19 2.58 2.19 61 2.29 227
5/1 Day 29 3.14 42 2.65 23 2.93 3.14 2.65 2.93 94 2.86 238
5/5 Day 85 2.11 66 2.37 61 1.74 2.11 2.37 1.74 212 2.09 308
5/6 Night 120 1.19 120 1.16 1.24 1.20 504 2.19 323
5/6 Night 56 1.36 35 1.32
5/7 Night 110 2.39 111 2.26 2.38 2.25 240 1.18 349
5/7 Night 83 2.38 109 2.24
5/8 Day 121 1.21 152 0.95 1.13 0.95 407 1.03 353
5/8 Day 134 1.05
5/9 Day 82 1.80 72 1.79 82 1.61 1.80 1.79 1.61 236 1.70 369
5/10 Day 130 1.54 148 1.58 1.54 1.58 278 1.55 354
5/12 Night 60 1.28 161 1.43 1.58 1.43 279 1.46 324
5/12 Night 58 1.88
5/13 Night 64 1.18 159 1.10 1.20 1.10 294 1.14 311
5/13 Night 71 1.22
5/14 Day 104 1.58 39 1.52 1.58 1.54 176 1.57 344
5/14 Day 33 1.57
5/15 Day 77 1.78 53 1.60 89 1.81 1.78 1.67 1.81 263 1.76 344
5/15 Day 44 1.755/16 Night 83 1.46 101 1.88 1.71 1.88 276 1.90 3175/16 Night 92 1.93

20
Table 4. Continued.
Release Sluiceway Spillway TailraceDaily groups combined* Treatment groups
combined River flow(kcfs)
SluicewayDays
SpillwayDays
TailraceDaysDate Period n Days n Days n Days n Days
5/20 Day 51 1.77 123 1.50 1.63 1.50 238 1.53 3155/20 Day 64 1.525/21 Day 106 2.04 57 2.40 116 2.25 2.04 2.23 2.25 364 2.16 3235/21 Day 85 2.125/23 Day 121 1.48 92 1.51 158 1.93 1.48 1.52 1.93 843 1.66 2865/23 Day 79 1.525/23 Day 120 1.63 139 1.52 1.60 1.52 2865/23 Day 134 1.585/25 Day 216 1.45 141 1.44 1.46 1.72 751 1.59 3055/25 Day 185 1.46 209 1.915/26 Day 68 1.44 73 1.47 1.47 1.68 291 1.55 3105/26 Day 75 1.50 75 1.895/27 Day 121 1.42 98 1.39 126 1.14 1.42 1.39 1.14 3885/27 Night 90 1.13 88 1.08 1.15 1.11 696 1.18 3885/27 Night 95 1.18 78 1.135/29 Day 46 1.47 114 1.49 1.80 1.72 508 1.85 4125/29 Day 75 1.91 100 1.855/29 Day 88 1.87 85 1.876/2 Day 77 1.01 71 1.15 1.01 1.15 148 1.05 4006/3 Day 72 0.94 83 0.91 1.03 0.91 227 0.97 4036/3 Day 72 1.12
6/4 Night 78 0.98 91 0.97 0.98 0.97 169 0.98 416
Mean 1.81 1.88 1.73 1.80
* t-test that travel time of sluiceway fish is not different from tailrace fish; P = 0.79. t-test that travel time of spillway fish is not different from tailrace fish; P = 0.22. t-test that travel time of sluiceway fish is not different from spillway fish; P = 0.50. Correlation evaluation of combined travel time to river flow indicated a strong inverse relationship; r = -0.80. Correlation evaluation of combined travel time to Julian date indicated a moderate inverse relationship; r = -0.65.

21
0.0
0.5
1.0
1.5
2.0
2.5
3.0
3.5
4.0
4.5
5.0
4/28 5/6 5/12 5/20 5/27Date
Tra
vel T
ime
(day
s)
0
50
100
150
200
250
300
350
400
450
Riv
er
Flo
w (
kc
fs)
Daytime Nighttime
Log. (Daytime) Log. (Nighttime)
River Flow
Figure 4. Travel time of coho salmon from The Dalles Dam to Bonneville Dam compared to river flow, 1998.

22
Temporal detection distributions--The homogeneity of passage distributions atBonneville Dam (detection through time) for corresponding spillway-, sluiceway-, and tailrace-released groups of coho salmon suggested no violation of the mixing assumption. Using a chi-square test of the homogeneity of passage distributions for the 28 release periods, we found nosignificant differences between spillway and tailrace release groups in arrival timing atBonneville Dam (Table 5).
Variability by date--We assessed the variability in detection percentages among releasegroups to determine whether data were within expected ranges. The analysis compared actualdata to a simulated binomial distribution of the data for detection proportions by tag day and bycombinations of tag day, spill pattern, and spillbay for relative spillway-passage survival. The observed SDs were 14.5 and 13.3%, whereas the simulated SDs were 12.1 and 12.3% (P = 0.24and 0.33), respectively. The observed ranges were 55.9 and 55.8%, whereas the simulated rangeswere 52.9 and 57.9% (P = 0.44 and 0.55), respectively (Table 6). Based on this analysis, theobserved variability in detection percentages by date was not different from the expectedvariability for binomially distributed data.
Comparison with 1997 Results and Trends for Combined Data
The point estimate for passage survival at 64% spill in 1998 was similar to that in 1997. Survival trend lines (linear) showed a slight decrease through time with the exception of the lastrelease in 1998, which occurred at much increased river flow and about 7 days later than anyother release (Fig. 5). The trend line for spill passage survival at 30% (for 1998) also decreasedthrough the test period, but was higher than trend lines at 64% spill passage.
Point estimates of survival for daytime releases were similar to those of nighttimereleases, and combined 1997/1998 data, including all daily estimates at 30 and 64% spill, showedno significant difference (P = 0.80, Appendix Table B5).
In both 1997 and 1998, travel times for daily groups showed differences between tailracegroups and dam passage groups, wherein tailrace groups traveled slightly faster. However,evaluation of those differences indicated no statistical significance (P = 0.36 and 0.22 for 1997and 1998, respectively).
Evaluation of survival in relation to water temperature, spill flow, river flow, andtailwater elevation showed poor correlation, r = 0.18, -0.22, -0.19, and -0.12 respectively forspringtime tests using coho salmon (Fig. 6a, and 6b; Appendix Table B6).

23
Table 5. Tests of homogeneity of Bonneville Dam passage distributions for groups of PIT-tagged coho salmon and subyearling chinook salmon released into spillway, sluiceway, or tailrace at The Dalles Dam, 1998.
H0(6): Arrival timing at Bonneville Dam does not differ between treatment and reference groups.
Coho salmon Subyearling chinook salmon
Tagday
Releasesitesa X 2 df Pb
Tagday
Releasesitesa X 2 df Pb
4/27 SP, T 15.30 13 0.27 6/22 SP, SL, T 19.98 18 0.304/28 SP, SL, T 20.95 20 0.40 6/23 SP, SL, T 10.96 14 0.764/29 SP, T 6.85 7 0.47 6/24 SP, T 16.31 9 0.024/30 SP, SL, T 19.01 22 0.76 6/25 SP, T 10.11 7 0.155/4 SP, SL, T 31.23 36 0.83 6/26 SL, T 3.94 6 0.765/5 SP, T 12.60 17 0.85 6/29 SP, SL, T 15.42 16 0.525/6 SP, T 19.17 19 0.46 6/30 SP, T 9.39 8 0.295/7 SP, T 24.72 21 0.23 7/1 SP, T 8.72 7 0.255/8 SP, SL, T 30.45 42 0.97 7/2 SP, T 9.06 10 0.605/9 SP, T 11.48 18 0.94 7/7 SP, SL, T 15.93 12 0.175/11 SP, T 11.10 12 0.56 7/8 SP, T 8.59 8 0.435/12 SP, T 13.15 15 0.67 7/9 SP, T 12.96 5 0.015/13 SP, T 7.51 13 0.95 7/10 SL, T 11.06 10 0.345/14 SP, SL, T 15.25 28 0.99 7/13 SP, SL, T 7.71 8 0.485/15 SP, T 14.09 14 0.46 7/14 SP, T 7.16 6 0.295/19 SP, T 11.08 12 0.57 7/15 SP, T 2.67 2 0.315/20 SP, SL, T 26.34 28 0.58 7/16 SP, T 4.37 6 0.745/21 SP, SL, T 23.46 26 0.63 7/17 SL, T 1.80 3 0.735/22 SL, T 9.63 11 0.58 7/20 SP, T 3.54 2 0.155/23 SP, T 11.53 11 0.39 7/21 SP, SL, T 2.75 4 0.645/24 SP, T 10.50 10 0.40 7/22 SP, T 16.72 6 0.005/25 SP, SL, T 19.86 18 0.31 7/23 SP, SL, T 12.68 12 0.385/26 SP, T 7.83 11 0.825/27 SL, T 9.11 8 0.325/28 SL, T 9.45 11 0.666/1 SL, T 7.20 7 0.446/2 SL, T 5.19 5 0.386/3 SP, T 1.81 2 0.41
a Comparing dates of arrival at Bonneville Dam among treatment groups, i.e., fish from different releasesites where: SP = spillway, SL = sluiceway, and T = tailrace.
b Probability values were calculated using a Monte Carlo approximation of the exact method.

24
Table 6. Comparison of actual and simulated data for standard deviations and ranges of relativesurvival for juvenile salmon passing The Dalles Dam via the spillway, 1998.
H0(7): There is no difference between the observed and expected variability in data.
Poolingfactor
Standard deviation Range
Observed Simulated* P Observed Simulated P
Coho salmon
Tag day 14.5% 12.1% 0.24 55.9% 52.9% 0.44
Tag day/spill pattern/spillbay indexcombination
13.3% 12.3% 0.33 55.8% 57.9% 0.55
Subyearling chinook salmon
Tag day 16.7% 12.0% 0.04 52.9% 45.6% 0.25
Tag day/spill pattern/spillbay indexcombination
21.4% 15.7% 0.01 99.7% 69.6% 0.05
Without outlier (31% survival)
Tag day/spill pattern/spillbay indexcombination
19.8% 15.9% 0.07 76.0% 70.7% 0.37
* Results of 1,000 simulations. Median simulated standard deviations and ranges.

25
6 0
8 0
1 0 0
1 2 0
1 4 0
4 / 2 7 5 / 4 5 / 1 1 5 / 1 8 5 / 2 5 6 / 1D a te
Rel
ativ
e su
rviv
al (
%)
0
1 0 0
2 0 0
3 0 0
4 0 0
5 0 0
Riv
er f
low
(kc
fs)
' 6 4 % S p ill 9 7 ' 6 4 % S p ill 9 8 ' 3 0 % S p ill 9 8
R iv e r f lo w 1 9 9 7
R iv e r f lo w 1 9 9 8
3 0 % 1 9 9 8
6 4 % 1 9 9 8
6 4 % 1 9 9 7
Figure 5. Relative spill passage survival of coho salmon and river flow through time at The Dalles Dam, 1997 and 1998.

26
0
2
4
6
8
10
12
14
16
66 74 81 83 87 90 92 103 113 125
Relative survival (%)
Wat
er te
mpe
ratu
re (
C)
0
100
200
300
400
500
600
Flo
w (
kcfs
)
W. temp. Spill R. flow
Figure 6a. Spill passage survival of coho salmon compared with water temperature, spill volume, and river flow at The Dalles Dam, 1997 and 1998.

27
R2 = 0.015
75
77
79
81
83
85
87
89
60 70 80 90 100 110 120 130
Relative survival (%)
Tai
lwat
er e
leva
tion
(ft
Figure 6b. Spill passage survival of coho salmon compared to tailwater elevation at The Dalles Dam, 1997 and 1998.

28
We noted with interest that PIT-tag surveys on gull rookeries upstream from The DallesDam detected approximately 0.2% of all spring-released tags in 1997 and in 1998, and that spillway released tags comprised 90% of the detected tags (Brad Ryan, NMFS, NorthwestFisheries Science Center, P.O. Box 155 Hammond, OR, 97121, Pers. commun., December1999).
Summer Migration, Subyearling Chinook Salmon
On test days 23 June to 24 July during hours of release, river flow ranged from 4,447 to8,555 m3/second (157,000 to 302 ,000 ft3/second). During hours of release, average spill rangedfrom 1,275 to 2,550 m3/second (45,000 to 90,000 ft3/second) for the 30% spill tests and 2,833 to5,439 m3/second (100,000 to 192,000 ft3/second) for the 64% spill tests (AppendixTables A3-A4). Of the 80,498 PIT-tagged subyearling chinook salmon released in this study,5.9% (4,775 unique tags) were detected at one or more downstream sites (Table 1, AppendixTable A7). Of 33,971 PIT-tagged subyearling chinook salmon released at the reference location,just downstream from the Highway-197 bridge, 6.6% (2,227 unique tags) were detected. Of the4,775 total detected PIT tags, 35% were detected at Bonneville Dam First Powerhouse, 46%were detected at Bonneville Dam Second Powerhouse, and 19% were detected at Rice Island.
The PIT-tag detection data were separated by detection site to evaluate relative survivaldifferences between sites. We found that relative survival for 30% spill groups averaged 16%greater than for 64% spill groups as measured at Bonneville Dam (P = 0.03) and 7% greater asmeasured at Rice Island (P = 0.68). However, the survival estimates from detections atBonneville Dam for both 30 and 64% spill groups (86.8 and 70.7%) were lower than those fromdetections at Rice Island (97.2 and 90.0%), respectively. Statistical analyses of the separateddata are presented in Appendix Table B7. Paired t-tests of Ln relative survivals for daily releasesmeasured at Bonneville Dam First Powerhouse vs. those measured at the Second Powerhouse and at Rice Island were not significantly different (P = 0.66 and 0.41, respectively). Pairedt-tests of Ln relative survivals for daily releases measured at Bonneville Dam SecondPowerhouse vs. those measured at Rice Island were not significantly different (P = 0.15). For allother analyses, we utilized the combined data from all recovery sites.
Survival Estimates
The point estimate (unweighted geometric mean for all release periods) of relativesurvival for spillway-released subyearling chinook salmon was 75.2% (CI 68.0-83.3%) at64% spill and 89.1% (CI 80.0-99.4%) at 30% spill (Table 7). These point estimates representpassage survival of mixed fish stocks throughout the migration period during day and night,through spillbays across the width of the spillway, and at ambient spill-gate openings, riverflows, tailwater elevations, and water temperatures.
Survival of fish released at 64% spill was significantly lower than survival of referencefish released downstream from the dam, whereas survival at 30% spill was not significantlydifferent from that of reference fish. Survival at 64% spill was significantly lower than survival

29
Table 7. Detections of PIT-tagged subyearling chinook salmon released at The Dalles Dam in 1998, including relative survival percentages for daytime and nighttime passagethrough the spillway at 30 and 64% spill and daytime passage through the sluiceway at30% spill.
Releasedate
River Spillway Sluiceway TailraceDetections
kcfsa oCBay Open Det. Surv. Det Surv.
no. Loc.b (ft) no.c (%)d no.c (%)d no. (%)c
30% Spill, Daytime Pattern6/24 263 17 1 N 3 60 110.4 49 90.5 54e 5.4
14 S 2 53 97.76/27 270 17 152 79.5 197 9.96/30 240 18 6 N 2 74 93.0 190 96.6 201 11.5
23 S 3 76 68.17/8 217 18 2 N 3 24 117.4 62 117.8 52 3.1
8 M 3 32 104.97/10 196 20 2 N 3 24 81.8 58 3.0
8 M 3 30 103.27/11 169 19 65 87.6 74 3.87/14 204 19 17, 20 S 1, 2 47 59.6f 62 78.4 79 8.07/18 196 21 37 87.7 41 4.27/22 195 21 10, 12 M 2, 2 34 57.0f 46 75.3 61 4.17/24 174 21 4 N 1 37 77.4 50 93.3 49 6.8
19 S 1 29 60.0Total & Geometric Mean 520 83.3 713 88.9 866 5.4
30% Spill, Nighttime Pattern6/26 266 17 1 N 4 96 96.1 198 10.1
14 S 2 99 98.97/2 242 18 6 N 5 53 116.6 84e 4.7
14 S 2 35 75.37/16 209 21 4 N 4 36 106.5 65 6.9
12 M 3 34 86.27/24 174 21 10 M 3 40 131.1 33 4.7Total & Geometric Mean 393 100.1 380 6.3
30% Total & Geometric Meang 913 89.1 713 88.9 1,246 5.8 95% Confidence Interval 80.0 - 99.4 80.6 - 98.0

30
Table 7. Continued.
Releasedate
River Spillway Sluiceway TailraceDetections
kcfsa oCBayno. Loc.b
Open(ft)
Det.no.c
Surv.(%)d
Det.no.
Surv.(%)d no. (%)c
64% Spill, Daytime Pattern6/23 212 17 1 N 3 44 100.0 88h 86.4h 87 6.3
14 S 4 37 86.97/3 193 18 6 N 3 43 103.1 84e 4.2
23 S 3 36 85.97/9 214 19 2 N 3 14 71.2 19 4.0
8 M 5 16 80.77/15 214 21 8 M 5 53 63.4 70 9.17/17 186 21 17, 22 S 4, 3 35 55.1f 58 7.77/23 174 21 4 N 3 60 103.4 187 8.2
12 M 3 19 31.419 S 3 37 60.3
Total & Geometric Mean 394 72.8 88h 86.4h 505 6.364% Spill, Nighttime Pattern
6/25 275 17 1 N 7 97 107.3 181 9.114 S 3 81 91.3
7/1 258 18 6 N 10 23 69.5 38f 4.518 S 2 26 83.1
7/15 214 21 12 M 5 56 67.9 83 10.57/17 186 21 2 N 8 17 62.2 50 6.9
8 M 7 15 59.17/21 191 21 10 M 6 79 98.0 124 6.1
14 S 3 46 80.8Total & Geometric Mean 440 78.4 476 7.1
64% Total & Geometric Meang 440 75.2 88h 86.4h 981 6.795% Confidence Interval 68.0 - 83.3a Mean daily river flow; kcfs = thousand ft3/sec. b L = Location of spillbay assigned to a position of north, middle or south (N, M, S) for data analysis where bays
1-6 = N, 7-12 = M, and 13-23 = S. c Number or percent of release which was detected at Bonneville Dam. d Percent of treatment group detected divided by the percent of tailrace released fish detected times 100. e Intermittent operation of the Bonneville Second Powerhouse ice and trash chute caused decreased detection rates.
The ice and trash chute was not operated after 7/6/98. f Within-day releases were combined for data analysis because index characterizations were identical. g Geometric mean for day and night combined; not the same as Appendix Table B5. h Unintentional release at 64% spill conditions.

31
at 30% spill (P = 0.02, Appendix Table B7). Relative survival of fish passing though thespillway decreased through time (P < 0.01). Relative survival percentages calculated for eachtest release ranged from 31.4 to 131.1%.
Numbers of subyearling chinook salmon test fish were sufficient to assess survival differences between treatment and reference groups at 30 and 64% spill, but were insufficient tofully evaluate survival effects related to other controlled and uncontrolled variables. However,we examined the data for survival trends related to other variables (Appendix Table B8).
Relative survival decreased significantly through the test period; P < 0.01. Relativesurvival differences among spill patterns (diel periods) and spillbay locations were significant atP = 0.08 and P = 0.14, respectively (Appendix Table B7). Interaction between spillbay locationand both spill percent and diel release period appeared to be substantial, though not significant(P = 0.07 and 0.12, respectively). Means of relative survival for releases through the southernbays were generally low, but means through the northern bays were generally high (AppendixTable B7). Survival appeared unrelated to spill-gate opening (height of gate opening dictates thevolume of spill, P = 0.91, Appendix Table B9).
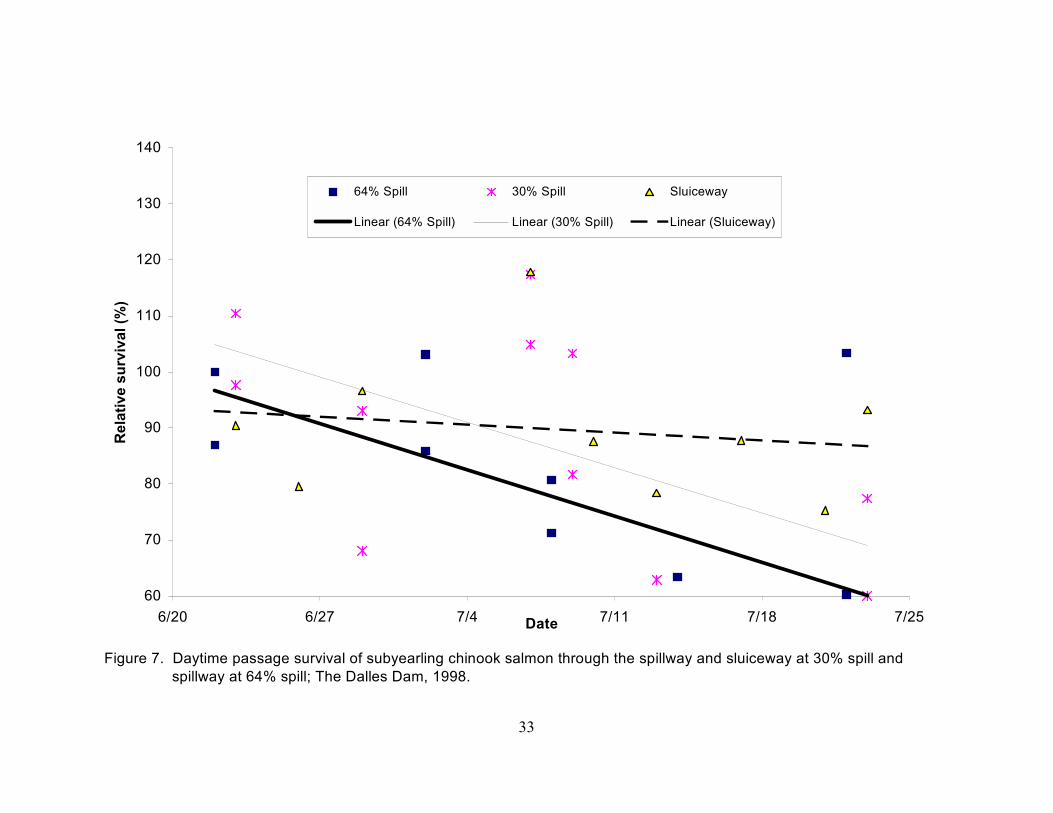
The point estimate (geometric mean) for relative survival of sluiceway-releasedsubyearling chinook salmon during daylight hours at 30% spill was 88.9% (CI 80.6-98.0%, Table 7). Sluiceway survival appeared to be no different from daytime spillway passage survivalat 30% spill (Table 8, Fig. 7). In contrast, mean daytime passage survival at 64% spill was about11% less than mean survival at 30% spill, but the difference was not significant.
Test fish body size at release was also evaluated as a variable affecting survival. Weexamined survival of test fish in relation to PIT-tag detection rates of daily release groupsseparated into two fork length categories: 110 mm or less and greater than 110 mm. Detectiondata from Bonneville Dam and Rice Island showed no significant differences in survival by fishsize (P = 0.35 and 0.85, respectively; Appendix Table B10).
Variability Associated With the Experimental Process
To assess differences of temporal distribution among treatment groups (mixing), wecompared travel times to and daily detection distributions at Bonneville Dam for daily releasegroups. To assess the variability of measured survival percentages, we compared ranges andstandard deviations of the annual data sets for each species to those of simulated, binomiallydistributed data (1,000 simulations).
Travel times--The simplest method to evaluate whether mixing occurred amongtreatment groups was an assessment of travel time differences between treatment groups releasedduring the same time period. Travel times through the 75-km river reach from The Dalles Damto Bonneville Dam averaged about 1.8 days, with 80% detected in 2.4 days (Table 9). Travel time showed no change through the test period (r = 0.10) and was not correlated with river flow

32
Table 8. Relative survival comparison of subyearling chinook salmon passing the spillwayduring the day at 30 and 64% spill vs. the sluiceway at The Dalles Dam, 1998.
Tagday
Spillway at 64%daytime releases
Spillway at 30%daytime releases
Sluicewaydaytime releases
Relativesurvival Ln
Relativesurvival Ln
Relativesurvival Ln
6/22 1.000 0.0006/22 0.869 -0.1406/23 1.104 0.099 0.905 -0.1006/23 0.977 -0.0246/26 0.795 -0.2296/29 0.930 -0.072 0.966 -0.0346/29 0.681 -0.3857/2 1.031 0.0317/2 0.859 -0.1527/7 1.174 0.160 1.178 0.1647/7 1.049 0.0487/8 0.712 -0.3407/8 0.807 -0.2147/9 0.818 -0.2017/9 1.032 0.0327/10 0.876 -0.1337/13 0.629 -0.464 0.784 -0.2437/14 0.634 -0.4567/16 0.551 -0.5967/17 0.877 -0.1317/21 0.594 -0.521 0.753 -0.2847/22 1.034 0.0337/22 0.314 -1.1587/22 0.603 -0.5067/23 0.774 -0.256 0.933 -0.0707/23 0.600 -0.511Geomean: 0.728 -0.318 0.840 -0.174 0.889 -0.118SE: 0.078 0.107 0.060 0.072 0.040 0.04595% CI: 0.574 0.923 0.717 0.984 0.801 0.986
Ratio: 64% spill to 30% spill Ratio: 30% spill to sluiceGeomean: 0.866 -0.144 Geomean: 0.945 -0.057
SE: 0.111 0.129 SE: 0.080 0.08595% CI: 0.663 1.132 95% CI: 0.791 1.128
t: -1.12 t: -0.67df: 21 df: 19P: 0.2771 P: 0.5109
33
60
70
80
90
100
110
120
130
140
6/20 6/27 7/4 7/11 7/18 7/25Date
Rel
ativ
e su
rviv
al (
%)
64% Spill 30% Spill Sluiceway
Linear (64% Spill) Linear (30% Spill) Linear (Sluiceway)
Figure 7. Daytime passage survival of subyearling chinook salmon through the spillway and sluiceway at 30% spill and spillway at 64% spill; The Dalles Dam, 1998.

34
Table 9. Comparison of median travel time in days from The Dalles Dam to Bonneville Dam,for daily treatment groups of subyearling chinook salmon, 1998.
Release Sluiceway Spillway Tailrace
Daily groups combined* Treatment groupscombined
River flow
(kcfs)
Sluiceway Spillway Tailrace
Date Period n Days n Days n Days Days Days Days n Days
6/23 Day 68 1.99 40 2.23 76 2.24 1.99 2.28 2.24 210 2.17 211
Day 26 2.35
6/24 Day 40 1.47 47 1.41 47 1.74 1.47 1.70 1.74 175 1.66 263
Day 41 2.04
6/25 Night 92 1.66 83 1.34 1.68 1.22 329 1.45 275
Night 70 1.70 84 1.10
6/26 Night 91 1.66 96 1.47 1.70 1.45 362 1.58 266
Night 94 1.75 81 1.43
6/27 Day 68 1.52 93 1.45 1.51 1.47 316 1.49 270
Day 70 1.51 85 1.49
6/30 Day 94 1.50 71 1.49 99 1.46 1.50 1.49 1.46 496 1.55 242
Day 80 1.46 67 1.46 85 1.92 1.46 1.46 1.92
7/1 Night 13 2.70 21 2.04 2.06 2.07 56 2.07 258
Night 18 1.60 4 2.25
7/2 Night 36 1.94 29 1.42 1.94 1.42 127 1.74 242
Night 26 1.90 36 1.67 1.90 1.67
7/3 Day 26 1.58 32 1.51 1.53 1.48 118 1.50 193
Day 32 1.49 28 1.45
7/8 Day 25 1.48 27 1.67 14 1.43 1.81 1.81 1.71 124 1.78 239
Day 21 2.21 14 2.08 23 1.89
7/9 Day 11 1.72 12 2.02 1.76 2.02 31 1.86 214
Day 8 1.83
7/10 Day 20 2.79 18 2.69 3.03 2.71 75 2.86 196
Day 16 3.33 21 2.73
7/11 Day 28 2.39 29 2.81 2.41 2.48 105 2.45 169
Day 20 2.43 28 2.15
7/14 Day 50 1.48 9 1.45 57 1.44 1.48 1.46 1.44 136 1.46 204
Day 20 1.46
7/15 Day 45 1.51 60 1.51 1.51 1.51 105 1.51 214
7/15 Night 43 2.01 68 1.97 2.01 1.97 111 1.97 214
7/16 Night 22 1.97 30 1.82 1.87 1.86 111 1.87 209
Night 28 1.80 31 1.91
7/17 Day 12 1.48 42 1.47 1.49 1.71 101 1.66 186
Day 10 1.51 37 1.98
7/17 Night 9 1.98 1.95 18 1.95 186
Night 9 1.92

35
Table 9. Continued.
Release Sluiceway Spillway Tailrace
Daily groups combined* Treatment groupscombined
River flow
(kcfs)
Sluiceway Spillway Tailrace
Date Period n Days n Days n Days Days Days Days n Days
7/18 Day 9 1.75 12 1.61 1.65 1.65 51 1.65 196
Day 15 1.59 15 1.69
7/21 Night 35 1.72 50 1.49 1.69 1.51 200 1.59 191
Night 62 1.66 53 1.52
7/22 Day 15 1.45 11 1.37 20 1.89 1.46 2.03 1.62 96 1.67 195
Day 17 1.47 13 2.59 20 1.36
7/23 Day 30 2.31 65 1.32 1.78 1.35 248 1.57 174
Day 45 1.43 51 1.39
Day 16 1.41 41 1.86
7/24 Day 43 1.50 20 1.45 39 1.44 1.50 1.44 1.44 133 1.46 174
Day 31 1.44
7/24 Night 35 1.76 23 1.93 1.76 1.93 58 1.83 174
Mean 1.66 1.81 1.73 1.77
* t-test that travel time of sluiceway fish is not different from tailrace fish; P = 0.15. t-test that travel time of spillway fish is not different from tailrace fish; P = 0.11. t-test that travel time of sluiceway fish is not different from spillway fish; P = 0.15. Correlation evaluation of combined travel time to river flow indicated little relationship; r = -0.23. Correlation evaluation of combined travel time to Julian date indicated little relationship; r = 0.10.

36
(r = -0.23; Fig. 8). Mean travel times of daytime- and nighttime-released groups were identical. Tailrace-released reference groups arrived at Bonneville Dam slightly earlier than spillwaygroups (0.08 days, P = 0.11) and later than sluiceway groups (0.07 days, P = 0.15), but thedifferences were not significant (Table 9).
Temporal detection distributions--The homogeneity of passage distributions atBonneville Dam (PIT-tag detections through time) for corresponding spillway-, sluiceway-, andtailrace-released groups of subyearling chinook salmon was evaluated. Based on a chi-squaretest, spillway and tailrace groups did not arrive at Bonneville Dam at the same time for 3 of 22release periods (Table 5); however, even with complete mixing, we would expect about 1violation in 20 tests in relation to 95% probability testing. Evaluation of release groups failingthe mixing test showed that spillway groups passed Bonneville Dam about 1 day later thantailrace groups (Appendix Table B11). Although these data present limited evidence that mixingdid not occur on three test dates, we would not expect to see large survival differences betweengroups associated with a travel-time difference of 1 day.
Variability by date--We assessed variability in detection percentages among releasegroups to determine whether data were within expected ranges. The analysis compared actual toa simulated binomial distribution of detection proportions by tag day and by combinations of tagday, spill pattern, and spillbay index for relative spillway passage survival. The SDs and rangesof the observed data were significantly larger than those of the simulated data (tag-day range wasnot significant; P = 0.25). When an outlier (31%) was extracted, the probabilities for nodifference between the observed and simulated SD and range for tag day, spill pattern, andspillbay indices increased to 0.07 and 0.37 respectively (Table 6). Extracting the outlier changedthe overall mean less than 2%. Based on this analysis, it appears that relative survival datavariability was somewhat greater than would be expected for binomial data. However, thevariation associated with the observed data was expected to be greater than that of a binomialdistribution because of the many uncontrolled variables discussed above.
Comparison with 1997 Results and Trends for Combined Data
The point estimate for passage survival at 64% spill in 1998 was much lower than in1997. We evaluated fish-handling differences as much as possible and have no reason to suspectthat the differences are from testing procedures. However, variation in survival between yearscould be related to differences in fish stocks and their physical condition, and/or interactionsbetween river volumes and spill percentage or predator abundance. Survival trends for bothyears of data showed a decrease through the test period (Fig. 9).
Point estimates of survival for daytime releases ranged from 6 to 17% less than those fornighttime releases. Because variability was high, differences in combined 1997 and 1998 datawere not significant (P = 0.07, Appendix Table B5).

37
0.0
0.5
1.0
1.5
2.0
2.5
3.0
3.5
6/23 6/30 7/9 7/15 7/21Date
Tra
vel T
ime
(day
s)
0
50
100
150
200
250
300
Riv
er
Flo
w (
kc
fs)
Nighttime Daytime
Linear (Nighttime) Linear (Daytime)
River flow
Figure 8. Travel time of subyearling chinook salmon from The Dalles Dam to Bonneville Dam compared to river flow, 1998.

38
55
75
95
115
135
6/19 6/26 7/3 7/10 7/17 7/24Date
Rel
ativ
e S
urv
ival
(%
)
-300
-200
-100
0
100
200
300
400
500
Riv
er
flo
w (
kc
fs)
64% Spill 97 64%Spill 98 30% Spill 98
River flow 1997
River flow 1998
Figure 9. Relative spill passage survival of subyearling chinook salmon and river flow through time at The Dalles Dam, 1997 and 1998.
64% 1998
30% 1998
64% 1997

39
In both 1997 and 1998, travel times for daily groups of tailrace-released subyearlingchinook salmon groups were slightly less (0.3 and 0.1 days, respectively) than those of spillway-released fish groups.
Evaluation of survival in relation to water temperature, spill levels, river flow, and tailwater elevation showed poor correlation, r = -0.44, 0.30, 0.41, and 0.43, respectively, forsummer tests using subyearling chinook salmon (Fig. 10, Appendix Table B6).
We noted with interest that PIT-tag surveys on gull rookeries upstream from The DallesDam detected approximately 0.05% of all spring released tags in 1997 and in 1998 (Brad Ryan,NMFS, Northwest Fisheries Science Center, P.O. Box 155, Hammond, OR 97121, Pers.commun., December 1999). Spillway-released fish comprised 90% of these detections.
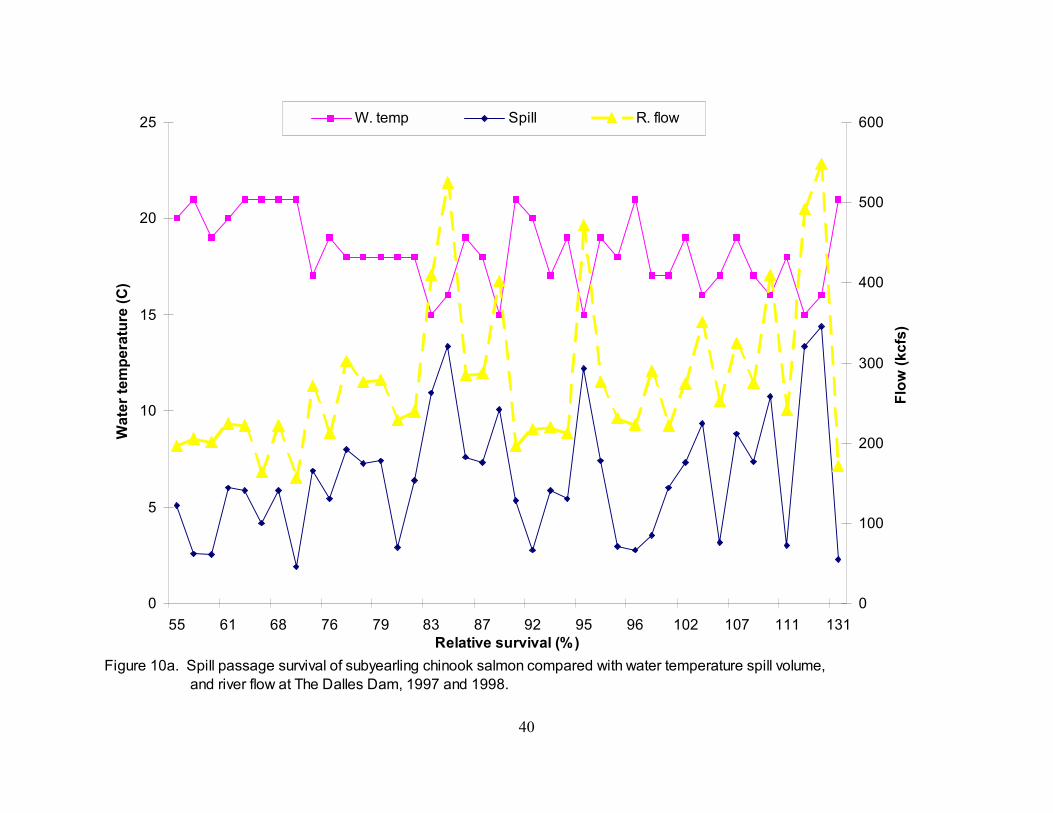
40
0
5
10
15
20
25
55 61 68 76 79 83 87 92 95 96 102 107 111 131Relative survival (%)
Wat
er t
emp
erat
ure
(C
)
0
100
200
300
400
500
600
Flo
w (
kc
fs)
W. temp Spill R. flow
Figure 10a. Spill passage survival of subyearling chinook salmon compared with water temperature spill volume, and river flow at The Dalles Dam, 1997 and 1998.

41
R 2 = 0.1817
76
78
80
82
84
86
88
90
92
50 60 70 80 90 100 110 120 130
R elative s urvival (% )
Tai
lwat
er e
leva
tion
(ft
Figure 10b. Spill passage survival of subyearling chinook salmon compared with tailwater elevation at The Dalles Dam, 1997 and 1998.

42
DISCUSSION
We noted differences in the average survival estimates based on whether detections atBonneville Dam, Jones Beach, or the piscivorous bird colonies in the estuary were used in theanalyses. It is not surprising that we observe differences between the various PIT tag recoverysites. This is because Bonneville Dam, the Jones Beach pair-trawl, and bird colonies onestuarine islands each utilize different sample mechanisms (guidance screen, towed trawl net,and bird feeding behavior) and each is subject to sampling bias associated with that mechanism.
We speculate that differences in detection probabilities at Bonneville Dam could berelated to poor spacial mixing of reference and treatment fish groups, with fish staying orientedto the side of the river on which they were released. For example, survival estimates would belower at Bonneville Second Powerhouse and higher at the First Powerhouse, as was observed in1998, if reference fish detections were more likely at Bonneville Second Powerhouse andtreatment group detections were more likely at Bonneville First Powerhouse. Diel changes intest fish depth distribution at Bonneville Dam coupled with arrival time differences may havecaused differences in detection rate probability between reference and treatment groups. Survivalestimates based on PIT tag detections on bird colonies are influenced by whether the treatmentand reference groups are completely mixed (pass the islands at the same time and at the samedepth) and the foraging behavior of the avian predators.
In summary, the estimates based on detections at Bonneville Dam were generally lowerthan those based on detections from the other sites. However, in estimates based on detections atall sites combined, the differences between 30 and 64% spill and day and night releases generallytrended in the same direction, with 30% spill and nighttime releases producing the highestestimates of relative survival. Based on a cursory evaluation, we believe that hourly operationsat Bonneville Dam did not systematically affect the estimates. Based on consistent trendsthrough the 2 years of study we are confident that combining data from all detection sitesprovides a data set that reasonably represents relative fish survival differences between testconditions. In 1999 we will analyze PIT-tag detections and water flow operations at BonnevilleDam for1997, 1998, and 1999 to test for bias in detections from this site.
From the two years of study, the results that appear important to operations at The DallesDam are as follows:
1) Detection rates of fish passing through the spillway at 64% spill were significantly lessthan for fish released downstream from the dam.
2) Estimated spillway passage survival for juvenile salmon at 64% spill was lower than atother dams and similar to or lower than survival expected for turbine passage (NMFS1999). During testing, spring flows ranged from 5,099 to 14,929 m3/second (180,000 to527,000 ft3/second) and summer flows ranged from 4,447 to 14,986 m3/second (157,000to 529,000 ft3/second).

43
3) The estimated relative survival rates for fish passing at 64% spill were substantially lowerthan for fish passing at 30% spill; significantly for subyearling chinook salmon.
4) Relative survivals for daytime fish passage through the sluiceway were similar to those ofdaytime fish passage through the spillway at 30% spill (1998 testing only).
5) Spillway passage of subyearling chinook salmon during daytime hours with adult spillpatterns produced substantially lower survival than passage during nighttime hours withjuvenile spill patterns.
6) Evaluations of survival in relation to tailwater elevation, spill volume, river flow, andwater temperature indicated weak correlations for both spring and summer tests.
Although the study was designed to produce a point estimate of survival for each passagecondition (spillway passage at 64% spill and 30% spill and daytime sluiceway passage at 30%spill), we also evaluated survival percentages among individual releases. In so doing, it appearedthat variation among survival estimates of individual release groups was extraordinarily high. However, we believe this variation is not beyond the expected range because of the dynamics oftest conditions and the low PIT-tag detection rate.
We expected rates of injury and predation to change through time in association withpassage conditions and predation. Predation by northern pikeminnow (Ptychocheilusoregonensis) generally increases through time because of increased water temperature andchanges in location due to predator migration and variation in prey availability (Hansel et al.1993). Avian predation may also have changed through time for similar reasons (Jones et al.1997). Certainly, conditions at the tailrace changed with river flow and dam operations, and amajor premise of this study was that some passage conditions produce diminished survival. Webelieve that these uncontrolled variables resulted in high variation within and between years.
Based on radiotelemetry data from 1997 (Snelling and Mattson 1998), we speculated thatlonger travel times to Bonneville Dam for spillway-released fish over those of tailrace-releasedfish were caused by delays during migration through the Bridge Islands and the Basin Islands onthe south side of the river downstream from the dam. We designed the study with the belief thatit was more important for the various treatment groups to enter the tailrace downstream from TheDalles Dam at the same time than to arrive at Bonneville Dam at the same time. Because of therapidity with which single groups passed Bonneville Dam (average 3 and 2.4 days for 80%passage of spring and summer test fish, respectively), we believe there were no systematic errorsimparted to the relative survival data due to temporal changes in dam operations.

44
RECOMMENDATIONS
1) In 1999, tests should repeat the relative survival evaluation for 30 and 64% spillconditions during the spring and summer fish migrations. Additionally, the sluicewayassessment should be eliminated to allow an increase in statistical sensitivity of furtherspill tests by maximizing test fish numbers.
2) In 2000, tests should evaluate a constant spill rate at less than 64% with juvenile spillpatterns in effect 24 hours/day; these tests should include evaluation of sluicewaysurvival. Maximum fish numbers should be used to obtain the highest possible statisticalsensitivity.
3) Evaluations of PIT tags deposited in estuarine bird rookeries and from the PIT-tagdetector trawl off Jones Beach should be continued to provide increased detectionnumbers.
4) Assessment of differences between detection sites and evaluation of combined data from1997, 1998, and future years should be continued.
5) Operation of the sluice chute during testing compromised PIT-tag detection rates for thisstudy. Therefore, operation of the sluice chute at Bonneville Dam Second Powerhouseshould be minimized during future testing in order to maximize the number of PIT-tagsdetected at Bonneville Dam.

45
ACKNOWLEDGMENTS
We wish to express our appreciation to those who participated in this research. COEpersonnel, especially Robert Dach for collaboration with development of the experimental designand resolution of strategic problems and Marvin Shutters, Steve Dingman, and Miroslaw Zyndolfor their assistance with the regional coordination and project operations and coordination at TheDalles Dam.
At Bonneville Dam, COE Project Biologist James Kuskie arranged for our access toproject facilities and conducted an orientation meeting for our employees. The NMFS personnelsupervised by Rick Martinson were invaluable in operation of the PIT-tag detection systems atBonneville Dam. Without their efforts the study would not have been successful.

46
REFERENCES
BioSonics. 1997. Hydroacoustic evaluation and studies at The Dalles Dam, spring/summer1996. Volume 1, Fish passage. Report to U.S. Army Corps of Engineers, 64 p. plusappendices. (Available from U.S. Army Corps of Engineers, Portland District, P.O. Box2946, Portland, OR 97208-2946.)
COE (U.S. Army Corps of Engineers). 1997. Fish passage plan, March 1997. 225 p. (Available from U.S. Army Corps of Engineers, Portland District, P.O. Box 2946,Portland OR 97208-2946.)
Cochran, W. G. and G. M. Cox. 1957. Experimental designs. J. Wiley Inc., New York. 617 p.
Dawley, E. M., L. G. Gilbreath, and R. F. Absolon. 1997. Research proposal: relative survivalof juvenile salmon passing through the spillway and ice and trash sluiceway of The DallesDam. Research proposal for FY98 14 p. (Available from Northwest Fisheries ScienceCenter, 2725 Montlake Blvd. E., Seattle, WA 98112-2097.)
Dawley, E. M., L. G. Gilbreath, E. P. Nunnallee, and B. P. Sandford. 1998. Relative survival ofjuvenile salmon passing through the spillway of The Dalles Dam, 1997. Report to U.S.Army Corps of Engineers, Portland District, Contract E96970020. 48 p. (Available fromNorthwest Fisheries Science Center, 2725 Montlake Blvd. E., Seattle, WA 98112-2097.)
Hansel, H., R. Shively, G. Holmberg, T. King, T. Martinelli, and M. Sheer. 1993. Movementsand distribution of radio-tagged northern squawfish near The Dalles and John Day Dams. In T. Poe (editor), Significance of selective predation and development of prey protectionmeasures for juvenile salmonids in the Columbia and Snake River reservoirs, p. 17-73.Report to Bonneville Power Administration, Portland, Oregon. (Available fromBonneville Power Administration, P.O. Box 3621, Portland, OR, 97208-3621.)
Jones, T. J., G. M. Starke, and R. J. Stansell. 1997. Predation by gulls and effectiveness ofpredation control measures at Bonneville, The Dalles and John Day Dams, in 1996. Report to U.S. Army Corps of Engineers, 19 p. (Available from U.S. Army Corps ofEngineers, CENWP-CO-SRF, Bonneville Lock and Dam, Cascade Locks, OR 97014.)
Ledgerwood, R. D., E. M. Dawley, B. W. Peterson, and R. N. Iwamoto. 1997. Estuarinerecovery of PIT-tagged juvenile salmonids from the Lower Granite Dam transportationstudy, 1996. Report to U.S. Army Corps of Engineers, Delivery Order E8960100, 54 p.plus appendices. (Available from Northwest Fisheries Science Center, 2725 MontlakeBlvd. E., Seattle, WA 98112-2097.)

47
Mehta, C., and N. Patel. 1992. Statxact user's manual. Cytel Software Corp., Cambridge, MA.
\NMFS (National Marine Fisheries Service). 1995. Reinitiation of consultation on 1994-1998operation of the federal Columbia River power system and juvenile transportationprogram in 1995 and future years. Endangered Species Act, Section 7 Consultation,Biological Opinion. (Available from NMFS Northwest Regional Office, HydropowerProgram, 525 NE Oregon Street, Suite 500, Portland, OR 97232.)
NMFS (National Marine Fisheries Service). 1999. Passage of juvenile and adult salmonids pastColumbia and Snake River dams. NMFS white paper, 111 p. plus appendixes. (Available from Northwest Fisheries Science Center, 2725 Montlake Blvd. E., Seattle,WA 98112-2097.)
Normandeau Associates, J. R. Skalski, and Mid Columbia Consulting. 1996. Potential effects ofmodified spillbay configurations on fish conditions and survival at The Dalles Dam,Columbia River. Report to U.S. Army Corps of Engineers, 57 p. plus appendixes. (Available from U.S. Army Corps of Engineers, Portland District, P.O. Box 2946,Portland, OR 97208-2946)
Prentice, E. F., T. A. Flagg, C. S. McCutcheon, D. Brastow, and D. Cross. 1990. Equipment,methods, and an automated data-entry station for PIT tagging. Am. Fish. Soc.Symposium 7:335-340.
Ryan, B.A., J. W. Ferguson, R. D. Ledgerwood, and E. P. Nunnallee. In review. Detection ofpassive integrated transponder tags from juvenile salmonids on piscivorous bird coloniesin the Columbia River Basin. N. Am. J. Fish. Manage.
Snelling, J. C., and S. A. Mattson. 1998. Behavior and fate of juvenile salmonids entering the tailwaters of The Dalles Dam via spill. Report to U.S. Army Corps of Engineers, 38 p.plus appendixes. (Available from U.S. Army Corps of Engineers, Portland District, P.O.Box 2946, Portland, OR 97208-2946)
Ward D. L., J. H. Petersen, and J. J. Loch. 1995. Index of predation on juvenile salmonids bynorthern squawfish in the lower and middle Columbia River and in the lower SnakeRiver. Trans. Am. Fish. Soc. 124:321-334.

48
APPENDICES
Appendix A: Release Numbers, Dates, Times, Locations, and Conditions for Juvenile Coho and Subyearling Chinook Salmon
at The Dalles Dam in 1998
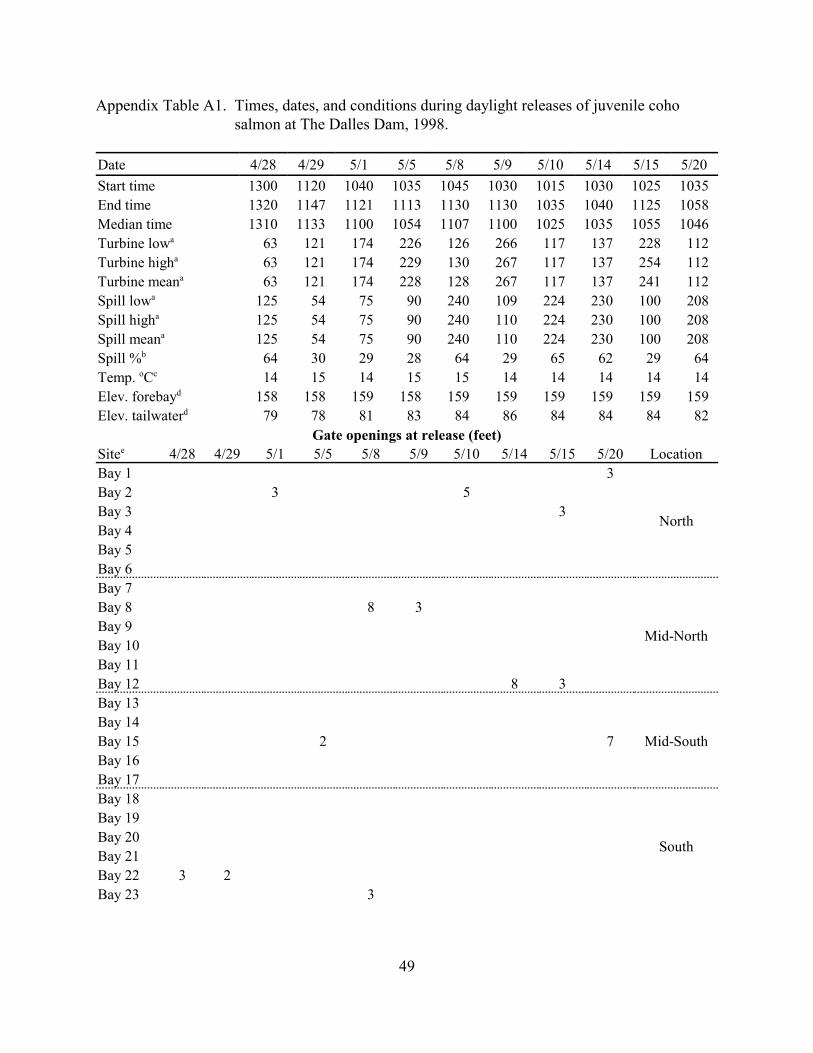
49
Appendix Table A1. Times, dates, and conditions during daylight releases of juvenile cohosalmon at The Dalles Dam, 1998.
Date 4/28 4/29 5/1 5/5 5/8 5/9 5/10 5/14 5/15 5/20
Start time 1300 1120 1040 1035 1045 1030 1015 1030 1025 1035End time 1320 1147 1121 1113 1130 1130 1035 1040 1125 1058Median time 1310 1133 1100 1054 1107 1100 1025 1035 1055 1046Turbine lowa 63 121 174 226 126 266 117 137 228 112Turbine higha 63 121 174 229 130 267 117 137 254 112Turbine meana 63 121 174 228 128 267 117 137 241 112Spill lowa 125 54 75 90 240 109 224 230 100 208Spill higha 125 54 75 90 240 110 224 230 100 208Spill meana 125 54 75 90 240 110 224 230 100 208Spill %b 64 30 29 28 64 29 65 62 29 64Temp. oCc 14 15 14 15 15 14 14 14 14 14Elev. forebayd 158 158 159 158 159 159 159 159 159 159Elev. tailwaterd 79 78 81 83 84 86 84 84 84 82
Gate openings at release (feet)Sitee 4/28 4/29 5/1 5/5 5/8 5/9 5/10 5/14 5/15 5/20 LocationBay 1 3
North
Bay 2 3 5Bay 3 3Bay 4Bay 5Bay 6Bay 7
Mid-North
Bay 8 8 3Bay 9Bay 10Bay 11Bay 12 8 3Bay 13
Mid-SouthBay 14Bay 15 2 7Bay 16Bay 17Bay 18
South
Bay 19Bay 20Bay 21Bay 22 3 2Bay 23 3

50
Appendix Table A1. Continued.
Date 5/21 5/23 5/23 5/25 5/26 5/27 5/29 5/29 6/2 6/3
Start time 1149 1055 1320 1102 1115 1035 1036 1202 1020 1030End time 1245 1205 1350 1222 1205 1120 1050 1230 1040 1055Median time 1217 1130 1335 1142 1140 1057 1043 1216 1030 1042Turbine lowa 222 211 214 93 102 261 297 301 257 239Turbine higha 223 216 214 93 102 281 297 301 257 239Turbine meana 223 214 214 93 102 271 297 301 257 239Spill lowa 96 94 94 200 189 130 125 125 111 110Spill higha 96 94 94 200 189 130 125 125 111 110Spill meana 96 94 94 200 189 130 125 125 111 110Spill %b 30 30 30 69 64 32 29 29 30 31Temp. oCc 14 14 14 14 14 14 14 14 14 15Elev. forebayd 158 160 159 158 158 158 158 158 158 159Elev. tailwaterd 84 82 82 82 81 86 87 87 86 84
Gate openings at release (feet)Sitee 5/21 5/23 5/23 5/25 5/26 5/27 5/29 5/29 6/2 6/3 LocationBay 1 3
Slu
icew
ay O
nly
Slu
icew
ay O
nly
Slu
icew
ay O
nly
Slu
icew
ay O
nly
Slu
icew
ay O
nly
North
Bay 2Bay 3 2Bay 4Bay 5Bay 6 3Bay 7
Mid-North
Bay 8Bay 9Bay 10 8Bay 11Bay 12Bay 13
Mid-SouthBay 14Bay 15Bay 16Bay 17 5 4Bay 18
South
Bay 19Bay 20Bay 21 2 4Bay 22Bay 23 2a Thousand cubic feet per second (kcfs); c Temperature during holding. English units by COE convention. d Units in feet; English units by COE convention.b Percent of river flow in kcfs. e Bay 1 is to the north and Bay 23 to the south.

51
Appendix Table A2. Times, dates, and conditions during nighttime releases of juvenile cohosalmon at The Dalles Dam, 1998.
Date 4/30 5/6 5/7 5/12 5/13 5/16 5/27 5/27 6/4
Start time 2220 2225 2220 2235 2240 2235 2255 2320 2240End time 2225 0020 2355 2310 2320 2320 2255 2320 2255Median time 2223 2323 2307 2252 2300 2257 2255 2320 2247Turbine lowa 75 109 191 95 201 107 194 121 161Turbine higha 75 121 219 122 233 107 194 121 161Turbine meana 75 115 205 109 217 107 194 121 161Spill lowa 138 209 83 197 87 205 140 250 288Spill higha 138 220 98 224 104 205 140 250 288Spill meana 138 215 91 211 96 205 140 250 288Spill % b 63 64 30 65 30 64 41 66 63Temp. oCc 14 15 15 14 14 14 14 14 15Elev. forebayd 158 158 159 158 157 159 158 158 157Elev. tailwaterd 79 83 84 83 84 82 85 84 86
Gate openings at release (feet)Sitee 4/30 5/6 5/7 5/12 5/13 5/16 5/27 5/27 6/4 LocationBay 1 7 4
NorthBay 2 7Bay 3 9 10Bays 4-6Bay 7
Mid-North
Bay 8 10 5Bay 9Bay 10 6Bay 11Bay 12 8Bay 13
Mid-SouthBay 14 2Bay 15 6 1Bays 16, 17Bay 18
SouthBay 19 2Bays 20-22Bay 23 5a Thousand cubic feet per second (kcfs); c Temperature during holding. English units by COE convention. d Units in feet; English units by COE convention.b Percent of river flow in kcfs. e Bay 1 is to the north and Bay 23 to the south.

52
Appendix Table A3. Times, dates, and conditions during daylight releases of subyearlingchinook salmon at The Dalles Dam, 1998.
Date 6/23 6/24 6/27 6/30 7/3 7/8 7/9 7/10 7/11
Start time 1137 1047 1052 1014 1028 1115 1010 1025 1015End time 1240 1147 1118 1206 1100 1251 1020 1105 1039Median time 1208 1117 1105 1110 1044 1203 1015 1045 1027Turbine lowa 73 169 169 135 76 163 76 144 130Turbine higha 73 172 173 171 76 164 76 146 130Turbine meana 73 171 171 153 76 164 76 145 130Spill lowa 140 75 77 60 130 72 130 66 58Spill higha 140 75 77 80 130 72 130 66 58Spill meana 140 75 77 70 130 72 130 66 58Spill % b 64 30 30 31 61 30 61 30 30Temp. oCc 17 17 17 18 18.5 18 19 20 19Elev. forebayd 157 159 159 159 159 159 157 158 159Elev. tailwaterd 79 80 81 80 79 80 79 79 79
Gate openings at release (feet)Sitee 6/23 6/24 6/27 6/30 7/3 7/8 7/9 7/10 7/11 LocationBay 1 3 3
Slu
icew
ay O
nly
Slu
icew
ay O
nly
North
Bay 2 3 3 3Bay 3Bay 4Bay 5Bay 6 2 3Bay 7
Middle
Bay 8 3 5 3Bay 9Bay 10Bay 11Bay 12Bay 13
South
Bay 14 4 2Bay 15Bay 16Bay 17Bay 18Bay 19Bay 20Bay 21Bay 22Bay 23 3 3

53
Appendix Table A3. Continued.
Date 7/14 7/15 7/17 7/18 7/22 7/23 7/24
Start time 1032 1015 1040 1012 1035 1036 1008End time 1140 1015 1110 1040 1222 1237 1138Median time 1106 1015 1055 1026 1128 1136 1053Turbine lowa 134 75 68 126 137 58 106Turbine higha 135 75 68 126 139 58 106Turbine meana 135 75 68 126 138 58 106Spill lowa 60 141 122 59 61 100 45Spill higha 60 141 122 59 61 100 45Spill meana 60 141 122 59 61 100 45Spill %b 30 63 62 31 30 61 29Temp. oCc 19 21 20 21 21 21 21.5Elev. forebayd 159 159 158 158 159 158 158Elev. tailwaterd 78 79 78 79 79 78 78
Gate openings at release (feet)Sitee 7/14 7/15 7/17 7/18 7/22 7/23 7/24 LocationBay 1
Slu
icew
ay O
nly
North
Bay 2Bay 3Bay 4 3 1Bay 5Bay 6Bay 7
Middle
Bay 8 5Bay 9Bay 10 2Bay 11Bay 12 2 3Bay 13
South
Bay 14Bay 15Bay 16Bay 17 1 4Bay 18Bay 19 3 1Bay 20Bay 21Bay 22 2 3Bay 23a Thousand cubic feet per second (kcfs); c Temperature during holding. English units by COE convention. d Units in feet; English units by COE convention.b Percent of river flow in kcfs. e Bay 1 is to the north and Bay 23 to the south.

54
Appendix Table A4. Times, dates, and conditions during nighttime releases of subyearlingchinook salmon at The Dalles Dam, 1998.
Date 6/25 6/26 7/1 7/2 7/15 7/16 7/17 7/21 7/24
Start time 2227 2244 2218 2230 2155 2210 2232 2230 2205End time 2255 2315 2250 2305 2205 2250 2245 2319 2223Median time 2241 2259 2234 2247 2200 2230 2238 2254 2214Turbine lowa 72 186 104 132 75 151 74 60 111Turbine higha 72 213 104 177 75 151 74 65 111Turbine meana 72 200 104 155 75 151 74 63 111Spill lowa 144 80 192 60 140 66 144 128 54Spill higha 144 90 192 81 140 66 144 128 54Spill meana 144 85 192 71 140 66 144 128 54Spill %b 65 29 64 30 63 30 64 65 32Temp. oCc 17 17 18 18 21 21 21 21 21Elev. forebayd 160 158 159 158 159 157 158 159 158Elev. tailwaterd 79 82 81 81 79 79 79 78 78
Gate openings at release (feet)Sitee 6/25 6/26 7/1 7/2 7/15 7/16 7/17 7/21 7/24 LocationBay 1 7 4
North
Bay 2 8Bay 3Bay 4 4Bay 5Bay 6 10 5Bay 7
Middle
Bay 8 7Bay 9Bay 10 6 3Bay 11Bay 12 5 3Bay 13
South
Bay 14 3 2 2 3Bay 15Bay 16Bay 17Bay 18 2Bays 19-23
a Thousand cubic feet per second (kcfs); c Temperature during holding. English units by COE convention. d Units in feet; English units by COE convention.b Percent of river flow in kcfs. e Bay 1 is to the north and Bay 23 to the south.

55
Appendix Table A5. Water velocities at the location of fish releases at The Dalles Dam spillway,1998. Release sites were between pier-noses of each spill bay, about 7 mupstream from the gate and 3- to 4-m deep, depending on the gate opening.
Water velocity at designated depth
Gate opening(ft)
Flow*
(ft3/second)1-m depth (m/second) 5-m depth
(m/second)
3 4,500 0.3 0.4
4 6,800 0.5 0.5
5 7,500 0.6 0.7
6 9,000 0.9 0.9
8 12,000 1.0 1.1
10 15,000 1.2 1.4
12 18,000 1.5 1.5
* Units of measure in English units by COE convention.

56
Appendix Table A6. Releases, detections, proportions, and survival percentages for coho salmonat each site, separated by passage conditions during release at The DallesDam, 1998.
Tailrace, daytime 30% spill conditionTagdate
Rela
date Rel Bonneville 1 Bonneville 2 Jones Beach Rice Island Totalb
no. Detc Propd Det Prop Det Prop Det Prop Det Prop4/28 4/29 104 7 0.067 8 0.077 0 4 0.038 20 0.1924/30 5/1 174 11 0.063 12 0.069 4 0.023 4 0.023 29 0.1675/4 5/5 516 26 0.050 35 0.068 9 0.017 15 0.029 84 0.1635/8 5/9 850 63 0.074 19 0.022 13 0.015 38 0.045 128 0.1515/14 5/15 811 46 0.057 43 0.053 4 0.005 25 0.031 115 0.1425/14 5/155/20 5/21 1,048 48 0.046 68 0.065 0 59 0.056 170 0.1625/20 5/215/21 5/23 1,065 40 0.038 120 0.113 3 0.003 61 0.057 217 0.2045/21 5/235/22 5/23 1,199 36 0.030 103 0.086 4 0.003 79 0.066 209 0.1745/22 5/235/25 5/27 1,027 38 0.037 88 0.086 0 48 0.047 170 0.1665/27 5/29 989 69 0.070 45 0.046 0 40 0.040 149 0.1515/28 5/29 990 49 0.049 51 0.052 1 0.001 38 0.038 133 0.1345/28 5/29 995 37 0.037 48 0.048 1 0.001 35 0.035 119 0.1206/1 6/2 468 63 0.135 8 0.017 0 22 0.047 92 0.1976/2 6/3 648 63 0.097 20 0.031 1 0.002 27 0.042 107 0.1656/2 6/3Total/meane 10,884 596 0.056 668 0.053 40 0.004 495 0.041 1,742 0.162
Tailrace, nighttime 30% spill condition5/6 5/7 721 68 0.094 43 0.060 11 0.015 24 0.033 143 0.1985/6 5/7 713 67 0.094 43 0.060 9 0.013 24 0.034 140 0.1965/12 5/13 1,146 83 0.072 76 0.066 9 0.008 55 0.048 215 0.1885/12 5/135/26 5/27 997 48 0.048 30 0.030 0 61 0.061 136 0.136Total/mean 3,577 266 0.075 192 0.052 29 0.011 164 0.043 634 0.178

57
Appendix Table 6. Continued.
Tailrace, daytime 64% spill conditionTag Rel Rel Bonneville 1 Bonneville 2 Jones Beach Rice Island Totaldate date no. Det Prop Det Prop Det Prop Det Prop Det Prop4/27 4/28 133 12 0.090 9 0.068 0 3 0.023 24 0.1805/7 5/8 1,000 69 0.069 87 0.087 12 0.012 35 0.035 195 0.1955/7 5/85/9 5/10 836 72 0.086 76 0.091 8 0.010 46 0.055 192 0.2305/13 5/14 274 17 0.062 22 0.080 1 0.004 12 0.044 51 0.1865/13 5/14 279 11 0.039 22 0.079 2 0.007 14 0.050 47 0.1685/19 5/20 1,040 44 0.042 79 0.076 10 0.010 52 0.050 177 0.1705/19 5/205/23 5/25 791 24 0.030 117 0.148 3 0.004 38 0.048 178 0.2255/23 5/25 1,223 45 0.037 164 0.134 2 0.002 71 0.058 272 0.2225/24 5/26 953 24 0.025 49 0.051 1 0.001 37 0.039 108 0.1135/24 5/26 988 26 0.026 49 0.050 4 0.004 40 0.040 117 0.118Total/mean 7,517 344 0.046 674 0.082 43 0.005 348 0.043 1,361 0.176
Tailrace, nighttime 64% spill condition4/29 4/30 219 13 0.059 22 0.100 3 0.014 6 0.027 44 0.2015/5 5/6 1,083 83 0.077 37 0.034 25 0.023 21 0.019 157 0.1455/5 5/6 343 24 0.070 11 0.032 6 0.017 10 0.029 50 0.1465/11 5/12 918 106 0.115 55 0.060 6 0.007 33 0.036 197 0.2155/11 5/125/15 5/16 655 55 0.084 46 0.070 9 0.014 33 0.050 137 0.2095/15 5/165/26 5/27 1,120 53 0.047 35 0.031 0 68 0.061 150 0.1346/3 6/4 590 28 0.047 63 0.107 0 28 0.047 117 0.198Total/mean 4,928 362 0.068 269 0.055 49 0.014 199 0.036 852 0.175
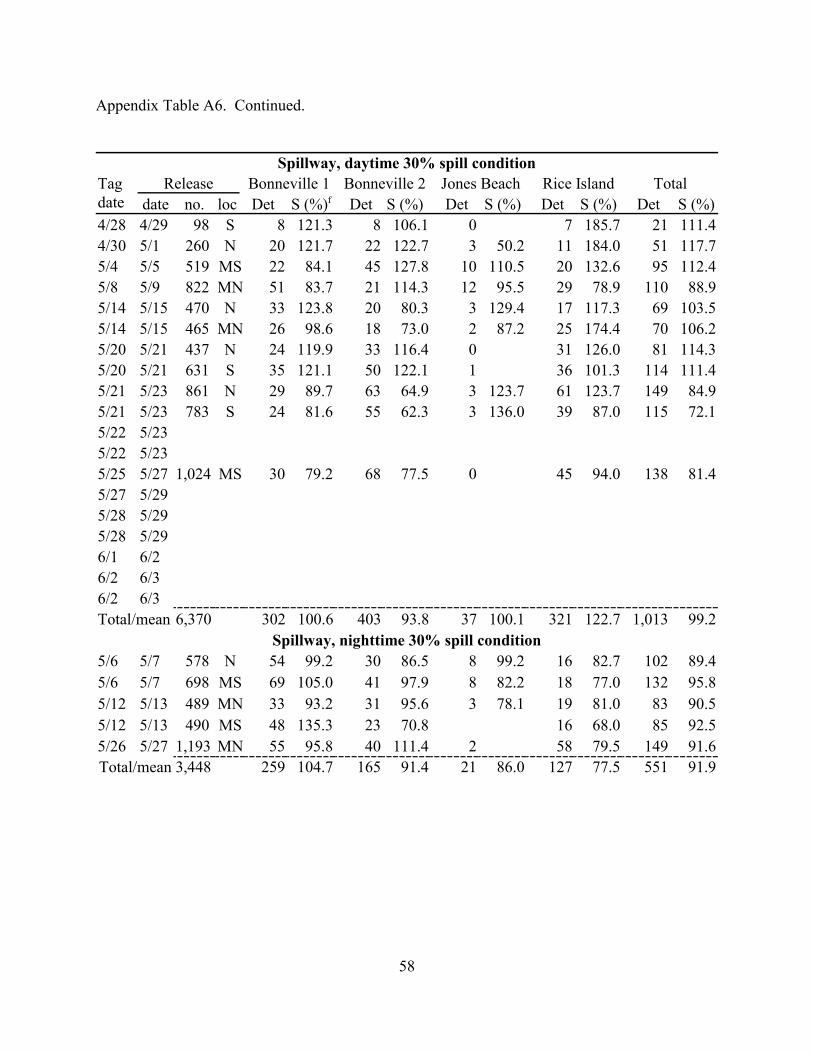
58
Appendix Table A6. Continued.
Spillway, daytime 30% spill conditionTagdate
Release Bonneville 1 Bonneville 2 Jones Beach Rice Island Totaldate no. loc Det S (%)f Det S (%) Det S (%) Det S (%) Det S (%)
4/28 4/29 98 S 8 121.3 8 106.1 0 7 185.7 21 111.44/30 5/1 260 N 20 121.7 22 122.7 3 50.2 11 184.0 51 117.75/4 5/5 519 MS 22 84.1 45 127.8 10 110.5 20 132.6 95 112.45/8 5/9 822 MN 51 83.7 21 114.3 12 95.5 29 78.9 110 88.95/14 5/15 470 N 33 123.8 20 80.3 3 129.4 17 117.3 69 103.55/14 5/15 465 MN 26 98.6 18 73.0 2 87.2 25 174.4 70 106.25/20 5/21 437 N 24 119.9 33 116.4 0 31 126.0 81 114.35/20 5/21 631 S 35 121.1 50 122.1 1 36 101.3 114 111.45/21 5/23 861 N 29 89.7 63 64.9 3 123.7 61 123.7 149 84.95/21 5/23 783 S 24 81.6 55 62.3 3 136.0 39 87.0 115 72.15/22 5/235/22 5/235/25 5/27 1,024 MS 30 79.2 68 77.5 0 45 94.0 138 81.45/27 5/295/28 5/295/28 5/296/1 6/26/2 6/36/2 6/3Total/mean 6,370 302 100.6 403 93.8 37 100.1 321 122.7 1,013 99.2
Spillway, nighttime 30% spill condition5/6 5/7 578 N 54 99.2 30 86.5 8 99.2 16 82.7 102 89.45/6 5/7 698 MS 69 105.0 41 97.9 8 82.2 18 77.0 132 95.85/12 5/13 489 MN 33 93.2 31 95.6 3 78.1 19 81.0 83 90.55/12 5/13 490 MS 48 135.3 23 70.8 16 68.0 85 92.55/26 5/27 1,193 MN 55 95.8 40 111.4 2 58 79.5 149 91.6Total/mean 3,448 259 104.7 165 91.4 21 86.0 127 77.5 551 91.9

59
Appendix Table A6. Continued.
Spillway, daytime 64% spill conditionTagdate
Release Bonneville 1 Bonneville 2 Jones Beach Rice Island Totaldate no. loc Det S (%)f Det S (%) Det S (%) Det S (%) Det S (%)
4/27 4/28 240 S 15 69.3 30 184.7 1 --- 8 147.8 54 124.75/7 5/8 980 MN 74 109.4 61 71.5 10 85.0 38 110.8 174 91.15/7 5/8 993 S 70 102.2 51 59.0 9 75.5 23 66.2 144 74.45/9 5/10 827 N 71 99.7 59 78.5 7 88.5 39 85.7 170 89.55/13 5/14 984 MN 52 104.4 53 67.7 5 93.7 43 92.9 144 82.65/13 5/145/19 5/20 558 N 28 118.6 36 84.9 1 18.6 32 114.7 92 96.95/19 5/20 557 MS 19 80.6 32 75.6 3 56.0 19 68.2 70 73.85/23 5/25 1,290 N 43 97.3 175 97.2 4 124.9 51 73.0 264 91.65/23 5/25 1,123 MN 32 83.2 154 98.3 4 143.5 53 87.2 230 91.75/24 5/26 986 MS 18 70.9 50 100.4 1 39.4 37 94.6 104 91.05/24 5/26 984 S 27 106.5 48 96.6 1 39.5 25 64.0 99 86.8Total/mean 9,522 449 93.4 749 88.1 46 65.9 368 90.7 1,545 89.5
Spillway, nighttime 64% spill condition4/29 4/30 217 N 10 77.6 16 73.4 1 33.6 3 50.5 30 68.85/5 5/6 993 N 74 99.3 46 137.6 13 60.2 27 125.1 150 104.15/5 5/6 509 MS 38 99.5 18 105.1 7 63.3 16 144.6 76 102.95/11 5/12 444 MN 37 72.2 24 90.2 1 34.5 23 144.1 81 85.05/11 5/12 403 S 33 70.9 25 103.5 4 151.9 19 131.2 76 87.95/15 5/16 652 N 46 84.0 37 80.8 5 55.8 24 73.1 107 78.55/15 5/16 662 MN 54 97.1 38 81.7 5 55.0 25 75.0 114 82.35/26 5/27 1,192 N 51 90.4 39 104.7 0 57 78.8 145 90.86/3 6/4 580 S 35 127.2 43 69.4 0 31 112.6 106 92.2Total/mean 5,652 378 89.5 286 92.1 36 57.4 225 98.1 885 87.4

60
Appendix Table A6. Continued.
Sluiceway, daytime 30% spill condition
Tagdate
Reldate
Relno.
Bonneville 1 Bonneville 2 Jones Beach Rice Island Total Det S (%) Det S (%) Det S (%) Det S (%) Det S (%)
4/28 4/29 100 7 104.0 9 117.0 1 4 104.0 20 104.04/30 5/1 148 6 64.1 23 225.3 0 5 147.0 33 133.85/4 5/5 518 41 157.1 44 125.2 5 55.3 12 79.7 99 117.45/8 5/9 826 62 101.3 20 108.3 10 79.2 28 75.8 111 89.25/14 5/15 810 38 82.7 40 93.1 5 125.2 29 116.1 111 96.65/14 5/15 5/20 5/21 1,058 56 115.6 50 72.8 0 57 95.7 155 90.35/20 5/215/21 5/23 1,062 38 95.3 83 69.4 3 100.3 43 70.7 159 73.55/21 5/235/22 5/23 1,054 38 120.1 82 90.6 6 170.6 46 66.2 163 88.75/22 5/23 1,115 50 149.4 84 87.7 3 80.7 47 64.0 178 91.65/25 5/27 1,038 35 91.1 86 96.7 0 56 115.4 171 99.55/27 5/29 564 31 78.8 15 58.5 0 22 96.4 66 77.75/28 5/29 997 37 85.7 38 76.4 1 99.5 42 114.5 115 90.95/28 5/29 1,015 53 120.5 35 69.1 2 195.6 50 133.9 134 104.06/1 6/2 492 73 110.2 4 47.6 0 21 90.8 94 97.26/2 6/3 650 57 90.2 15 74.8 0 34 125.5 105 97.86/2 6/3 649 52 82.4 20 99.8 0 32 118.3 98 91.4Total/mean 12,096 674 100.3 648 88.5 36 105.0 528 97.9 1,812 95.5
a Rel = Releaseb Total (used for combined analysis) is the number of unique tags observed at any of the sites.
Multiple observations of a tag are not counted. Numbers observed at individual sites mayinclude tags observed at other sites, and these data are used to make the inter-sitecomparisons.
c Det = Detected (number of fish detected).d Prop = Proportion detected (number of fish detected ÷ number of fish released).e mean is geometric meanf S(%) = Survival percentage (detected proportion of spillway- or sluiceway-released fish ÷
detected proportion of tailrace-released fish x 100).

61
Appendix Table A7. Releases, detections, proportions, and survival percentages for chinooksalmon at each site, separated by passage conditions during release at TheDalles Dam, 1998.
Tailrace, daytime 30% spill condition
Tagdate
Release date
Numberreleased
Bonneville 1 Bonneville 2 Rice Island Totala
Detb Propc Det Prop Det Prop Det Prop6/23 6/24 993 15 0.015 32 0.032 8 0.008 54 0.0546/23 6/246/26 6/27 991 15 0.015 78 0.079 9 0.009 102 0.1036/26 6/27 992 14 0.014 71 0.072 11 0.011 95 0.0966/29 6/30 978 13 0.013 86 0.088 9 0.009 107 0.1096/29 6/30 763 15 0.020 70 0.092 10 0.013 94 0.1237/7 7/8 706 3 0.004 11 0.016 10 0.014 23 0.0337/7 7/8 985 7 0.007 16 0.016 6 0.006 29 0.0297/9 7/10 966 11 0.011 7 0.007 8 0.008 26 0.0277/9 7/10 982 14 0.014 7 0.007 11 0.011 32 0.0337/10 7/11 989 13 0.013 16 0.016 12 0.012 41 0.0417/10 7/11 979 15 0.015 13 0.013 6 0.006 33 0.0347/13 7/14 988 13 0.013 44 0.045 22 0.022 79 0.0807/13 7/147/17 7/18 485 6 0.012 6 0.012 8 0.016 19 0.0397/17 7/18 491 7 0.014 8 0.016 7 0.014 22 0.0457/21 7/22 735 8 0.011 12 0.016 9 0.012 29 0.0397/21 7/22 769 4 0.005 16 0.021 12 0.016 32 0.0427/23 7/24 722 20 0.028 19 0.026 11 0.015 49 0.0687/23 7/24Total/meand 14,514 193 0.012 512 0.024 169 0.011 866 0.052
Tailrace, nighttime 30% spill condition6/25 6/26 991 29 0.029 67 0.068 11 0.011 106 0.1076/25 6/26 964 30 0.031 51 0.053 11 0.011 92 0.0957/1 7/2 964 18 0.019 11 0.011 14 0.015 43 0.0457/1 7/2 836 22 0.026 14 0.017 5 0.006 41 0.0497/15 7/16 476 20 0.042 10 0.021 3 0.006 33 0.0697/15 7/16 470 23 0.049 8 0.017 2 0.004 32 0.0687/23 7/24 702 23 0.033 0 11 0.016 33 0.047Total/mean 5,403 165 0.031 161 0.025 57 0.009 380 0.065
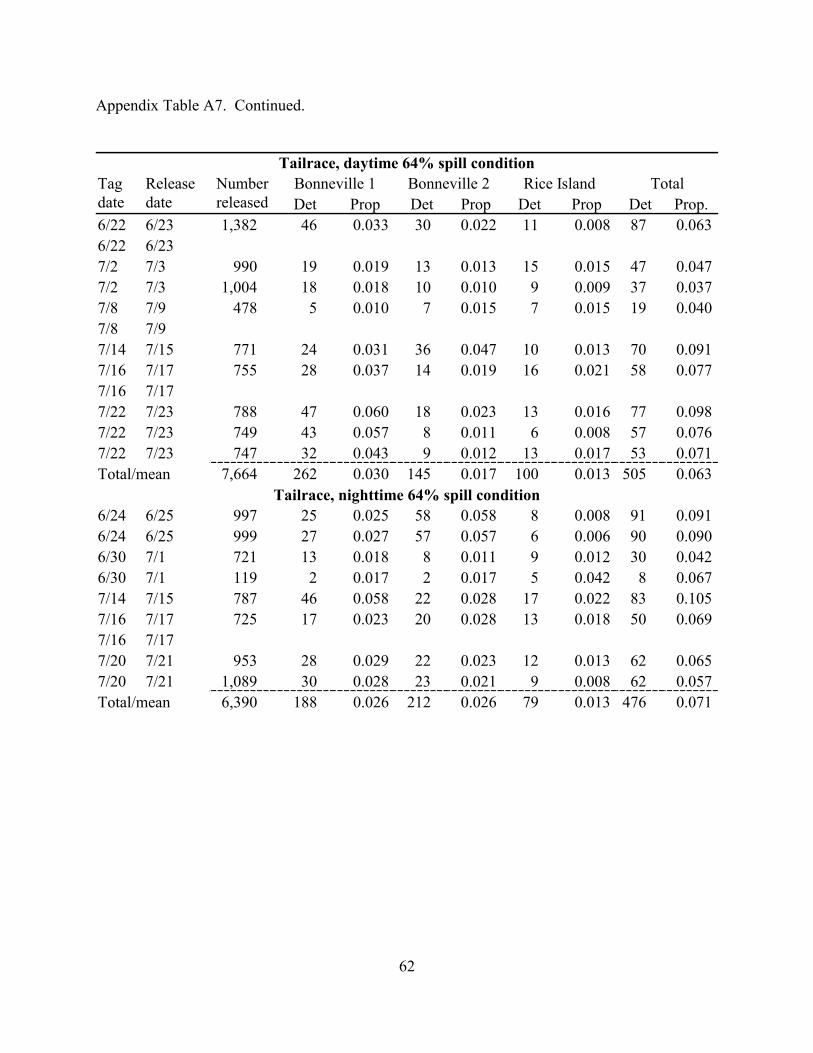
62
Appendix Table A7. Continued.
Tailrace, daytime 64% spill conditionTagdate
Releasedate
Numberreleased
Bonneville 1 Bonneville 2 Rice Island TotalDet Prop Det Prop Det Prop Det Prop.
6/22 6/23 1,382 46 0.033 30 0.022 11 0.008 87 0.0636/22 6/237/2 7/3 990 19 0.019 13 0.013 15 0.015 47 0.0477/2 7/3 1,004 18 0.018 10 0.010 9 0.009 37 0.0377/8 7/9 478 5 0.010 7 0.015 7 0.015 19 0.0407/8 7/97/14 7/15 771 24 0.031 36 0.047 10 0.013 70 0.0917/16 7/17 755 28 0.037 14 0.019 16 0.021 58 0.0777/16 7/177/22 7/23 788 47 0.060 18 0.023 13 0.016 77 0.0987/22 7/23 749 43 0.057 8 0.011 6 0.008 57 0.0767/22 7/23 747 32 0.043 9 0.012 13 0.017 53 0.071Total/mean 7,664 262 0.030 145 0.017 100 0.013 505 0.063
Tailrace, nighttime 64% spill condition6/24 6/25 997 25 0.025 58 0.058 8 0.008 91 0.0916/24 6/25 999 27 0.027 57 0.057 6 0.006 90 0.0906/30 7/1 721 13 0.018 8 0.011 9 0.012 30 0.0426/30 7/1 119 2 0.017 2 0.017 5 0.042 8 0.0677/14 7/15 787 46 0.058 22 0.028 17 0.022 83 0.1057/16 7/17 725 17 0.023 20 0.028 13 0.018 50 0.0697/16 7/177/20 7/21 953 28 0.029 22 0.023 12 0.013 62 0.0657/20 7/21 1,089 30 0.028 23 0.021 9 0.008 62 0.057Total/mean 6,390 188 0.026 212 0.026 79 0.013 476 0.071
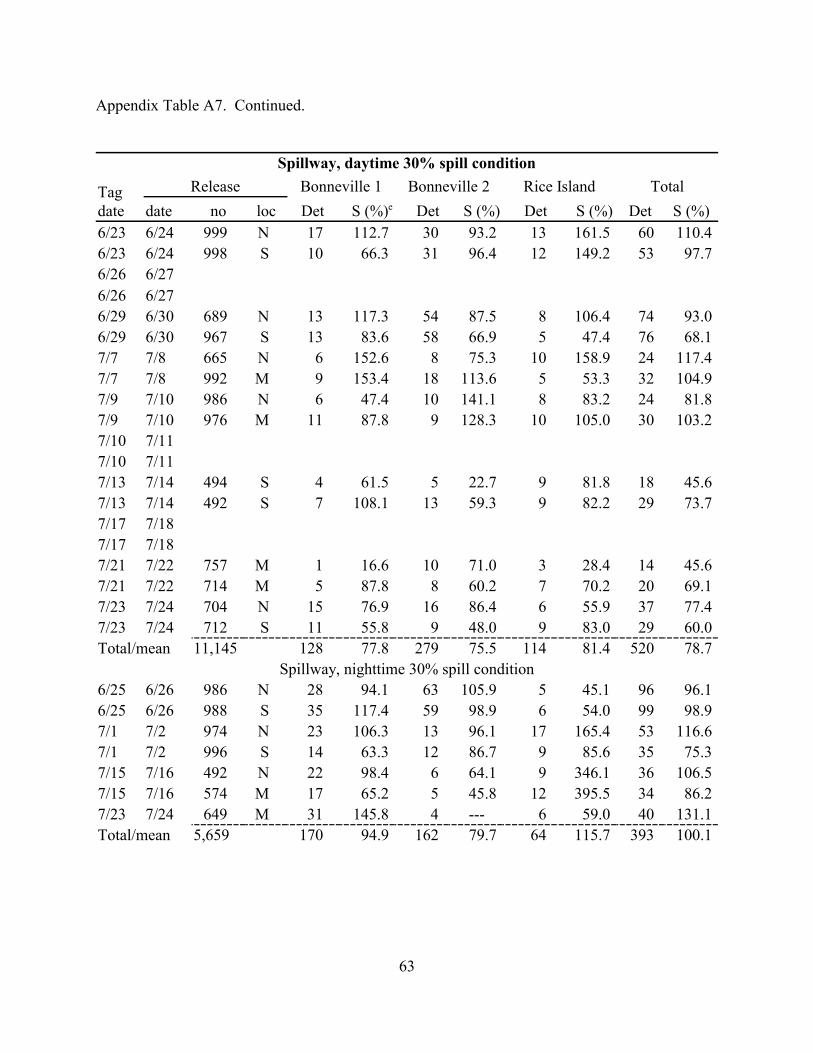
63
Appendix Table A7. Continued.
Spillway, daytime 30% spill condition
Tagdate
Release Bonneville 1 Bonneville 2 Rice Island Total
date no loc Det S (%)e Det S (%) Det S (%) Det S (%)6/23 6/24 999 N 17 112.7 30 93.2 13 161.5 60 110.46/23 6/24 998 S 10 66.3 31 96.4 12 149.2 53 97.76/26 6/276/26 6/276/29 6/30 689 N 13 117.3 54 87.5 8 106.4 74 93.06/29 6/30 967 S 13 83.6 58 66.9 5 47.4 76 68.17/7 7/8 665 N 6 152.6 8 75.3 10 158.9 24 117.47/7 7/8 992 M 9 153.4 18 113.6 5 53.3 32 104.97/9 7/10 986 N 6 47.4 10 141.1 8 83.2 24 81.87/9 7/10 976 M 11 87.8 9 128.3 10 105.0 30 103.27/10 7/117/10 7/117/13 7/14 494 S 4 61.5 5 22.7 9 81.8 18 45.67/13 7/14 492 S 7 108.1 13 59.3 9 82.2 29 73.77/17 7/187/17 7/187/21 7/22 757 M 1 16.6 10 71.0 3 28.4 14 45.67/21 7/22 714 M 5 87.8 8 60.2 7 70.2 20 69.17/23 7/24 704 N 15 76.9 16 86.4 6 55.9 37 77.47/23 7/24 712 S 11 55.8 9 48.0 9 83.0 29 60.0Total/mean 11,145 128 77.8 279 75.5 114 81.4 520 78.7
Spillway, nighttime 30% spill condition6/25 6/26 986 N 28 94.1 63 105.9 5 45.1 96 96.16/25 6/26 988 S 35 117.4 59 98.9 6 54.0 99 98.97/1 7/2 974 N 23 106.3 13 96.1 17 165.4 53 116.67/1 7/2 996 S 14 63.3 12 86.7 9 85.6 35 75.37/15 7/16 492 N 22 98.4 6 64.1 9 346.1 36 106.57/15 7/16 574 M 17 65.2 5 45.8 12 395.5 34 86.27/23 7/24 649 M 31 145.8 4 --- 6 59.0 40 131.1Total/mean 5,659 170 94.9 162 79.7 64 115.7 393 100.1

64
Appendix Table A7. Continued.
Spillway, daytime 64% spill condition
Tagdate
Release Bonneville 1 Bonneville 2 Rice Island Total
date no loc Det S (%)e Det S (%) Det S (%) Det S (%)6/22 6/23 699 N 26 111.7 14 92.3 6 107.8 44 100.06/22 6/23 676 S 13 57.8 13 88.6 12 223.0 37 86.97/2 7/3 990 N 17 92.5 15 131.4 11 92.3 43 103.17/2 7/3 995 S 13 70.4 13 113.3 10 83.5 36 85.97/8 7/9 495 N 7 135.2 1 13.8 6 82.8 14 71.27/8 7/9 499 M 7 134.1 4 54.7 5 68.4 16 80.77/14 7/15 921 M 15 52.3 30 69.8 8 67.0 53 63.47/16 7/17 356 S 5 37.9 7 106.0 6 79.5 18 65.87/16 7/17 471 S 5 28.6 5 57.2 7 70.1 17 47.07/22 7/23 709 N 36 95.1 9 82.8 16 161.1 60 103.47/22 7/23 738 M 10 25.4 6 53.1 3 29.0 19 31.47/22 7/23 749 S 22 55.0 8 69.7 7 66.7 37 60.3Total/mean 8,298 176 65.0 125 69.1 97 83.9 394 71.2
Tailrace, Nighttime 64% spill condition6/24 6/25 997 N 36 138.6 56 97.5 5 71.5 97 107.36/24 6/25 978 S 30 117.7 40 71.0 13 189.5 81 91.36/30 7/1 732 N 11 84.2 7 80.3 6 49.2 23 69.56/30 7/1 692 S 7 56.6 6 72.8 13 112.7 26 83.17/14 7/15 782 M 30 65.6 13 59.5 13 77.0 56 67.97/16 7/17 396 N 2 21.5 7 64.1 8 112.7 17 62.27/16 7/17 368 M 5 57.9 4 39.4 6 90.9 15 59.17/20 7/21 1,327 M 26 69.0 36 123.1 18 131.9 79 98.07/20 7/21 938 S 17 63.8 18 87.1 11 114.0 46 80.8Total/mean 7,210 164 67.2 187 73.8 93 98.7 440 78.4

65
Appendix Table A7. Continued.
Sluiceway, daytime 30% spill condition
Tagdate
Releasedate
Numberreleased
Bonneville 1 Bonneville 2 Rice Island Total
Det S (%) Det S (%) Det S (%) Det S (%)6/23 6/24 996 8 53.2 32 99.7 10 124.6 49 90.56/23 6/246/26 6/27 968 19 134.1 49 67.2 10 101.4 77 80.06/26 6/27 956 15 107.2 55 76.4 5 51.3 75 78.96/29 6/30 935 19 121.7 75 89.5 9 85.5 103 95.16/29 6/30 768 17 132.5 63 91.5 7 81.0 87 97.87/7 7/8 729 7 153.6 18 154.6 9 110.9 34 151.37/7 7/8 982 10 162.9 11 70.1 7 64.0 28 92.57/9 7/107/9 7/107/10 7/11 993 14 98.5 14 94.8 11 109.3 39 103.47/10 7/11 981 9 64.1 11 75.4 6 60.4 26 69.77/13 7/14 989 16 123.0 34 77.2 13 59.0 62 78.47/13 7/147/17 7/18 530 3 42.3 6 77.5 5 61.1 14 62.67/17 7/18 474 6 94.6 9 129.9 8 109.2 23 115.07/21 7/22 770 6 86.7 9 61.9 7 64.2 21 67.27/21 7/22 736 7 105.8 10 71.9 8 76.7 25 83.77/23 7/24 790 26 118.8 17 81.8 7 58.2 50 93.37/23 7/24Total/mean 12,597 182 100.3 413 85.3 122 77.9 713 88.7
Sluiceway, daytime 64% spill condition6/22 6/23 1,618 42 78.0 26 74.0 21 163.1 88 86.4Total/mean 1,618 42 86.2 26 95.7 21 100.5 88 86.0
a Total (used for combined analysis) is the number of unique tags observed at any of the sites. Multiple observations of a tag are not counted. Numbers observed at individual sites mayinclude tags observed at other sites, and these data are used to make the inter-site comparisons.
b Det = Detected (number of fish detected).c Prop = Proportion detected (number of fish detected ÷ number of fish released).d mean is geometric meane S = Survival percentage (detected proportion of spillway- or sluiceway-released fish ÷ detected
proportion of tailrace-released fish x 100).

66
Appendix B Statistical Analyses of Pit-Tag Interrogation Data, Fork Length Data, and Passage Condition Data in Relation to Relative Survival
for The Dalles Dam Juvenile Passage Survival Study

67
Appendix Table B1. Analysis of variance for log-transformed relative survival proportions derived for coho salmon passing through the spillway and sluiceway at TheDalles Dam, 1998.
All recoveries
Analysis of Variance for Ln (Spill Survival), using Adjusted SS for Tests
Source df Seq SS SS (adj) MS (adj) F P
Julian day 1 0.05183 0.04150 0.04150 1.82 0.191
Diel 1 0.03247 0.01081 0.01081 0.47 0.499
Spill (%) 1 0.05142 0.01824 0.01824 0.80 0.381
Bay index 3 0.00816 0.00312 0.00104 0.05 0.987
Diel × Spill (%) 1 0.00238 0.00680 0.00680 0.30 0.591
Diel × Bay index 3 0.04909 0.04156 0.01385 0.61 0.618
Spill (%) × Bay index 3 0.00539 0.00539 0.00180 0.08 0.971
Error 22 0.50251 0.50251 0.02284
Total 35 0.70327
Term Coef SE T P
Constant 0.4787 0.4225 1.13 0.269
Julian day -0.004214 0.003126 -1.35 0.191
Least Squares Means* for Ln (Spill Survival)
Back transformed
Diel Mean SE Mean SE 95% CI
1 (Daytime) -0.0639 0.0332 0.9381 0.0311 0.8758 to 1.0049
2 (Nighttime) -0.1054 0.0502 0.9000 0.0452 0.8110 to 0.9987
Spill (%)
1 (30%) -0.0575 0.0482 0.9441 0.0455 0.8544 to 1.0433
2 (64%) -0.1118 0.0363 0.8942 0.0324 0.8294 to 0.9641
Bay index
1 (North) -0.0856 0.04781 0.9180 0.0438 0.8314 to 1.0135
2 (N. Mid) -0.1015 0.05111 0.9035 0.0461 0.8127 to 1.0044
3 (S. Mid) -0.0803 0.05891 0.9228 0.0544 0.8167 to 1.0428
4 (South) -0.0713 0.0775 0.9312 0.0722 0.7929 to 1.0936The regression equation is: Ln (Sluice Survival) = 1.04 - 0.00779 × (Julian day)
Term Coef SD T PR2 (adj) = 29.2%
Constant 1.0374 0.4419 2.35 0.039
Julian day -0.007788 0.003195 -2.44 0.033

68
Appendix Table B1. Continued.
Bonneville and Jones Beach Recoveries Only
Analysis of Variance for Ln (Spill Survival), using Adjusted SS for Tests
Source df Seq SS SS (adj) MS (adj) F P
Julian day 1 0.03152 0.02824 0.02824 1.02 0.323
Diel 1 0.01014 0.00050 0.00050 0.02 0.894
Spill (%) 1 0.06914 0.05606 0.05606 2.03 0.168
Bay index 3 0.01474 0.01002 0.00334 0.12 0.947
Diel × Spill (%) 1 0.02193 0.01244 0.01244 0.45 0.509
Diel × Bay index 3 0.02775 0.02728 0.00909 0.33 0.804
Spill (%) × Bayindex 3 0.00056 0.00056 0.00019 0.01 0.999
Error 22 0.60667 0.60667 0.02758
Total 35 0.78246
Term Coef SE T P
Constant 0.3965 0.4795 0.83 0.417
Julian day -0.003583 0.003540 -1.01 0.323
Least Squares Means* for Ln (Spill Survival)
Back transformed
Diel Mean SE Mean SE
1 (Daytime) -0.0781 0.03639 0.9249 0.0337
2 (Nighttime) -0.0868 0.05311 0.9169 0.0487
Spill (%)
1 (30%) -0.0361 0.05071 0.9645 0.0489
2 (64%) -0.1289 0.0403 0.8791 0.0354
Bay index
1 (North) -0.0833 0.049 0.9201 0.0451
2 (N. MID) -0.1083 0.0561 0.8974 0.0503
3 (S. MID) -0.0914 0.06478 0.9127 0.0591
4 (South) -0.0469 0.08591 0.9542 0.0820
The regression equation is: Ln (Sluice Surv.) = 1.47 - 0.0109 × (Julian day)
Term Coef SE T PR2 (adj) = 46.0%
Constant 1.4729 0.4508 3.27 0.008
Julian day -0.010920 0.003259 -3.35 0.006

69
Appendix Table B1. Continued.
Rice Island Recoveries Only
Analysis of Variance for Ln (Spill Survival), using Adjusted SS for Tests
Source df Seq SS SS (adj) MS (adj) F P
Julian day 1 0.28250 0.42829 0.42829 5.22 0.032Diel 1 0.20481 0.03615 0.03615 0.44 0.514Spill (%) 1 0.08812 0.02554 0.02554 0.31 0.582Bay index 3 0.06130 0.14967 0.04989 0.61 0.617Diel × Spill (%) 1 0.59561 0.24001 0.24001 2.93 0.101Diel × bay index 3 0.40731 0.37512 0.12504 1.53 0.236Spill (%) × bay index 3 0.20613 0.20613 0.06871 0.84 0.487Error 22 1.80371 1.80371 0.08199Total 35 3.64950
Term Coef SE T P
Constant 1.8632 0.8267 2.25 0.035
Julian day -0.013952 0.006104 -2.29 0.032
Least Squares Means* for Ln (Spill Survival)Back transformed
Diel Mean SE Mean SE1 (Day) 0.03472 0.06275 1.0353 0.06502 (Night) -0.0389 0.09157 0.9618 0.0881Spill (%)1 (30%) 0.02924 0.08744 1.0297 0.09002 (64%) -0.03342 0.06949 0.9671 0.0672Bay index1 (North) -0.08421 0.08449 0.9192 0.07772 (N. MID.) -0.0036 0.09672 0.9964 0.09643 (S. MID.) -0.05654 0.1117 0.9450 0.10564 (South) 0.136 0.14813 1.1457 0.1697
The regression equation is: Ln (Sluice Surv) = 0.030 - 0.00041 × (Julian day)Term Coef SE T P
Constant 0.0303 0.8539 0.04 0.972
Julian day -0.000409 0.006173 -0.07 0.948
R2 (adj) = 0.0%
* Least square means are not equal to the raw data means due to an unbalanced experimental design.
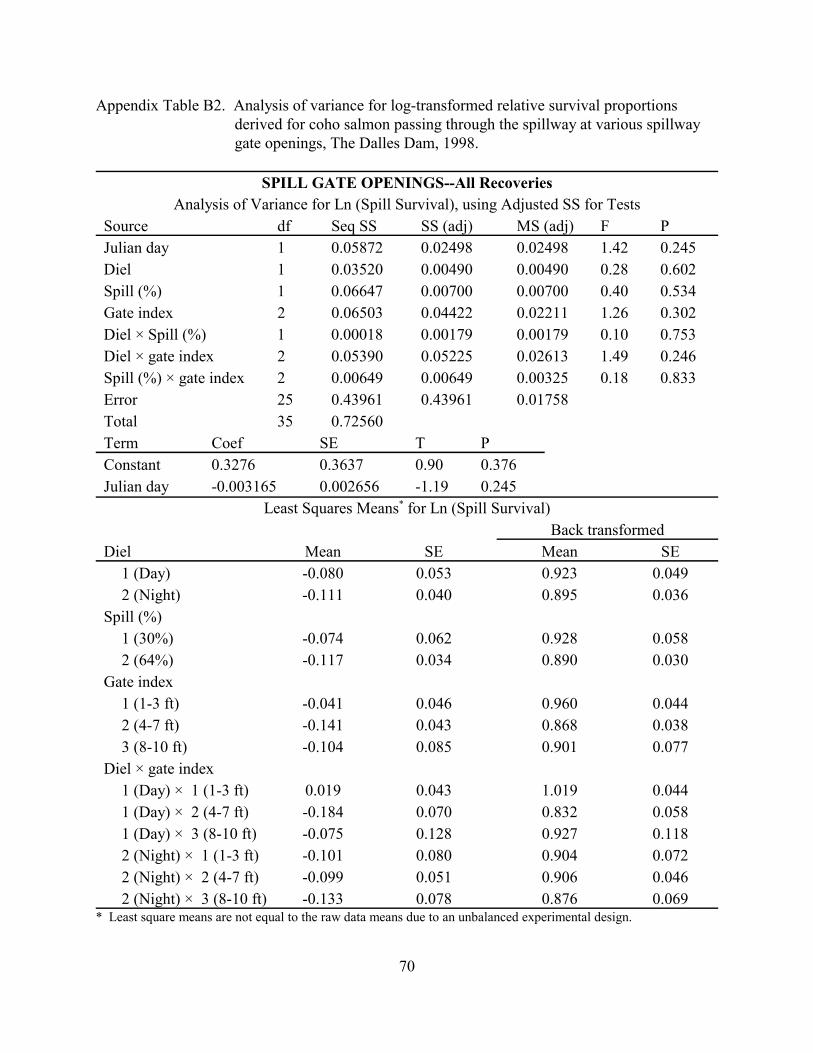
70
Appendix Table B2. Analysis of variance for log-transformed relative survival proportionsderived for coho salmon passing through the spillway at various spillway gate openings, The Dalles Dam, 1998.
SPILL GATE OPENINGS--All RecoveriesAnalysis of Variance for Ln (Spill Survival), using Adjusted SS for Tests
Source df Seq SS SS (adj) MS (adj) F PJulian day 1 0.05872 0.02498 0.02498 1.42 0.245Diel 1 0.03520 0.00490 0.00490 0.28 0.602Spill (%) 1 0.06647 0.00700 0.00700 0.40 0.534Gate index 2 0.06503 0.04422 0.02211 1.26 0.302Diel × Spill (%) 1 0.00018 0.00179 0.00179 0.10 0.753Diel × gate index 2 0.05390 0.05225 0.02613 1.49 0.246Spill (%) × gate index 2 0.00649 0.00649 0.00325 0.18 0.833Error 25 0.43961 0.43961 0.01758Total 35 0.72560Term Coef SE T PConstant 0.3276 0.3637 0.90 0.376Julian day -0.003165 0.002656 -1.19 0.245
Least Squares Means* for Ln (Spill Survival)Back transformed
Diel Mean SE Mean SE1 (Day) -0.080 0.053 0.923 0.0492 (Night) -0.111 0.040 0.895 0.036
Spill (%)1 (30%) -0.074 0.062 0.928 0.0582 (64%) -0.117 0.034 0.890 0.030
Gate index1 (1-3 ft) -0.041 0.046 0.960 0.0442 (4-7 ft) -0.141 0.043 0.868 0.0383 (8-10 ft) -0.104 0.085 0.901 0.077
Diel × gate index1 (Day) × 1 (1-3 ft) 0.019 0.043 1.019 0.0441 (Day) × 2 (4-7 ft) -0.184 0.070 0.832 0.0581 (Day) × 3 (8-10 ft) -0.075 0.128 0.927 0.1182 (Night) × 1 (1-3 ft) -0.101 0.080 0.904 0.0722 (Night) × 2 (4-7 ft) -0.099 0.051 0.906 0.0462 (Night) × 3 (8-10 ft) -0.133 0.078 0.876 0.069
* Least square means are not equal to the raw data means due to an unbalanced experimental design.

71
Appendix Table B3. Relative passage survival for coho salmon in relation to controlled and uncontrolled variables.
Spillway SluicewayTagday
Julianday Diela
Spillb (%) Bay indexc Gateindexd
Relativesurvival
Lntransformed
Relativesurvival
Lntransformed
4/27 117 1 2 4 1 1.247 0.22064/28 118 1 1 4 1 1.114 0.1082 1.04 0.03924/29 119 2 2 1 2 0.688 -0.37384/30 120 1 1 1 1 1.177 0.1629 1.34 0.29115/4 124 1 1 3 1 1.124 0.1173 1.17 0.16045/5 125 2 2 1 2 1.041 0.03985/5 125 2 2 3 2 1.029 0.02825/6 126 2 1 1 2 0.894 -0.11185/6 126 2 1 3 1 0.958 -0.04265/7 127 1 2 2 3 0.911 -0.09375/7 127 1 2 4 2 0.744 -0.29625/8 128 1 1 2 1 0.889 -0.1181 0.89 -0.11395/9 129 1 2 1 2 0.895 -0.11095/11 131 2 2 2 3 0.850 -0.16245/11 131 2 2 4 1 0.879 -0.12925/12 132 2 1 2 2 0.905 -0.10015/12 132 2 1 3 1 0.925 -0.07845/13 133 1 2 2 3 0.826 -0.19145/14 134 1 1 1 1 1.035 0.0347 0.97 -0.03425/14 134 1 1 2 1 1.062 0.05985/15 135 2 2 1 3 0.785 -0.24265/15 135 2 2 2 3 0.823 -0.19445/19 139 1 2 1 1 0.969 -0.03175/19 139 1 2 3 2 0.738 -0.30325/20 140 1 1 1 1 1.143 0.1334 0.90 -0.10195/20 140 1 1 4 1 1.114 0.10775/21 141 1 1 1 1 0.849 -0.1633 0.73 -0.30825/21 141 1 1 4 1 0.721 -0.32745/22 142 1 1 0.90 -0.10325/23 143 1 2 1 1 0.916 -0.08785/23 143 1 2 2 3 0.917 -0.08705/24 144 1 2 3 2 0.910 -0.09445/24 144 1 2 4 2 0.868 -0.14165/25 145 1 1 3 2 0.814 -0.2056 1.00 -0.00485/26 146 2 1 2 2 0.916 -0.08825/26 146 2 2 1 3 0.908 -0.09625/27 147 1 1 0.78 -0.25275/28 148 1 1 0.97 -0.02556/1 152 1 1 0.97 -0.02856/2 153 1 1 0.95 -0.05516/3 154 2 2 4 2 0.922 -0.0816
Geomean: 0.922 -0.082 0.960 -0.041SE: 0.022 0.024 0.041 0.043
95% CI: 0.879 0.966 0.87 1.05a Diel: 1 for daytime, 2 for nighttime.b Spill (%): 1 for 30% and 2 for 64%.c Bay index: 1 for north Bays 1-6, 2 for mid-north Bays 7-12, 3 for mid-south Bays 13-17, and 4 for south Bays 18-
23.d Gate index: 1 for 1-3 ft, 2 for 4-7 ft, and 3 for 8-10 ft gate openings.

72
Addendum to Appendix Table B3.
0.50.60.70.80.91.01.11.21.3
0 1 2Spill Percent Index
Rel
ativ
e S
urv
ival
0.50.6
0.70.80.9
1.01.1
1.21.3
0 1 2 3 4Bay Index
Rel
ativ
e S
urv
ival
y = -0.0045x + 161.63
R2 = 0.0944
0.50.60.70.80.91.01.11.21.3
4/2
5
4/3
0
5/5
5/1
0
5/1
5
5/2
0
5/2
5
5/3
0
6/4
6/9
TagdayR
elat
ive
spill
way
p
assa
ge
surv
ival
y = -0.0076x + 274.06
R2 = 0.3407
0.50.60.70.80.9
11.11.21.31.4
4/2
5
4/3
0
5/5
5/1
0
5/1
5
5/2
0
5/2
5
5/3
0
6/4
6/9
Tagday
Rel
ativ
e sl
uic
eway
p
assa
ge
surv
ival
0.50.60.7
0.80.91.01.1
1.21.3
0 1 2Diel Index
Rel
ativ
e S
urv
ival
0.50.60.70.80.91.01.11.21.3
0 1 2 3Gate Opening Index
Rel
ativ
e S
urv
ival

73
Appendix Table B4. PIT-tag detections in relation to size at release comparing proportionsabove and below the critical size for radio telemetry evaluations; cohosalmon from The Dalles Survival Study, 1998.
Fork length <=125 mm Fork length >125 mmDetected PIT tagsa Detected PIT tagsa
Tag Release Bonnevilleb Rice Island Release Bonneville b Rice Island date no. c no. Propd no. Propd no. c no. Propd no. Propd
4/27 5 0 1 51 9 14/28 3 1 0 82 14 74/29 14 1 1 202 34 54/30 5 1 0 140 28 55/4 93 13 0.133 3 0.042 463 53 0.147 13 0.0335/5 105 13 0.124 7 0.067 588 67 0.114 13 0.0225/6 67 12 0.179 4 450 54 0.120 115/7 81 12 0.148 1 680 83 0.122 185/8 41 4 1 224 14 95/9 32 4 0.110 0 0.027 233 38 0.114 12 0.0325/11 60 7 0.117 5 338 60 0.178 85/12 48 7 0.146 1 463 69 0.149 225/13 55 8 0.145 1 517 64 0.124 255/14 40 3 0 222 28 165/15 23 6 0.143 1 0.035 363 56 0.144 16 0.0465/19 136 17 0.125 6 917 106 0.116 455/20 45 7 0.156 3 0.050 363 43 0.118 24 0.0545/21-27 0 0 0 0 0 05/28 3 1 0 37 5 16/1-3 0 0 0 0 0 0Total 856 117 0.137 35 0.041 6,333 825 0.130 251 0.040
Bonneville ratio: <=125 to >125mm Rice I. ratio: <=125 to >125mmLn Ln
Geomean: 1.056 0.055 Geomean: 1.19 0.170 SE: 0.064 0.061 SE: 0.248 0.217 95% CI: 0.930 to 1.200 95% CI: 0.585 to 2.056
t: 0.90 t: 0.001 0.78 df: 20 df: 8 P: 0.38 P: 0.46
a In instances where detections/recoveries were few, proportions were based on cumulative data for several releasedays. For analysis, the minimum detection was five fish for the size category with the least number.
b Detections from Bonneville Dam or Jones Beach. c All release sites combined by day. d Prop = Proportion detected (number of fish detected ÷ number of fish released).

74
Appendix Table B5. Relative survival of daytime vs. nighttime passage for coho and chinooksalmon at The Dalles Dam spillway, 1997 and 1998.
Springtime migration--Coho salmon1997 block 1 1998 block 2 1998 block 3
Day 64% spill
Night 64%spill
Day 30%spill
Night 30%spill
Day 64%spill
Night 64%spill
Prop. Ln Prop. Ln Prop. Ln Prop. Ln Prop. Ln Prop. Ln0.986 -0.014 0.843 -0.171 1.114 0.108 0.894 -0.112 1.247 0.221 0.688 -0.3740.922 -0.081 0.805 -0.217 1.177 0.163 0.958 -0.043 0.911 -0.094 1.041 0.0400.871 -0.138 0.798 -0.226 1.124 0.117 0.905 -0.100 0.744 -0.296 1.029 0.0280.798 -0.226 0.804 -0.218 0.889 -0.118 0.925 -0.078 0.895 -0.111 0.850 -0.1620.864 -0.146 0.921 -0.082 1.035 0.035 0.900 -0.105 0.826 -0.191 0.879 -0.1290.483 -0.728 0.976 -0.024 1.062 0.060 0.924 -0.079 0.969 -0.032 0.785 -0.2430.813 -0.207 0.582 -0.541 1.143 0.133 0.738 -0.303 0.823 -0.1940.731 -0.313 0.898 -0.108 1.114 0.108 0.916 -0.088 0.922 -0.0821.162 0.150 0.848 -0.165 0.849 -0.163 0.917 -0.0870.610 -0.494 0.915 -0.089 0.721 -0.327 0.910 -0.094
1.010 0.010 0.814 -0.206 0.868 -0.142Geometric means
0.803 -0.220 0.847 -0.166 0.992 -0.008 0.918 -0.086 0.895 -0.111 0.870 -0.140
Analysis of Variance for Ln (surv)Source df Seq SS Adj SS Adj
MSF P
DayNight 1 0.012 0.004 0.004 0.160 0.691Block 2 0.219 0.19 0.095 3.520 0.037DayNight*Block 2 0.041 0.041 0.02 0.750 0.478Error 51 1.378 1.378 0.027Total 56 1.649
.
Ln Ln Back transformedDayNight Mean SE Mean SE1 (Day) -0.113 0.0291 0.89 0.03
2 (Nite) -0.131 0.0339 0.88 0.03

75
Appendix Table B5. Continued.
Summertime migration�Subyearling chinook salmon1997 block 1 1998 block 2 1998 block 3
Day 64%spill
Night 64%spill
Day 30%spill
Night 30%spill
Day 64%spill
Night 64%spill
Prop. Ln Prop. Ln Prop. Ln Prop. Ln Prop. Ln Prop. Ln0.80 -0.23 0.67 -0.40 1.10 0.10 0.96 -0.04 1.00 0.00 1.07 0.070.89 -0.12 1.03 0.03 0.98 -0.02 0.99 -0.01 0.87 -0.14 0.91 -0.091.10 0.10 0.87 -0.14 0.93 -0.07 1.17 0.15 1.03 0.03 0.69 -0.360.77 -0.26 1.00 0.00 0.68 -0.38 0.75 -0.28 0.86 -0.15 0.83 -0.190.77 -0.26 0.97 -0.03 1.17 0.16 1.06 0.06 0.71 -0.34 0.68 -0.391.00 0.00 1.18 0.16 1.05 0.05 0.86 -0.15 0.81 -0.21 0.62 -0.470.72 -0.33 0.81 -0.21 0.82 -0.20 1.31 0.27 0.63 -0.46 0.59 -0.530.86 -0.15 1.04 0.04 1.03 0.03 0.55 -0.60 0.98 -0.020.98 -0.02 0.93 -0.07 0.60 -0.52 1.03 0.03 0.81 -0.210.73 -0.31 1.01 0.01 0.57 -0.56 0.31 -1.161.00 0.00 0.94 -0.06 0.77 -0.26 0.60 -0.51
0.60 -0.51
Geometric Means0.87 -0.14 0.97 -0.03 0.81 -0.21 1.01 0.01 0.70 -0.35 0.75 -0.28
Analysis of Variance for Ln (surv)Source DF Seq SS Adj SS Adj MS F P
DayNight 1 0.177 0.191 0.191 3.54 0.07
Block 2 0.424 0.447 0.223 4.13 0.02
DayNight*Block 2 0.034 0.034 0.017 0.31 0.73
Error 55 2.973 2.973 0.054
Total 60 3.608
Where: Block
Ln Ln Back transformedDayNight Mean SE Mean SE1 (Day) -0.215 0.040 0.81 0.03
2 (Nite) -0.101 0.046 0.90 0.04

76
Appendix Table B6. Spill passage survival in relation to water temperature, spill volume, riverflow, and tailwater elevation; The Dalles Dam, 1997 and 1998.
Coho 1997 Subyearling chinook 1997
Rel. Temp. Spill Spill R. flow Tai w. Survival Rel. Temp. Spill Spill R. flow Tailw. Survival
Date (oC) kcfs (%) kcfs El. (ft) (%) Date oC kcfs (%) kcfs El. (ft) (%)
4/27 10 246 61 403 85 96.8 6/19 16 345 63 548 91 120.54/28 10 217 64 339 84 89.3 6/20 16 320 61 525 89 83.44/29 10 296 61 485 87 67.3 6/21 15 320 65 492 89 115.54/29 10 324 72 450 87 121.3 6/24 15 292 62 471 87 94.64/30 11 302 65 465 88 116.8 6/25 15 262 64 409 85 83.15/2 11 366 79 463 87 116.6 6/26 15 241 60 402 84 88.05/3 11 263 63 417 86 81.7 6/27 16 258 63 410 84 109.75/6 11 239 63 379 86 81.9 6/28 16 224 64 350 83 103.55/7 11 253 66 383 84 68.5 7/1 17 176 64 275 81 107.25/7 11 250 64 391 86 74.0 7/2 17 165 61 270 80 70.65/8 11 259 64 405 85 77.7 7/3 18 178 64 278 82 79.15/9 13 263 64 411 85 89.0 7/4 18 153 64 239 79 82.75/10 12 245 65 377 84 66.2 7/8 18 175 61 287 81 86.85/11 12 243 64 380 84 82.0 7/10 19 177 64 277 81 95.85/12 12 379 73 519 88 82.3 7/11 18 174 63 276 82 76.55/13 13 374 73 512 88 73.5 7/12 19 182 64 284 81 84.45/14 13 302 64 472 87 87.2 7/15 19 175 64 273 81 102.45/14 13 321 63 510 89 102.2 7/16 19 211 65 325 82 106.95/15 13 282 66 427 87 84.05/20 13 335 64 523 89 92.15/21 13 326 64 509 89 109.85/22 13 313 63 497 89 66.0

77
Appendix Table B6. Continued.
Coho 1998 Subyearling chinook 1998Rel. Temp Spill Spill R. flow Tailw. Survival Rel. Temp. Spill Spill R. flow Tailw. SurvivalDate (oC) kcfs (%) kcfs El. (ft) (%) Date oC kcfs (%) kcfs El. (ft) (%)
4/28 14 125 64 194 79 124.7 6/23 17 140 64 219 79 93.54/29 15 54 30 181 78 111.4 6/24 17 75 30 252 80 104.14/30 14 138 64 218 79 68.8 6/25 17 144 65 222 79 99.35/1 14 75 29 255 81 117.7 6/26 17 85 29 291 82 97.55/5 15 90 28 324 83 112.4 6/30 18 70 31 229 79 80.65/6 15 215 64 336 83 103.5 7/1 18 192 64 302 81 76.35/7 15 91 30 302 84 92.6 7/2 18 71 30 231 81 96.0
5/8 15 240 64 374 84 82.7 7/3 19 130 61 212 79 94.55/9 14 110 29 382 86 88.9 7/8 18 72 30 242 80 111.15/10 14 224 65 347 84 89.5 7/9 19 130 61 212 79 75.95/12 14 211 65 325 83 86.4 7/10 20 66 30 217 79 92.55/13 14 96 30 319 84 91.5 7/14 19 60 30 201 78 59.65/14 14 230 62 373 84 82.6 7/15 21 141 63 222 78 63.45/15 14 100 29 347 84 104.8 7/15 21 140 63 221 79 67.95/16 14 205 64 318 82 80.4 7/16 21 66 30 223 79 96.35/20 14 208 64 326 82 85.4 7/17 20 122 62 196 78 55.15/21 14 96 30 325 84 112.8 7/17 20 144 64 224 79 60.75/23 14 94 30 314 82 78.5 7/21 21 128 65 197 78 89.45/25 14 200 69 290 82 91.6 7/22 21 61 30 205 79 57.05/26 14 189 64 297 81 88.9 7/23 21 100 61 164 78 65.05/27 14 130 32 407 86 81.4 7/24 21 45 29 157 78 68.75/27 14 140 41 340 85 91.6 7/24 21 54 32 171 78 131.15/27 14 250 66 377 85 90.86/4 15 288 63 455 86 92.2

78
Appendix Table B7. Analysis of variance for Ln transformed relative survival percentagesderived for subyearling chinook salmon passing through the spillway andsluiceway at The Dalles Dam,1998.
All RecoveriesAnalysis of Variance for Ln (Spill Survival), using Adjusted SS for Tests
Source df Seq SS SS (adj) MS (adj) F PJulian day 1 0.56146 0.45785 0.45785 9.59 0.004Diel 1 0.09096 0.15295 0.15295 3.20 0.084Spill (%) 1 0.26275 0.29537 0.29537 6.18 0.019Bay index 2 0.23946 0.20391 0.10195 2.13 0.137Diel × Spill (%) 1 0.02130 0.02197 0.02197 0.46 0.503Diel × Bay index 2 0.19915 0.22172 0.11086 2.32 0.117Spill (%) × Bay index 2 0.28620 0.28620 0.14310 3.00 0.066Error 28 1.33720 1.33720 0.04776Total 38 2.99847Term Coef SE T PConstant 2.0511 0.7262 2.82 0.009Julian day -0.011864 0.003832 -3.10 0.004
Least Squares Means* for Ln (Spill Survival)Back transformed
Diel Mean SE Mean SE 95% CI1 (Day) -0.2568 0.0464 0.7735 0.0359 0.7033 to 0.85072 (Night) -0.1273 0.0555 0.8805 0.0489 0.7859 to 0.9865Spill (%)1 (30%) -0.1020 0.0529 0.9030 0.0478 0.8102 to 1.00642 (64%) -0.2821 0.0494 0.7542 0.0372 0.6817 to 0.8344Spill (%) × Bay index1 (30%) × 1 (N) -0.0470 0.0800 0.9541 0.0763 0.8099 to 1.12401 (30%) × 2 (M) 0.0468 0.1028 1.0479 0.1078 0.8489 to 1.29361 (30%) × 3 (S) 0.3060 0.0946 0.7364 0.0697 0.6066 to 0.89392 (64%) × 1 (N) -0.1955 0.0842 0.8224 0.0692 0.6921 to 0.97722 (64%) × 2 (M) -0.3700 0.0938 0.6907 0.0648 0.5699 to 0.83712 (64%) × 3 (S) -0.2808 0.0835 0.7552 0.0631 0.6364 to 0.8961Diel × Bay index1 (Day) × 1 (N) -0.0896 0.0736 0.9143 0.0673 0.7864 to 1.06301 (Day) × 2 (M) -0.3207 0.0916 0.7256 0.0665 0.6015 to 0.87541 (Day) × 3 (S) -0.3602 0.0773 0.6975 0.0539 0.5954 to 0.81722 (Night) × 1 (N) -0.1528 0.0909 0.8583 0.0780 0.7125 to 1.03402 (Night) × 2 (M) -0.0025 0.1054 0.9975 0.1051 0.8038 to 1.23792 (Night) × 3 (S) -0.2266 0.1019 0.7972 0.0812 0.6470 to 0.9823The regression equation is: Ln (Sluice Survival) = 49 - 0.00136 Tag dayTerm Coef SE T PConstant 48.6 137.4 0.35 0.733Tag day -0.001355 0.003820 -0.35 0.732 R2 (adj) = 0.0%

79
Appendix Table B7. Continued.
Bonneville Recoveries Only
Analysis of Variance for Ln (Spill Survival), using Adjusted SS for Tests
Source df Seq SS SS (adj) MS (adj) F P
Julian day 1 0.66848 0.62540 0.62540 8.23 0.008
Diel 1 0.02873 0.05843 0.05843 0.77 0.388
Spill (%) 1 0.32489 0.38328 0.38328 5.05 0.033
Bay index 2 0.38730 0.34806 0.17403 2.29 0.120
Diel × Spill (%) 1 0.04296 0.04233 0.04233 0.56 0.462
Diel × Bay index 2 0.13668 0.14575 0.07288 0.96 0.395
Spill (%) × Bay index 2 0.30290 0.30290 0.15145 1.99 0.155
Error 28 2.12656 2.12656 0.07595
Total 38 4.01850
Term Coef SE T P
Constant 2.3774 0.9158 2.60 0.015
Julian day -0.013866 0.004832 -2.87 0.008
Least Squares Means* for Ln (Spill Survival)
Back transformed
Diel Mean SE Mean SE
1 (Day) -0.2843 0.05856 0.7525 0.0441
2 (Night) -0.2042 0.06997 0.8153 0.0570
Spill (%)
1 (30%) -0.1417 0.06675 0.8679 0.0579
2 (64%) -0.3468 0.06225 0.7069 0.0440
Bay index
1 (North) -0.1818 0.07447 0.8338 0.0621
2 (Mid.) -0.1647 0.09139 0.8481 0.0775
3 (South) -0.3862 0.08092 0.6796 0.0550
Spill (%) × Bay index
1 (30%) × 1 (North) -0.1203 0.10088 0.8867 0.0894
1 (30%) × 2 (Mid.) 0.0676 0.12969 1.0699 0.1388
1 (30%) × 3 (South) -0.3723 0.11935 0.6891 0.0822
2 (64%) × 1 (North) -0.2433 0.10617 0.7840 0.0832
2 (64%) × 2 (Mid.) -0.397 0.11833 0.6723 0.0796
2 (64%) × 3 (South) -0.4001 0.10533 0.6703 0.0706The regression equation is Ln (Sluice Survival) = -100 + 0.00279 Tag day
Term Coef SD T P
Constant -100.4 152.0 -0.66 0.527
Tag day 0.002787 0.004224 0.66 0.528
R2 (adj) = 0.0%

80
Appendix Table B7. Continued.
Rice Island Recoveries Only
Analysis of Variance for Ln (Spill Survival), using Adjusted SS for Tests
Source df Seq SS SS (adj) MS (adj) F P
Julian day 1 0.2389 0.1665 0.1665 0.54 0.468
Diel 1 0.3994 0.6014 0.6014 1.96 0.173
Spill (%) 1 0.0403 0.0534 0.0534 0.17 0.680
Bay index 2 0.3223 0.0927 0.0464 0.15 0.861
Diel × Spill (%) 1 0.0418 0.0451 0.0451 0.15 0.704
Diel × Bay index 2 1.0610 1.1636 0.5818 1.90 0.169
Spill (%) × Bay index 2 0.9113 0.9113 0.4557 1.48 0.244
Error 28 8.5960 8.5960 0.3070
Total 38 11.6111
Term Coef SE T P
Constant 1.286 1.841 0.70 0.491
Julian day -0.007155 0.009715 -0.74 0.468
Least Squares Means* for Ln (Spill Survival)
Back transformed
Diel Mean SE Mean SE
1 (Day) -0.1954 0.1177 0.8225 0.0968
2 (Night) 0.0614 0.1407 1.0633 0.1496
Spill (%)
1 (30%) -0.0287 0.1342 0.9717 0.1304
2 (64%) -0.1053 0.1251 0.9001 0.1126
Bay index
1 (North) 0.0023 0.1497 1.0023 0.1500
2 (Mid.) -0.1259 0.1837 0.8817 0.1620
3 (South) -0.0775 0.1627 0.9254 0.1506
Spill (%) × Bay index
1 (30%) × 1 (North) 0.129 0.2028 1.1377 0.2307
1 (30%) × 2 (Mid.) 0.0436 0.2607 1.0446 0.2723
1 (30%) × 3 (South) -0.2588 0.2399 0.7720 0.1852
2 (64%) × 1 (North) -0.1244 0.2135 0.8830 0.1885
2 (64%) × 2 (Mid.) -0.2953 0.2379 0.7443 0.1771
2 (64%) × 3 (South) 0.1038 0.2118 1.1094 0.2350The regression equation is Ln (Sluice Survival) = 739 -0.0205 Tag day
Term Coef SDE T P
Constant 738.6 234.9 3.14 0.014R2 (adj) = 49.7%
Tag day -0.020530 0.006528 -3.14 0.014
* Least square means are not equal to the raw data means due to an unbalanced experimentaldesign.
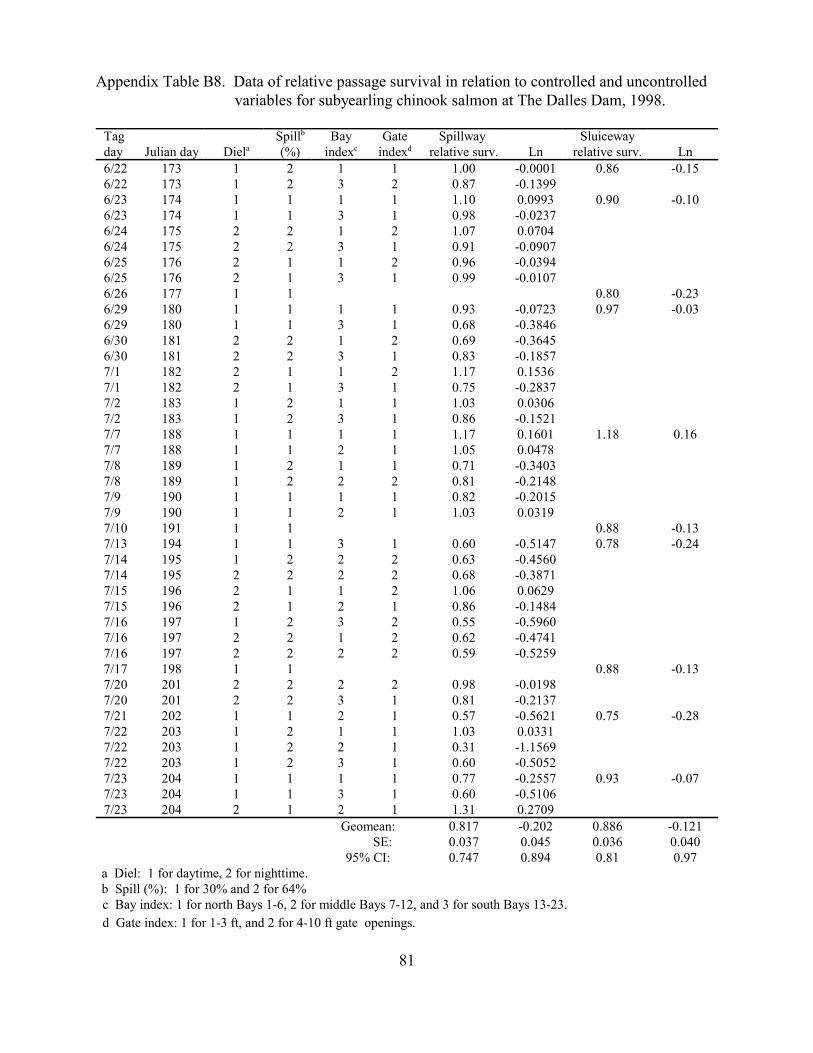
81
Appendix Table B8. Data of relative passage survival in relation to controlled and uncontrolledvariables for subyearling chinook salmon at The Dalles Dam, 1998.
Tagday Julian day Diela
Spillb
(%)Bay
indexcGate
indexdSpillway
relative surv. LnSluiceway
relative surv. Ln6/22 173 1 2 1 1 1.00 -0.0001 0.86 -0.156/22 173 1 2 3 2 0.87 -0.13996/23 174 1 1 1 1 1.10 0.0993 0.90 -0.106/23 174 1 1 3 1 0.98 -0.02376/24 175 2 2 1 2 1.07 0.07046/24 175 2 2 3 1 0.91 -0.09076/25 176 2 1 1 2 0.96 -0.03946/25 176 2 1 3 1 0.99 -0.01076/26 177 1 1 0.80 -0.236/29 180 1 1 1 1 0.93 -0.0723 0.97 -0.036/29 180 1 1 3 1 0.68 -0.38466/30 181 2 2 1 2 0.69 -0.36456/30 181 2 2 3 1 0.83 -0.18577/1 182 2 1 1 2 1.17 0.15367/1 182 2 1 3 1 0.75 -0.28377/2 183 1 2 1 1 1.03 0.03067/2 183 1 2 3 1 0.86 -0.15217/7 188 1 1 1 1 1.17 0.1601 1.18 0.167/7 188 1 1 2 1 1.05 0.04787/8 189 1 2 1 1 0.71 -0.34037/8 189 1 2 2 2 0.81 -0.21487/9 190 1 1 1 1 0.82 -0.20157/9 190 1 1 2 1 1.03 0.03197/10 191 1 1 0.88 -0.137/13 194 1 1 3 1 0.60 -0.5147 0.78 -0.247/14 195 1 2 2 2 0.63 -0.45607/14 195 2 2 2 2 0.68 -0.38717/15 196 2 1 1 2 1.06 0.06297/15 196 2 1 2 1 0.86 -0.14847/16 197 1 2 3 2 0.55 -0.59607/16 197 2 2 1 2 0.62 -0.47417/16 197 2 2 2 2 0.59 -0.52597/17 198 1 1 0.88 -0.137/20 201 2 2 2 2 0.98 -0.01987/20 201 2 2 3 1 0.81 -0.21377/21 202 1 1 2 1 0.57 -0.5621 0.75 -0.287/22 203 1 2 1 1 1.03 0.03317/22 203 1 2 2 1 0.31 -1.15697/22 203 1 2 3 1 0.60 -0.50527/23 204 1 1 1 1 0.77 -0.2557 0.93 -0.077/23 204 1 1 3 1 0.60 -0.51067/23 204 2 1 2 1 1.31 0.2709
Geomean: 0.817 -0.202 0.886 -0.121SE: 0.037 0.045 0.036 0.040
95% CI: 0.747 0.894 0.81 0.97a Diel: 1 for daytime, 2 for nighttime. b Spill (%): 1 for 30% and 2 for 64%
c Bay index: 1 for north Bays 1-6, 2 for middle Bays 7-12, and 3 for south Bays 13-23.
d Gate index: 1 for 1-3 ft, and 2 for 4-10 ft gate openings.

82
Addendum to Appendix Table B8.
0.00.20.40.60.81.01.21.4
0 1 2Spill Percent Index
Rel
ativ
e su
rviv
al
y = -0.0012x + 43.608
R2 = 0.0129
0.0
0.2
0.4
0.6
0.8
1.0
1.2
1.4
6/1
9
6/2
4
6/2
9
7/4
7/9
7/1
4
7/1
9
7/2
4
7/2
9
Tagday
Rel
ativ
e sl
uic
eway
pas
sag
e su
rviv
al
0.0
0.2
0.4
0.6
0.8
1.0
1.2
1.4
0 1 2Diel Index
Rel
ativ
e su
rviv
aly = -0.0079x + 285.63
R2 = 0.1531
0.00.20.40.60.81.01.21.4
6/1
9
6/2
4
6/2
9
7/4
7/9
7/1
4
7/1
9
7/2
4
7/2
9
Tagday
Rel
ativ
e sp
illw
ay p
assa
ge
surv
ival
0.0
0.20.4
0.60.8
1.01.2
1.4
0 1 2 3Bay Index
Re
lati
ve
su
rviv
al
0.0
0.2
0.4
0.6
0.8
1.0
1.2
1.4
0 1 2Gate Opening Index
Rel
ativ
e su
rviv
al

83
Appendix Table B9. Analysis of variance for Ln transformed relative survival proportionsderived for subyearling chinook salmon passing through the spillway atvarious spillway gate openings, The Dalles Dam, 1998.
SPILLWAY GATE OPENINGS--All RecoveriesAnalysis of Variance for Ln (Spill Survival), using Adjusted SS for Tests
Source df Seq SS SS (adj) MS (adj) F PJulian day 1 0.56185 0.45819 0.45819 6.99 0.013Diel 1 0.09120 0.07613 0.07613 1.16 0.290Spill (%) 1 0.26232 0.18518 0.18518 2.82 0.103Gate index 1 0.00724 0.00081 0.00081 0.01 0.912Diel × Spill (%) 1 0.02606 0.00527 0.00527 0.08 0.779Diel × Gate index 1 0.00724 0.00026 0.00026 0.00 0.950Spill (%) × Gate index 1 0.01191 0.01191 0.01191 0.18 0.673Error 31 2.03258 2.03258 0.06557Total 38 3.00041
Term Coef SE T PConstant 1.8121 0.7486 2.42 0.022Julian day -0.010547 0.003990 -2.64 0.013
Least Squares Means* for Ln (Spill Survival)Back transformed
Diel Mean SE Mean SE1 (Day) -0.2418 0.1002 0.7852 0.07872 (Night) -0.1221 0.0669 0.8851 0.0592Spill (%)1 (30%) -0.0892 0.1038 0.9147 0.09492 (64%) -0.2747 0.0605 0.7598 0.0460Gate index1 (1-3 ft) -0.1749 0.0576 0.8395 0.04842 (4-10 ft) -0.1890 0.1146 0.8278 0.0948Diel × gate index1 (Day) × 1 (1-3 ft) -0.2308 0.0610 0.7939 0.04841 (Day) × 2 (4-10 ft) -0.2528 0.1964 0.7766 0.15252 (Night) × 1 (1-3 ft) -0.1189 0.0980 0.8879 0.08702 (Night) × 2 (4-10 ft) -0.1253 0.0907 0.8822 0.0800
* Least square means are not equal to the raw data means due to an unbalanced experimental design.

84
Appendix Table B10. PIT-tag detections in relation to size at release comparing proportions above and below the critical size for radio telemetry evaluations;subyearling chinook salmon from The Dalles Survival Study, 1998.
Fork length <=110 mm Fork length >110 mmDetectionsa Detectionsa
Tag Release Bonneville b Rice Island Release Bonneville c Rice Island date no. c no. Propd no. Propd no. a no. Propd no. PropD
6/22 1,622 78 0.048 22 112 4 0.036 26/23 1,678 69 0.041 20 106 5 0.047 16/24 1,093 83 0.076 13 150 13 0.087 16/25 496 39 0.079 6 56 7 0.125 06/26 749 68 0.091 8 0.012 105 9 0.086 0 0.0086/29 586 54 0.092 4 120 14 0.117 26/30 695 23 0.033 5 0.007 228 6 0.026 4 0.0177/1 838 26 0.031 9 247 11 0.045 57/2 1,017 28 0.028 19 0.015 424 9 0.021 4 0.0137/7 1,359 33 15 508 14 47/8 200 2 4 35 0 17/9 974 23 11 119 1 07/10 521 14 0.024 5 0.011 43 0 0.021 1 0.0097/13 269 7 6 13 0 07/14 119 14 1 8 0 07/15 337 15 3 54 2 17/16 825 39 19 135 4 67/17 934 28 0.041 18 0.019 192 1 0.017 0 0.0177/20 347 21 2 122 2 17/21 588 22 6 226 2 37/22 175 10 0.048 0 85 5 0.021 37/23 300 12 0.040 5 0.009 193 7 0.036 1 0.013Total 15,722 708 0.045 201 0.013 3,281 116 0.035 40 0.012
Bonneville ratio: <=110 to >110mm Rice Island Ratio:<=110 to >110mmGeomean: 1.191 Geomean: 1.025SE: 0.137 SE: 0.19895% CI: 0.929 to 1.527 95% CI: 0.624 to 1.685t: 0.851 t: 0.835df: 24 df: 10P: 0.40 P: 0.42
a In instances where detections/recoveries were few, proportions were based on cumulative data for several release days. For analysis, the minimum detection was five fish for the size category with the least number.b Detections from Bonneville Dam or Jones Beach.
c All release sites combined by day.d Prop = Proportion detected (number of fish detected ÷ number of fish released).

85
Appendix Table B11. PIT-tags detected by treatment by date for the three days which failed thechi-square test of no difference in temporal distribution for subyearlingchinook salmon at Bonneville Dam, 1998.
Release Days after release
Date Treatment 1 2 3 4 5 6 7 8 9 10 11 19
Number of fish detected at Bonneville Dam6/25 Spillway 27 85 34 11 2 2 0 0 0 1 0 06/25 Tailrace 53 79 22 8 1 1 1 1 0 0 0 1
Percent of total detected6/25 Spillway 17 52 21 6.8 1.2 1.2 0 0 0 0.6 0 06/25 Tailrace 32 47 13 4.8 0.6 0.6 0.6 0.6 0 0 0 0.6
Number of fish detected at Bonneville Dam7/10 Spillway 12 11 8 4 1 0 0 07/10 Tailrace 15 21 2 0 0 0 0 1
Percent of total detected7/10 Spillway 33 31 22 11 2.8 0 0 07/10 Tailrace 38 54 5.1 0 0 0 0 2.6
Number of fish detected at Bonneville Dam7/23 Spillway 51 29 8 1 0 1 17/23 Tailrace 113 41 2 0 1 0 0
Percent of total detected7/23 Spillway 56 32 8.8 1.1 0 1.1 1.17/23 Tailrace 72 26 1.3 0 0.6 0 0