JUVENILE JUSTICE ANNUAL REPORT...Project Objectives Working collaboratively with project...
54
JUVENILE JUSTICE ANNUAL REPORT Santa Clara County, 2012
Transcript of JUVENILE JUSTICE ANNUAL REPORT...Project Objectives Working collaboratively with project...
JUVENILE JUSTICE ANNUAL REPORT
Santa Clara County, 2012
Table of Contents
Contributors…………………………………….…………………..3Project Objectives…………………………………………............4Citations and Arrests……………………………………………....5Intake Decisions and Demographics…………………………....16Petitions Filed……………………………………………………...21Public Defender and Alternate Public Defender Statistics (Juvenile) …………………………………………………….........35Outcomes for Victims……………………………………………..37Dually involved youth…………………………………………….39 Juvenile Hall & Ranches Population………………………….…43Mental Health Department Statistics, Juvenile Hall..................53
2
ContributorsSuperior Court of California, Santa Clara County - Juvenile Justice
Division
Santa Clara County Agencies:
Probation Department
Office of the District Attorney
Alternate Defender’s Office
Public Defender’s Office
Independent Defense Office
Department of Family and Children’s Services (DFCS)
3
Project Objectives
Working collaboratively with project contributors, under the Juvenile Justice Model Court grant, this report will be
used as a tool to evaluate performance, facilitate information sharing and manage operational information
within Santa Clara County.
This report seeks to contribute to the Juvenile Justice data compiled by other Model Courts throughout the nation in
an effort to better understand how we can improve outcomes for our youth.
4

CITATIONS AND ARRESTS
2012
5
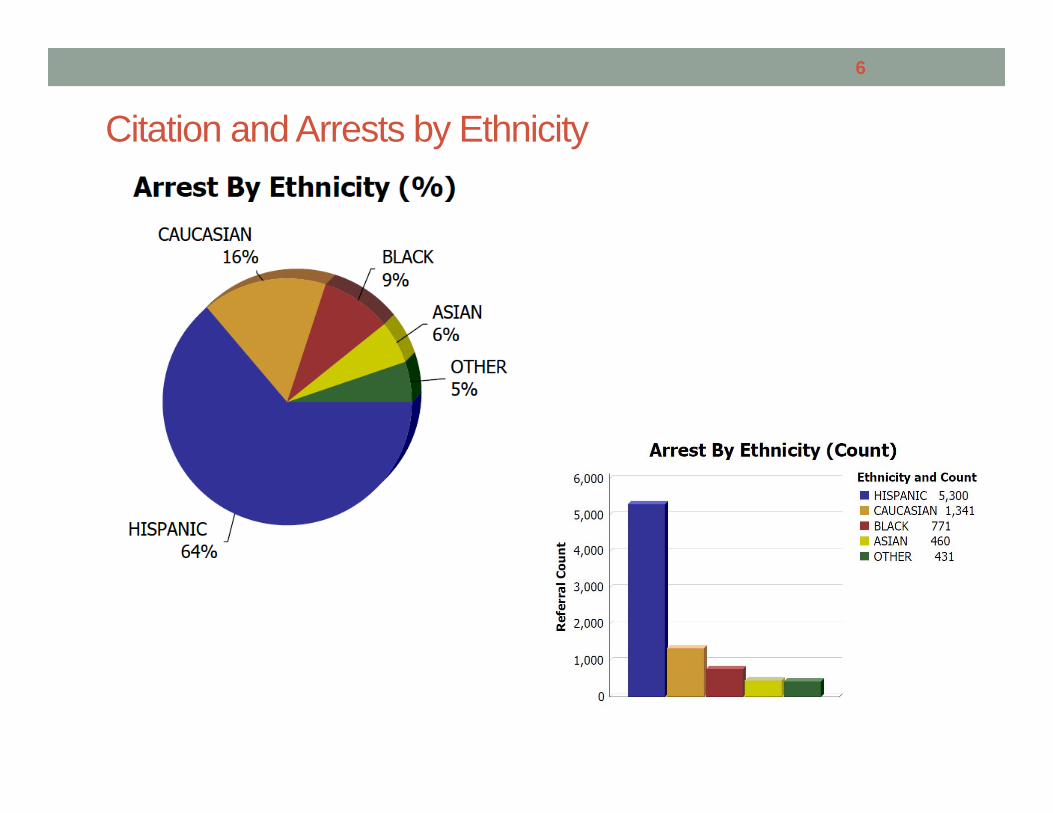
Citation and Arrests by Ethnicity
6
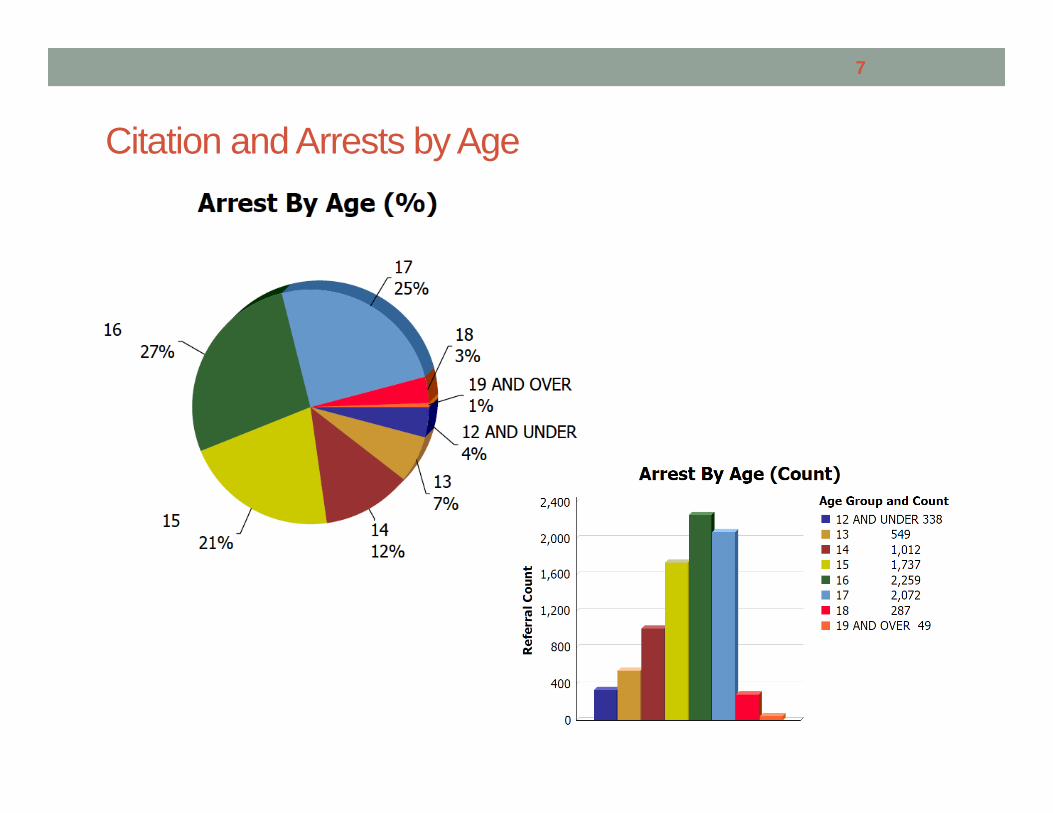
Citation and Arrests by Age
7
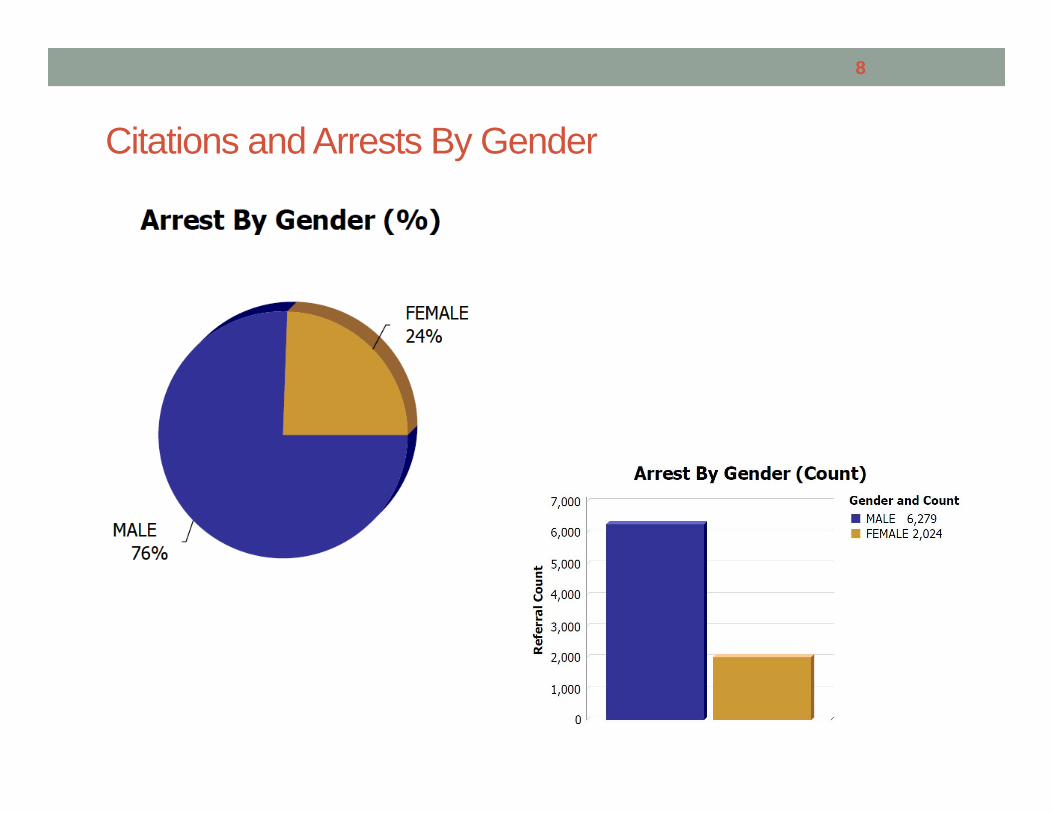
Citations and Arrests By Gender
8
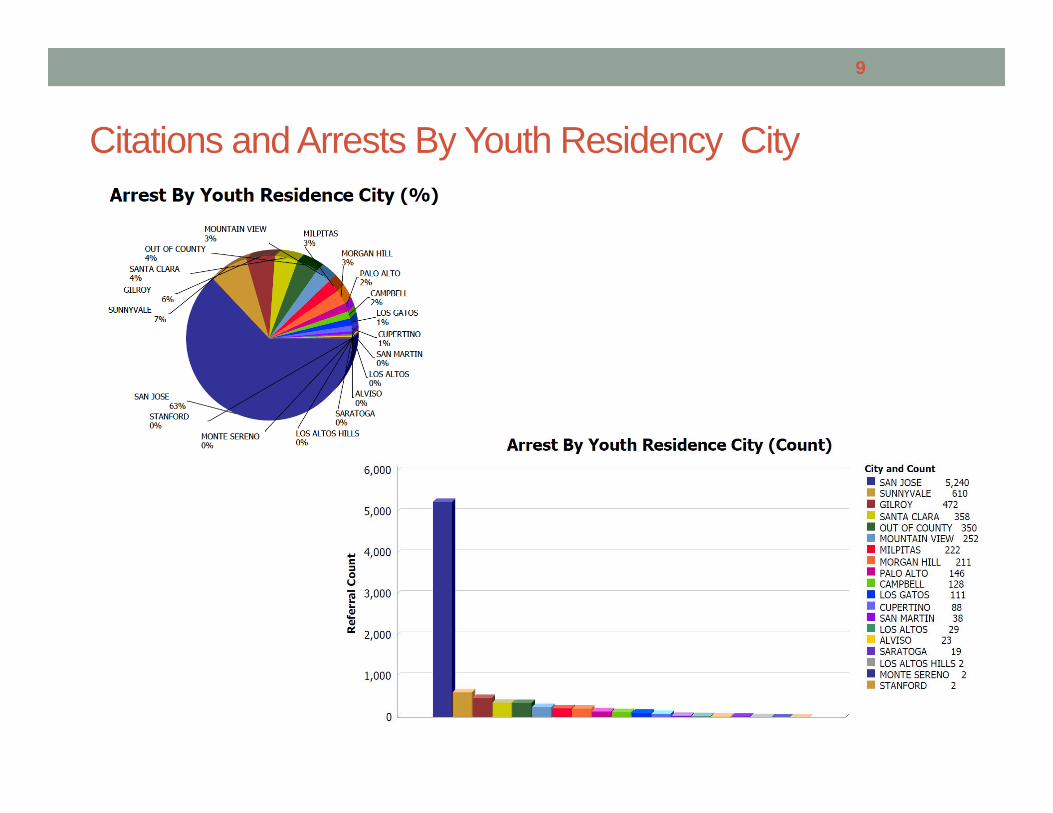
Citations and Arrests By Youth Residency City
9
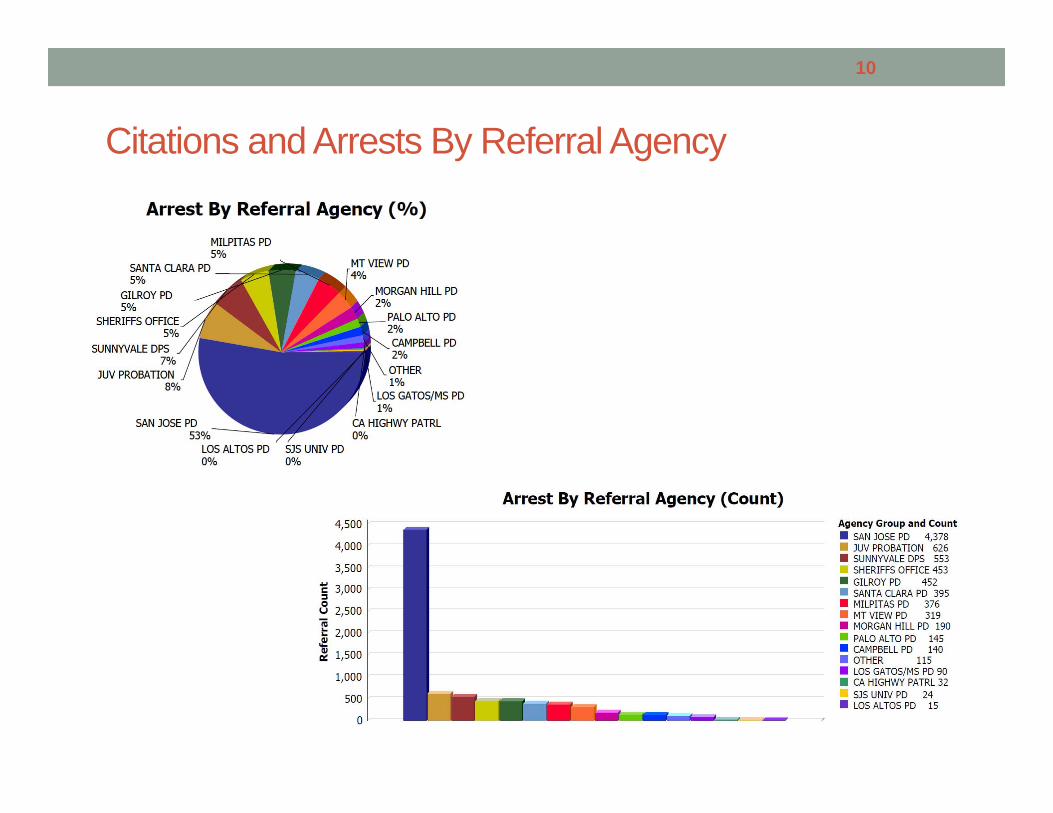
Citations and Arrests By Referral Agency
10
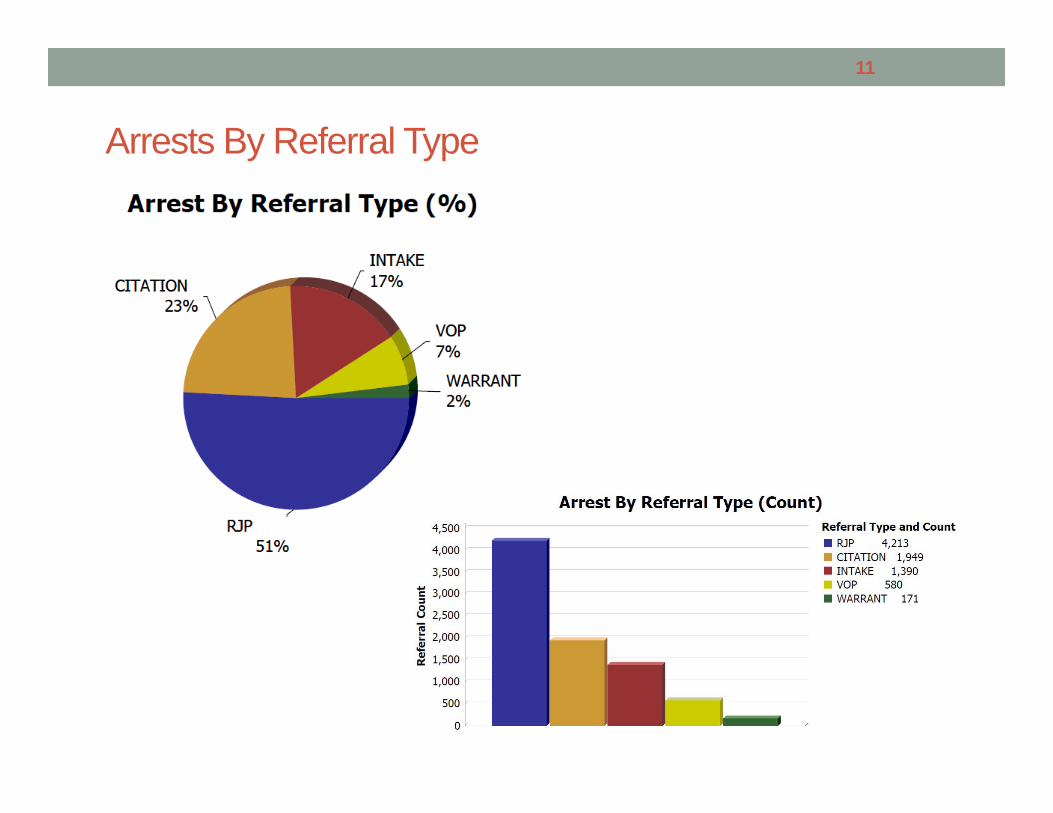
Arrests By Referral Type
11
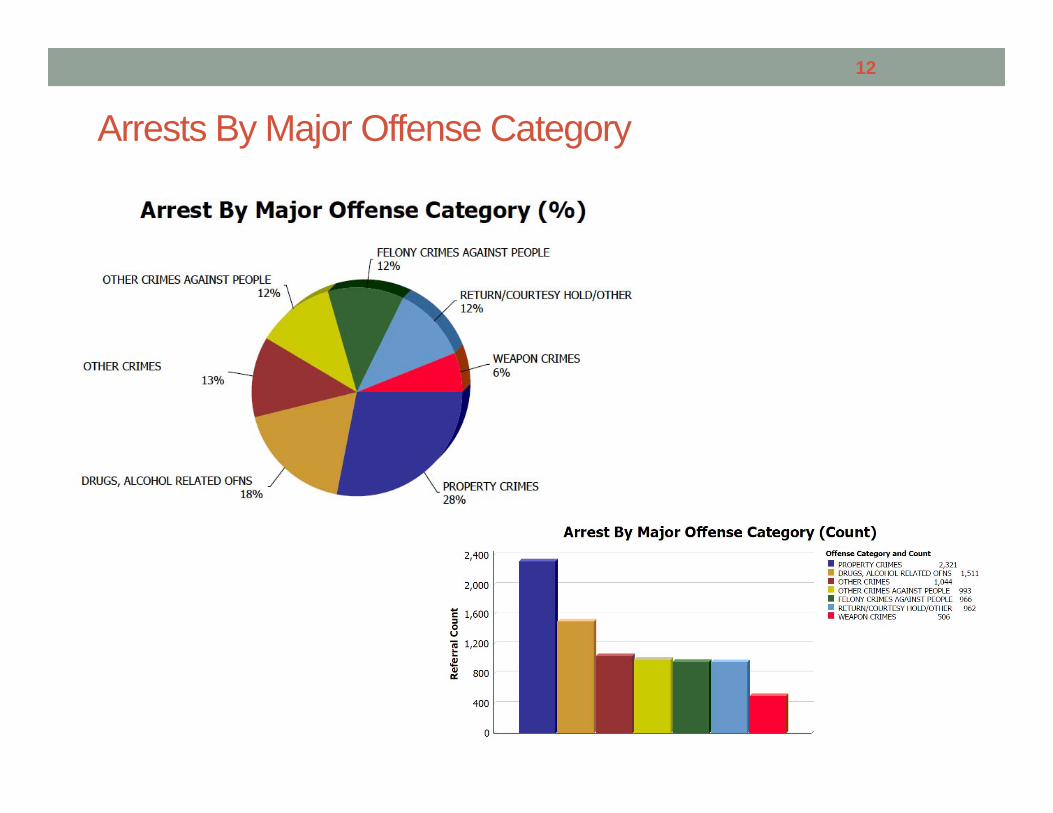
Arrests By Major Offense Category
12
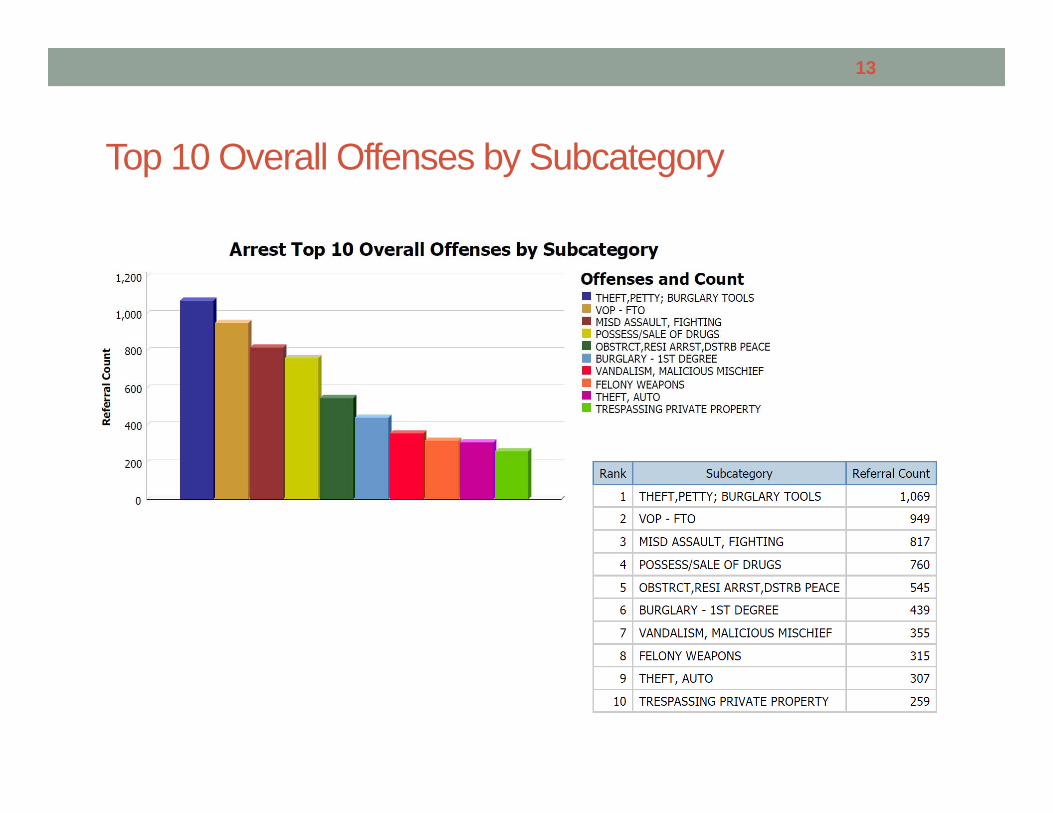
Top 10 Overall Offenses by Subcategory
13
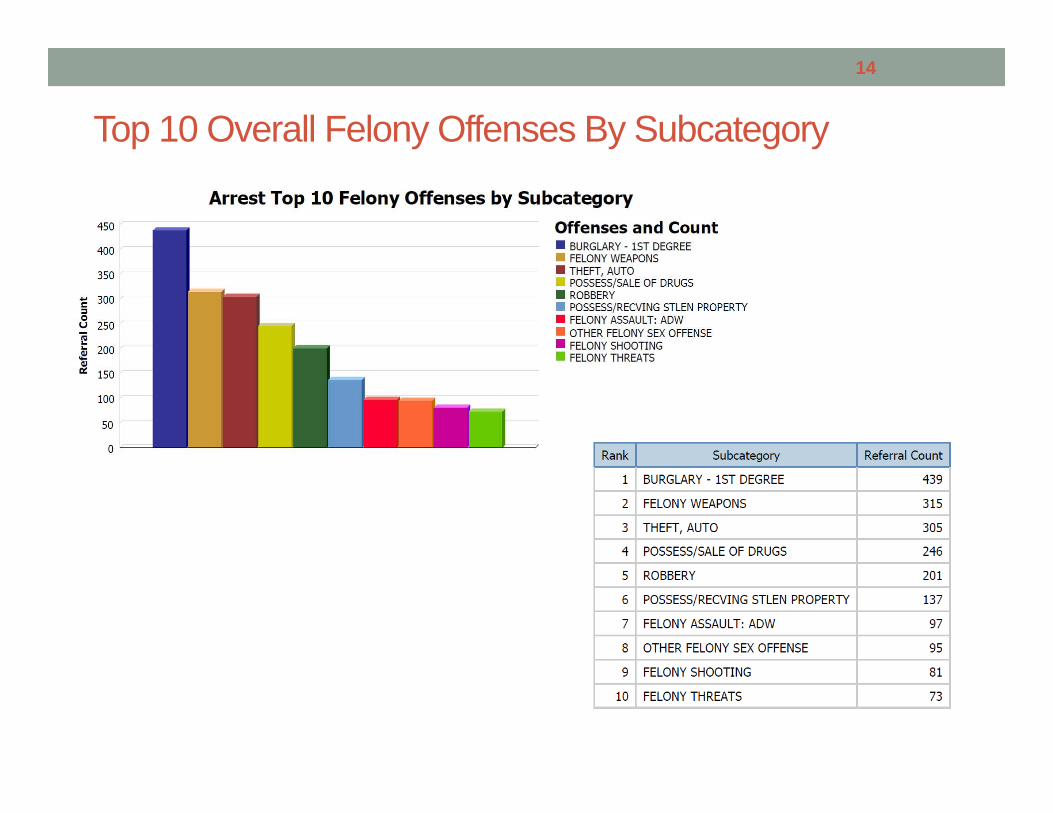
Top 10 Overall Felony Offenses By Subcategory
14
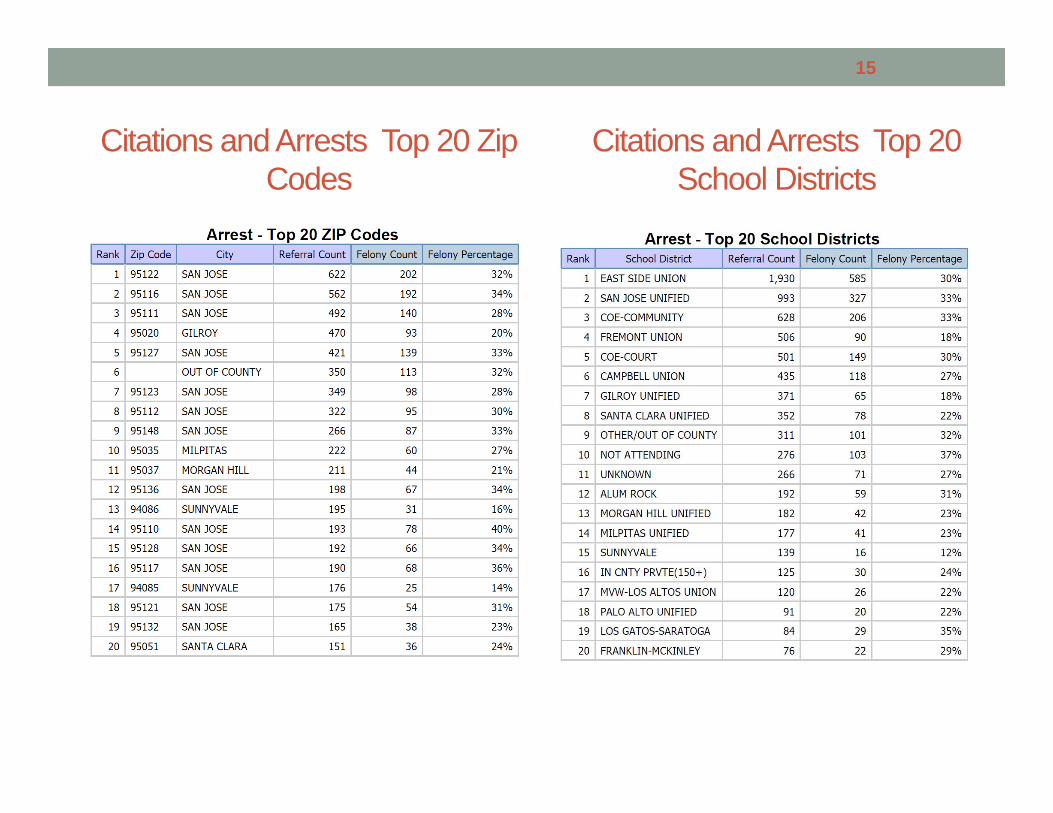
Citations and Arrests Top 20 Zip Codes
15
Citations and Arrests Top 20 School Districts
INTAKE DECISIONS AND DEMOGRAPHICS
2012
16
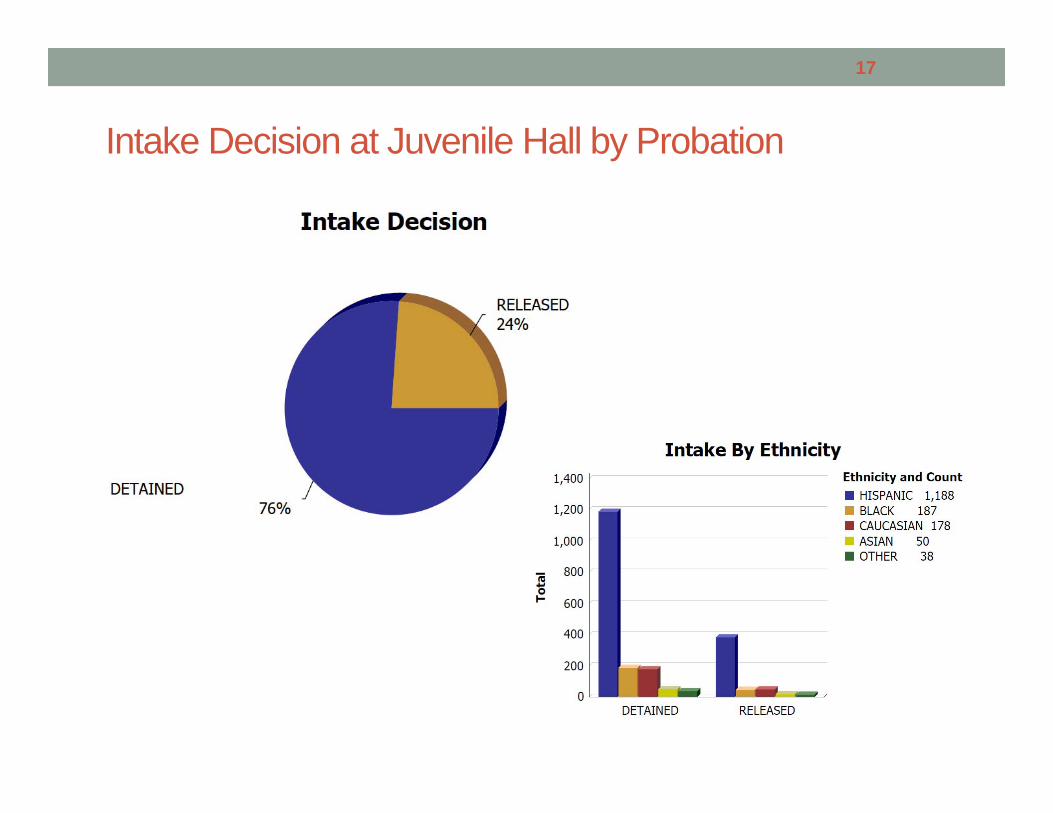
Intake Decision at Juvenile Hall by Probation
17
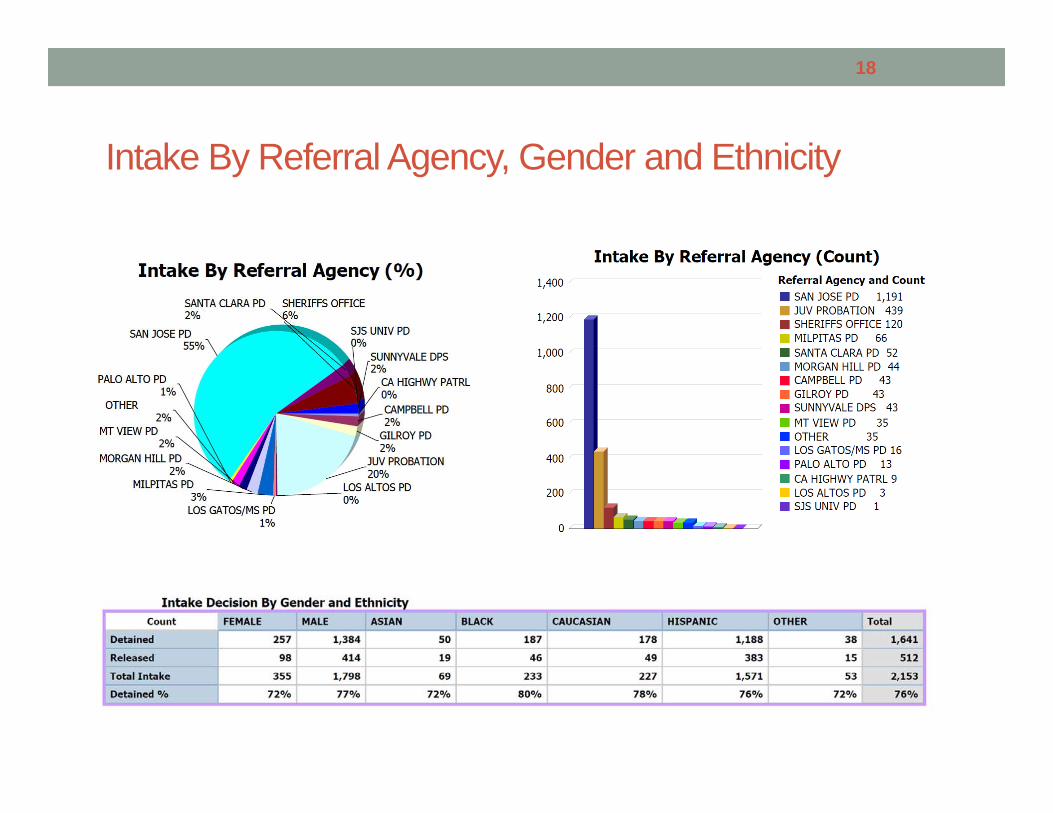
Intake By Referral Agency, Gender and Ethnicity
18
Juvenile Hall & Ranches Average Daily Population
19
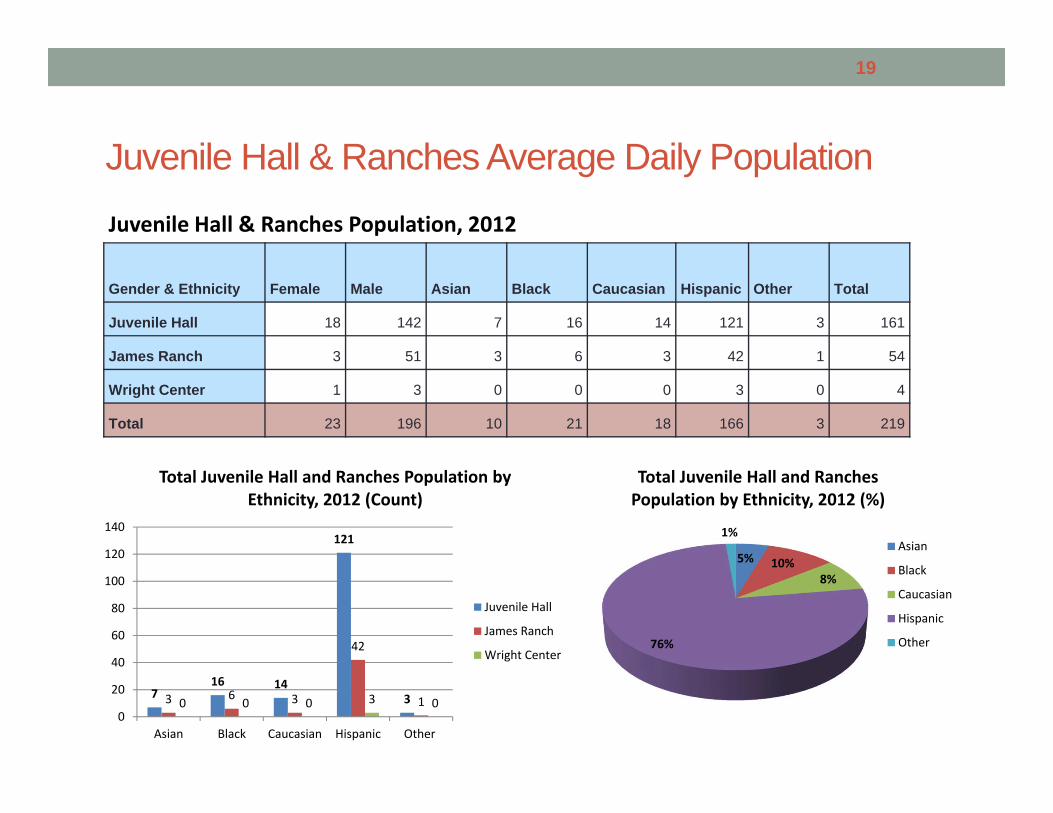
Juvenile Hall & Ranches Population, 2012
Gender & Ethnicity Female Male Asian Black Caucasian Hispanic Other Total
Juvenile Hall 18 142 7 16 14 121 3 161
James Ranch 3 51 3 6 3 42 1 54
Wright Center 1 3 0 0 0 3 0 4
Total 23 196 10 21 18 166 3 219
5% 10%8%
76%
1%
Total Juvenile Hall and Ranches Population by Ethnicity, 2012 (%)
Asian
Black
Caucasian
Hispanic
Other
716 14
121
33 6 3
42
10 0 0 3 00
20
40
60
80
100
120
140
Asian Black Caucasian Hispanic Other
Total Juvenile Hall and Ranches Population by Ethnicity, 2012 (Count)
Juvenile Hall
James Ranch
Wright Center
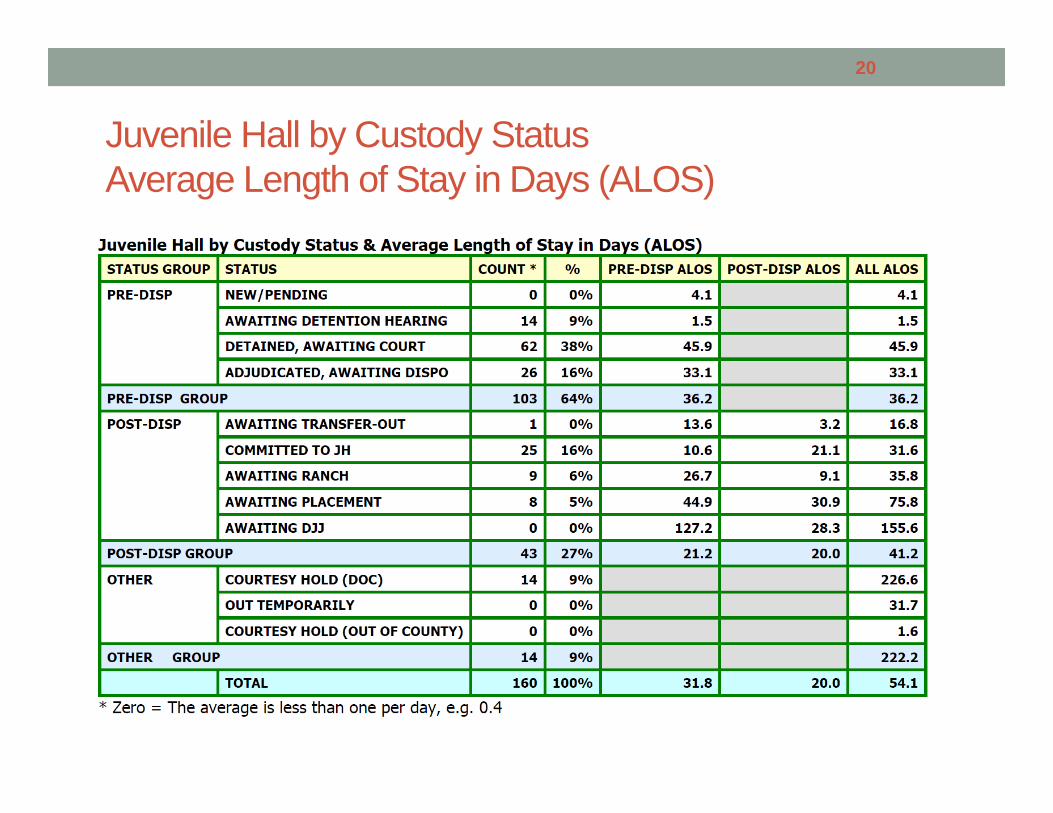
Juvenile Hall by Custody Status Average Length of Stay in Days (ALOS)
20
PETITIONS FILED
2012
21
Juvenile Total Petitions Filed
22
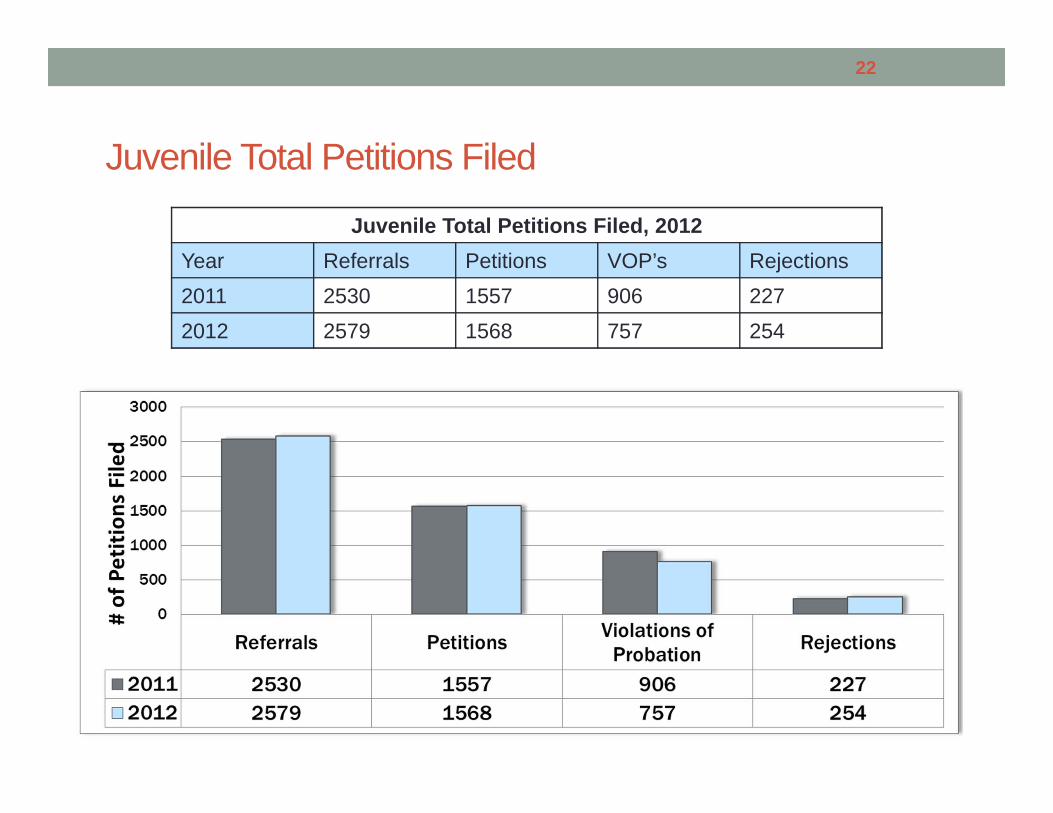
Juvenile Total Petitions Filed, 2012Year Referrals Petitions VOP’s Rejections2011 2530 1557 906 2272012 2579 1568 757 254
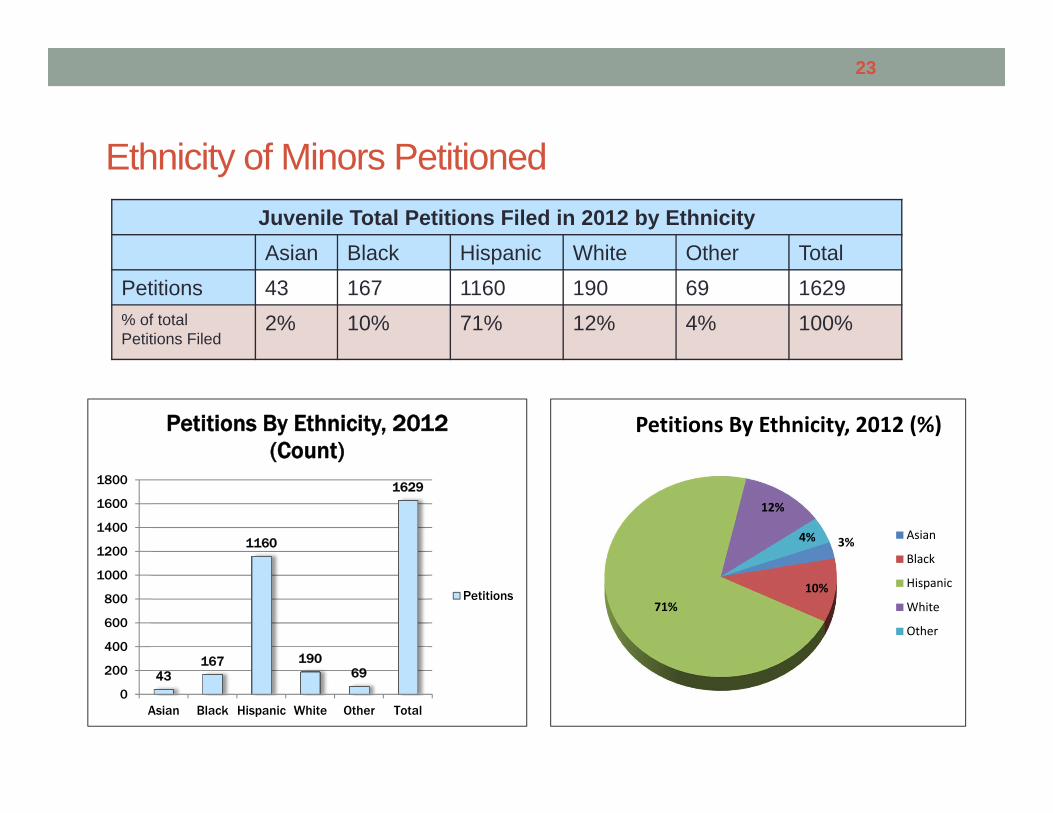
Ethnicity of Minors PetitionedJuvenile Total Petitions Filed in 2012 by EthnicityAsian Black Hispanic White Other Total
Petitions 43 167 1160 190 69 1629% of total Petitions Filed
2% 10% 71% 12% 4% 100%
23
43167
1160
19069
1629
0
200
400
600
800
1000
1200
1400
1600
1800
Asian Black Hispanic White Other Total
Petitions By Ethnicity, 2012 (Count)
Petitions
3%
10%71%
12%
4%
Petitions By Ethnicity, 2012 (%)
Asian
Black
Hispanic
White
Other
Gender and Age of Minors Petitioned
24
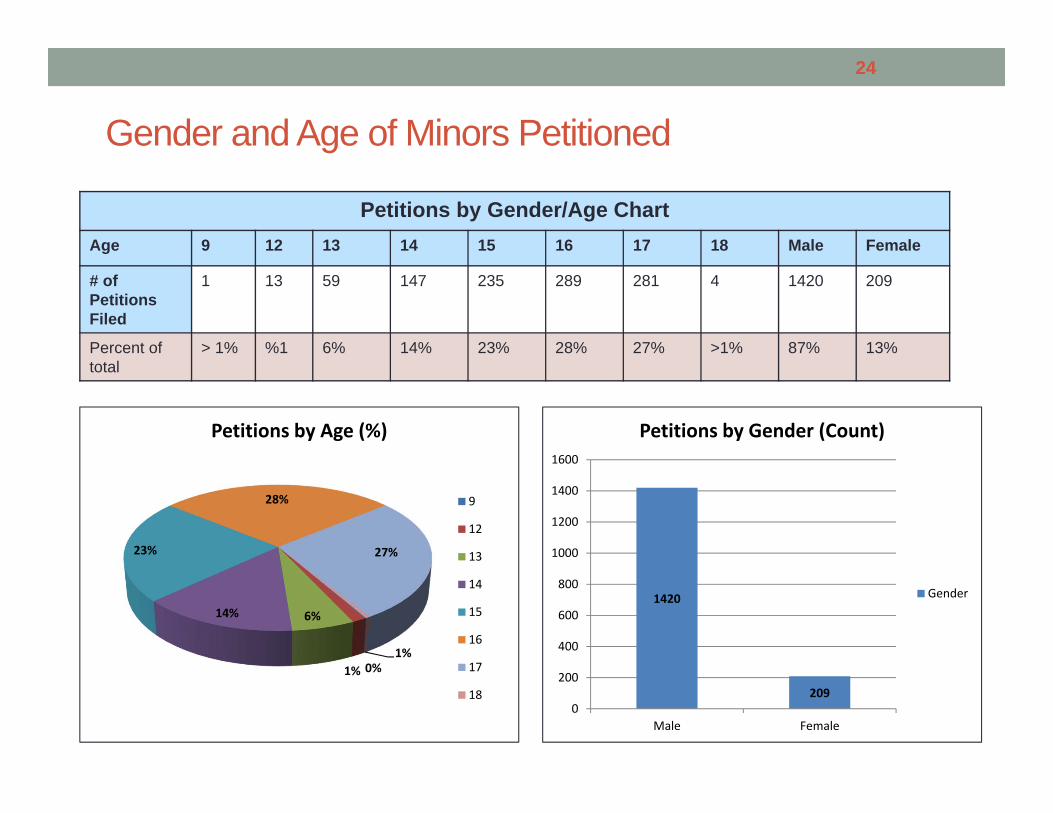
Petitions by Gender/Age ChartAge 9 12 13 14 15 16 17 18 Male Female
# of Petitions Filed
1 13 59 147 235 289 281 4 1420 209
Percent of total
> 1% %1 6% 14% 23% 28% 27% >1% 87% 13%
0%1%
6%14%
23%
28%
27%
1%
Petitions by Age (%)
9
12
13
14
15
16
17
18
1420
2090
200
400
600
800
1000
1200
1400
1600
Male Female
Petitions by Gender (Count)
Gender
Top 10 Most Common Charges
25
Top 10 Charges by Ethnicity at Time of Petition
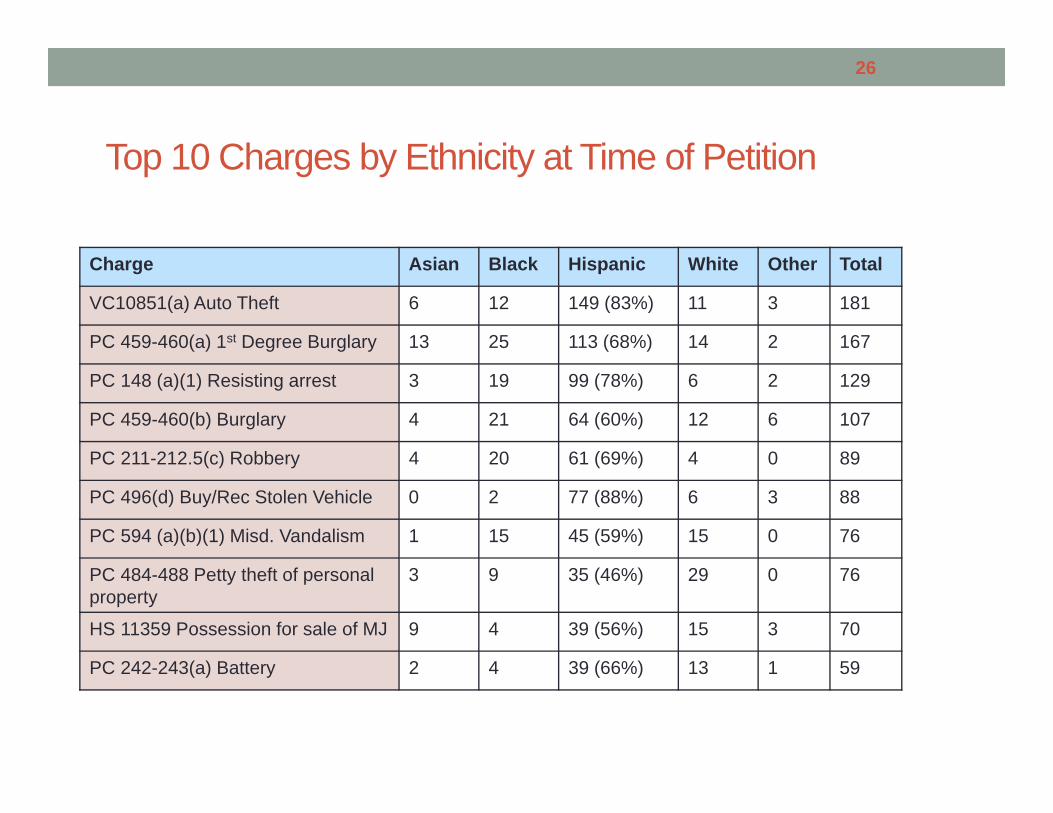
Charge Asian Black Hispanic White Other Total
VC10851(a) Auto Theft 6 12 149 (83%) 11 3 181
PC 459-460(a) 1st Degree Burglary 13 25 113 (68%) 14 2 167
PC 148 (a)(1) Resisting arrest 3 19 99 (78%) 6 2 129
PC 459-460(b) Burglary 4 21 64 (60%) 12 6 107
PC 211-212.5(c) Robbery 4 20 61 (69%) 4 0 89
PC 496(d) Buy/Rec Stolen Vehicle 0 2 77 (88%) 6 3 88
PC 594 (a)(b)(1) Misd. Vandalism 1 15 45 (59%) 15 0 76
PC 484-488 Petty theft of personal property
3 9 35 (46%) 29 0 76
HS 11359 Possession for sale of MJ 9 4 39 (56%) 15 3 70
PC 242-243(a) Battery 2 4 39 (66%) 13 1 59
26
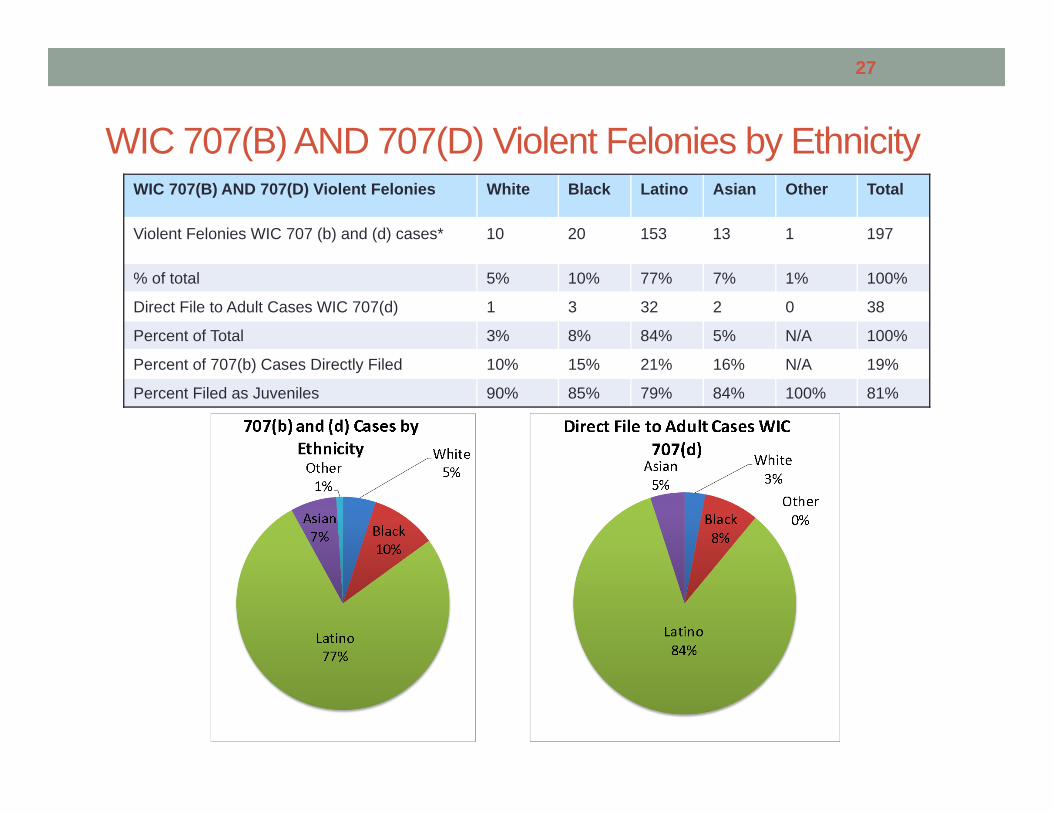
WIC 707(B) AND 707(D) Violent Felonies by Ethnicity
27
WIC 707(B) AND 707(D) Violent Felonies White Black Latino Asian Other Total
Violent Felonies WIC 707 (b) and (d) cases* 10 20 153 13 1 197
% of total 5% 10% 77% 7% 1% 100%
Direct File to Adult Cases WIC 707(d) 1 3 32 2 0 38
Percent of Total 3% 8% 84% 5% N/A 100%
Percent of 707(b) Cases Directly Filed 10% 15% 21% 16% N/A 19%
Percent Filed as Juveniles 90% 85% 79% 84% 100% 81%
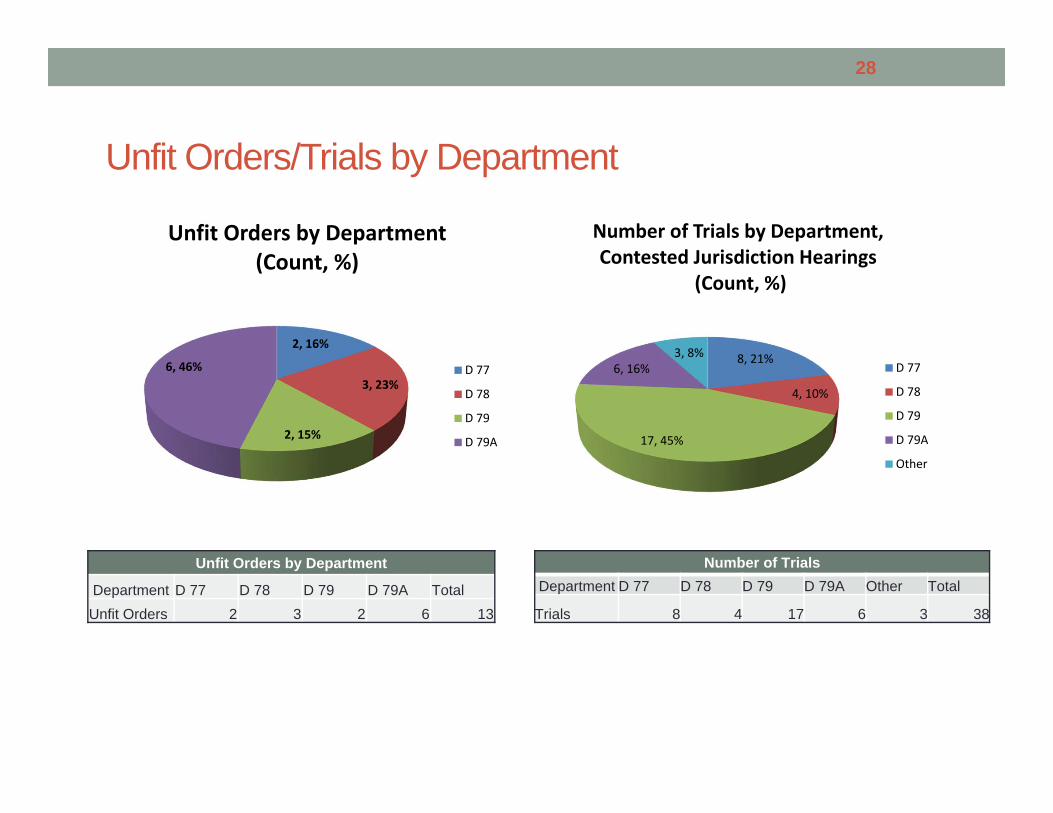
Unfit Orders/Trials by Department
28
2, 16%
3, 23%
2, 15%
6, 46%
Unfit Orders by Department(Count, %)
D 77
D 78
D 79
D 79A
8, 21%
4, 10%
17, 45%
6, 16%3, 8%
Number of Trials by Department, Contested Jurisdiction Hearings
(Count, %)
D 77
D 78
D 79
D 79A
Other
Number of TrialsDepartment D 77 D 78 D 79 D 79A Other Total
Trials 8 4 17 6 3 38
Unfit Orders by Department
Department D 77 D 78 D 79 D 79A TotalUnfit Orders 2 3 2 6 13
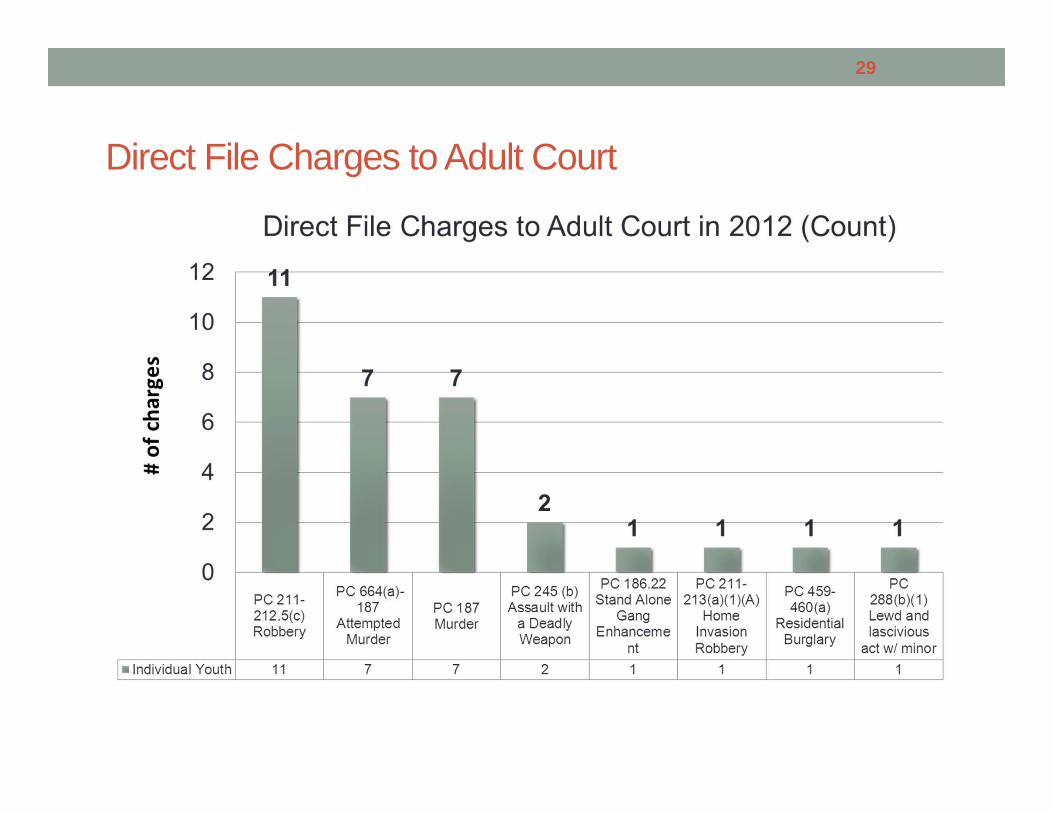
Direct File Charges to Adult Court
29
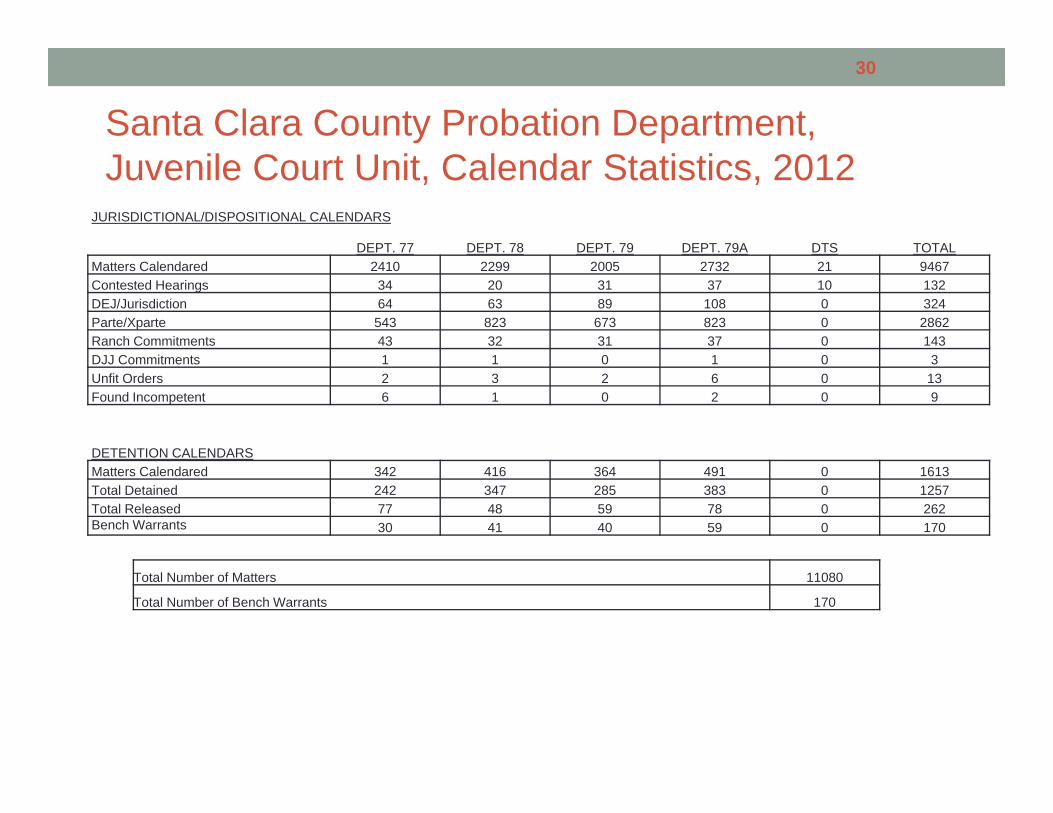
Santa Clara County Probation Department, Juvenile Court Unit, Calendar Statistics, 2012
JURISDICTIONAL/DISPOSITIONAL CALENDARS
DEPT. 77 DEPT. 78 DEPT. 79 DEPT. 79A DTS TOTALMatters Calendared 2410 2299 2005 2732 21 9467Contested Hearings 34 20 31 37 10 132DEJ/Jurisdiction 64 63 89 108 0 324Parte/Xparte 543 823 673 823 0 2862Ranch Commitments 43 32 31 37 0 143DJJ Commitments 1 1 0 1 0 3Unfit Orders 2 3 2 6 0 13Found Incompetent 6 1 0 2 0 9
DETENTION CALENDARSMatters Calendared 342 416 364 491 0 1613Total Detained 242 347 285 383 0 1257Total Released 77 48 59 78 0 262Bench Warrants 30 41 40 59 0 170
Total Number of Matters 11080
Total Number of Bench Warrants 170
30
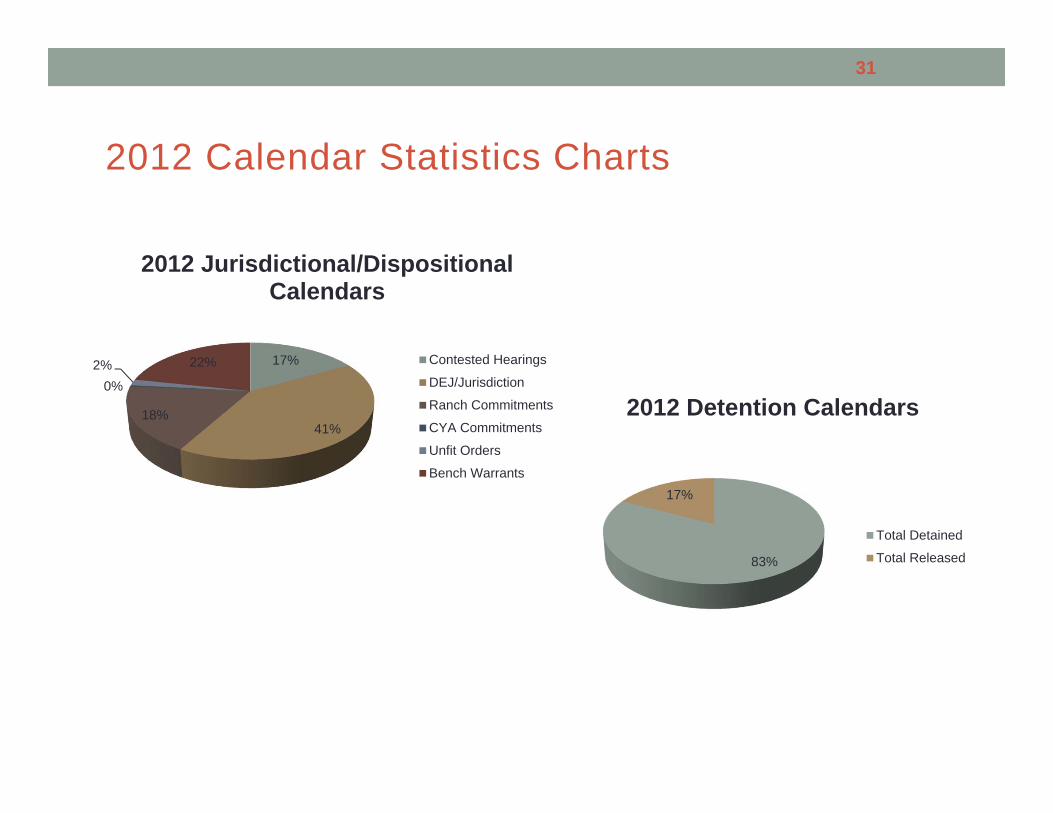
2012 Calendar Statistics Charts
31
83%
17%
2012 Detention Calendars
Total Detained
Total Released
17%
41%18%
0%2% 22%
2012 Jurisdictional/Dispositional Calendars
Contested Hearings
DEJ/Jurisdiction
Ranch Commitments
CYA Commitments
Unfit Orders
Bench Warrants
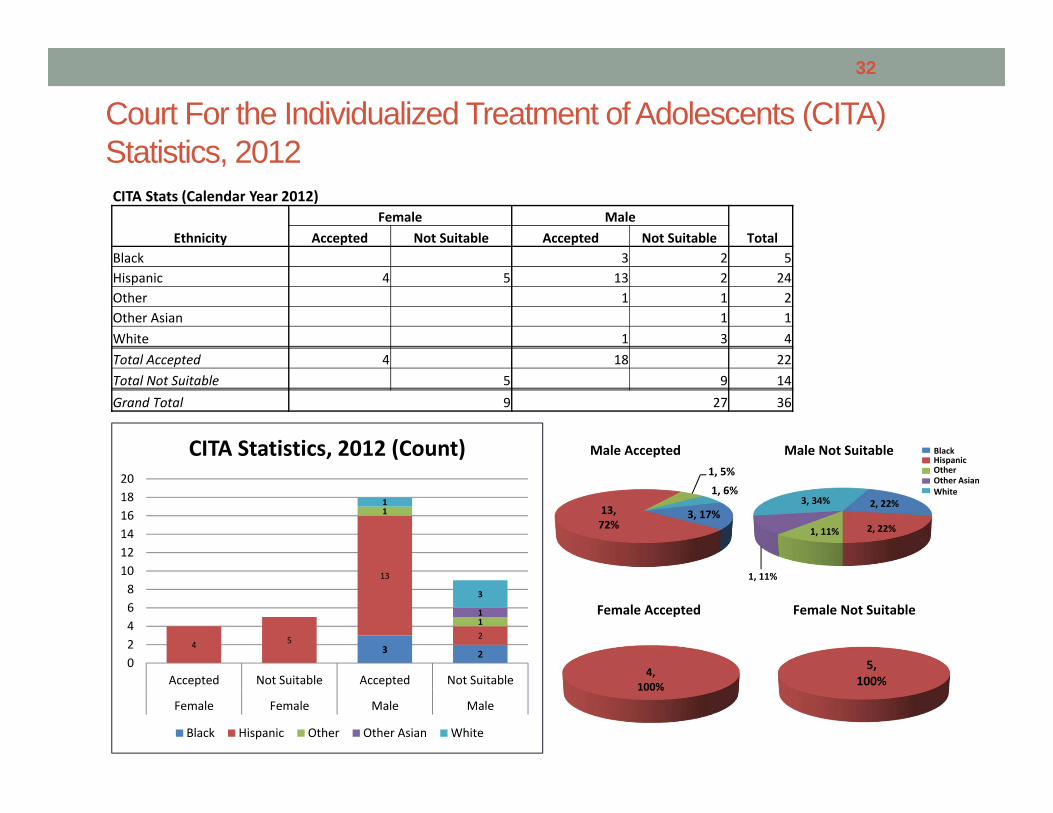
Court For the Individualized Treatment of Adolescents (CITA) Statistics, 2012CITA Stats (Calendar Year 2012)
EthnicityFemale Male
TotalAccepted Not Suitable Accepted Not SuitableBlack 3 2 5Hispanic 4 5 13 2 24Other 1 1 2Other Asian 1 1White 1 3 4Total Accepted 4 18 22Total Not Suitable 5 9 14Grand Total 9 27 36
32
3 24 5
13
2
1
11
1
3
02468
101214161820
Accepted Not Suitable Accepted Not Suitable
Female Female Male Male
CITA Statistics, 2012 (Count)
Black Hispanic Other Other Asian White
3, 17%13, 72%
1, 5%
1, 6%
Male Accepted
4, 100%
Female Accepted
5, 100%
Female Not Suitable
2, 22%
2, 22%1, 11%
1, 11%
3, 34%
Male Not Suitable
Other Asian
BlackHispanicOther
White
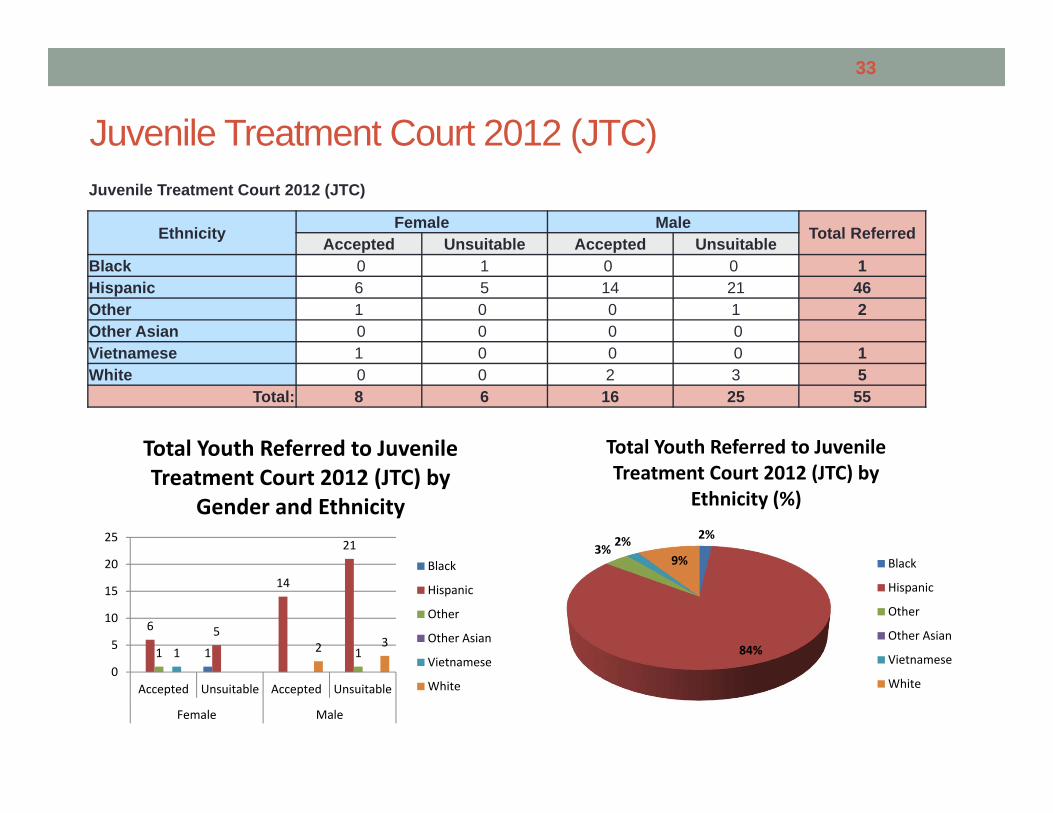
Juvenile Treatment Court 2012 (JTC)Juvenile Treatment Court 2012 (JTC)
Ethnicity Female Male Total ReferredAccepted Unsuitable Accepted UnsuitableBlack 0 1 0 0 1Hispanic 6 5 14 21 46Other 1 0 0 1 2Other Asian 0 0 0 0Vietnamese 1 0 0 0 1White 0 0 2 3 5
Total: 8 6 16 25 55
33
1
6 5
14
21
1 11 2 3
0
5
10
15
20
25
Accepted Unsuitable Accepted Unsuitable
Female Male
Total Youth Referred to Juvenile Treatment Court 2012 (JTC) by
Gender and Ethnicity
Black
Hispanic
Other
Other Asian
Vietnamese
White
2%
84%
3% 2%9%
Total Youth Referred to Juvenile Treatment Court 2012 (JTC) by
Ethnicity (%)
Black
Hispanic
Other
Other Asian
Vietnamese
White
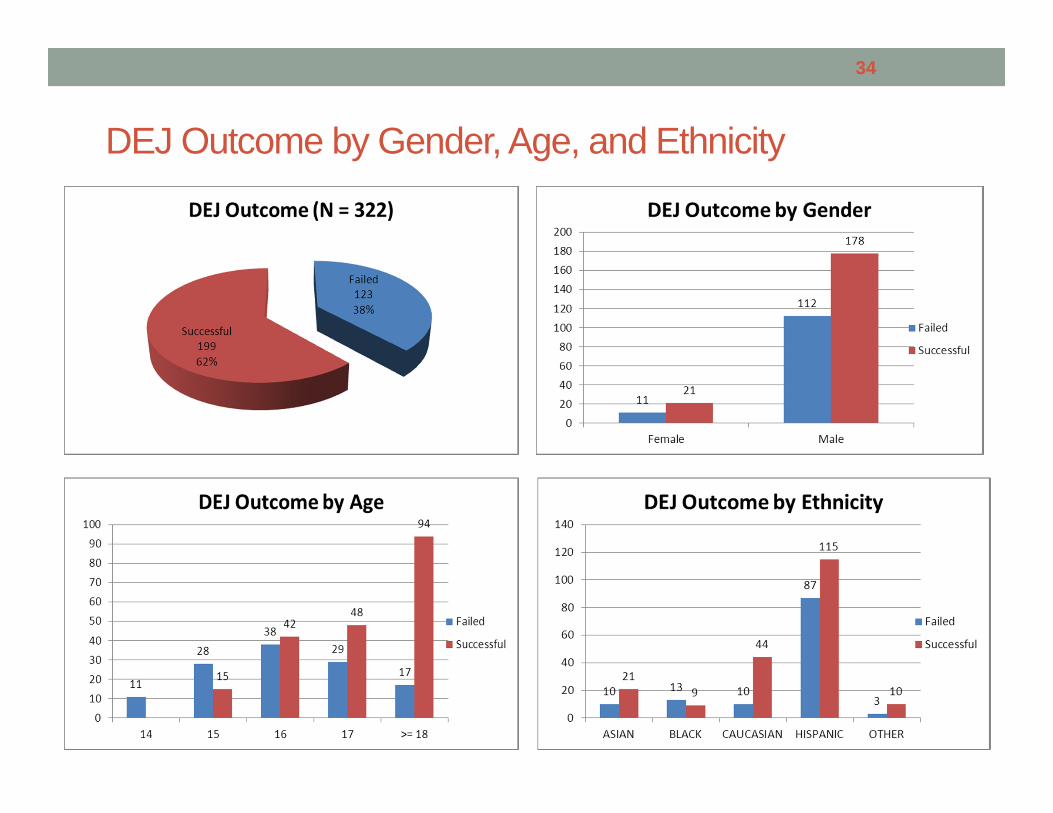
DEJ Outcome by Gender, Age, and Ethnicity
34
PUBLIC DEFENDER AND ALTERNATE PUBLIC DEFENDER STATISTICS (JUVENILE)
2012
35
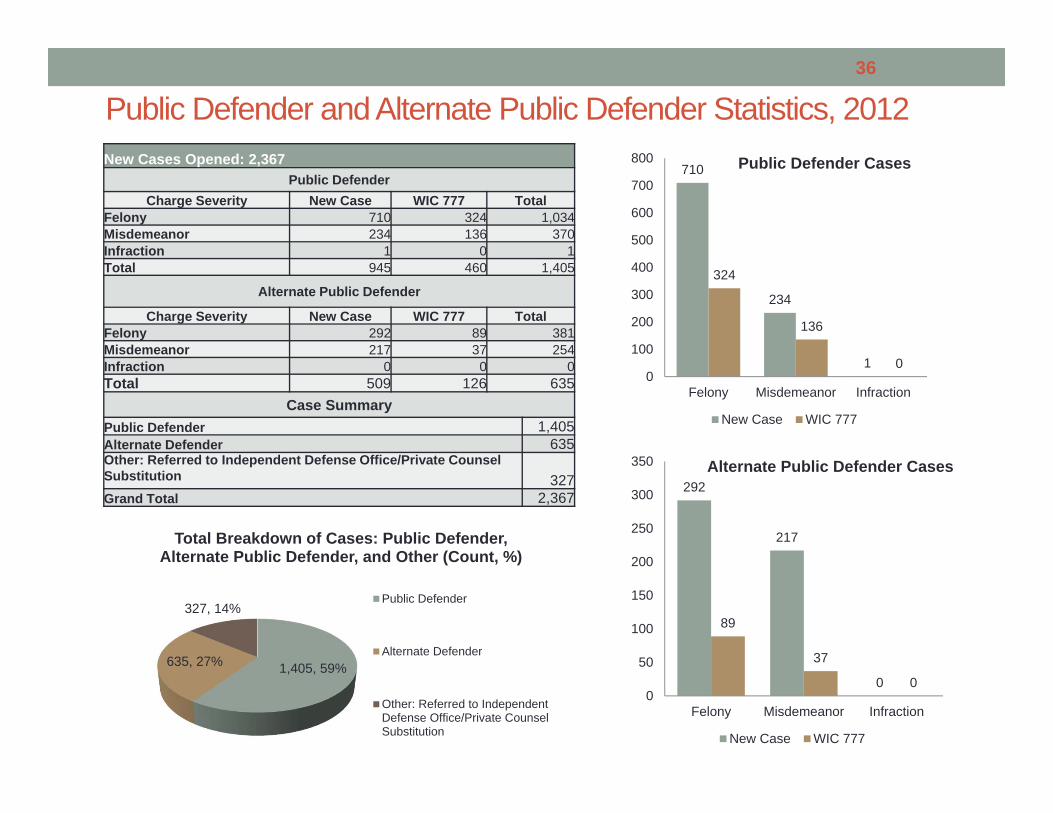
Public Defender and Alternate Public Defender Statistics, 2012New Cases Opened: 2,367
Public DefenderCharge Severity New Case WIC 777 Total
Felony 710 324 1,034Misdemeanor 234 136 370Infraction 1 0 1Total 945 460 1,405
Alternate Public Defender
Charge Severity New Case WIC 777 TotalFelony 292 89 381Misdemeanor 217 37 254Infraction 0 0 0Total 509 126 635
Case SummaryPublic Defender 1,405Alternate Defender 635Other: Referred to Independent Defense Office/Private Counsel Substitution 327Grand Total 2,367
36
710
234
1
324
136
00
100
200
300
400
500
600
700
800
Felony Misdemeanor Infraction
Public Defender Cases
New Case WIC 777
292
217
0
89
37
00
50
100
150
200
250
300
350
Felony Misdemeanor Infraction
Alternate Public Defender Cases
New Case WIC 777
1,405, 59%635, 27%
327, 14%
Total Breakdown of Cases: Public Defender, Alternate Public Defender, and Other (Count, %)
Public Defender
Alternate Defender
Other: Referred to IndependentDefense Office/Private CounselSubstitution
OUTCOMES FOR VICTIMS
2012
37
Outcomes for Victims
• Victim Services: Santa Clara County has several agencies (the YWCA, the Victim Witness Assistance Center and Probation Victim Services) that work with the District Attorney to serve victims in Juvenile Justice Court.
• Number of Victims Served: Approximately 661 Victims were served by Probation Victim Services in 2012.
• Victim Awareness: Approximately 900 youth offenders completed the victim awareness classes in 2012.
• DOR collected $428,676 in fiscal year 2012, for Juvenile Probation only.
38
DUALLY INVOLVED YOUTH
2012
39
241.1 Outcomes for Dually Involved Youth
40
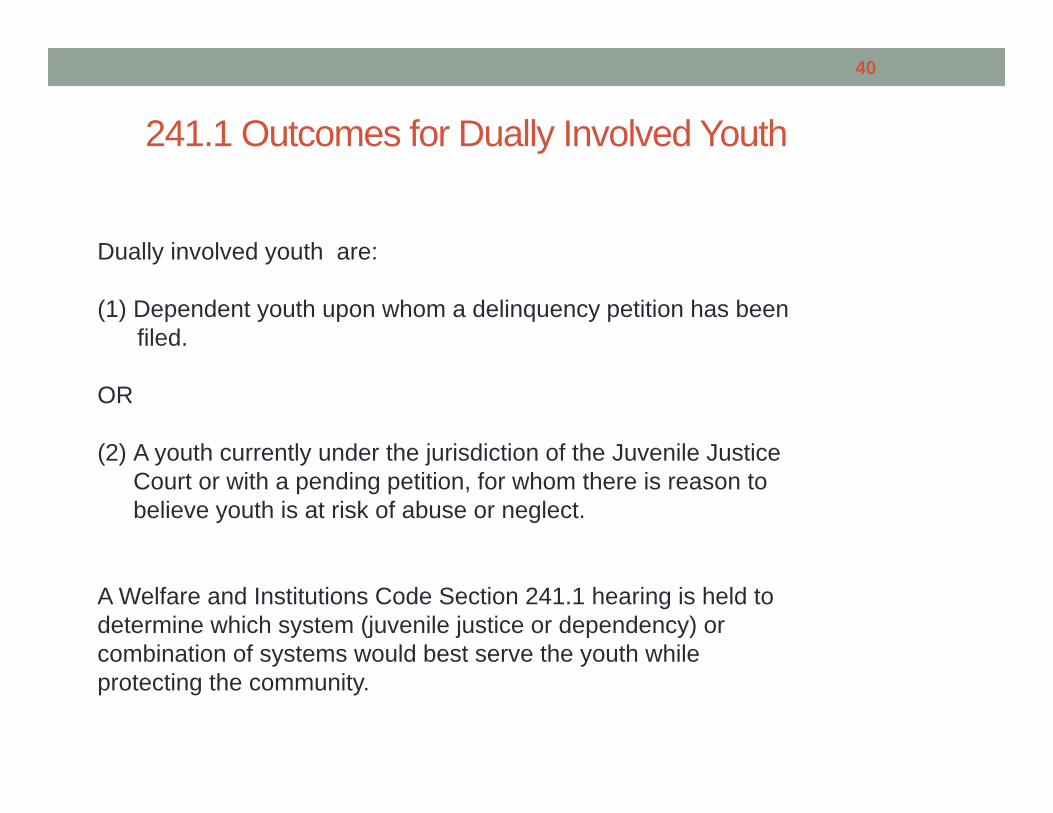
Dually involved youth are:
(1) Dependent youth upon whom a delinquency petition has beenfiled.
OR
(2) A youth currently under the jurisdiction of the Juvenile Justice Court or with a pending petition, for whom there is reason to believe youth is at risk of abuse or neglect.
A Welfare and Institutions Code Section 241.1 hearing is held to determine which system (juvenile justice or dependency) or combination of systems would best serve the youth while protecting the community.
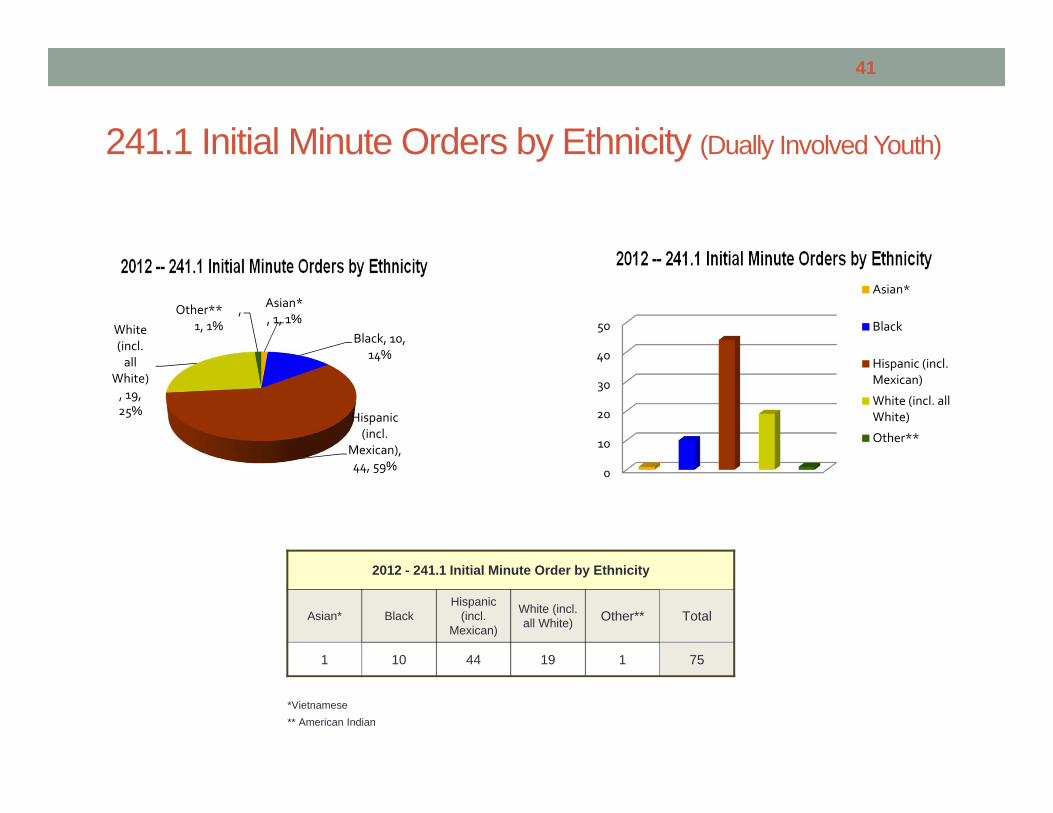
241.1 Initial Minute Orders by Ethnicity (Dually Involved Youth)
41
Asian* , 1, 1%
Black, 10, 14%
Hispanic (incl.
Mexican), 44, 59%
White (incl. all
White), 19, 25%
Other** , 1, 1%
0
10
20
30
40
50
Asian*
Black
Hispanic (incl.Mexican)
White (incl. allWhite)
Other**
2012 - 241.1 Initial Minute Order by Ethnicity
Asian* BlackHispanic
(incl. Mexican)
White (incl. all White) Other** Total
1 10 44 19 1 75
*Vietnamese** American Indian
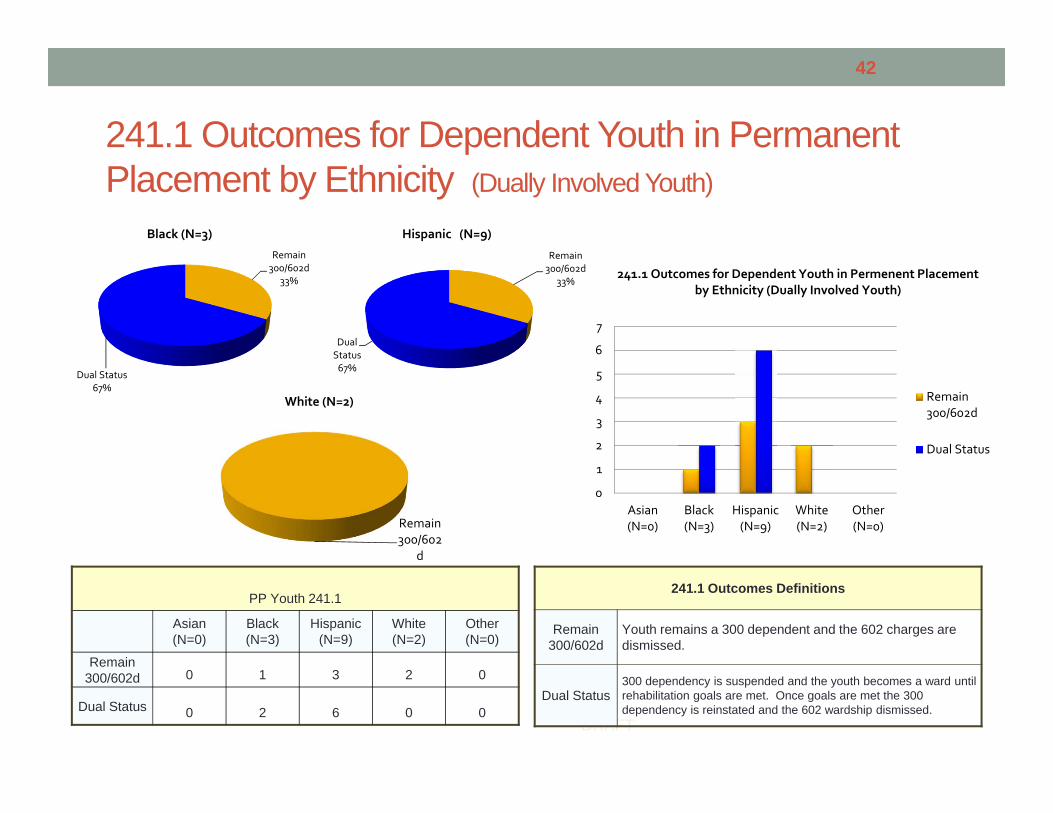
241.1 Outcomes for Dependent Youth in Permanent Placement by Ethnicity (Dually Involved Youth)
DRAFT
42
PP Youth 241.1
Asian (N=0)
Black (N=3)
Hispanic (N=9)
White (N=2)
Other (N=0)
Remain 300/602d 0 1 3 2 0
Dual Status 0 2 6 0 0
241.1 Outcomes Definitions
Remain 300/602d
Youth remains a 300 dependent and the 602 charges are dismissed.
Dual Status300 dependency is suspended and the youth becomes a ward until rehabilitation goals are met. Once goals are met the 300 dependency is reinstated and the 602 wardship dismissed.
Remain 300/602d
33%
Dual Status67%
Black (N=3)
Remain 300/602d
33%
Dual Status67%
Hispanic (N=9)
Remain 300/602
d%
White (N=2)
0
1
2
3
4
5
6
7
Asian(N=0)
Black(N=3)
Hispanic(N=9)
White(N=2)
Other(N=0)
241.1 Outcomes for Dependent Youth in Permenent Placement by Ethnicity (Dually Involved Youth)
Remain300/602d
Dual Status
JUVENILE HALL & RANCHES POPULATION
2012
43
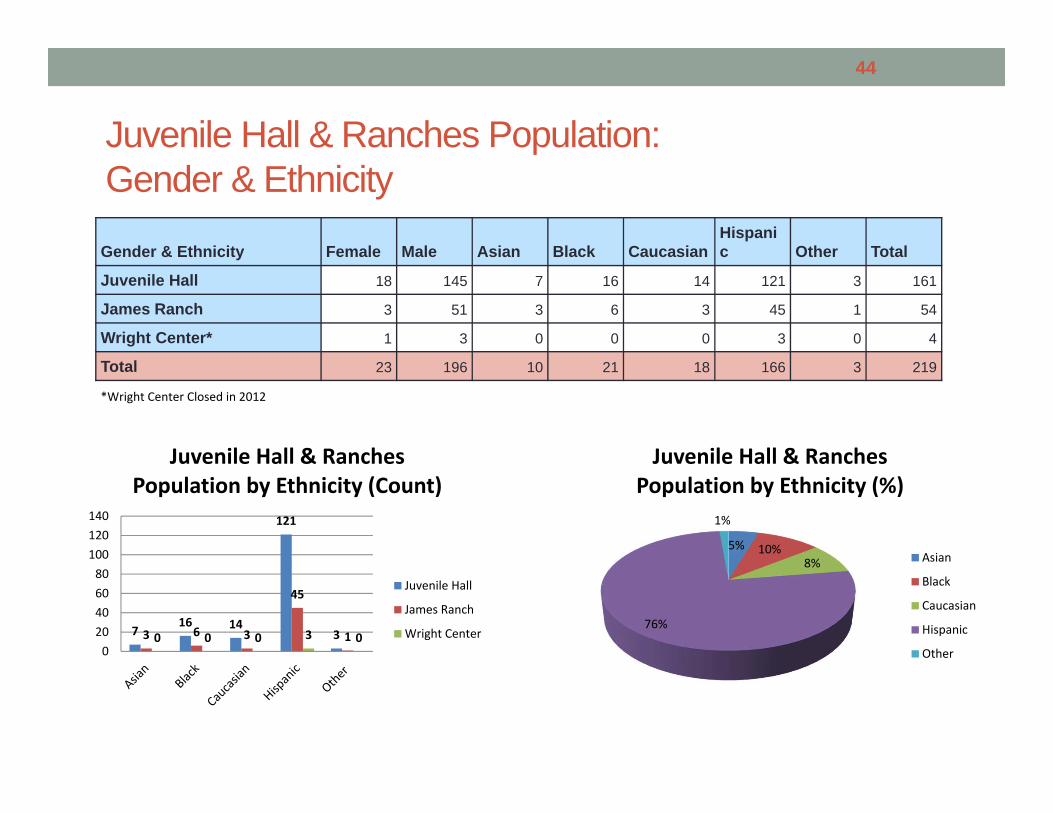
Juvenile Hall & Ranches Population: Gender & Ethnicity
Gender & Ethnicity Female Male Asian Black CaucasianHispanic Other Total
Juvenile Hall 18 145 7 16 14 121 3 161
James Ranch 3 51 3 6 3 45 1 54
Wright Center* 1 3 0 0 0 3 0 4
Total 23 196 10 21 18 166 3 219
*Wright Center Closed in 2012
44
716 14
121
33 6 3
45
10 0 0 3 0020406080
100120140
Juvenile Hall & Ranches Population by Ethnicity (Count)
Juvenile Hall
James Ranch
Wright Center
5% 10%8%
76%
1%
Juvenile Hall & Ranches Population by Ethnicity (%)
Asian
Black
Caucasian
Hispanic
Other
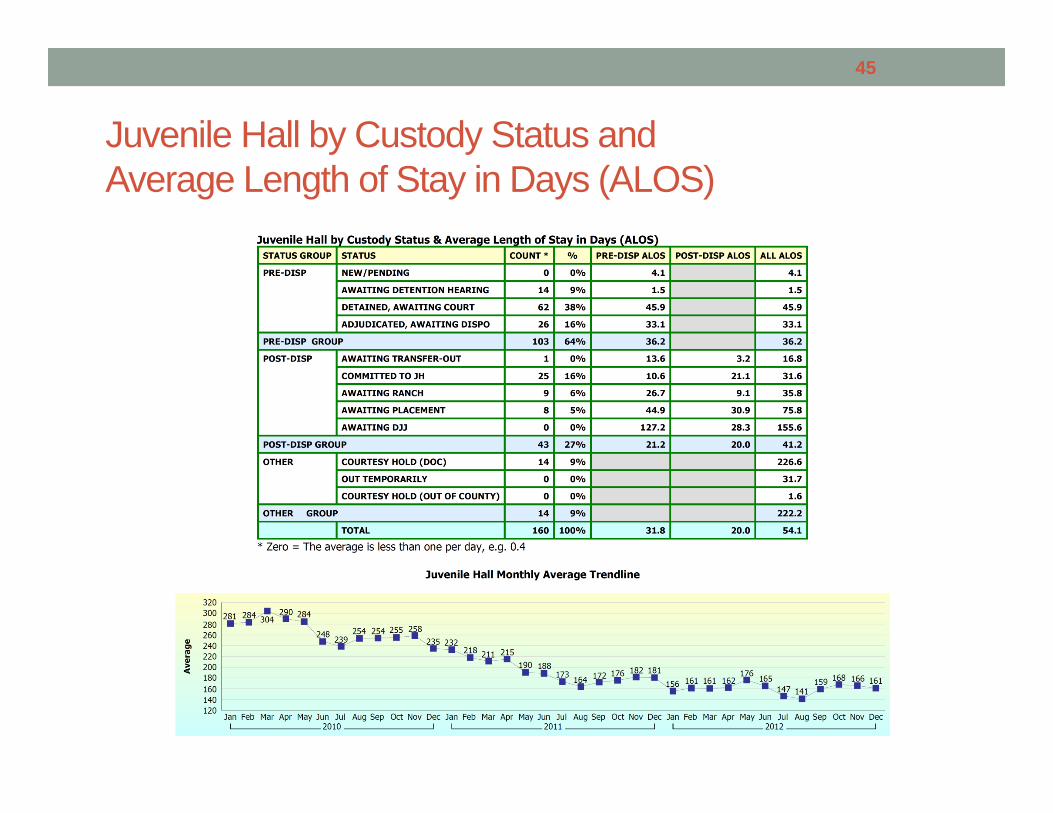
Juvenile Hall by Custody Status and Average Length of Stay in Days (ALOS)
45
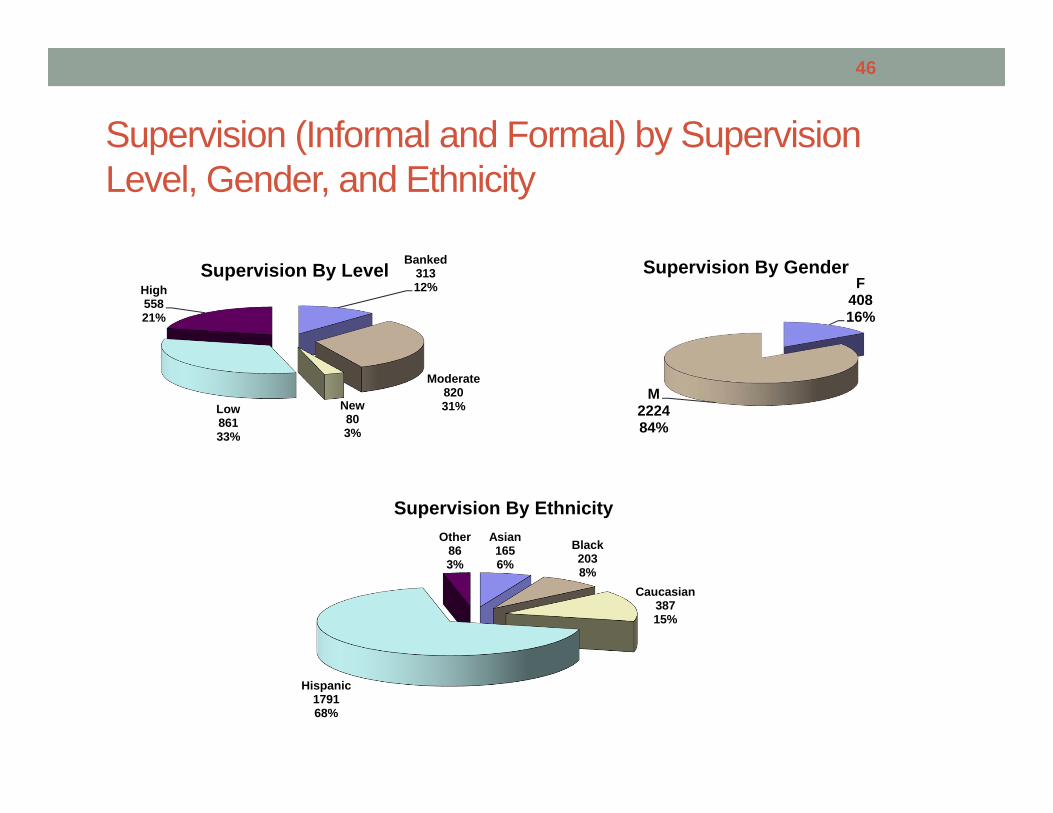
Supervision (Informal and Formal) by Supervision Level, Gender, and Ethnicity
46
Banked31312%
Moderate82031%New
803%
Low86133%
High55821%
Supervision By LevelF
40816%
M222484%
Supervision By Gender
Asian1656%
Black2038%
Caucasian38715%
Hispanic179168%
Other863%
Supervision By Ethnicity
47
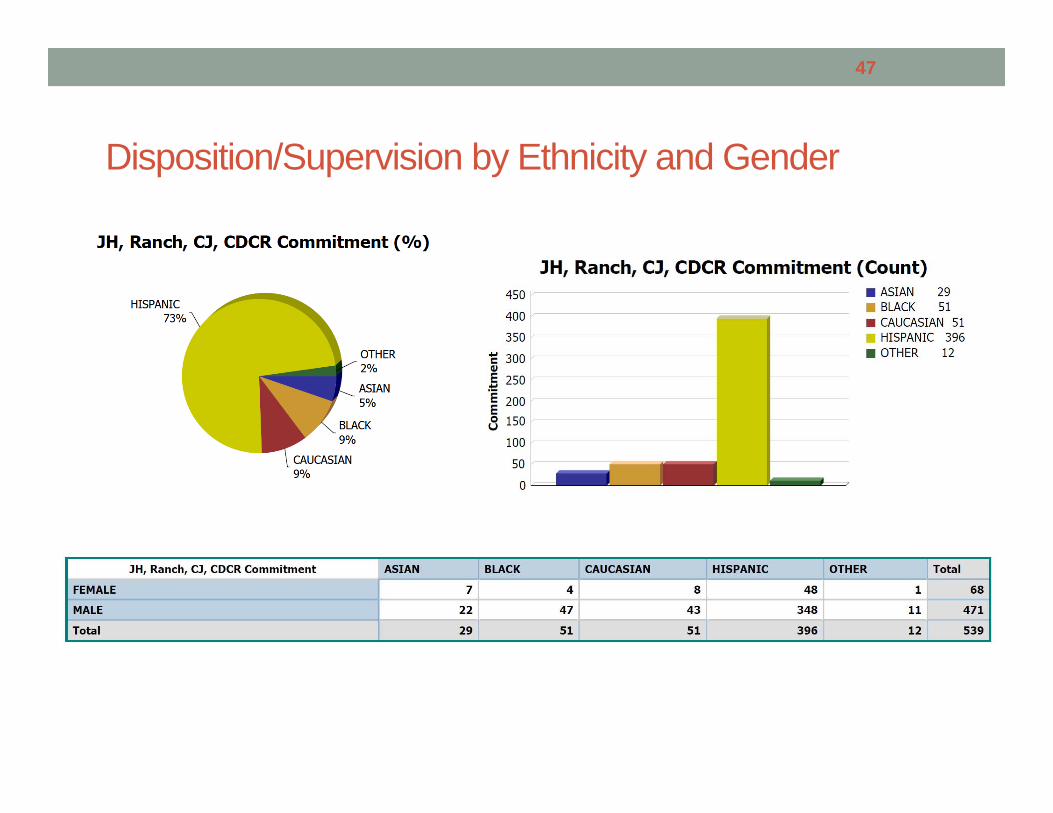
Disposition/Supervision by Ethnicity and Gender
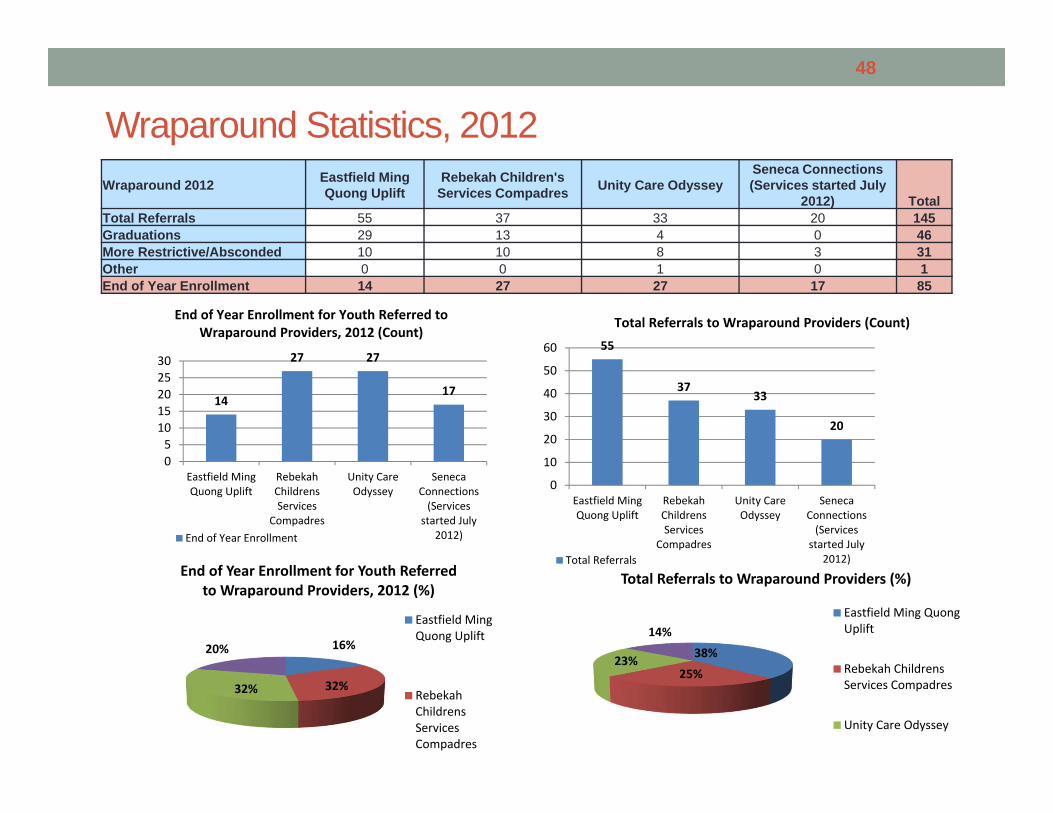
Wraparound Statistics, 2012Wraparound 2012 Eastfield Ming
Quong UpliftRebekah Children's
Services Compadres Unity Care OdysseySeneca Connections (Services started July
2012) TotalTotal Referrals 55 37 33 20 145Graduations 29 13 4 0 46More Restrictive/Absconded 10 10 8 3 31Other 0 0 1 0 1End of Year Enrollment 14 27 27 17 85
48
55
3733
20
0
10
20
30
40
50
60
Eastfield MingQuong Uplift
RebekahChildrensServices
Compadres
Unity CareOdyssey
SenecaConnections(Services
started July2012)
Total Referrals to Wraparound Providers (Count)
Total Referrals
14
27 27
17
05
1015202530
Eastfield MingQuong Uplift
RebekahChildrensServices
Compadres
Unity CareOdyssey
SenecaConnections(Services
started July2012)
End of Year Enrollment for Youth Referred to Wraparound Providers, 2012 (Count)
End of Year Enrollment
38%
25%23%
14%
Total Referrals to Wraparound Providers (%)
Eastfield Ming QuongUplift
Rebekah ChildrensServices Compadres
Unity Care Odyssey
16%
32%32%
20%
End of Year Enrollment for Youth Referred to Wraparound Providers, 2012 (%)
Eastfield MingQuong Uplift
RebekahChildrensServicesCompadres
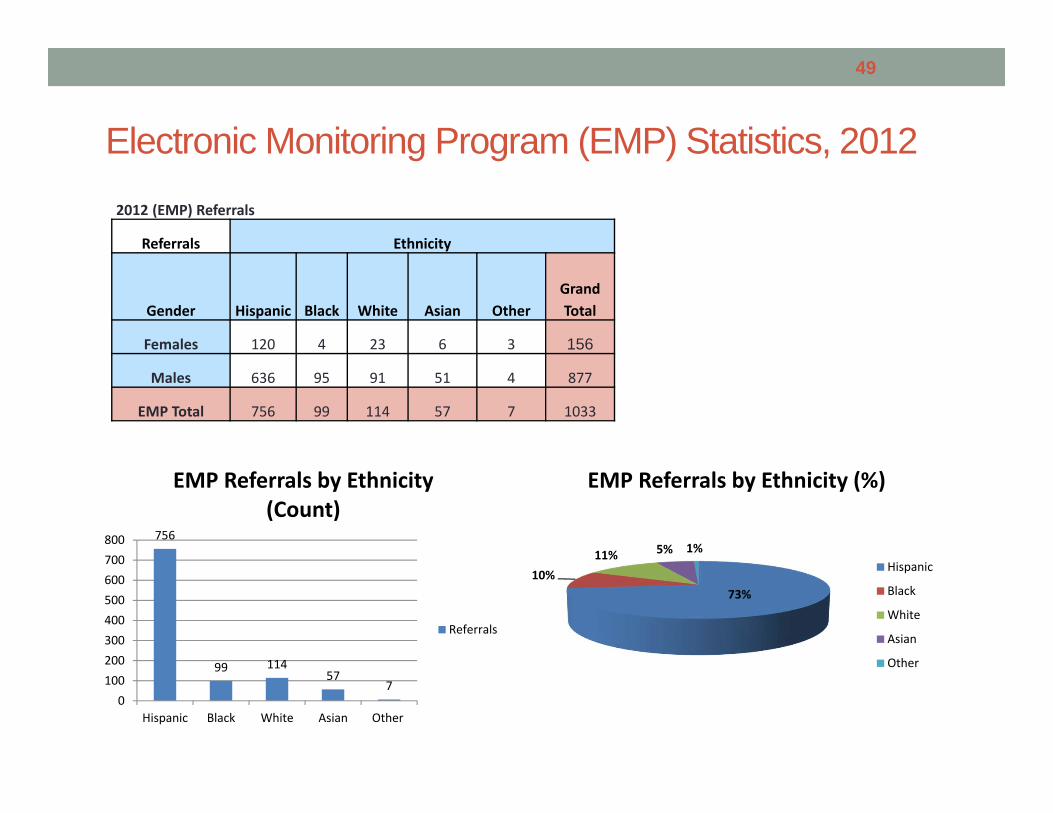
Electronic Monitoring Program (EMP) Statistics, 2012
49
2012 (EMP) Referrals
Referrals Ethnicity
Gender Hispanic Black White Asian Other Grand Total
Females 120 4 23 6 3 156
Males 636 95 91 51 4 877
EMP Total 756 99 114 57 7 1033
756
99 11457
70
100200300400500600700800
Hispanic Black White Asian Other
EMP Referrals by Ethnicity (Count)
Referrals
73%10%
11% 5% 1%
EMP Referrals by Ethnicity (%)
Hispanic
Black
White
Asian
Other
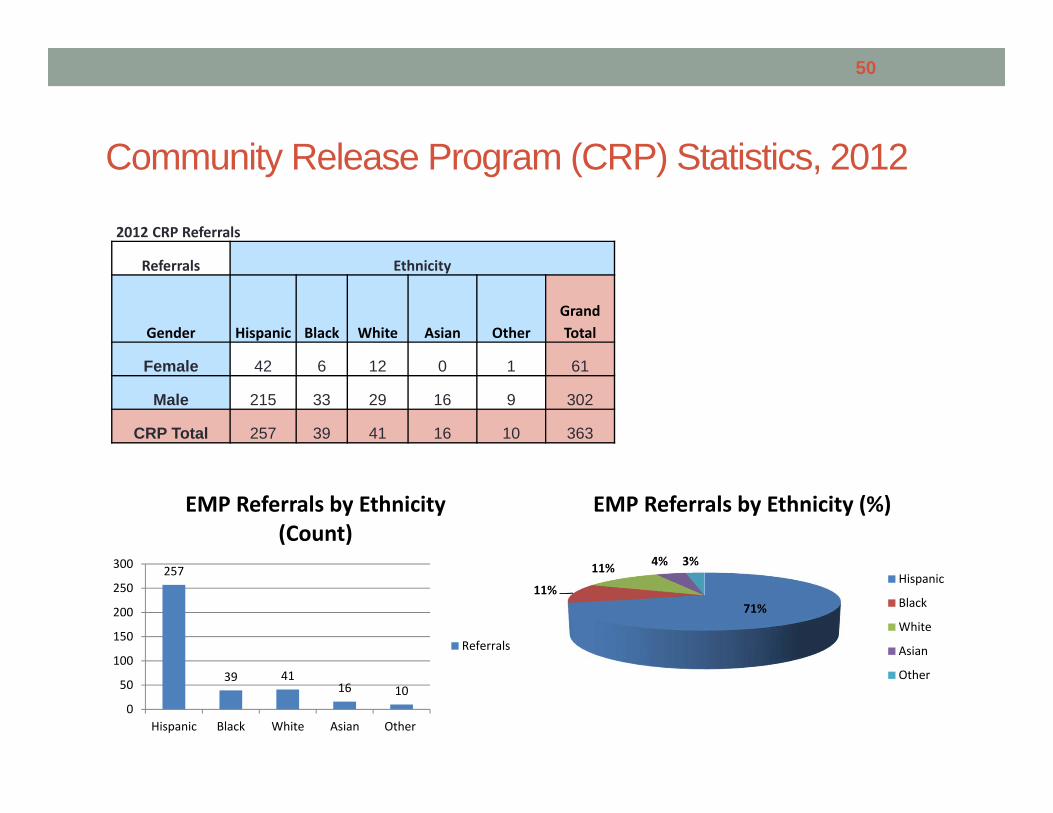
Community Release Program (CRP) Statistics, 2012
50
2012 CRP Referrals
Referrals Ethnicity
Gender Hispanic Black White Asian Other Grand Total
Female 42 6 12 0 1 61
Male 215 33 29 16 9 302
CRP Total 257 39 41 16 10 363
257
39 4116 10
0
50
100
150
200
250
300
Hispanic Black White Asian Other
EMP Referrals by Ethnicity (Count)
Referrals
71%11%
11% 4% 3%
EMP Referrals by Ethnicity (%)
Hispanic
Black
White
Asian
Other
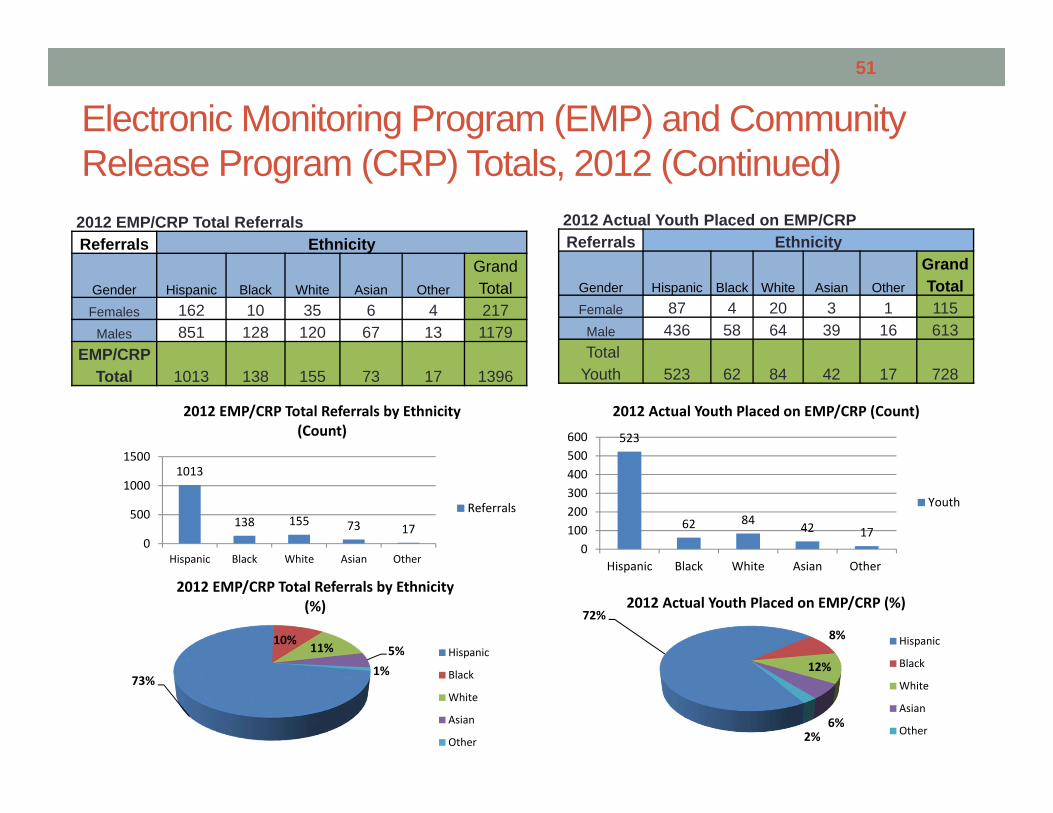
Electronic Monitoring Program (EMP) and Community Release Program (CRP) Totals, 2012 (Continued)
51
2012 EMP/CRP Total ReferralsReferrals Ethnicity
Gender Hispanic Black White Asian Other
Grand Total
Females 162 10 35 6 4 217Males 851 128 120 67 13 1179
EMP/CRP Total 1013 138 155 73 17 1396
1013
138 155 73 170
500
1000
1500
Hispanic Black White Asian Other
2012 EMP/CRP Total Referrals by Ethnicity (Count)
Referrals
73%
10% 11% 5%1%
2012 EMP/CRP Total Referrals by Ethnicity (%)
Hispanic
Black
White
Asian
Other
2012 Actual Youth Placed on EMP/CRPReferrals Ethnicity
Gender Hispanic Black White Asian Other
Grand Total
Female 87 4 20 3 1 115Male 436 58 64 39 16 613Total
Youth 523 62 84 42 17 728
523
62 84 42 170
100200300400500600
Hispanic Black White Asian Other
2012 Actual Youth Placed on EMP/CRP (Count)
Youth
72%8%
12%
6%2%
2012 Actual Youth Placed on EMP/CRP (%)
Hispanic
Black
White
Asian
Other
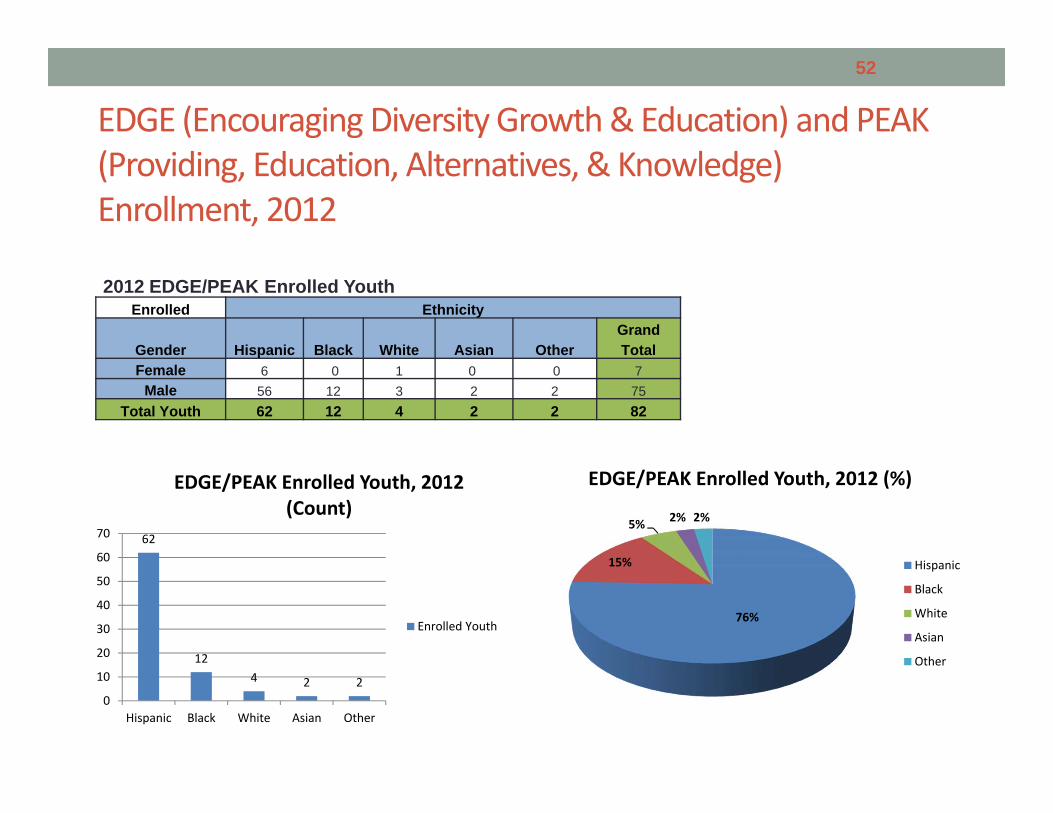
EDGE (Encouraging Diversity Growth & Education) and PEAK (Providing, Education, Alternatives, & Knowledge) Enrollment, 2012
52
2012 EDGE/PEAK Enrolled YouthEnrolled Ethnicity
Gender Hispanic Black White Asian OtherGrand Total
Female 6 0 1 0 0 7Male 56 12 3 2 2 75
Total Youth 62 12 4 2 2 82
62
124 2 2
0
10
20
30
40
50
60
70
Hispanic Black White Asian Other
EDGE/PEAK Enrolled Youth, 2012 (Count)
Enrolled Youth76%
15%
5% 2% 2%
EDGE/PEAK Enrolled Youth, 2012 (%)
Hispanic
Black
White
Asian
Other
MENTAL HEALTH DEPARTMENT COMPETENCY RESTORATION PROGRAM STATISTICS
2012
53
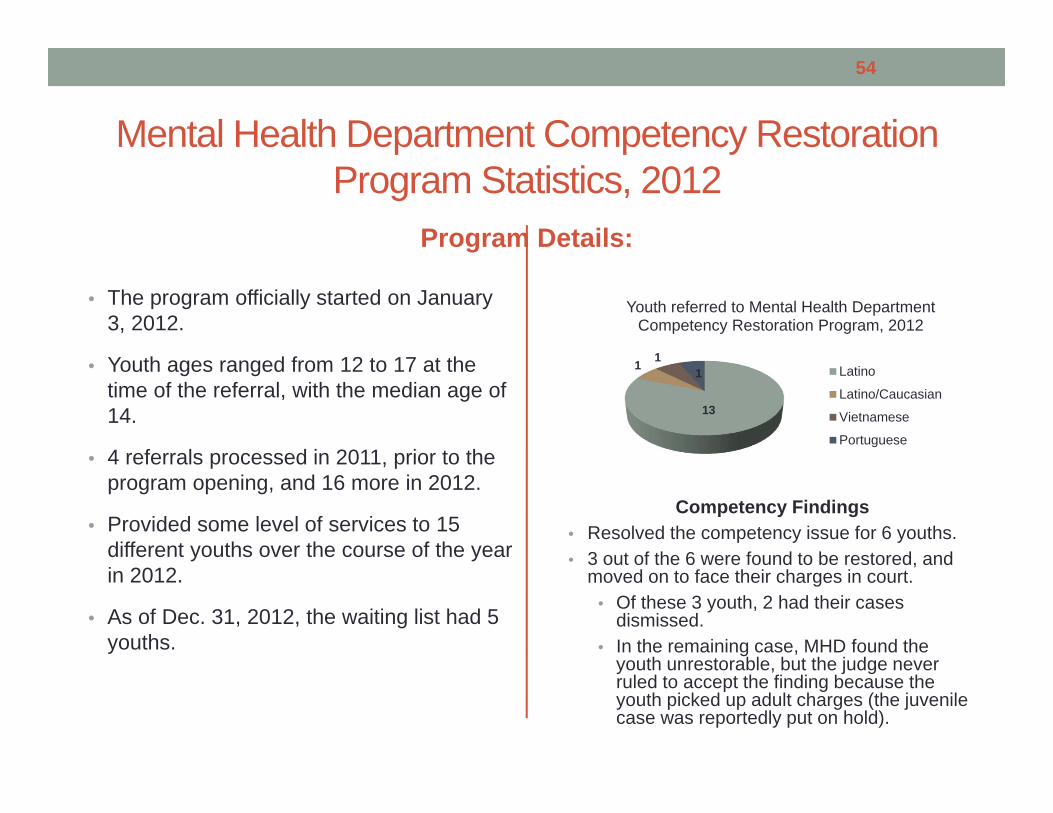
Mental Health Department Competency Restoration Program Statistics, 2012
Program Details:
Competency Findings• Resolved the competency issue for 6 youths. • 3 out of the 6 were found to be restored, and
moved on to face their charges in court.• Of these 3 youth, 2 had their cases
dismissed. • In the remaining case, MHD found the
youth unrestorable, but the judge never ruled to accept the finding because the youth picked up adult charges (the juvenile case was reportedly put on hold).
• The program officially started on January 3, 2012.
• Youth ages ranged from 12 to 17 at the time of the referral, with the median age of 14.
• 4 referrals processed in 2011, prior to the program opening, and 16 more in 2012.
• Provided some level of services to 15 different youths over the course of the year in 2012.
• As of Dec. 31, 2012, the waiting list had 5 youths.
54
13
1 11
Youth referred to Mental Health Department Competency Restoration Program, 2012
Latino
Latino/Caucasian
Vietnamese
Portuguese